Introduction to Ensembles: Forecasting Hurricane Sandy
Table of Contents
October 20
Transit
Today, when I arrived on the watch floor, I received an OTSR (optimal track ship routing) request for service from the skipper of the USNS Apache, one of Military Sealift Command's four Fleet Ocean Tugs. My name is AG2 Shepherd and I'm an apprentice ship router with the U.S. Navy.
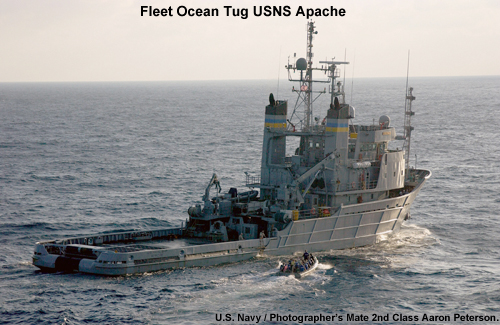
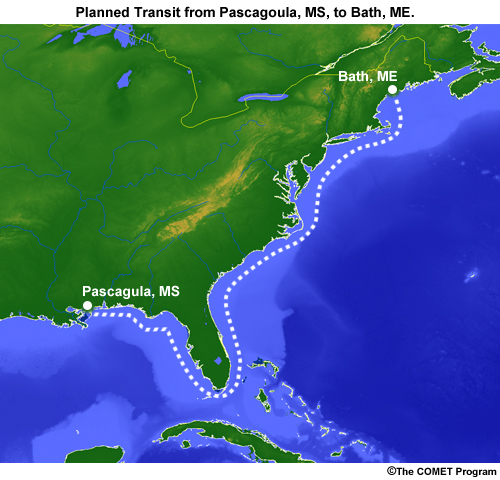
The skipper is tasked with towing a barge from the shipyard in Pascagoula, Mississippi, to one in Bath, Maine. He wants to leave 23 October. The transit is about 2500 miles long. At 10 knots, it will take about 10 days to complete.
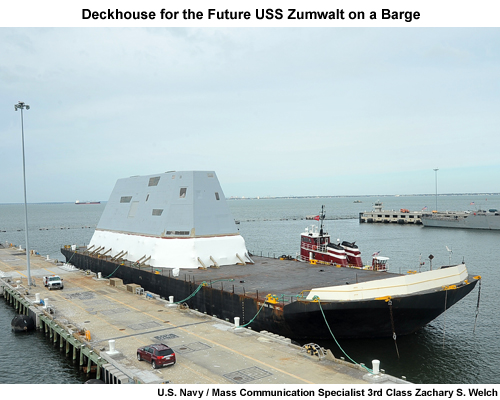
The barge will be loaded with the superstructure for a new guided missile destroyer.
I have an apprentice forecaster who entered the movement report request, or MOVREP, into the Joint Metoc Viewer.
Departure: 2012-10-23 Pascagoula, Mississippi
Arrival: 2012-11-2 Bath, Maine
Limits:
Wind: 20 kt
Seas: bow: 8 ft / beam: 8 ft / stern: 8 ft
Speed: 10 kt
The limits are rather conservative, but the superstructure is 60 feet tall, offering ample sail area for any strong wind. And while the tug can take a beating, the barge isn't made to take large seas from any direction. This will be a long, slow transit.
Current Conditions
Satellite
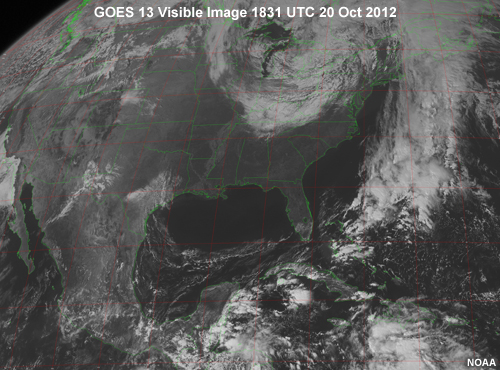
Current conditions are absolutely beautiful. Clear skies across the Gulf of Mexico and up the East Coast. If they could be there tomorrow, I'd send them on their way, but it's 2500 miles from Pascagoula to Bath. With a 10 day transit, that's where I come in. As a ship router, I'm expected to make medium to long range forecasts, 3 to 5 days or more, and keep ships out of harm's way.
- Current conditions: Clear skies across the Gulf of Mexico and up the East Coast
- Ship router:
- Make medium to long range forecasts
- Keep ships out of harm's way
500 mb Heights
A quick look at the 500 mb heights shows a low centered over the Great Lakes with a trough extending south to the Gulf. The trough is progressive and should move out quickly to be replaced by a ridge. Looks like nice weather coming.
A broad trough looks to be approaching the West Coast on day 4; something to keep an eye on for now.
- 500 mb heights
- Low centered over the Great Lakes
- Trough extending south to the Gulf
- Trough should move out quickly
- Broad trough approaching West Coast on day 4
250 mb Heights
A look at the 250 mb heights shows a trough and associated jet leaving the Southeast with another coming ashore on the West Coast on Day 4.
- 250 mb heights
- Trough and jet leaving the Southeast
- Another coming ashore on the West Coast on Day 4
MSLP
MSLP charts show the surface low currently over the Great Lakes lifting out to the northeast over the next couple of days. At the same time, high pressure builds over the Southeast.
Looking further down the line, the disturbance at 500 mb is accompanied by a surface cyclone emerging onto the Great Plains on day 5. So far it looks like it will stay to our north, but we'll have to keep an eye out to see how this develops. If we need to, we can delay the transit in Miami.
I get on the phone to the skipper. He asks me, "What are the odds that your model is wrong and I get slammed out there in the Gulf? Last time I scheduled a transit, I had to delay at the last second because the forecaster chose the wrong model to trust."
- Surface low over the Great Lakes lifts out to the northeast
- High pressure builds over the Southeast
- Surface cyclone emerging onto the Great Plains on day 5
- Looks like it will stay north
- Can delay the transit in Miami
- "What are the odds that your model is wrong and I get slammed out there in the Gulf?"
Probability
What are the odds? How sure are you? How likely is that? We hear these questions all the time. With those questions ringing in my ears, I start digging deeper.
First, I check other models.
I have access to several models, but tend to limit my views to models provided by the Navy's FNMOC (NOGAPS and COAMPS) and NOAA's NCEP (GFS and the NAM). If they all agree, then I figure that the odds are pretty good that they're right, at least for the short term. The trouble is, the models don't always agree, and they inevitably start to diverge after a couple of days.
Our senior ship router has been after me to start using model ensembles in my forecast. He says that they'll help me answer questions like, "What are the odds?" I go back to my work station and start looking for ensembles.
The first stage of the transit is from Pascagoula to Miami: about 900 miles, or about 3 days. If the tug departs the morning of the 23nd, they should arrive on the 26th. At my work station I find the NOGAPS ensemble, along with a couple of others. NOGAPS is familiar, so I choose it. Looking at winds and seas, I select the "Mean and Spread." That ought to tell me if there's anything wrong with my forecast.
- What are the odds?
- How sure are you?
- How likely is that?
- First, I check other models
- If they all agree, then the odds are pretty good that they're right, at least for the short term
- The models don't always agree
- Start to diverge after a couple of days
- Start using model ensembles in my forecast
- Will help answer questions like, "What are the odds?"
- Find the NOGAPS ensemble
- Looking at winds and seas, select the "Mean and Spread"
To learn more see the lesson: What are Ensembles?
Lesson 1: What are Ensembles?
Surface Winds
First, winds. Our transit has a wind speed limit of 20 kt, due to the high sail area of the load on the barge.
- First, winds
- Transit has a wind speed limit of 20 kt, due to the high sail area of the load on the barge
Please click the tabs above the image to view and answer the Questions.
To learn more see the lesson on Ensemble Statistics.
Mean/Spread of 10 m Winds
Question 1
Looking at the route from Pascagoula, MS to Miami, FL: What is the highest Mean wind predicted by the NOGAPS ensemble? (Choose the best answer.)
The correct answer is (d) 15-20 kt at 12z 24 October. This value comes from looking at the contours, not the shading. On 24 October, the route lies close to the 15 kt contour.
Question 2
What is the maximum spread (or potential error) along the transit in the Gulf of Mexico? (Choose the best answer.)
The correct answer is (b) 2-4 kt. In the chart, the spread is shown with color shading. Generally, the spread is < 2 kt, but on a couple of occasions, it rises to the range of 2-3 kt.
To learn more see the lesson on Ensemble Statistics.
Waves
A similar examination of the ensemble mean wave heights shows that waves should stay well below the 8-foot limits for the transit.
So far, so good. I issue the OTSR Route Recommendation and move on to other shift work.
- Ensemble mean wave heights
- Waves should stay well below the 8-foot limits
- I issue the OTSR Route Recommendation
October 22
The barge is loaded and ready for the transit. With less than 24 hours to departure, it's time to check the forecast and update the ship routing as needed.
- The barge is loaded and ready
- Time to check the forecast and update the ship routing
Current Conditions
Satellite
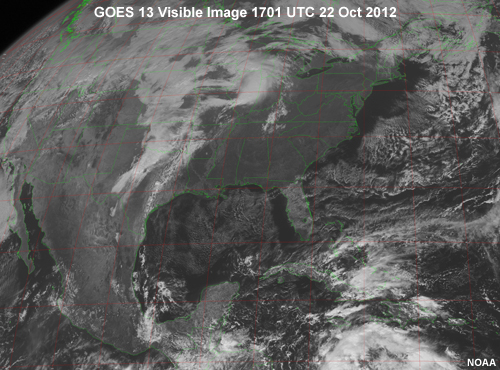
The satellite images show it's still clear over the Southeast.
- Still clear over the Southeast
Analysis
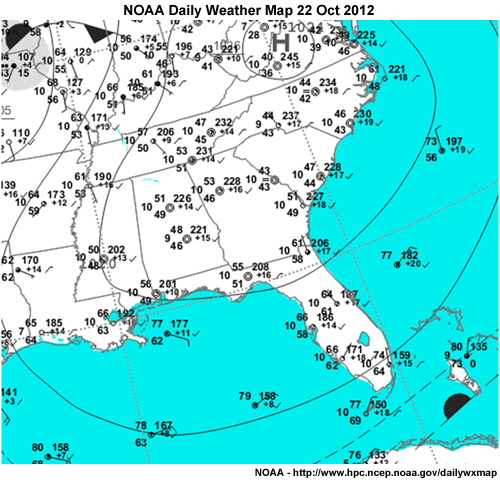
The NOAA Weather Map show high pressure over the Southeast, with clear skies and light winds.
- High pressure over the Southeast
- Clear skies and light winds
Forecast: MSLP
But, after a quick look at the GFS MSLP, I can tell that everything has changed.
I called the tug skipper to let him there was trouble brewing and that he would likely have to sit tight. He wasn't happy. Then I sat down with my senior ship router to understand the developing weather.
- After a quick look at the GFS MSLP
- Everything has changed.
- Called the tug skipper
- Trouble brewing
- Would likely have to sit tight
- He wasn't happy
Please click the tab above the image to view and answer the Question.
GFS MSLP
Question
What did the forecaster see that changed her mind? (Choose the best answer.)
The correct answer is (d) a tropical cyclone is forming in the Caribbean and is progged to move north to the east coast of Florida. Meanwhile, there's still a trough sweeping across the Midwest.
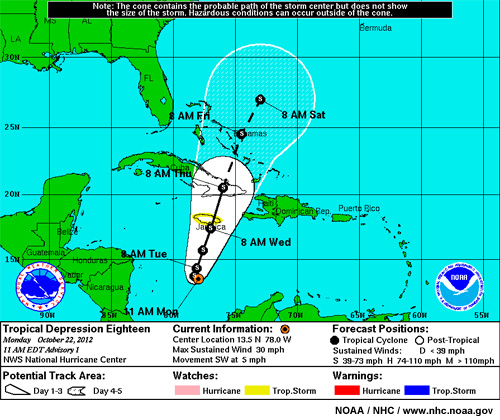
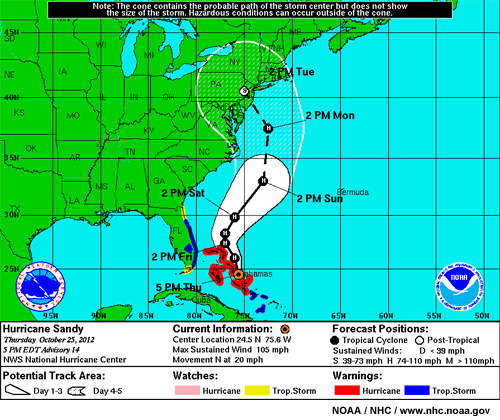
National Hurricane Center
The National Hurricane Center expects the storm, first named tropical depression 18, now named Sandy, to track northward over Jamaica and Cuba in the coming days. The NHC forecast puts the storm over the Bahamas on Friday, 26 October, right when the tug would be passing Miami. But the tug may be able to depart Mississippi and follow behind the storm.
- The National Hurricane Center
- First named tropical depression 18
- Now named Sandy
- Track northward over Jamaica and Cuba
- Over the Bahamas on Friday, 26 October
- Tug may be able to depart MS and follow behind the storm
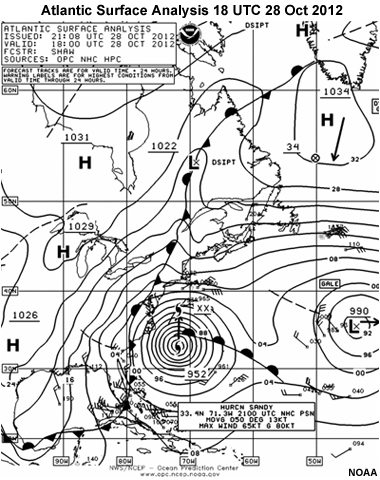
Weather Discussion
TROPICAL STORM SANDY ADVISORY NUMBER 2
NWS NATIONAL HURRICANE CENTER MIAMI FL AL182012
500 PM EDT MON OCT 22 2012
...DEPRESSION STRENGTHENS INTO TROPICAL STORM SANDY...
DISCUSSION AND 48-HOUR OUTLOOK
------------------------------
AT 500 PM EDT...2100 UTC...THE CENTER OF TROPICAL STORM SANDY WAS LOCATED NEAR LATITUDE 12.5 NORTH...LONGITUDE 78.5 WEST. SANDY IS NEARLY STATIONARY...BUT A MOTION TOWARD THE NORTH AND NORTH- NORTHEAST IS EXPECTED DURING THE NEXT COUPLE OF DAYS. ON THE FORECAST TRACK...THE CENTER WILL BE NEAR OR OVER JAMAICA ON WEDNESDAY.
REPORTS FROM AN AIR FORCE HURRICANE HUNTER PLANE INDICATE THAT THE MAXIMUM SUSTAINED WINDS HAVE INCREASED TO NEAR 40 MPH...65 KM/H...WITH HIGHER GUSTS. ADDITIONAL STRENGTHENING IS FORECAST DURING THE NEXT 48 HOURS...AND SANDY COULD BE NEAR HURRICANE STRENGTH WHEN IT APPROACHES JAMAICA.
TROPICAL STORM FORCE WINDS EXTEND OUTWARD UP TO 70 MILES...110 KM FROM THE CENTER.
THE MINIMUM CENTRAL PRESSURE REPORTED BY AN AIR FORCE HURRICANE HUNTER AIRCRAFT IS 999 MB...29.50 INCHES.
NOAA / NWS / NHC
5-day Track Forecast
Ensemble Forecast
TC Tracks
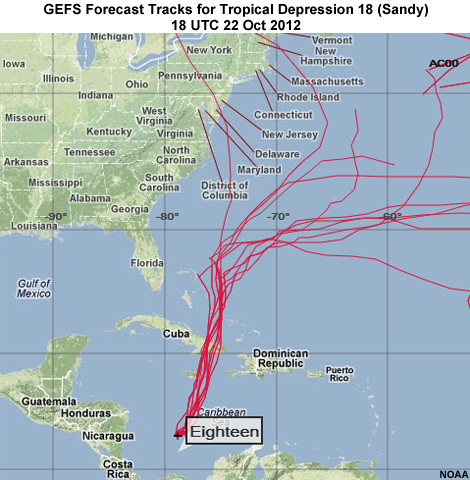
We all know that with long lead times, Sandy could go almost anywhere. I decide to look at the ensembles to check out the range of forecast possibilities.
First, I jump to the chase and look at the cyclone tracks for the NOAA Global Ensemble Forecast System, or GEFS.
Most of the tracks rapidly recurve offshore. That's good.
- Sandy could go almost anywhere
- Look at the ensembles to check out the range of forecast possibilities.
- Cyclone tracks for the NOAA Global Ensemble Forecast System, or GEFS
- Most of the tracks rapidly recurve offshore.
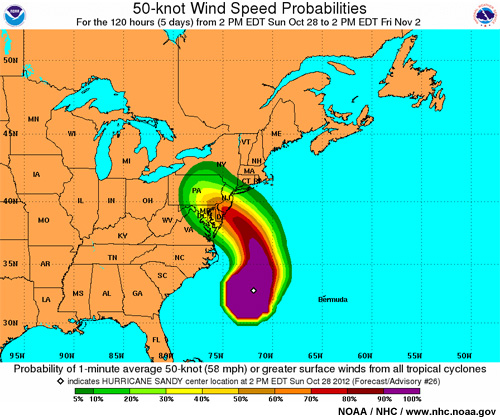
Wind Probability
Let's see what the ensembles think this will do to the wind and waves.
On the Joint Metoc Viewer, I pull up winds for the current model run. This time, instead of looking at the mean wind, I look at the probability that winds will exceed the 20 kt limit for the transit. When the tug skipper questions my forecast, I'll have answers.
- See what the ensembles think this will do to the wind and waves
- Probability that winds will exceed the 20 kt limit
Please click the tab above the image to view and answer the Question.
Prob 10 m Wind > 20 kt
Question
This image loop shows the probability that 10-meter winds will exceed the 20kt limit for the transit. Assuming that the tug captain with a billion dollar load is risk averse, when is the earliest he could arrive at Miami? (Choose the best answer.)
The correct answer is (d) Oct 30. Even on the 29th, there is a 40-50% probability that winds will exceed 20kt.
Wave Probability
I examine the probability that the significant wave height will exceed 8 feet and see that it surpasses 50% probability for small parts of the Gulf over the forecast period. Unfortunately, those small regions lie close to the transit route.
- Probability that significant wave height will exceed 8 feet surpasses 50% probability for small parts of the Gulf
- Those small regions lie close to the transit
Bias Correction
My Senior Ship Router reminded me that when using probabilities of exceedance, we need to remember that these probabilities are affected by model bias. If the winds and waves have a high forecast bias, transits may be unnecessarily canceled or delayed. With a low bias, our chance of exceeding limits is higher than we predicted. That could result in loss of assets and potentially, human casualties.
- When using probabilities of exceedance:
- probabilities are affected by model bias
- If the winds and waves have a high forecast bias
- transits may be unnecessarily canceled or delayed
- With a low bias
- chance of exceeding limits is higher than we predicted
Please click the tab above the image to view and answer the Question.
To learn more, see the Lesson on Bias Correction.
Ensemble Error
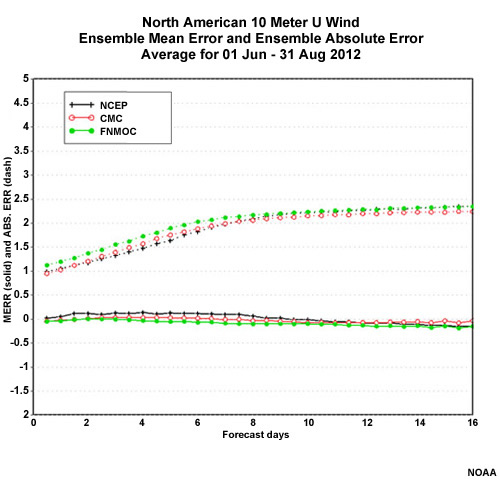
Question
Biases, also called the Mean Error, are calculated over a period of time, typically a season. This graphic shows the bias over the preceding summer, the latest statistics available for this transit. Over a 10-day forecast period, will the bias significantly alter our forecast? (Choose the best answer.)
The correct answer is (b) No. In looking at the summer 2012 season wind bias below, we can see that the bias turned out to be about one-tenth (1/10) of a knot, a small fraction of the total wind error.
To learn more, see the Lesson on Bias Correction.
Automated Forecasts
Looking at the spread in the hurricane tracks over the next week, it struck me that the best forecast I could make for the longer periods, like a week or more, is probably the ensemble mean. And if that's true, why not just use the ensemble to make the forecast?
My Senior Ship Router must have wondered the same thing, because in a follow-up call she mentioned that the Canadians actually have deployed that very thing for their new day 6-7 forecasts. What will they think of next?!?!?
- Looking at the spread in the hurricane tracks
- Best forecast for the longer periods, like a week or more, is probably the ensemble mean
- Canadians have deployed that very thing for their day 6-7 forecasts
To learn more about what the Canadian Meteorological Center is doing to automate its day 6 and 7 forecasts, see the Lesson on CMC Automated Forecasting.
To learn more about what the Canadian Meteorological Center is doing to automate its day 6 and 7 forecasts, see the Lesson on CMC Automated Forecasting.
Satellite Update
As I watch the satellite loop of the storm growing by the hour, it's clear by now that the transit isn't leaving port for several days. I call the skipper to let him know.
- Transit isn't leaving port for several days
- I call the skipper to let him know
October 25
The media attention that Sandy is now receiving is staggering, despite the fact that the storm is only now over the Bahamas. At least the tug captain has stopped calling. There's no point in leaving port until he knows there will be a port to pull into at the other end.
There have been significant developments over the past 24 hours.
- The media attention is staggering
- Storm is only now over the Bahamas
- Tug captain has stopped calling
Tracks
Just 36 hours ago, the ensembles were having a difficult time settling on a consensus track. Some tracks recurved eastward, out to sea. Others made a sharp turn to the west with landfall on the East Coast. Unfortunately, landfall ranged from Chesapeake Bay to Nova Scotia. The most recent tracks have been bringing the storm ashore in the New York/New Jersey, but still with plenty of uncertainty. How do we make sense of that?
- 36 hours ago, the ensembles were having a difficult time settling on a consensus track
- Most recent tracks bring the storm ashore in NY/NJ
- Plenty of uncertainty
Synoptic Setting
It appears that much of the uncertainty with Sandy's track and intensity arise from the synoptic setting and the interaction with the longwave trough expected to arrive in the East Coast later this week. This is what the National Hurricane Center had to say:
- Uncertainty with Sandy's track and intensity
- Arises from interaction with longwave trough
Weather Discussion
NWS NATIONAL HURRICANE CENTER MIAMI FL AL182012
500 PM EDT THU OCT 25 2012
THE INITIAL MOTION ESTIMATE IS 360/17...AS SANDY HAS BEGUN TO ACCELERATE NORTHWARD DUE TO THE UPPER LOW. THE REASONING FOR THE TRACK FORECAST REMAINS LARGELY UNCHANGED. SANDY WILL BE PULLED NORTHWESTWARD AND SLOW DOWN ON FRIDAY WHILE IT INTERACTS WITH THE UPPER-LEVEL LOW. THEN A NORTH-NORTHEASTWARD ACCELERATION IS EXPECTED BY SATURDAY AS A LONGWAVE TROUGH MOVES INTO THE EASTERN UNITED STATES. MOST OF THE TRACK MODELS NOW SHOW A TURN BACK TOWARD THE NORTHWEST BY THE END OF THE PERIOD DUE TO SANDY INTERACTING WITH AN AMPLIFYING SHORTWAVE TROUGH OVER THE CAROLINAS AND MID-ATLANTIC STATES. HOWEVER...THERE REMAIN SOME SIGNIFICANT DIFFERENCES IN THE TIMING OF THIS INTERACTION...AS THE ECMWF (European Centre for Medium-Range Weather Forecasts) HAS SANDY FARTHER WEST AND INTERACTING WITH THE SHORTWAVE SOONER RELATIVE TO MOST OF THE REST OF THE GUIDANCE...WHICH SHOWS A WIDER TURN AND A TRACK FARTHER NORTH. THE NEW NHC FORECAST IS CLOSE TO THE PREVIOUS ONE...AND LIES ROUGHLY BETWEEN THE ECMWF AND THE GFS ENSEMBLE MEAN. REGARDLESS OF THE EXACT TRACK OF SANDY...IT IS LIKELY THAT SIGNIFICANT IMPACTS WILL BE FELT OVER PORTIONS OF THE U.S. EAST COAST THROUGH THE WEEKEND AND INTO EARLY NEXT WEEK.
NOTE THAT THE TROPICAL CYCLONE WIND SPEED PROBABILITIES ARE NOT DESIGNED TO HANDLE THE TYPE OF STRUCTURAL CHANGES ANTICIPATED WITH SANDY DURING THE FORECAST PERIOD. AS A RESULT...THESE PROBABILITIES WILL UNDERESTIMATE THE ACTUAL RISK OF STRONG WINDS AWAY FROM THE CENTER OF SANDY.
NOAA / NWS / NHC
5-day Track Forecast
500 mb Mean/Spread
I sit down to figure out what is causing the wild variations in forecasts. After my last shift I talked with our senior ship router. He suggested I look at another ensemble that we have available on the JMV. NUOPC (National Unified Operational Prediction Capability) is an ensemble that combines the Fleet Numerical's NOGAPS ensemble with NOAA's GEFS. He told me that using 2 models and doubling the number of ensemble members decreases the error and improves the statistics. OK. I'll give it a shot.
- Figure out what is causing the wild variations in forecasts
- Another ensemble we have available
- NUOPC (National Unified Operational Prediction Capability)
- Fleet Numerical's NOGAPS ensemble
- NOAA's GEFS
- Using 2 models and doubling the number of ensemble members decreases the error and improves the statistics
To learn more about Multimodel ensembles, see the Lesson on Multimodel Ensembles.
To learn more about Multimodel ensembles, see the Lesson on Multimodel Ensembles.
Questions
After looking at the mean and spread of the 500 mb heights, I see why Sandy is no longer expected to track out to sea, and I can see why the track remains so uncertain.
- Mean and spread of the 500 mb heights
- See why Sandy is no longer expected to track out to sea
- See why the track remains so uncertain.
Please click the tabs above the image to view and answer the Questions.
To learn more, see the Lesson Interpretation of Mean/Spread Diagrams.
Mean/Spread of 500 mb Heights
Question 1
Examine the mean and spread of the 500 mb heights for 00z 30 Oct 2012. What synoptic feature(s) are driving Sandy toward landfall? (Choose all that apply.)
The correct answers are (a) Low centered over OH/PA and (c) High centered over northeastern-most Canada. The circulation between the two features is directed to the northwest.
Question 2
In the NUOPC ensemble, what appears to be the source of the uncertainty in the track forecast? (Choose all that apply.)
The correct answers are (b) Amplitude of the trough that extends eastward from the Atlantic Seaboard, and (d) Location of the low centered over OH/PA.
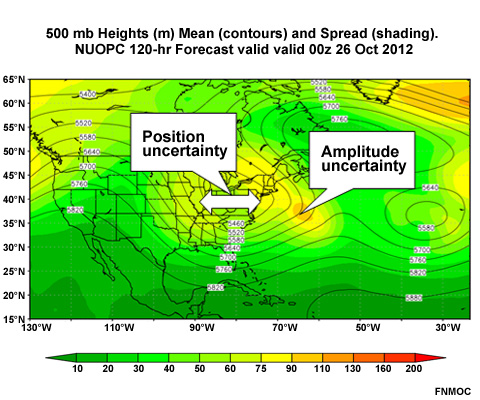
The large uncertainty in the trough (arrow) indicates wide variation in the contours from the different ensemble members. The high spread located both east and west of the low indicates uncertainty in the position of the closed low.
To learn more, see the Lesson Interpretation of Mean/Spread Diagrams.
500 mb Spaghetti
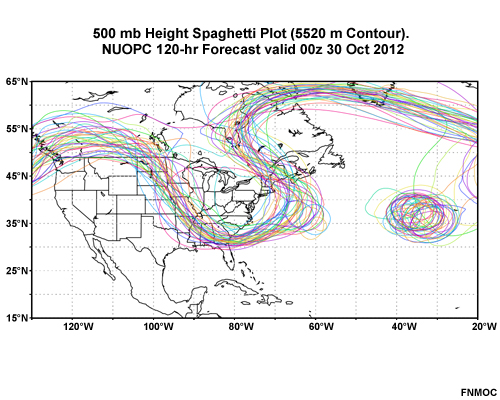
I compare the mean/spread plot to a spaghetti plot of the 5520m contour for the same time on October 30. It appears that the greatest uncertainty arises from widely variable solutions for the trough over the Atlantic Seaboard. In contrast, the contours that define the high over NE Canada are much more tightly clustered.
- Compare the mean/spread plot to a spaghetti plot
- Greatest uncertainty arises from widely variable solutions for the trough over the Atlantic Seaboard
- Contours that define the high over NE Canada are much more tightly clustered
MSLP mean-spread
Looking at the mean and spread of MSLP, we see Sandy track up the East Coast. The ensemble mean indicates landfall on 30 October, between 00z on 30 Oct and 00z on 31 Oct.
- Mean and spread of MSLP
- Sandy tracks up the East Coast
- Landfall on 30 October
Please click the tab above the image to view and answer the Question.
Mean/Spread of MSLP
Question
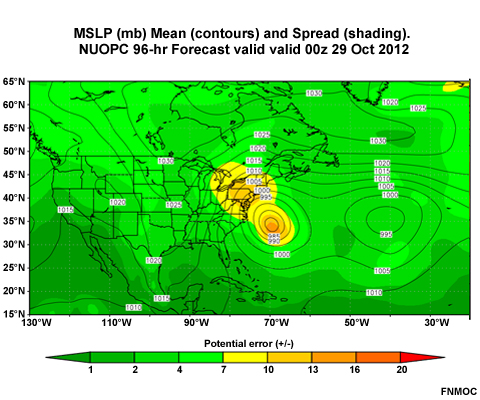
Looking at the plot from 00z 29 Oct, what indication is there that some ensemble members bring Sandy ashore much earlier? (Choose the best answer.)
The correct answer is (a) Large spread extending over PA and NY. The large spread likely results from a minority of storm tracks bringing Sandy ashore sooner than the other ensemble members. Uncertainty centered on the storm center is likely due to variations in the intensity and precise location of the storm, but not so significant as to indicate early landfall.
Surface
Wind Mean-Spread
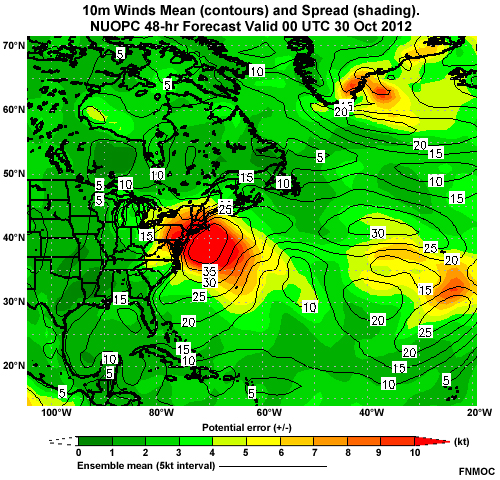
Not wanting to tie my forecast to any one ensemble system, I try looking at a different multimodel ensemble, the North American Ensemble Forecast System, or NAEFS. This ensemble combines the NCEP and Canadian global ensembles. Just like the other models, NAEFS shows that Sandy will grow to a very large storm with storm-force winds over a very broad region. At its peak, the mean wind field brings winds of at least 30 kt from South of Cape Hatteras nearly up to Cape Cod.
- Different multimodel ensemble
- North American Ensemble Forecast System, or NAEFS
- Combines the NCEP and Canadian global ensembles
- NAEFS shows that Sandy will grow to a very large storm with storm-force winds over a very broad region
- Winds of at least 30 kt from South of Cape Hatteras nearly up to Cape Cod
Wind Probability
With the barge transit delayed until further notice, our concern now turns to resource protection. The threshold that the Navy is concerned about is a 50 kt tropical storm force wind speed. While the ensemble mean never gets that strong, that's not to say it won't happen. So again, it's a question of probability.
Interestingly, through the entire forecast period up to landfall, NAEFS never has the probability of 50 kt winds greater than 10% along the coast. I chalk that up to the spread in the hurricane tracks.
- Concern now turns to resource protection
- Threshold that the Navy is concerned about is a 50 kt tropical storm force wind speed
- While the ensemble mean never gets that strong, that's not to say it won't happen
- NAEFS never has the probability of 50 kt winds greater than 10% along the coast
- Chalk that up to the spread in the hurricane tracks
Waves Mean-Spread
Between the wind and the waves, the Eastern Seaboard will take a battering for the next few days. With 4 or 5 days to landfall, it's time to pass this up the chain of command so vulnerable sites can start preparations.
- Between the wind and the waves
- Eastern Seaboard will take a battering for the next few days
October 28
Current Conditions
Satellite
Sandy is currently just offshore from Cape Hatteras. Warnings are up along the East Coast.
- Sandy is currently just offshore from Cape Hatteras
- Warnings are up along the East Coast
Analysis
A stationary front runs up the Eastern Seaboard. When Sandy veers westward toward landfall, she'll merge with that front. That's when Sandy will go extratropical.
- A stationary front runs up the Eastern Seaboard
- When Sandy veers westward, will merge with that front
- Sandy will go extratropical
Forecast
Naval Station Earle
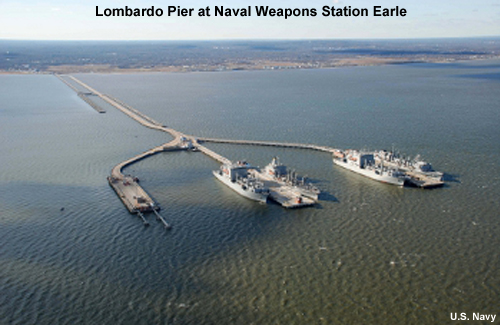
My current task is to provide a forecast for the Naval Station Earle at Sandy Hook, NJ, on the south side of New York Harbor. Its one distinguishing feature is a 3-mile pier in Sandy Hook Bay that looks like Neptune's trident. This keeps ammunition being loaded and unloaded from ships at a safe distance from the surrounding area.
- Provide a forecast for Naval Station Earle
- South side of New York Harbor
- 3-mile pier in Sandy Hook Bay
NHC Forecast
Landfall is expected somewhere in New Jersey with a high probability of strong winds over a broad swath of coastline.
- Landfall is expected somewhere in New Jersey
- High probability of strong winds over a broad swath of coastline
TC Tracks
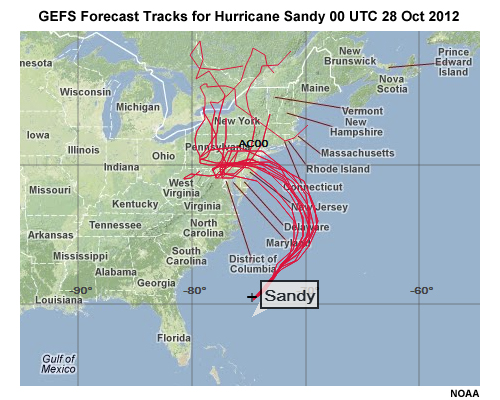
All the models have come into agreement with closely clustered tracks among ensembles and ensemble members.
- All the models have come into agreement
- Closely clustered tracks among ensembles and ensemble members
Extratropical Transition
NWS NATIONAL HURRICANE CENTER MIAMI FL AL182012
1100 AM EDT SUN OCT 28 2012
THE AIRCRAFT DATA...
ALONG WITH DATA FROM SHIPS...BUOYS...AND SURFACE OBSERVATION SITES INDICATE...HOWEVER...THAT THE WIND FIELD HAS CONTINUED TO EXPAND. HURRICANE-FORCE WINDS NOW EXTEND OUT TO ABOUT 150 N MI TO THE SOUTHWEST...AND THE 50-KT WIND RADII HAVE ALSO INCREASED TO ABOUT 200 N MI IN THAT SAME QUADRANT.
...SANDY WILL CONTINUE TO INTERACT WITH A STRONG NEGATIVELY TILTED SHORTWAVE TROUGH LOCATED OVER THE TENNESSEE VALLEY THAT WILL CONTINUE TO MOVED EASTWARD TOWARD THE U.S. EAST COAST OVER THE NEXT 48 HOURS. AS THE TROUGH UNDERCUTS SANDY TO ITS SOUTH...THE HURRICANE IS EXPECTED TO LIFT NORTHEASTWARD AND THEN NORTHWARD OVER THE NEXT 24 HOURS...FOLLOWED BY A TURN TO THE NORTHWEST AND POSSIBLY WEST-NORTHWEST UNTIL LANDFALL OCCURS WITHIN 48 HOURS OR SO.
...BY 36 HOURS...
THE GLOBAL MODELS SHOW SOME DEEPENING OF THE CYCLONE...WHICH IS UNDOUBTEDLY DUE TO STRONG BAROCLINIC FORCING...AND A TRANSITION TO AN EXTRATROPICAL CYCLONE IS EXPECTED PRIOR TO LANDFALL. IT IS IMPORTANT TO NOTE THAT THIS TRANSITION WILL NOT DIMINISH THE OVERALL IMPACTS OF THIS DANGEROUS WEATHER SYSTEM. AFTER LANDFALL... THE GLOBAL MODELS...AND THE OFFICIAL INTENSITY FORECAST...INDICATE RAPID WEAKENING IS EXPECTED.
AS NOTED IN PREVIOUS ADVISORIES...TO AVOID A HIGHLY DISRUPTIVE CHANGE FROM TROPICAL TO NON-TROPICAL WARNINGS WHEN SANDY BECOMES POST-TROPICAL...THE WIND HAZARD NORTH OF THE TROPICAL STORM WARNING AREA WILL CONTINUE TO BE CONVEYED THROUGH HIGH WIND WATCHES AND WARNINGS ISSUED BY LOCAL NATIONAL WEATHER SERVICE OFFICES.
NOAA / NWS / NHC
The National Hurricane Center discussion emphasizes the extratropical transition of Sandy as it joins a trough in the next 48 hours.
- National Hurricane Center discussion emphasizes extratropical transition of Sandy
- Joins a trough in the next 48 hours
500mb mean/spread
The defining event in the 500 mb heights is the merging of Sandy with the advancing longwave trough. Because the spread is concentrated in the low, it appears that the spread in the ensemble members reflects variation in the strength of the low, not its position.
- The defining event in the 500 mb heights is the merging of Sandy with the advancing longwave trough
- Because the spread is concentrated in the low
- It reflects variation in the strength of the low, not its position
Please click the tab above the image to view and answer the Question.
500 mb Heights
Question
Which of the following happens to the longwave trough when it merges with Sandy? (Choose all that apply.)
The correct answers are (a) A closed low develops and (b) The low deepens from 5520 m to 5400 m.
500 mb spag 5520m
The spaghetti plot of the 5520m contour of the 500 mb heights clearly shows how the longwave trough absorbs the tropical cyclone. There is remarkable agreement among the ensemble members pre- and post-merger.
- The spaghetti plot shows how the longwave trough absorbs the tropical cyclone
- Remarkable agreement among the ensemble members pre- and post-merger
Earle Forecast
- Condition IV - Trend indicates a possible threat of destructive winds of the force indicated within 72 hours. Review hazardous and destructive weather Implementation plans, as established by local regulations.
- Condition III - Destructive winds of the force indicated are possible within 48 hours. Take preliminary precautions.
- Condition II - Destructive winds of force indicated are anticipated within 24 hours. Take precautions that will permit establishment of an appropriate state of readiness on short notice.
- Condition I - Destructive winds of the force indicated are occurring or anticipated within 12 hours. Final precautions as prescribed.
On the East Coast, during hurricane season, all vulnerable facilities assume a Hurricane/Tropical Cyclone Condition of Readiness (TCCOR) where they can be prepared for a storm with winds greater than 50 kt within 96 hours. This is TCCOR-V. Yesterday, the Admiral issued a TCCOR-III for the Mid-Atlantic Region. Now it's time for the daily update. In addition to wind, we're also concerned with waves and storm surge.
- On the East Coast
- During hurricane season
- Vulnerable facilities assume a Hurricane/Tropical Cyclone Condition of Readiness (TCCOR)
- Prepared for a storm with winds greater than 50 kt within 96 hours
- This is TCCOR-V
- Admiral issued a TCCOR-III for the Mid-Atlantic Region
- In addition to wind, also concerned with waves and storm surge
Wind
There are 3 weather elements that concern us at Earle: wind, waves, and surge. I start with wind.
- 3 weather elements concern us at Earle:
- Wind
- Waves
- Surge
Please click the tabs above the image to view and answer the Questions.
10 m Winds
Question 1
Based on this loop of mean winds, what is the maximum wind you might expect at Earle? (Choose the best answer.)
The correct answer is (c) 50 kt. Mean winds are progged by NUOPC to reach 40 kt. However the spread exceeds 10 kt, so there's a significant probability that winds could be much stronger at least 50 kt.
Question 2
How long are winds stronger than 35 kt like to persist? (Choose the best answer.)
The correct answer is (d) 24 hours or more. Winds 35 or more commence about 6z 29 Oct and persist through 6z 30 Oct for the area near New York Harbor. While the details may be off, the base commander should prepare for a long period of strong sustained winds.
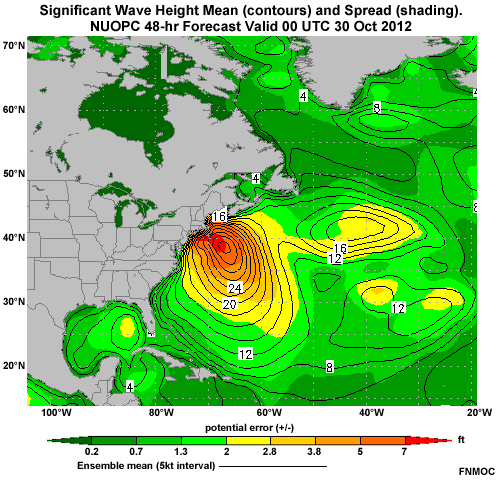
Waves
The NUOPC wave ensemble run at FNMOC consist of Wavewatch III model forced by NUOPC winds. Here we see significant wave height predicted by this wave ensemble around the time of Sandy landfall. As we can see from this image loop, the mean wave height close to shore is predicted to exceed 24 feet for an extended period of time, with a maximum height of over 32 feet located offshore.
- The NUOPC wave ensemble run at FNMOC
- Wavewatch III model forced by NUOPC winds
- Mean wave height close to shore is predicted to exceed 24 feet for an extended period of time
- Maximum height of over 32 feet located offshore
Storm Surge
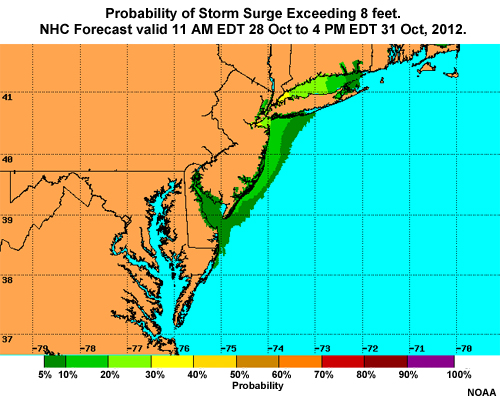
For storm surge, I look at products produced by the National Hurricane Center. For Earle, our threshold of concern is 8 feet. At this time, the probability of the surge exceeding 8 feet at Earle is between 20 and 30%.
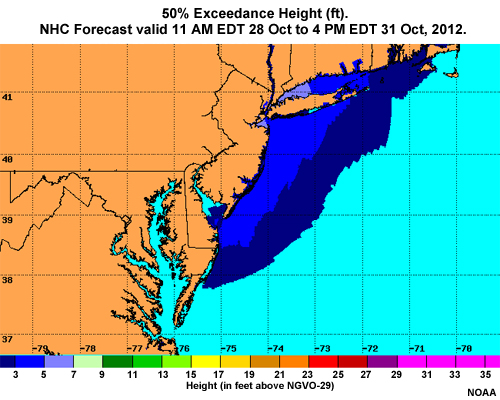
I find the median forecast by looking at the 50% exceedance height. It shows that there is a 50% probability that the surge will exceed 5 feet.
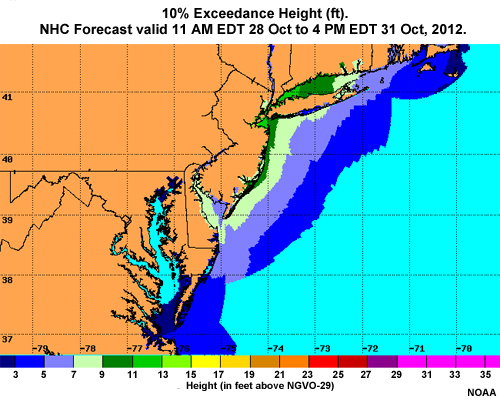
A more conservative approach is to look at the 10% exceedance height. That is the height that is predicted for the top 10% of ensemble members. In this case, there is a 10% chance that the storm surge will exceed 11 feet in New York Harbor, including at Earle.
So, my forecast for Earle consists of the following:
- Winds rise to 35 kt or more 6z 29 Oct and persist through 6z 30 Oct for the area near New York Harbor. There is a significant chance of winds 50kt winds through that period.
- Seas near shore rise to 24 feet for the same period.
- Storm surge is predicted to be about 5 feet near the mouth of New York Harbor, but there is a 20-30% chance that it will exceed 8 feet, and a 10% chance of exceeding 11 feet.
October 30
Landfall
Satellite
Sandy made landfall about 00z on October 30th with high winds and waves and heavy rains.
- Sandy made landfall about 00z on October 30th
- high winds
- heavy rains
NHC Discussion
NWS NATIONAL HURRICANE CENTER MIAMI FL AL182012
1100 PM EDT MON OCT 29 2012
SATELLITE...RADAR...SURFACE...AND RECONNAISSANCE AIRCRAFT DATA INDICATE THAT SANDY MADE LANDFALL NEAR ATLANTIC CITY NEW JERSEY AROUND 0000 UTC. THE INTENSITY OF THE POST-TROPICAL CYCLONE WAS ESTIMATED TO BE NEAR 80 KT AT LANDFALL WITH A MINIMUM PRESSURE OF 946 MB. AT LANDFALL...THE STRONGEST WINDS WERE OCCURRING OVER WATER TO THE EAST AND SOUTHEAST OF THE CENTER. HURRICANE-FORCE WINDS GUSTS HAVE BEEN REPORTED ACROSS LONG ISLAND AND THE NEW YORK METROPOLITAN AREA THIS EVENING. IN ADDITION...A SIGNIFICANT STORM SURGE HAS OCCURRED ALONG A LONG STRETCH OF THE MID-ATLANTIC AND SOUTHERN NEW ENGLAND COAST.
ALTHOUGH THE CYCLONE SHOULD STEADILY WEAKEN AS IT MOVES FURTHER INLAND....CONDITIONS WILL BE SLOW TO IMPROVE AS STRONG WINDS AND ELEVATED WATER LEVELS WILL PERSIST ALONG THE COAST FOR ANOTHER DAY OR SO. HEAVY RAINS ARE ALSO EXPECTED TO CONTINUE OVER A LARGE AREA OF THE NORTHEASTERN UNITED STATES...POSING A VERY SIGNIFICANT INLAND FLOOD RISK. SANDY TOOK A NORTHWARD JOG BEFORE LANDFALL THIS EVENING AND HAS ALSO SLOWED DOWN. THE POST-TROPICAL CYCLONE IS EXPECTED TO SLOW DOWN FURTHER AND TURN NORTHWARD...THEN NORTHEASTWARD OVER THE NEXT COUPLE OF DAYS. THE NHC TRACK IS SIMILAR TO THE PREVIOUS ADVISORY AND IS A BLEND OF THE ECMWF AND GFS MODELS.
NOAA / NWS / NHC
Hurricane force winds and gusts struck a large region before the storm brought heavy precipitation to inland areas.
- Hurricane force winds and gusts struck a large region before the storm brought heavy precipitation to inland areas.
Storm Surge
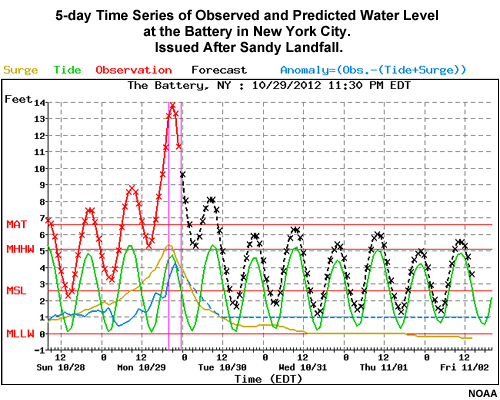
Storm surge was slightly higher than models predicted, leading to unprecedented flooding.
Compare this prediction from 5:30 AM EDT October 29 to the post-storm observations at 11:30 AM EDT October 30. Surge was predicted at 11 feet in New York's Battery with about a 15-hour lead time. Storm surge peaked at nearly 14 feet, resulting in flooding of subway tunnels and power failure when a utility substation flooded.
- Storm surge
- Slightly higher than models predicted
- Leading to unprecedented flooding
- Prediction from 05:30 AM EDT October 29
- Observations at 11:30 AM EDT October 30
- Predicted at 11 feet in New York's
- Peaked at nearly 14 feet
- Resulting in flooding of subway tunnels and power failure when a utility substation flooded
Prediction: 05:30 AM EDT 29 Oct
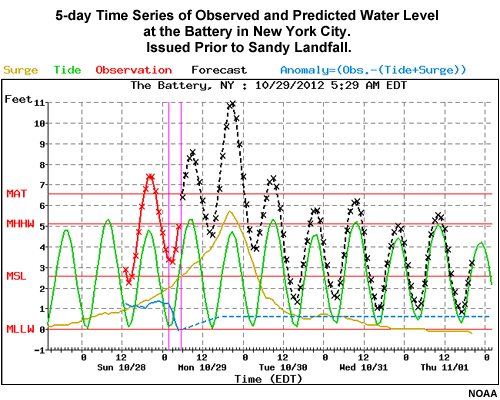
Observations: 11:30 AM EDT 30 Oct
Damage
High waves combined with a strong storm surge devastated vulnerable areas.
- High waves combined with a strong storm surge devastated vulnerable areas.
Model Verification
Near the end of the day, I compared the ensemble forecast to the observations.
- Near the end of the day, I compared the ensemble forecast to the observations.
Please click the tab above the image to view and answer the Question.
Wind/Wave Obs
Wind Forecast
Wave Forecast
Question
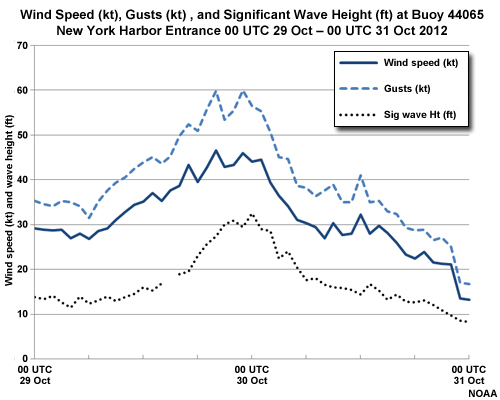
What is the best description of the accuracy of the ensemble wind and wave forecasts? (Choose the best answer.)
The correct answer is (b) accurate to within the ensemble spread. In general, the predicted mean wind and wave forecast is slightly low, but appears to be within the ensemble spread. For example, at 00 UTC 30 October, the wind measured about 45 kt near the entrance to New York Harbor. The 48-hr prediction was about 40 kt +/- 10 kt. Observed wave heights were about 30 feet. Predicted waves were about 24 +/- 5 feet. Considering that ensemble members are run with a grid spacing of about 100 km, it's a reasonably good forecast.
Verification Statistics
Reliability
Verifying an ensemble prediction is more complicated than verifying a single-model prediction. After all, how do you verify something like a 50% chance of wind speed exceeding 20 kt?
The answer is to look at a region for some period of time, a few weeks, and see if the forecast probability of an event matches its observed frequency. In other words, if we're forecasting a 50% chance of the wind speed exceeding 20 kt, then the observed wind should actually exceed 20 kt 50% of the time.
- Verifying an ensemble prediction is more complicated than verifying a single-model prediction
- Look at a region for some period of time
- See if the forecast probability of an event matches its observed frequency
- If forecasting a 50% chance of the wind speed exceeding 20 kt
- then the observed wind should exceed 20 kt 50% of the time
Please click the tab above the image to view and answer the Question.
To learn more and answer the following questions, see the lesson Ensemble Forecast Verification.
Reliability Diagram
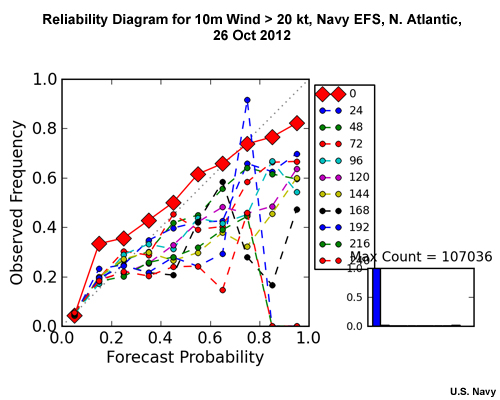
Question
The Reliability Diagram shown here was plotted for the North Atlantic during Hurricane Sandy. How often did a 60% chance of wind exceeding 20 m/s (40 kt) in a 48 hour forecast actually occur (in other words, what's the approximate observed frequency)? (Choose the best answer.)
The correct answer is (a) 50%. Starting at 0.6 on the horizontal axis, go straight up to the dark green line, then horizontally left to the vertical axis and read the value. The best answer is 50%. During Sandy, a 60% chance of wind stronger than 40 kt actually occurred 50% of the time. This is a slight overforecast at 48 hours.
To learn more and answer the following questions, see the lesson Ensemble Forecast Verification.
Talagrand
Next, I looked at the Talagrand diagram. In the early going, day-1 and day-3, the diagram is high-centered with a distinct bump in the middle of the distribution. By day five the plot is nearly flat
- Talagrand diagram
- Day-1 and day-3, the diagram is high-centered
- By day-5 the plot is nearly flat.
Please click the tab above the image to view and answer the Question.
Talagrand Diagram
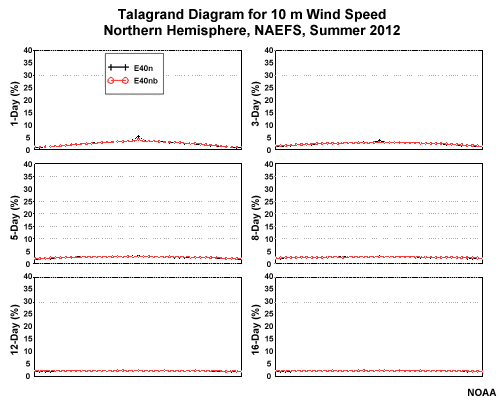
Question
What does the high-center distribution indicate about the ensemble forecast? (Choose the best answer.)
The correct answer is (d) Too much spread in the ensemble forecast. In this case, too many observations fall in the middle of the range of ensemble members and not enough at the extremes. If there were a bias, then the Talagrand diagram would exhibit a high on one side or the other.
Summary
This module provided you with an operational case study from 20 October to 28 October 2012 using the North American Ensemble Forecast System (NAEFS) and the National Unified Operational Prediction Capability (NUOPC) ensemble forecast system. Forecast tools developed from these ensemble forecast systems were applied to routing a tug towing a barge with sensitive and valuable cargo from Pascagoula MS to Bath ME. Additionally, probabilities for decisions on resource protection related to exceeding critical wind, wave, and other important variables were used for forecasting the impacts at Naval Station Earle, off of Sandy Hook NJ.
During the case study period, the tropical system that became Tropical Storm and then Hurricane Sandy formed, developed, intensified, and made landfall near Atlantic City, NJ, resulting in billions of dollars in damage in the mid-Atlantic states . Through the forecast process presented in the case study, you were shown how to use tools from the ensemble forecast systems to assist decision-makers to take action to protect lives and property during this high-impact event. These included ensemble mean and spread forecasts, and forecast probability of exceeding critical wind and significant wave height values.