Ensembles Lessons
Table of Contents
UKMO Prediction of Extreme Events
Extreme Forecast Index
The UK Meteorological Office (UKMO) has developed a product to assess the likelihood of extreme weather events by comparing EFS 24-hour forecast probabilities to model climate probabilities to come up with an Extreme Forecast Index (EFI). The model climate comes from the last 18 years of 24-hour forecasts, rerunning a 5-member ensemble of the European Center for Medium-range Weather Forecasting (ECMWF) NWP model. The EFI is calculated for days one through five days for:
- 10 m wind (daily mean)
- 10 m wind gusts (daily maximum)
- 2 m temperature (daily mean)
- Precipitation (daily values from day 1 through day 5)
Accumulated precipitation EFIs are also determined for days 1 through 5, 2 through 6, and 1 through 10.
EFI Determination
The graphic below is a way to picture the EFI using idealized model climatology and ensemble forecast probability distributions.
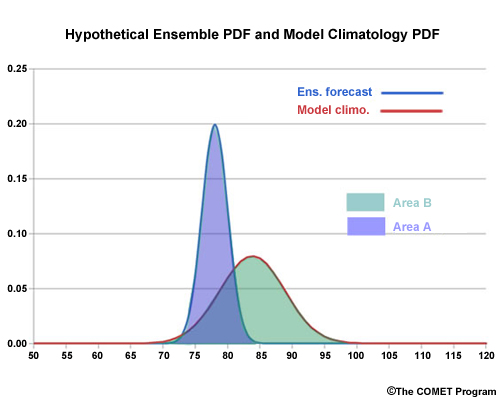
The EFI is proportional to the model climatology PDF (Area B) minus the overlap between the model climatology PDF and the ensemble forecast PDF (Area A).
EFI ~ Area B - Area A
As the ensemble PDF gets further away from the model climatology, the overlap decreases and the EFI increases. If the peak in the ensemble distribution is below the peak in the model climate distribution, the EFI is negative, and vice versa. Values range from -1.0 to +1.0 for ensemble PDFs entirely below or above the model climatology, respectively. Significant negative values of EFIs would typically be important only for temperature, and positive values for all EFI indices. In practice, developers and users have found that EFI thresholds of ± 0.5 and ± 0.8 indicate the likelihood of "unusual" and "very unusual" events, respectively.
Range
We can see different EFI scenarios in the animation below. To keep things simple, the ensemble (blue curve) and climate (red curve) PDFs are given the same standard deviation. In the first panel of the animation, the ensemble PDF is completely below the model climatological PDF. In this case, the EFI would be -1; a negative extreme event with all ensemble forecast values below the model forecast climatology. As the animation proceeds, the area overlap increases until the two PDFs are identical, giving a zero EFI. As the animation proceeds the ensemble forecast values increase and EFI's become increasingly positive, up to a value of +1.
Question
In this plot of EFI, at which lettered location do you expect the most exceptionally warm or cool temperatures?
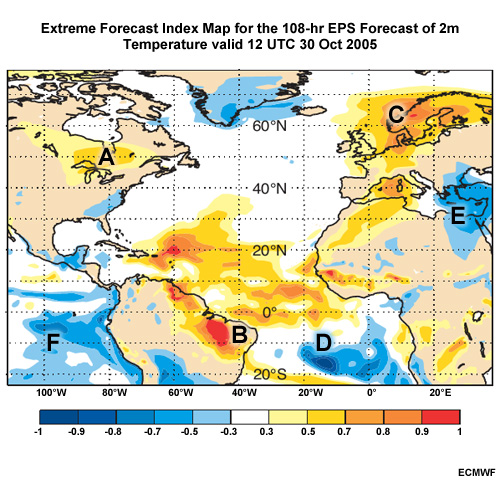
The correct answers are that the most exceptionally warm temperatures are expected at B (interior northeast Brazil) and cool temperatures at D (Central southern tropical Atlantic). This is not to say that these are the warmest or coldest places, just that they are the most anomalously warm or cool with respect to normal at these locations.
Extreme Weather Risk Map
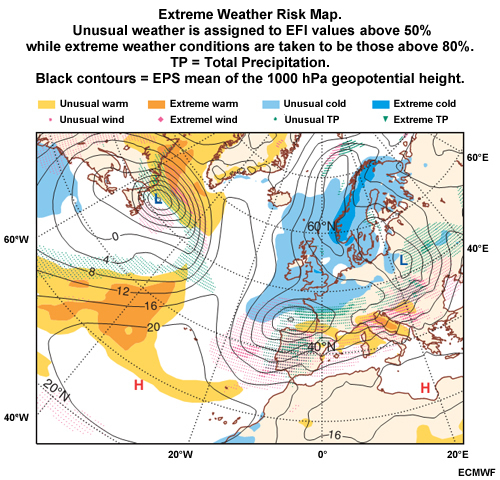
The UKMO has also created an automated warning product that flags areas with an extreme weather risk. The warning product combines all 4 weather events: high temperature, low temperatures, high wind, and heavy precipitation, and shows regions of unusual (EFI > 0.5) and extreme (EFI > 0.8) risk.
To learn more about the EFI and EFI products, see:
http://www.ecmwf.int/products/forecasts/guide/The_Extreme_Forecast_Index_EFI.html