Caribbean — Climatology
Table of Contents
Jet Streams
Jet Streams Polar Jet

The Polar Jet does not normally reach to Caribbean latitudes. However, when it merges with the subtropical jet over the Gulf of Mexico or Mexico, storms that track along the confluence zone bring fronts and their associated strong winds and heavy rainfall into the Caribbean.
Jet Streams Subtropical Jet

The subtropical jet varies between 20°- 35°N during the winter, when it is strongest, and close to 40°N during summer, when it is weakest. Its greatest influence on Caribbean weather is during the winter when its southward shift creates favorable conditions for midlatitude cyclones and fronts to reach the Caribbean.
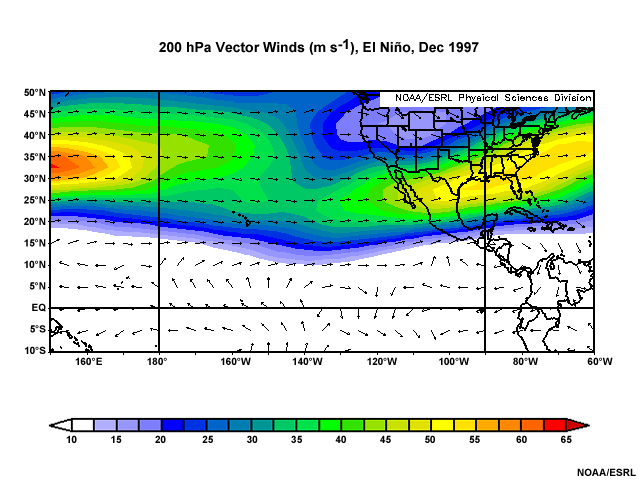
During El Niño winters, the jet is stronger, farther south of its normal position, and more persistent, which leads to more frequent and stronger storms and associated fronts moving through the Caribbean. Occasionally, the branch of the subtropical jet over the tropical north Atlantic affects weather in the eastern Caribbean.
Synoptic Patterns
Synoptic Patterns Bermuda-Azores High
Synoptic Patterns » Bermuda-Azores HighBermuda-Azores High Climatology
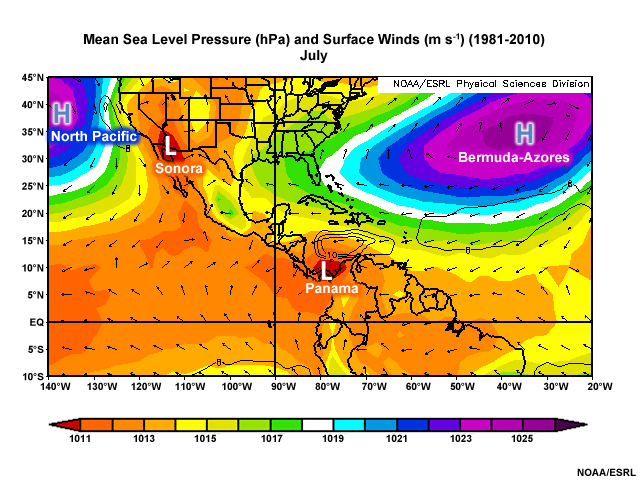
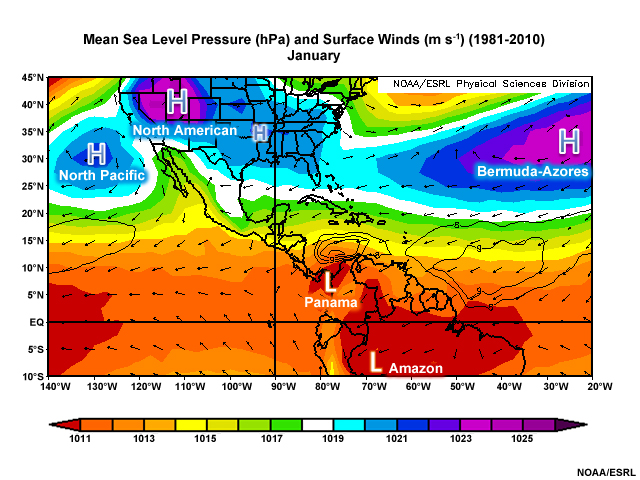
The Bermuda-Azores High dominates weather in the Caribbean in the summer, when it is strongest and farthest west. Its center starts retreating eastward during autumn, and the high pressure weakens. Notice the difference between the large extent of the 1018 hPa isobar in July and the smaller extent in October. The center of the Bermuda-Azores high is farthest east and its mean pressure is lowest during winter.
When the Bermuda-Azores High expands to the south and west, pressure gradients between the subtropical high and the equatorial trough increase, and winds intensify in the central and southern Caribbean. During July, southeasterly trade winds are typically strongest between 15° and 20°N. Pressure gradients also increase over the southern Caribbean during the winter and winds become northeasterly and easterly. The resulting acceleration of easterly surface winds causes significant waves and higher seas south of the Greater Antilles in both summer and winter.
Synoptic Patterns » Bermuda-Azores HighTrade Wind Surges

Surges in the trade winds occur when high pressure pulses migrate around the eastern edge of the Bermuda-Azores High and merge with the trade wind flow. The confluence of these migratory midlatitude air masses and the trade winds leads to “trade-wind surges,” synoptic-scale disturbances that move steadily westward. Trade wind surges have periodicity of 5-7 days and usually affect the eastern and southern Caribbean.
Synoptic Patterns » Bermuda-Azores HighTrade Wind Inversion


Subsidence warming in the Bermuda-Azores High and cool waters from trade wind-driven upwelling over the eastern tropical Atlantic create an inversion called the Trade Wind Inversion.


The Trade Wind Inversion, one of the prominent features of the boundary layer in the tropics, extends from the tropical Atlantic into the Caribbean. The Trade Wind Inversion base increases in height, and weakens towards the equator and the west, as SSTs become warmer and pressure decreases.
Synoptic Patterns Equatorial Trough and ITCZ
Synoptic Patterns » Equatorial Trough and ITCZEquatorial Trough Climatology
The equatorial trough is a zone of low pressure and rising motion that migrates as far north as Central America during the rainy season (May–November) and remains near equatorial South America during the dry season. The ITCZ refers specifically to the zone of confluence between the northeast and southeast trade winds rather than the low pressure zone; the two are often, but not always, co-located. Squall lines that form within the equatorial trough during the rainy season result in reduced visibility in heavy rain, strong winds greater than 15 m s-1 (30 kt), and rough seas.
Synoptic Patterns » Equatorial Trough and ITCZ Equatorial Trough in Central America
During December-April, the Isthmus of Panama has persistent easterly winds and little precipitation. When the equatorial trough crosses Panama in May on its northward journey, mesoscale tropical disturbances, such as squall lines, bring heavy rainfall until a mid-summer dry period in July. The trough and ITCZ return in September, leading to disturbances from the southwest occurring through November. The Caribbean coast of Central America faces easterly winds throughout the year, which leads to copious amounts of orographic rainfall and thunderstorms.
Synoptic Patterns » Equatorial Trough and ITCZ Equatorial Trough in South America
During January-April, the equatorial trough is over equatorial South America, winds are northeasterly to northerly, and rainfall is low over the Caribbean coast of Colombia.

When the trough arrives in May, winds become southwesterly and heavy rainfall and thunderstorms are frequent.

A mid-summer dry period occurs in July followed by another period of heavy rain in November that is associated primarily with tropical easterly waves, depressions, and tropical cyclones. The plains (llanos) of Venezuela in the Orinoco basin receive little precipitation during December and January.
However, in May-August, when the equatorial trough and ITCZ lie over Venezuela, it receives about 70% of its annual rainfall.

Since drainage from the Orinoco flows into the eastern Caribbean, the minimum in salinity occurs subsequently in that part of the sea.
Synoptic Patterns » Equatorial Trough and ITCZImpact on Pressure Gradients in the Caribbean


Regional lows sometimes form near the coast of Panama and Colombia and migrate along thecoast of South America and the southern Caribbean. The migration of the regional low pressure areas modulates the pressure gradient across the Caribbean and Central America. When the low pressure moves north or east, it increases pressure gradients, which causes strong winds and swells in the Caribbean Sea.
Synoptic Patterns Caribbean Low-level Jet


The Caribbean Low-level Jet (CLLJ) is an easterly wind maximum at 925 hPa in the Caribbean. Its formation is due to strong gradients between the subtropical ridge from the Bermuda-Azores High and the equatorial trough. Daily and seasonal variations in the intensity and location of maximum winds are associated with the meridional gradient in sea level pressure.
The CLLJ has its maximum mean spatial extent and highest wind speeds during June and July when the Bermuda-Azores High is farthest west.
A weaker and smaller CLLJ maximum occurs during winter.
While its core is near 925 hPa, wind speeds are relatively strong at the surface, which contributes to wave generation over the Caribbean Sea. The stronger wind mixes the warm surface waters with cooler water from below, lowering the SST.
A mid-summer minimum in rainfall and tropical cyclogenesis occurs over the Western Caribbean and Central America in association with the relative maximum in sea-level pressure and cool SST. One explanation is that the high vertical wind shear associated with the CLLJ inhibits deep convection. Another is that divergence of moisture by the jet suppresses convection. Divergence in the entrance region of the CLLJ is cited as one reason for the climatological low precipitation over northern Venezuela and the southeastern Caribbean islands.

The wind speed decreases dramatically during September to November when gradients of sea level pressure and SST are weaker. This is also the period when the Caribbean has its highest SST and main rainy season.
The CLLJ seems to be maintained by positive oceanic-atmospheric feedback. Meridional SST gradients, associated with the sea-level pressure gradients, produce the CLLJ.

The CLLJ produces negative wind stress that warms the northern Caribbean and cools the southern Caribbean, which increases the meridional SST gradients.
Synoptic Patterns Tropical Upper-Tropospheric Troughs (TUTTs)
TUTTs are persistent features that extend from the Atlantic into the Caribbean during May to October. They are cold-core systems that exist mostly above 500 hPa.


They are sources of clouds and precipitation, which tend to be on the southern and eastern sides of the TUTT.

Upper-level divergence east of the TUTT helps to enhance organized convection and can aid in the formation of tropical cyclones from easterly waves. TUTTs can also inhibit intensification of tropical disturbances and tropical cyclones by introducing large amounts of vertical shear.
TUTTs sometimes induce inverted troughs in the low-level easterlies that move from east to west. From a satellite perspective, these low-level inverted troughs can sometimes be mistaken for easterly waves, which originate in Africa. However, TUTT-induced troughs are steered by upper-level flow, while easterly waves move independent of the upper-level flow and are typically moving with the lower-mid tropospheric flow.
Extratropical Cyclones
Extratropical Cyclones The Polar Front
While the mean winter position of the polar front lies along the Gulf Coast, it intrudes into the Caribbean, even reaching coastal South America during rare polar surges. During the winter, the dry season for most of the Caribbean, polar fronts or dissipating fronts that penetrate from the north are vital sources of precipitation in the northern Caribbean Sea and Central America, especially poleward of northern Nicaragua. During early winter, specific regions, such as the north coasts of the Greater Antilles, receive their highest precipitation of the year from interactions of fronts with topography.

The occurrence of fronts as far south as the Greater Antilles varies from one per month in October to a maximum of four per month in January. Between November-February, more than 60% of the fronts entering the Gulf of Mexico (from the north or west) continue equatorward into the Caribbean. Dry season winter fronts normally have a northeast to southwest orientation, while fronts in the warmer seasons are oriented almost east to west and generally reach no farther than just south of Cuba or the northern Yucatan Peninsula. No fronts reach the Caribbean Sea during July and August, a period when the westerlies and polar jet stream are far north in Canada.
Extratropical Cyclones » The Polar Front Cold Surges


For cold surges into Central America, 75% have durations of 2–6 days, with those that reach 7°–10°N lasting slightly longer than those reaching only 15°–20°N. The extent of equatorward migration depends on where topographic features impede the cold air. Surges are colder when (1) a high amplitude upper-level ridge persists over the western United States, (2) entrance to confluence of the polar and subtropical jet occurs over the Mexico and the Gulf of Mexico, and (3) a Canadian lower-tropospheric anticyclone moves equatorward along the Rocky Mountains and the Sierra Madres. Cold surges are also associated with accelerating trade winds over the tropical east Pacific, which is related to ENSO.
Extratropical Cyclones » The Polar Front Fronts and Shear Lines
By the time the polar front reaches the Caribbean and Central America, the surface temperature and dewpoint contrasts across the front have become very small or non-existent, and only a shear line or shear zone may be present.

The shear lines are associated with wind shifts and are usually found by identifying an area of directional wind confluence at the tail end of a front.
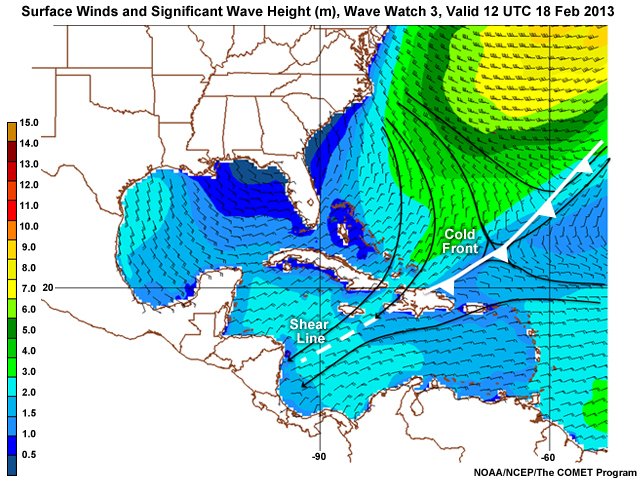
Passage of the shear line (known as “Atemporalado”) may be associated with squall lines, gale-force winds, and heavy rains. Sometimes prefrontal troughs develop and cause severe weather and flooding.
Extratropical Cyclones » The Polar Front Fronts and Surface Weather

Surface pressure falls as the front approaches then rises quickly after the frontal passage, similar to fronts in the extra-tropics, except that pressure rise is on the order of about 4 hPa in 12 hours. The across-front contrast lessens for Group 2, which is farther south and east of Group 1. Group 3 experiences their lowest pressure about 24 hours before the front, which may be due to the tendency for prefrontal troughs to form in the western Caribbean. Before the front, winds are mostly easterly and northeasterly. After the front, surface winds switch abruptly to north or northwest directions and increase speed.
Prior to the front, surface temperatures increase for Group 1, but remain relatively steady for Group 2, and a more gradual increase occurs in Group 3. Temperature and dewpoint fall in the wake of the front. Note the steeper drop at the westernmost stations, another indication of the moderation of the polar air mass as the front moves south and east. Cooling is also related to cloudiness along the front due to warm air lifting and condensing. The dewpoint generally recovers about 36 hours after the front, while the temperature takes a bit longer to return to pre-frontal conditions.
Extratropical Cyclones » The Polar Front Fronts and Heavy Precipitation

Although fronts are more frequent and relatively stronger in the western Caribbean, persistent frontal zones are found over the eastern Greater Antilles. These quasi-stationary fronts bring days of rain and occasional severe weather. Enhanced frontal precipitation across the Greater Antilles is favored with
- a strong surface ridge north of the Greater Antilles,
- stronger than normal easterly trade winds, and
- westerlies at the upper-levels.
Extratropical Cyclones Midlatitude Cyclones

On extremely rare occasions, the synoptic environment becomes favorable for cyclogenesis within the Caribbean. The ingredients for those events include the combined effects of:
- a low-latitude jet stream; with a
- high amplitude mid-to-upper-level wave, which is conducive to strong meridional temperature gradients and flow;
- an extremely fast jet streak east of the upper-level trough, which promotes strong upper-level divergence in its right entrance region; and
- a surface frontal boundary, which is a source of preexisting surface convergence and lift that is aligned with the upper-level divergence.


Tropical Cyclones
Tropical Cyclones Seasonal Activity in the Caribbean
Tropical cyclogenesis is at a hurricane-season minimum over the Caribbean during July, which seems to be due to higher sea level pressure, lower SSTs, and stronger vertical wind shear that is unfavorable for deep convection to develop and organize. Cyclogenesis in the Caribbean reaches a maximum during September when SSTs are highest, and vertical wind shear is relatively weak.
Tropical Cyclones Intraseasonal Variability

The active phase of the MJO (green areas in the figure) enhances convective activity locally. Therefore, the potential for tropical cyclogenesis increases when easterly waves interact with the active cycle of the MJO in regions of dynamic instability over warm tropical waters. The suppressed phase of the MJO (brown areas in the figure) tends to inhibit convection thereby reducing the potential for convection to organize into tropical cyclones, so fewer cyclones form during this phase.

Intraseasonal activity in the Caribbean Sea is also modulated by the Saharan Air Layer (SAL), an elevated, dry, dusty layer that originates over the Sahara Desert. The SAL has been observed to inhibit the genesis and intensification of tropical cyclones over the tropical Atlantic and Caribbean Sea. Large SAL outbreaks can weaken mid–level disturbances because the associated stronger mid–level easterly jet causes stronger vertical wind shear and lowers the chance of tropical cyclogenesis. The SAL can also aid tropical cyclogenesis when active convection persists on its southern and western boundaries but is suppressed elsewhere.
Tropical Cyclones Interannual Variability

Like the North Atlantic as a whole, the Caribbean sees a decrease (increase) in tropical cyclone occurrences during El Niño (La Niña) years. However, note that tendencies for reduced seasonal activity does not preclude the formation of major hurricanes nor for such hurricanes to make landfall during El Niño, as occurred with Hurricane Andrew in 1992.
Questions
Questions Question 1
Use the selection boxes to choose the answers that best completes the statement.
Questions Question 2
Use the selection box to choose the answer that best completes the statement.
Questions Question 3
Use the selection boxes to choose the answers that best completes the statement.
Questions Question 4
Cold surges and fronts in the Caribbean (Choose all that apply.)
The correct answer are a, b, and d.
Questions Question 5
Use the selection boxes to choose the answers that best completes the statement.