Table of Contents
- Introduction
- Satellite Imagers
- Pre-Fire Monitoring and Post-Fire Analysis
- Fire Detection and Monitoring
- Detecting Fires
- Shortwave vs. Longwave Imagery
- Sub-pixel Effect, 1
- Sub-pixel Effect, 2
- Limitations in Fire Detection
- DMSP OLS and VIIRS Nighttime Lights & Fires
- MODIS and VIIRS True and False Color Imagery
- False and True Color Closeups
- False Color vs. Aircraft Data
- Hazard Mapping System
- GOES FDC and NASA GIBS
- VIIRS Fire Detection
- U.S. Forest Service Active Fire Maps
- Section Summary
- Smoke & Aerosol Detection, Monitoring & Transport
- Fire Product Suite
- Case Study
- Introduction
- Advantages of True Color Imagery
- Relative Greenness Maps
- Relative Greenness Question
- Hotspots
- Location of Flames
- Fires in GOES Animations
- MODIS Image & Radar Reflectivity Loop
- MODIS Active Fire Maps
- False Color Imagery, 13 July
- False Color Imagery, 14 July
- True and False Color Imagery
- Commentary
- Module Summary
- References and Resources
Introduction
Role of Fire
Fire has been humankind's companion since prehistoric time. It enabled early peoples to travel from the temperate regions, where they evolved, into the colder regions of the mid and upper latitudes.

Fire has long served as both a useful tool for civilization and an object of fear when out of control.
![Photograph of Moran Fire
[Marianne did the graphic]](media/graphics/moranFire.jpg)
Fires drastically alter the landscape, bringing unwanted destruction as well as ecological renewal.

In many parts of the world, fire is used to clear land for agriculture and other purposes.
![The fireweed (a member of the primrose family) in the foreground of this photo, taken in Glacier National Park, Montana, is usually the first plant to grow in a burned area. Three years after a wildfire destroyed them, the burned trees remain standing because of unusually mild winters.
[Marianne did the graphic]](media/graphics/burn_flowers.jpg)
Fires occur everywhere - in forested, rural, and urban regions, at high latitudes, and in the tropics.

Trends in Fires
The pattern of wildfires follows the seasons, with fires breaking out in the northern mid-latitudes with spring warming and disappearing when fall and winter weather brings cooler temperatures, increased moisture, and more widespread precipitation.


Weather satellites are useful tools for monitoring seasonal fire trends. This monthly animation shows global fire detections in 2011 using the MODIS satellite, with each fire indicated by a red marker.
Weather satellites are useful tools for monitoring seasonal fire trends. The above quarterly MODIS sequence shows global fire detections in 2011 using the MODIS satellite, with each fire indicated by a red marker. Large blocks of red make it appear as though entire portions of the tropics are on fire, which is fortunately not the case. We will uncover the reason for this discrepancy when we study how satellites detect fires.
The prevalence of wildland fires also changes based on short- and long-term variations in climate, which satellites help to monitor. Some researchers predict that the warming associated with global climate change will cause the number of catastrophic fires to increase dramatically.
The average number of acres burned annually due to wildfires in the United States exceeded 6.5 million from 2000 to 2012. Longer-term trends in wildfire activity as shown in the plot from 1988 to 2017 indicate that the acres burned and number of wildfires vary depending on the year.

Wildfire Management
Wildfire suppression costs the U.S. federal government in excess of $1 billion per year. Despite the use of radio communications, rapid helicopter transport, and new types of chemical firefighting apparatus, over four million acres of U.S. forestland and grassland burn in a typical year.

Although many wildland fires are started by lightning, most are caused by humans, whether intentionally or by accident.

Satellite Detection and Analysis of Fires
Local and regional fire management agencies use a variety of systems to detect fires, such as aircraft observations.

For fire detection and monitoring at continental and global scales, only satellites can provide the required coverage and consistency.

Even at regional scales, satellites offer fire fighting agencies, weather forecasters, researchers, and the public a unique and timely perspective on fires.

Fire Cycle Overview
Satellites allow us to observe the fire lifecycle from the pre-fire environment to the onset and spread of fires, the transport of smoke, and the modifications to the landscape in the wake of fires. Let's take a brief look at the use of satellite data in monitoring each phase of the cycle.

Pre-fire conditions: Satellite products are used to observe pre-fire conditions and spot trends in fire susceptibility. This MODIS image shows southern California before the onset of a major fire episode. The brown chaparral hints at the tinder dry fire fuel over the hillsides. With the forecast of hot, dry Santa Ana winds, it will take only a spark to create a roaring fire.

Fire danger: Dry vegetation over the hills is confirmed by the observed fire danger classification product produced from in situ observations on the ground. Reds and oranges indicate that the fire danger in southern California is very high or extreme. Later, we will see how satellite products can work together with in situ observations to assess the risk of fires.

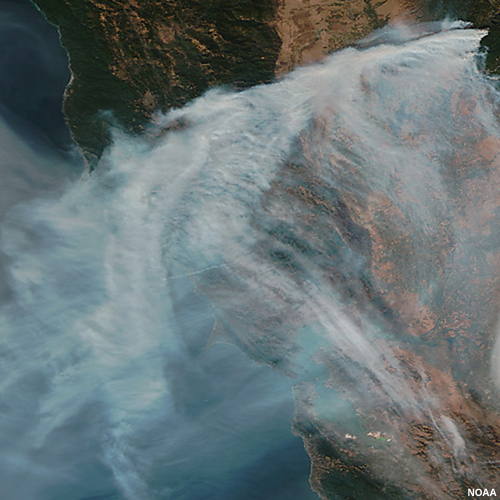
Burning fires: The MODIS false color image reveals the major fire fronts in orange. A true color image shows smoke plumes. The overlay of freeways and place names expands the usefulness of these products to fire fighters, media, nearby residents, travelers, and others. We will cover true and false color imagery in more detail in the lesson.


Smoke detection: This zoom shows how well suited true color imagery is for sensing the finer details of smoke. It can capture the texture, thickness, and extent of smoke plumes, especially in contrast to darker surfaces such as oceans.
Fire aftermath: Satellite products also help us observe post-fire changes in vegetation, erosion potential, and the prospect for ecological renewal. Notice the burn scars in dark pink. Within them, vegetation is charred, the ground surface is often exposed, and the likelihood of erosion, including debris flows, is high.

Other Types of Fire
Not all fires fit into the concept of the fire cycle. During and after the 1991 Persian Gulf War, NOAA Polar-orbiting Operational Environmental Satellite System (POES) satellites were used to monitor wildfires, oil fires, and smoke. This NOAA AVHRR image shows hotspots from crude oil burning in red and smoke from oil wells in black.

Nighttime Lights
Some satellites can detect light sources as well as fires. This nighttime image was produced by the VIIRS Day/Night Band (DNB) on the Suomi NPP (S-NPP) satellite and shows smoke, city lights, and locations of active fires.

The VIIRS imager on board the S-NPP and JPSS satellites produces detailed and stunning images of nighttime features. VIIRS captured this nighttime view of wildfires and smoke plumes in Idaho and Montana on August 29, 2012. We'll discuss these remarkable satellite sensors later.

About the Lesson
This lesson is intended for the wide range of users involved with wildfire detection and monitoring — from land use managers and hydrologists to weather forecasters and researchers. Users are expected to have a basic understanding of satellite meteorology and remote sensing concepts.

The lesson is organized as follows:
- Section 2 (Satellite Imagers) describes the satellites and imagers used for detecting and monitoring the fire cycle.
- Sections 3 (Pre-Fire Monitoring and Post-Fire Analysis), 4 (Fire Detection and Monitoring), and 5 (Smoke & Aerosol Detection, Monitoring & Transport) examine the phases of the fire cycle and the associated products.
- Section 6 (Fire Product Suite) consolidates the product information presented in the lesson and also provides additional information, such as product derivation. This optional section can be used as refresher or reference material.
- Section 7 (Case Study) is an interactive activity that helps you integrate and apply what you have learned. The material is supplemented with observations from a National Weather Service trainer/forecaster who experienced the fire.
- The lesson ends with a summary and quiz.
Satellite Imagers
Satellite Detection of Fires
The keys to detecting fires are imagers onboard geostationary and polar-orbiting satellites that are sensitive to thermal emissions in the 4.0 micrometer shortwave infrared region. The sensors have channels in this range that can detect hotspots at varying spatial resolutions.
Although a 2.1 micrometer channel, which is available on some satellite imagers such as MODIS and VIIRS, can detect very hot fires, the 4.0 micrometer region is much more effective and widely used for the routine detection of small fires.

The graphic shows the U.S. and European satellites involved with monitoring the fire cycle. The previous generation of weather satellite sensors was not launched with fire monitoring in mind. In some cases, the capacity to detect hotspots was discovered only after the satellite became operational, as in the case of NOAA Advanced Very High Resolution Radiometer (AVHRR). Now visible and infrared sensors are explicitly designed with fire detection capability.

Geostationary and Polar-orbiting Satellites
Both geostationary and polar satellites are powerful fire-monitoring tools, each with its own capabilities and limitations.

Geostationary satellites provide excellent coverage over the tropics and midlatitudes (but not polar regions). The ability to image repeatedly over a fixed geographical region enables geostationary satellites to:
- Monitor the thermal signatures associated with fires
- Track smoke over thousands of kilometers
- Observe diurnal processes that affect fire behavior over many parts of the globe
- Through sequential observations, detect fires temporarily obscured by clouds
Most modern geostationary satellites have a shortwave infrared or 'fire' channel that is sensitive to heat sources on the ground.

In contrast, polar-orbiting satellites have:
- Higher spatial resolution (1 km or greater) for more detailed images
- More channels for better products in some cases, like that of the MODIS and the S-NPP and JPSS VIIRS imagers
- The ability to monitor high-latitude regions that have a surprisingly large number of fires

Geostationary Satellites
Let's compare geostationary vs. polar-orbiting satellite capabilities for a particular fire. This GOES-16 animation captured the development of the April 2018 Rhea Fire in Oklahoma.

The hotspots, detected using information from the GOES fire sensitive shortwave infrared channel, show fire locations. GOES loops cannot view the fires in great detail, especially at higher latitudes where geometric distortion is large. But GOES and other geostationary satellites have the advantage of frequent scanning, which allows us to view the evolution of a feature in increments as small as 1 minute.
The GOES-R Advanced Baseline Imager (ABI) has a temporal resolution of only 5 minutes during routine operations, and down to 1-minute intervals for high impact events. The combination of higher refresh rates and higher pixel resolution (2 km for the IR bands at satellite subpoint above the equator) improves the ability to anticipate and monitor rapidly changing wildfire conditions.
The GOES-R era also introduces a new capability that for the first time will allow monitoring of lightning strikes from geostationary satellites. The Geostationary Lightning Mapper (or GLM) makes continuous lightning measurements that enable wildland fire managers to identify potential fire ignitions in even the most remote fire risk areas, decreasing response time to new fires.

Polar-orbiting Satellites
Now let's view polar imagery of the 2001 Chisholm fire in Alberta, Canada, captured in its early stages. We'll look at four high-quality images from a two-hour period. This first image, from the DMSP OLS satellite, shows substantial low-level smoke from the growing Chisholm fire.

This NOAA AVHRR product was taken two hours later, with embedded hotspots overlaid in red on the visible image. The flat bubble in the center represents the massive pyroCb cloud that developed from the fire.

Two more DMSP images were taken only minutes later and show the advantage of frequent overpasses that comes from using polar-orbiting data at higher latitudes.


Polar Orbiters: Improvements with S-NPP and JPSS VIIRS
The Suomi NPP and JPSS (Joint Polar Satellite System) weather satellites are a part of the U.S. new-generation operational polar-orbiting satellite program. On board these satellites is the new Visible Infrared Imager Radiometer Suite (or VIIRS) sensor. VIIRS combines and improves upon the capabilities of the civilian NOAA AVHRR imager onboard previous-generation NOAA and Metop polar-orbiters, the MODIS imager on the NASA EOS Terra and Aqua satellites, and the military's DMSP OLS imagers.

Since its launch, VIIRS has demonstrated the ability to monitor all phases of the fire cycle. The new imager has sensing channels and capabilities similar to NASA's Terra and Aqua MODIS imagers, with a number of improvements and advantages.
- Additional ground-based receiving stations are reducing data latency (the delay between satellite imaging and delivery of data to users), resulting in more timely support; 99% of data will be delivered to users within 30 minutes in the JPSS era.
- Advanced scan engineering pioneered on the DMSP OLS (Operational Linescan System) imager in the 1970s has considerably improved image quality, especially near the edge of the swath.
- Finally, a Day-Night Band (DNB) has been added, providing a nighttime detection capability for fire and smoke, as well as other features whether lit by moonlight or other sources of visible light.
VIIRS has twenty two channels ranging from the visible to the longwave infrared, nearly all of which will have a role in monitoring the fire cycle.

Using channels at blue, green, and red wavelengths in the visible, VIIRS continues to provide the true color capability demonstrated by MODIS, which forecasters are increasingly using.

The Day-Night Band (centered at 0.7 micrometers) is a vast improvement compared to the nighttime capability on the DMSP OLS sensor.

Three channels, one in the visible (0.6 micrometers) and two in the near and shortwave infrared (0.9 and 2.1 micrometers respectively), are used to produce a variety of false color imagery products to view burn scars and other vegetation features.

Three channels (2.1 micrometers and two around 3.7 micrometers) are able to measure the hotspot energy (in the form of radiances) emanating directly from fires.

This final graphic shows all of the VIIRS channels involved in monitoring the fire cycle.

Satellite Application Table
This table compares fire cycle monitoring capabilities of U.S. and European operational and near-operational satellites and imaging instruments. Fire, smoke, and land applications are listed along the top, satellite instruments on the left. As you can see, the imagers on polar-orbiting satellites generally have more capability than those on geostationary satellites. But even among the polar-orbiting imagers, only the Suomi NPP and JPSS VIIRS are capable of performing all of the applications listed.

Pre-Fire Monitoring and Post-Fire Analysis
About the Section
This section introduces various qualitative and quantitative products used for pre-fire monitoring and post-fire analysis. For pre-fire monitoring, we will examine fire danger ratings from surface observations, true color imagery from the MODIS and VIIRS imagers, and greenness maps from NOAA AVHRR imagery. For post-fire analysis and monitoring, we will look at false color imagery from MODIS.
If you are unfamiliar with the concept of true color and false color imagery, it is recommended that you review the information below before proceeding. Note that the information is from the Fire Product Suite section.
True Color
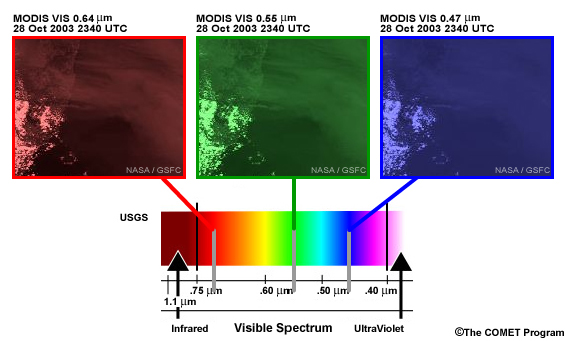
Description: A color combination image that combines channels corresponding to the red, blue, and green wavelengths typically centered near 0.65, 0.55, and 0.47 micrometers. For MODIS this corresponds to channels 1, 4, and 3, and for VIIRS channels M5, M4, and M3. The nature of the color combination for these products resembles what the human eye would see given the same scene.
Applications
- Is the optimal satellite product for the general interpretation of smoke and other large aerosols (e.g. smog, haze, dust, volcanic ash)
- Often reveals smoke where it cannot be seen on other products
- Reveals information about the landscape (mountains, chaparral, vegetation coverage, snow cover, water bodies, etc.), which adds important context for those forecasting, monitoring, or studying fires
- Red spots or red perimeters are often added, marking the location of likely fires based on thermal anomaly information derived from the combination of shortwave and longwave infrared channels
For more information, including examples, access the Fire Product Suite, MODIS and VIIRS True Color Imagery.
False Color
False Color Imagery
Description: A color combination corresponding to visible and near-infrared wavelengths for highlighting specific features of interest. The color combination described here is designed to distinguish live from burned or dead vegetation and bare ground. For MODIS, the product uses channels 7, 2, and 1 (2.1, 0.86, 0.65 micrometers). The VIIRS product uses nearly equivalent wavelengths represented by channels M11, M7, and M5. In this lesson, we refer to the combination as 'the false color product or image' even though it is one of many possible false color products. False color imagery differs from true color imagery in that it includes wavelengths (or channels) that fall outside the range of what the human eye would see.
Applications
- Shows burn scars in a brownish or brick red color; burn scars are often adjacent to a fire in progress, allowing forecasters to assess the availability of fresh fuel in the vicinity of an advancing fire
- Often conveys fire locations, especially active hot spots, as pink, orange, or shades of red
- Provides vivid depictions of landscapes and vegetation
For more information, including examples, access the Fire Product Suite, False Color Imagery.
Surface Observations for Fire Danger Ratings
The Fire Danger Rating level, shown here, is derived from surface observations. It takes into account current and antecedent weather, fuel types, and both live and dead fuel moisture. It can monitor trends in fire susceptibility for areas with reasonable data density, but in eastern Montana, where we'll be looking, reporting stations (shown by triangles) are sparse. Values between stations are interpolated, providing only a guess at actual vegetation moisture.

Monitoring Vegetation with True Color Imagery
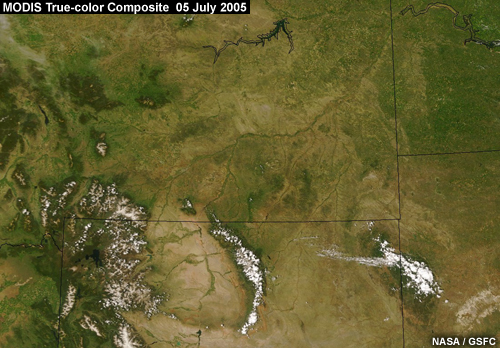
Fortunately, satellite observations can help us monitor broad areas to observe important changes in vegetation resulting from temperature and precipitation patterns (especially for grasses and shrubs). MODIS and VIIRS true color images convey vegetation browning qualitatively. Relatively high spatial resolution makes the images an excellent resource in observing transitions in vegetation characteristics. In this true color image, the vegetation is still relatively green for the northern Rockies and Plains in the early summer of 2005.
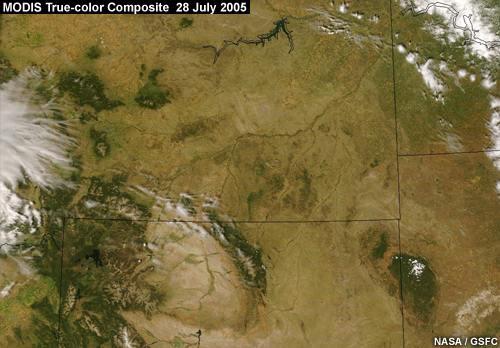
But after only a few weeks of hot, dry weather, this next true color image shows that the vegetation has browned, suggesting significant drying and possible fire danger. In the case study for the lesson, we'll see how another drying episode led to the outbreak of severe fires in the same region.
NOAA AVHRR NDVI-derived Greenness Products
The Normalized Difference Vegetation Index (NDVI) is a simple calculation that uses visible and near-infrared satellite measurements to depict the degree of "greenness" of Earth's surface as observed from space. NDVI products are typically composited weekly from NOAA AVHRR, MODIS, and VIIRS data and show vegetation trends more quantitatively than imagery alone.
The NDVI measures how dense and green plant leaves and grasses are, which indicates overall vegetative health and susceptibility to burning. The U.S. Forest Service derives three types of products from NDVI measurements for use in their Wildland Fire Assessment System (or WFAS).

In this section, we will examine the relative greenness product. The others are discussed in the Fire Product Suite, Section 6 of the lesson.
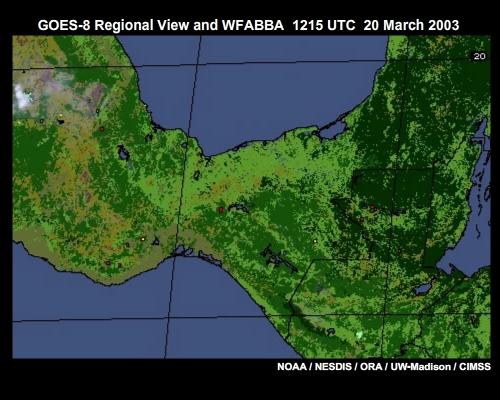
This relative greenness product corresponds to the early summer true color image we saw previously and compares vegetation greenness to a pixel's maximum greenness over the period from 1989 to 2003.

A value near 100% indicates that a pixel is nearly as green as its maximum historical greenness value. A value near zero indicates that the vegetation is very "brown" by comparison. Notice the green over Montana in early summer, indicating greener than normal vegetation and relatively low fire danger.

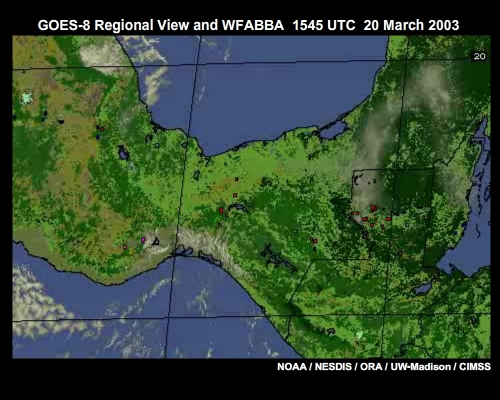
A few weeks later, the relative greenness map has turned from green to red and orange over much of the same region. This suggests a shift to browner and drier vegetation, which is similar to the trend we saw in the true color imagery.
Post-fire Scarring Using False Color Imagery
We have seen how true color images can depict trends in vegetation and therefore fire risk. Now we will see how false color images can help depict the aftermath of a fire.
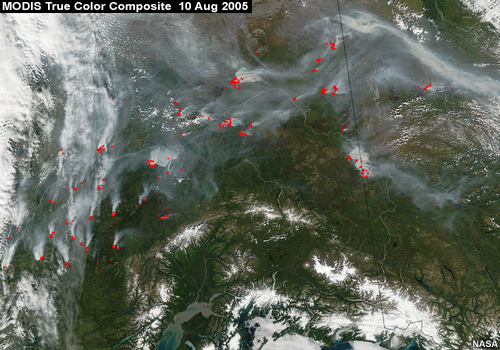
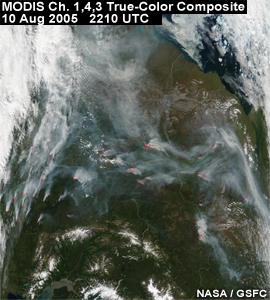
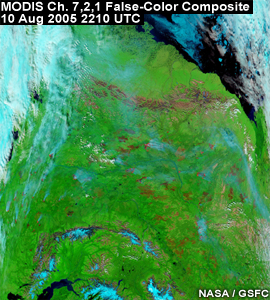
These true and false color images show Alaskan forest fires in August 2005. Notice how the smoke obscures the surface on the true color image, but not on the false color image. It is much easier to see burn scars from past fires on false color imagery. They appear as dark red or brown in high contrast to the green vegetation. Hover your mouse over the image to see both images. On touch screen devices, tap the image to see them both.
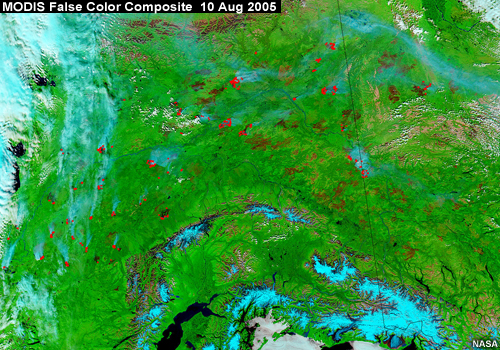
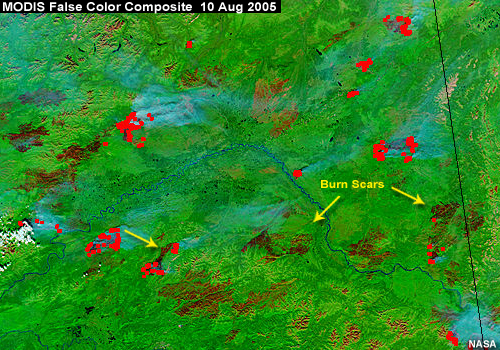
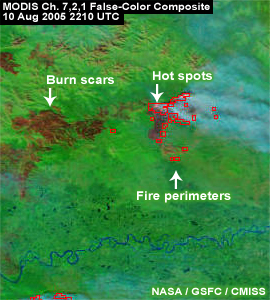
Here is a zoomed-in view of the false color image. The burn scars from past and still-burning fires are scattered across the landscape. These burn scars often depict regions with enhanced susceptibility to erosion, alerting hydrologists to the potential for future debris flows.
Section Summary
Products used for pre-fire monitoring:
Fire danger ratings are derived from surface observations. They can account for current and antecedent weather, fuel types, and live and dead fuel moisture. They can also monitor trends in fire susceptibility for areas with reasonable data density. Finally, values between stations are interpolated, offering only a guess at actual fuel conditions.
MODIS and VIIRS true color imagery conveys vegetation "greenness" qualitatively; the greener the scene, generally the lower the susceptibility to fires. Their high spatial resolution makes the products very useful in observing transitions in vegetation. For some products, fire locations are overlaid and appear in red, and smoke plumes appear in gray. In addition, smoke can obscure the surface, making it difficult to see burn scars and other surface features of interest.
NDVI-derived greenness maps are derived from the Normalized Difference Vegetation Index (NDVI). The NDVI measures how dense and green plant leaves and grasses are, an indication of overall vegetative health and susceptibility to burning.
Products used for post-fire analysis and monitoring:
MODIS and VIIRS false color imagery can see through smoke. Burn scars appear as dark red or brown, and alert officials about the potential for debris flows, plant succession, and invasive species.
Fire Detection and Monitoring
Detecting Fires
One of the more important roles that satellites play in regard to the fire cycle is to detect the very hot and often small actively burning fire.
Longwave infrared brightness temperatures, sensed between about 10.5 and 12 micrometers, usually provide fairly reliable estimates of, for example, cloud top, land surface, and sea surface temperatures. However, longwave remote sensing methods using today's weather satellites are extremely limited when it comes to fire detection.
For that, we rely on shortwave infrared sensing near 2 and especially 4 micrometers. These are spectral regions that are particularly sensitive to extremely hot, small fires, and where there is little absorption of infrared energy by atmospheric gases. The channels around 4 micrometers are sometimes referred to as "fire" channels.
In this section, we will discuss the use of longwave and shortwave infrared imagery in more detail, describe how fire channels detect fires smaller than the size of a pixel, and examine the various products and systems used for detecting and monitoring fires as well as smoke.
Shortwave vs. Longwave Imagery
This NOAA AVHRR shortwave infrared image covers the 2002 Rodeo-Chediski fire in Arizona. Warmer temperatures, including those of the fire, are white whereas colder features, such as high terrain, are dark.

Let's zoom in on the fire area and compare the shortwave infrared image with the longwave infrared image. Hover your mouse over the image to see both images. On touch screen devices, tap the image to see them both. We've overlaid terrain contours in yellow showing the fire on the northeastern slopes of the Mogollon Rim. Due to the shortwave channel's heightened sensitivity to extreme heat, fires stand out vividly as white, whereas the longwave image shows hardly a trace of fire signatures. The red and blue lines are the positions of temperature transects through the fires.


This graphic shows the satellite-sensed brightness temperatures across the line segment shown in the previous images. The shortwave trace in red shows a much higher sensitivity to fire than the longwave trace in blue, with temperature difference as large as 40°C. A simple shortwave-longwave channel differencing technique is a key parameter often used by fire detection algorithms. While most algorithms are more sophisticated, all rely on the differential response to fires in the shortwave vs. longwave channels.

Once identified by algorithms, fire hotspot areas are often overlaid on satellite imagery in red.

Sub-pixel Effect, 1
Satellite images are made up of small square-shaped picture elements called pixels. Suppose for a moment that a pixel represents an area approximately 1 by 1 km.
Question
What is the smallest burning object that could show up in one pixel on a shortwave infrared image similar to the one in the above image? (Choose the best answer.)
The correct answer is a).
A burning house or an even smaller object can be detected if the temperature is hot enough.
Sub-pixel Effect, 2
Let's examine how satellites detect active fires and smoldering areas that are smaller in size than a pixel and some of the limitations. Imagine that this is a field of satellite pixels imaged with an infrared shortwave channel. Assume that there are no active fires or smoldering areas, and that the pixels have a uniform satellite temperature of 300 K, or 27°C.
Now let's assume that there are fires burning in the scene.
The red shaded pixels in graphic #1 below indicate departures from the background temperature. In nearly all cases, this means that there is something very hot within the area represented by the pixel. It could be a wildland fire, a building on fire, routine agricultural burning, or a battlefield fire. Or it could be a hot exhaust plume from a cooling tower or a burning off of natural gas associated with an oil well. In general, it's nearly impossible to tell just by looking at the image in the absence of other information.
What we can say is that the hot feature is always smaller in size than the pixel and is often downright tiny. So never assume that the size of a hotspot pixel is the same as the size of a hot feature!
A number of hot, small fires may be contributing to the high temperature of a pixel (graphic #2). Or the satellite may not detect fires in a pixel (graphic #3), assigning it the same satellite brightness temperature as the surrounding pixels. This is called a "missed detection," which is caused by a fire that is too weak or small to register.
Sometimes pixels have elevated satellite temperatures but no fires in them. We see that in graphic #4, which is a close up view of the 28° red-shaded pixel in the lower left box in graphic #1. The elevated satellite temperature may be due to clouds that reflect sunlight, or sunglint off of water bodies. When features such as these mimick hot spots, they're called "false alarms."
We will see this subpixel effect in real data later in this section, where a satellite depiction of fires is compared to an analysis from aircraft.
Limitations in Fire Detection
Question
There are fundamental limitations on the ability of environmental satellites to monitor fires. Of the options below, click on those that are correct.
The correct answer is a) and b).
The size of the satellite footprint (area on the ground observed within a satellite instrument's field of view) is an important limitation, with larger footprints resulting in less detailed depictions of individual fires.

Cloud cover is another significant factor, since clouds can either partially or completely obscure a fire. Most satellites with a shortwave infrared detection capability can observe fires during both day and nighttime.

Another critical factor is the frequency of passes that a satellite makes over an area. Most polar orbiters observe a fixed location twice daily, once during daytime and once at night, with more frequent coverage at higher latitudes where image swaths overlap.
In contrast, geostationary satellites provide much more frequent coverage, including 1-minute coverage in mesoscale sectors, routine 5-minute scans for the contiguous United States, and routine 15-minute scans of the full disc. Geostationary satellites provide only limited coverage of polar regions due to the large viewing angles at higher latitudes but polar-orbiting satellites can help immensely in these areas.

DMSP OLS and VIIRS Nighttime Lights & Fires
Although wildfires are most active during daytime, they can occur at any time of day. The Operational Linescan System (OLS) onboard the polar DMSP satellites since the 1970s, has revealed important information about fires at night through the use of a nighttime visible channel. The VIIRS imager provides additional nighttime detection capabilities. This nighttime visible VIIRS image shows lights from fires in Oklahoma. The city lights blend in with the fires in this image, making it challenging to distinguish fires from urban areas.
By eliminating pixels known to be from artificial light sources, we obtain another fire identification product that isolates the fires in red. This example is from fires in southern California. A terrain height overlay in white gives viewers additional context.

Flames can often be distinguished from other lights through context without additional processing. For example, if you know that gas flares are common in the northern Persian Gulf, it is easy to identify them on DMSP OLS nighttime images. Additionally, if you are acquainted with the major roadways in a region, you may be able to identify the associated lighting system.

The VIIRS imager launched on board the S-NPP satellite in 2011, continues the low-light sensing capability with a Day-Night Band (or DNB). The DNB incorporates significant improvements in resolution and sensitivity. For more information, visit the COMET lesson Advances in Space-Based Nighttime Visible Observation, 2nd Edition.
Here is a comparison of the same scene as viewed by both the OLS and the newer VIIRS Day-Night Band. The images were taken on consecutive nights in November 2012, shortly after the activation of the VIIRS imager. Notice how much better VIIRS is able to capture the details of cities, villages, and highway lights as seen near Delhi, India. Hover your mouse over the image to see both images. On touch screen devices, tap the image to see them both.


MODIS and VIIRS True and False Color Imagery
Let's take a more operational focus now, and examine products and systems used for detecting and monitoring fires. We'll start with true color imagery and a particular variation of a false color product, both derived from MODIS and VIIRS observations. These products are increasingly available via the Internet in near real-time, and are becoming more popular with land use managers, hydrologists and forecasters.
True and false color images are both created by combining multiple imager channels to arrive at products with more information than the individual channels would provide.
Question
Hover your mouse over the image to see both images. On touch screen devices, tap the image to see them both.
Comparing these true and false color images from the 2003 southern California fires, what general statements can you make? (Use the selection box to choose the answer that best completes the statement.)
Fire hotspots can be detected in this false color image due to the inclusion of the fire-sensitive 2.1 micrometer channel. The hotspots appear as pink or orange dots. Smoke is much more transparent in the false color image (due to the absence of a shortwave visible channel), allowing viewers to more easily see terrain or water surfaces underneath. Burn scars show the history of recent fires and can be seen more distinctly on the false color image. That's because this particular false color product incorporates visible and near infrared channels sensitive to soil and vegetation characteristics.
False and True Color Closeups
Here are closeup views of the true color and false color images from the same MODIS pass.
Fire perimeters (shortwave and longwave IR detected thermal anomalies) have been added in red using information from the 4 micrometer spectral region. In the false color image, fires are shown in two ways:
- By direct detection due to the 2.1 micrometer channel (orange dots)
- Based on 4 micrometer data (red perimeters)


False Color vs. Aircraft Data
Now let's compare the false color image to a composite of aircraft observations imaged in the 8 to 12 micrometer infrared region and valid at about the same time.
Question
Notice that the pattern is the same but that the red fires shown by the aircraft data are much smaller in area than those shown by the satellite in orange. What might cause this discrepancy? (Choose all that apply.)
The correct answer is c).
We're seeing the subpixel effect at work in real data. Satellite depictions always overestimate the size of fires. Aircraft data are the preferred analysis tool for very intense established fires.
Hazard Mapping System
On the following pages we will examine several methods and systems used to produce fire products including:
- The Hazard Mapping System (or HMS), which is an analyst-integrated fire and smoke product
- The Fire Detection and Characterization (or FDC, formerly WFABBA) product, which uses GOES-R ABI imager data to derive a fire mask (identify fires), map pixel values identifying fire temperature, fire radiative power (FRP), and fire area
- The Global Imagery Browse Services (GIBS), which includes fire detections from NASA instruments
- The MODIS U.S. Forest Service Active Fire Map, which shows fire detections over many parts of the United States in near real time
NOAA's Hazard Mapping System (HMS) is an interactive multiplatform system for analyzing hot spots and smoke plumes from possible fire locations in near real-time. A blended product is produced using output from automated fire detection algorithms that operate on geostationary and polar-orbiting satellite data. NOAA-NESDIS analysts quality control the automated fire detections and manually outline significant smoke plumes based on interpretation of satellite imagery. The resulting displays of fires and smoke plumes are generated daily for all of North and Central America. Analyses are used by federal, state, and local agencies as well as private companies and universities.
To help them in the preparation of HMS products, satellite analysts view loops such as this shortwave infrared imagery from fires in Utah in June 2017.
They also look at GOES visible imagery such as this sequence showing smoke plumes from the June 2017 Utah fires.
Here is a sample HMS product from an active fire day. The red dots outlined in black are fire locations based on GOES, AHVRR, and MODIS input. The gray-shaded areas are smoke plumes.

GOES FDC and NASA GIBS
Automated systems, such as the GOES Fire Detection and Characterization (FDC) suite (also referred to as Fire/Hot Spot Characterization), are used to monitor large areas and routinely detect hundreds of fires at a time. For example, the FDC system generates fire detection information for the full disk view of the Western Hemisphere, which is very useful for forecasters.
The following example shows the GOES-16 FDC product for fires in Oklahoma. Geostationary satellites can be a powerful tool for monitoring the diurnal cycle of fire activity. Using current GOES satellites, FDC products are available every 5 and 15 minutes.

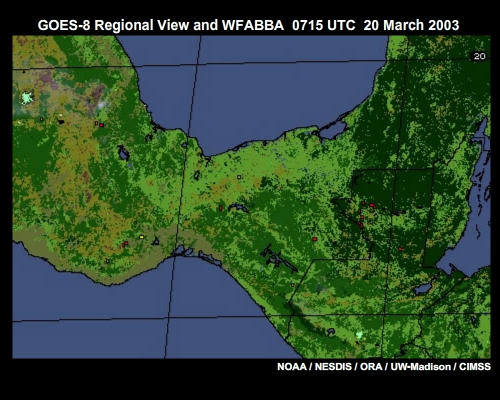
NASA's Global Imagery Browse Services (GIBS) provides daily fire detection maps and information across the globe in near real time. Here are some fire detections over Central America.

VIIRS Fire Detection
VIIRS represents a continuation of the fire monitoring capabilities established by the MODIS imager on board NASA's Terra and Aqua satellites. The new VIIRS imager detected its first fires in January 2012, not long after the launch of the Suomi NPP polar orbiter. The launch of JPSS-1 (NOAA-20) in November 2017 has provided additional VIIRS imagery. Here's an example VIIRS shortware IR image showing hot spots in Oklahoma, associated with an active grassland wildfire in the area.

Similar to the MODIS fire product, the VIIRS Active Fire product provides fire detections for regions across the globe in near real time. The VIIRS (left) and MODIS (right) overpasses shown here crossed over the same area in Idaho only 20 minutes apart as numerous wildfires raged on the ground. The images illustrate very good agreement in fire detections.

Because VIIRS observes at a higher spatial resolution than MODIS, especially toward the edge of a scan swath, VIIRS can detect smaller fires as well as fires at an earlier stage of development. As a result, fire management teams will have access to more detailed information on fire location and behavior.

The VIIRS Active Fire product provides more quantitative information through a parameter known as Fire Radiative Power (FRP). FRP is capable of indicating hot spot intensity and/or size. The example shown depicts individual hot spots within a much larger burn area, associated with a grassland wildfire burning in Oklahoma in April 2018. Each product pixel (or square) covers an area of about 375 by 375 meters.

U.S. Forest Service Active Fire Maps
The U.S. Forest Service's active fire detection maps provide easy-to-interpret summaries of satellite fire related information in near real time. These products are derived from both recent geostationary and polar-orbiting satellite observations, and are produced by the USDA Forest Service Remote Sensing Applications Center (RSAC). Fire product archives, burn scar data, and other land-based information are also available via a website portal.
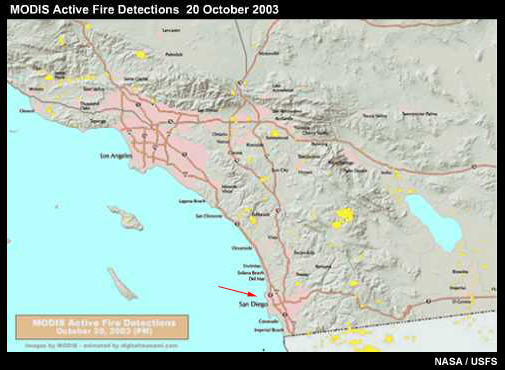


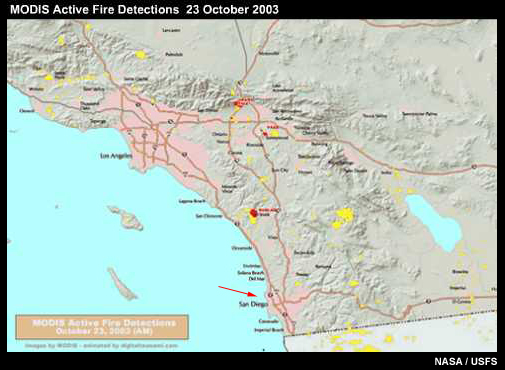
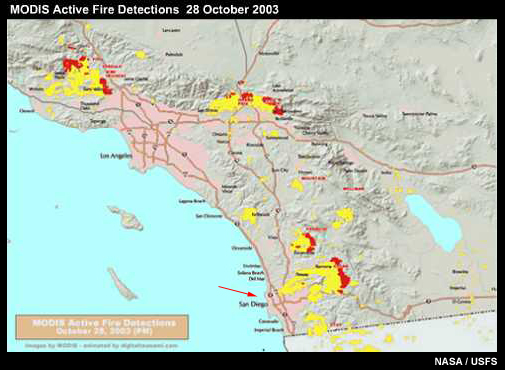
This animation corresponds to the 2003 southern California fires shown earlier. Red indicates fires burning within the last 12 hours; tan indicates burning in the last 24 hours; and yellow indicates burned areas since the beginning of the year.
Animating the scene shows the progression of fires over a nine-day period. Notice how the fires near San Diego race into populated coastal regions on 26 October under the influence of offshore winds.
Section Summary
Shortwave vs. longwave imagery for fire detection:
- Shortwave imagery is particularly sensitive to hot, small fires, whereas longwave imagery has an extremely limited ability to detect fires.
- The sub-pixel effect causes fires to appear much larger on satellite products than they may actually be.
- A missed detection is a very small or relatively cool fire that goes undetected on satellite imagery.
- A false alarm is when a person or an algorithm detects a fire that is not really there. Sunglint off of water surfaces or water clouds can contribute to the mistake.
Limitations on fire detection:
- Polar-orbiting satellites typically cover a fixed location twice daily, more frequently at higher latitudes; geostationary temporal coverage with GOES-R ABI imagimg is continuous: every 10 minutes (full Earth disk), every 5 minutes (over CONUS), and every 1 minute (over two 1000x1000 km moveable areas).
- Geostationary satellites do not cover near-polar areas well due to high viewing angles.
- The larger the satellite footprint (area viewed), the less detailed the fire depictions.
- Cloud cover can either partially or completely obscure fires.
Systems for detecting and monitoring fire:
- False color products highlight burn scars. They often convey fire locations when a shortwave IR channel is incorporated. In addition, they provide vivid depictions of landscapes and vegetation conditions, helping users assess the availability of fuel near an advancing fire.
- True color products reveal information about the landscape (mountains, chaparral, snow cover, land cover, water bodies, etc.), which adds context for those forecasting or monitoring fires.
- Red spots or red perimeters are often added, marking the location of likely fires based on information from infrared shortwave 'fire' channels.
- True color products are the optimal satellite product for the general interpretation of smoke and other aerosols; they often reveal reveals smoke where it cannot be seen in other image-based products.
- The NOAA-NESDIS Hazard Mapping System (HMS) is an analyst-integrated fire and smoke product.
- The Fire Detection and Characterization (FDC) product provides automated fire detection and characterization from GOES-R satellites.
- The NASA GIBS provides quick access to fire data globally.
- The VIIRS Active Fire Product provides automated global fire detections using the Suomi NPP and JPSS VIIRS imagers.
- U.S. Forest Service Active Fire Maps show fire detections over many parts of the United States in near real time using data from GOES, AVHRR, MODIS, and VIIRS imagers.
- The ability of satellites to detect fires allows for the analysis and forecasting of smoke.
Smoke & Aerosol Detection, Monitoring & Transport
Section Overview
The manual identification of smoke on satellite images has traditionally been a tricky process. Looking at this GOES image, can you tell what's smoke from a forest fire, vs. cloud or land surface? It's easy to make a mistake.

The summer of 2012 saw drought and near record wildfire activity throughout the western U.S. Take a look at this VIIRS true color image showing portions of the Pacific Northwest around 1 PM local time on September 19, 2012. A huge smoke plume from the large Table Mountain fire complex in Washington is clearly seen streaming eastward. Smoke from numerous other fires in Washington and Idaho is also evident, appearing in shades of gray and white against a more naturally colored background. True color imagery makes it easier to distinguish smoke from surrounding features when compared to single channel images.

In this section, we will illustrate some of the basics of smoke detection and interpretation, and investigate methods for forecasting smoke transport.
Visible Animations
This visible animation of a fire that reveals a lot about smoke behavior in mountainous terrain. Many fires tend to die down at night and in the early morning, producing little new smoke. However, the smoke is often trapped in a very stable layer within mountain valleys (a nocturnal inversion), making smoke coverage greater in the morning. This is especially true in steeper valleys and can make it difficult to locate hot spots and assess fire activity. As the day progresses, the atmosphere typically destabilizes, winds increase, and smoke plumes erupt convectively. Visibilities often improve, except in the vicinity of thick plumes associated with active fires.

Vis vs. IR
Let's compare a pair of morning NOAA AVHRR images on the same day to illustrate how visible and infrared images differ.
On the visible image, smoke plumes from the Rodeo Chediski wildfire complex can be seen in shades of white, clearly distinguishing the smoke from the darker background.

But on the longwave infrared imagery on the right, the smoke is much less distinct because the land is still at a relatively cool temperature and the cool smoke disappears against it. In addition, smoke itself is highly transparent at infrared wavelengths. These factors make infrared imagery less useful than visible imagery for viewing smoke.

Black & White vs. True Color Imagery
Question

This single channel visible image over Iraq contains a lake and an oil smoke plume. Can you identify them? (Select the best answer.)
The correct answer is b).
The features are difficult to differentiate because both absorb solar radiation at visible wavelengths, giving them the same intense shade of black, in black and white imagery. True color imagery can help clarify this type of situation that presents subtle variations of solar absorption and reflection. The water in the lake now appears blue, whereas the oil smoke appears black. The true color image also reveals an environmentally damaging feature that was hidden within the black and white image, a toxic sulfur plume from a factory accident. Due to disparate scattering and absorption properties, the white sulfur smoke contrasts sharply with the black oil smoke in true color imagery.

Smoke Detection at Night
Nighttime visible technology is one of the few means by which smoke can be detected at night. When there is sufficient moonlight to provide illumination (quarter moonlight or greater), nighttime visible imagery reveals smoke plumes, as shown in this DMSP OLS image of the Rodeo Chediski wildfire. The quality of the image is somewhat poor due to the sensing limitations of the older nighttime imaging technology. Therefore, the OLS has not been widely used for fire and smoke detection.

The 2011 launch of the VIIRS imager on board the Suomi NPP satellite, however, has ushered in a new era for observing nighttime fire and smoke. Significant design improvements have resulted in a Day-Night Band that is several times more sensitive than the forerunner OLS. The Day-Night Band also observes over a smaller footprint, 740 meters vs. 2.7 km for the OLS. This means that VIIRS is far better at resolving small-scale features as we can see in this image comparison. Hover over the image and move the slider to view both images. On touch screen devices, tap the image sides.


VIIRS captured this stunning nighttime view of wildfires and smoke plumes in Idaho and Montana on August 29, 2012. Numerous hot spots from the Mustang Complex Fire are visible in northern Idaho. Notice the thick smoke plume as it extends northeastward from the brightest fires near the Idaho-Montana border. We can also see the Halstead and Trinity Ridge fires to the south. In addition to the fires, city lights from Boise and other smaller cities appear throughout the image. Cloud cover is located west of the Mustang Complex, over southeastern Washington and northeastern Oregon. The moon was in its waxing gibbous phase when the image was taken, meaning it was between half and full illumination.

Zooming in on the large Mustang wildfire reveals the tremendous detail afforded by the VIIRS enhanced 740 meter resolution day-night band. The day-night band's increased sensitivity captures reflected moonlight from not only the dense Mustang smoke plume, but from thinner smoke produced by smaller fires nearby and from more distant fires.

Smoke Forecasting
Now we'll examine several systems used to predict smoke events and forecast smoke advection. You will notice that many of these systems are the same ones used for detecting and monitoring fire. That's because fire locations must be identified before smoke effects can be anticipated.
We'll start by examining the NOAA-NESDIS Hazard Mapping System (HMS). This system has two main functions: 1) It determines the current locations of fire and smoke, and 2) It initializes the HYSPLIT model used for computing dispersion and transport of smoke; HYSPLIT is the HYbrid Single-Particle Lagrangian Integrated Trajectory model used by the National Weather Service as part of the Air Quality Forecast System. (For more information on HYSPLIT, visit the COMET lesson HYSPLIT Applications for Emergency Decision Support.)
Analysts start with images and loops like these of fires in Utah. GOES-R ABI imagery is be better able to capture rapid changes in fire intensity as a result of its higher resolution and more frequent 1-minute or 5-minute imaging. The different channels reveal different features related to fire characteristics.


Analysts review output from fire detection algorithms to check for false-detections and identify fires that may be producing smoke. Here's an example from agricultural fires in Kansas, where the imagery shows both fire and smoke detections.

The locations of fires generating smoke plumes are then assimilated into the HYSPLIT model, which forecasts smoke trajectories and concentrations. This graphic shows the HYSPLIT model's forecast for the next morning with smoke in blue. There is good agreement with the analyst-drawn smoke (shown in red) valid for the same time.

Automated Smoke Forecasting
For relatively small areas, the human-machine mix of NOAA's Hazard Mapping System makes sense. However, for broader or global regions, a fully automated scheme is needed to initialize a model that can generate smoke forecasts in a timely fashion. This requires the automatic detection of fires and accurate estimates of smoke emissions.
To illustrate a fairly typical approach, we will examine the U.S. Navy's scheme, which has four steps:
- Identifying fires: using FDC or similar products
- Estimating smoke output: using the FLAMBE program (FLAMBE stands for Fire Locating and Modeling of Burning Emissions)
- Forecasting smoke advection downwind: using the NAAPS model (NAAPS stands for Navy Aerosol Analysis and Prediction System)
- Forecasting aerosol optical thickness: also using the NAAPS model
Note that optical thickness (or optical depth) is a dimensionless quantity that indicates the amount of depletion that a beam of radiation undergoes as it passes through a layer of the atmosphere. Optical thickness is a function of the density, composition, temperature, pressure, and volume of the layer. (Definition from AMS)
Case Example
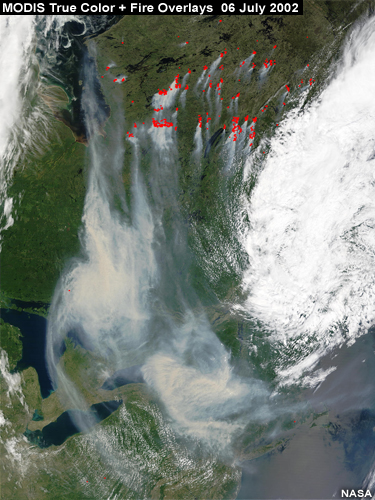
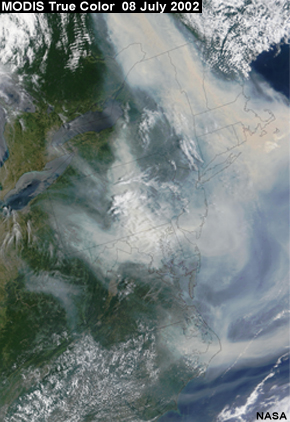
Let's look at a case from eastern Canada that started on July 6, 2002, a day of intense fire activity. Numerous fires appear on this MODIS true color image, marked by red dots generated from shortwave and longwave infrared channels. The fires are generating intense smoke plumes, which have already impaired visibility hundreds of kilometers downwind. The broad impact of the smoke results from a combination of large, abnormally intense fires and an ideal meteorological transport scenario that keeps the smoke relatively concentrated while moving it quickly across the continent.
FDC and FLAMBE
Here is an example of the fires detected by the FDC algorithm based on GOES-16 data.
Following a fire detection, the FLAMBE program is then used to determine how large the detected fires are, estimate their temperature, and determine how much fuel is available—all in an effort to predict the amount of smoke that will result. FLAMBE is being continually improved as more is learned about fuels and fire behavior. Additional benefits to smoke forecasting are expected as new observing satellites come online during the next decade. Some of these new systems include the VIIRS imagers on board current JPSS satellites, the GOES-R ABI imager, and an advanced imager on board the Meteosat Third Generation satellites.

This sample FLAMBE six-hour fire summary is from a different day, June 28, 2007. Note that the fire indicators are larger than actual fire size.
You can view FLAMBE and NAAPS products in GOOGLE Earth by visiting http://www.nrlmry.navy.mil/aerosol_web/.
Forecasting Smoke and Aerosol Optical Thickness Using NAAPS
The NAAPS model forecasts the spread of smoke conditions using a specialized model of smoke transport and evolution. NAAPS runs in tandem with the NOGAPS global weather model and gets smoke source inputs from FLAMBE. NAAPS then calculates the transport of dust, smoke, sulfate, and sea salt aerosols.
This NAAPS smoke analysis was produced for July 6, 2002. It shows a large smoke region in blue heading right for the U.S. eastern seaboard. Three kinds of aerosols are represented in the color bar: sulfates in yellows and oranges; dust in shades of green; and smoke in shades of blue.

NAAPS forecast the plume to move into New England, the Mid-Atlantic States, and over the offshore waters over several time periods. This 48-hour forecast shows a thick pall of smoke over enormous areas of the U.S. East Coast. Even so, the system under forecast the smoke to some degree when compared to other satellite estimates.

This true color image from the same day shows the thickness and extent of the smoke from the Canadian fires.
Section Summary
Satellite imagery
- Visible imagery is much more useful for identifying and viewing smoke than infrared imagery.
- Improved nighttime visible imaging technology, as with the VIIRS Day-Night Band on board Suomi NPP and JPSS satellites, enables smoke detection at night given sufficient lunar illumination.
- Smoke can be detected more readily in true color imagery than in any single visible channel image.
Model-generated smoke forecasts
- Model generated smoke forecasts are produced based on the positions of known fires.
- They are used to anticipate hazardous air quality with a lead time of hours to days, enabling the timely issuance of public advisories.
- Model generated smoke forecasts can predict degraded visibilities globally.
Analysis and forecast systems:
- The U.S. Navy Aerosol and Prediction System (or NAAPS) forecasts smoke transport and aerosol optical thickness (aerosol concentration).
- The NOAA-NESDIS Hazard Mapping System (or HMS) determines the locations of fires and smoke using an analyst and algorithm mix. Data from this system is used to initialize the HYSPLIT model to forecast smoke trajectories.
- The HYSPLIT (HYbrid Single-Particle Lagrangian Integrated Trajectory) model forecasts smoke dispersion and trajectories.
- The GOES-R Fire Detection and Characterization (FDC) product uses ABI imager data to map detected fires (also known as the fire mask), pixel values identifying fire temperature, fire radiative power (FRP), and fire area.
- The FLAMBE program, a joint U.S. Navy, NASA, NOAA, and University of Alabama effort which stands for Fire Locating And Modeling of Burning Emissions. FLAMBE draws on existing sources like FDC and NAAPS to locate and characterize fires, estimate smoke emissions, and forecast smoke concentrations and transport.
Fire Product Suite
Introduction
This section, the Fire Product Suite, consolidates the product information presented in the lesson and contains additional information, such as product derivation. Each product has a description, list of applications, one or more examples, information about the product's derivation and anticipated improvements with the VIIRS and GOES-R ABI imagers, and Internet links.

Example VIIRS derived imagery: Day Land Cloud Fire RGB
The section is optional. It is intended for those who want to reinforce what they have learned, access product information directly (not in the context of the fire cycle), or learn more about the products.
Fire Danger Rating Product
The Fire Danger Rating is a widely used U.S. Forest Service product to aid in predicting the potential for wildfires. Based on surface observations of fuels, it can be compared to satellite greenness products to infer fire susceptibility. Greenness maps or imagery are derived from NDVI (Normalized Difference Vegetation Index) data, which can be obtained from current AVHRR, MODIS, VIIRS, Meteosat, and GOES-R ABI (Advanced Baseline Imager).
Applications:
- A primary product used to assess the risk of fire outbreaks
- Can be supplemented by satellite greenness products in regions lacking surface reports
Example: The triangles mark the locations of reporting stations used to analyze fire danger. Where they are sparse, for example over Montana, satellite products play an important supplementary role.

Derivation: A Fire Danger Rating level takes into account current and antecedent weather, fuel types, and both live and dead fuel moisture from station reports. It is less valid in regions with fewer reports.
Suomi NPP, JPSS VIIRS, and GOES-R ABI: Satellite observations are supplemental only, as the product is based on surface station reports.
Link:
- USFS Wildland Fire Assessment System: http://www.wfas.net/
Satellite-derived NDVI Greenness Maps
Description: There are three types of greenness maps, all of which are currently composited weekly from 1.1-kilometer AVHRR and 375-meter VIIRS data. The maps are derived from the Normalized Difference Vegetation Index (NDVI), which measures how dense and green plant leaves are. (This indicates overall vegetative health and susceptibility to burning.)
The U.S. Forest Service currently derives its greenness maps using AVHRR observations collected since the late 1980s. This forms a valuable reference dataset for historical comparisons and deriving the products described here.
- Visual greenness maps
- Portray vegetation greenness compared to a very green reference such as an alfalfa field
- Similar to what you would expect to see from the air
- Normally dry areas are never as green as areas that are typically wetter
- Relative greenness maps
- Portray how green vegetation is compared to how green it has been historically over a particular period of time (the period 1989-2003 is currently used)
- The browner (or less green) the vegetation, the higher the fire risk tends to be
- Because each pixel is normalized to its own historical range, all areas (dry to wet) can appear fully green at some time during the growing season
- Are useful indirect measures of fire risk in data-sparse areas
- Are used for spotting local trends in fire susceptibility
- Departure from average greenness maps
- Portray how green each pixel is compared to its average greenness for the current week based on historical weekly data (the period 1989-2003 is currently used)
Applications:
- Used to detect areas with possible susceptibility to fires (areas appear red or yellow)
- Useful in regions without surface observations
- Can supplement surface-derived products in data sparse areas
Example: Relative greenness maps
Red shades indicate low levels of greenness compared to historical greenness, whereas greens indicate high levels. In this example, we see low values of relative greenness over Iowa and high values over much of the Deep South.

Derivation: The greenness products are based on the NDVI, which is derived from NOAA AVHRR and JPSS VIIRS satellite observations. NDVI is an indicator of the amount of photosynthetically active radiation being reflected by a plant's chlorophyll pigment within the green portion of the visible spectrum.

NDVI is calculated as a difference between visible (red wavelength region) and near-infrared light reflected by vegetation. Healthy vegetation absorbs most of the visible light and reflects a large portion of the near-infrared light that it receives. In contrast, unhealthy and/or sparse vegetated surfaces reflect more visible light and less near-infrared light. Note that the data on the graphic are representative of conditions within a satellite footprint, but that real vegetation is, of course, far more varied.
Suomi NPP and JPSS VIIRS Improvements: Compared to NOAA AVHRR, the VIIRS imager has higher spatial resolution and more spectral channels for an improved characterization of vegetation greenness and perhaps vegetation moisture.
Links:
- USFS Wildland Fire Assessment System: http://www.wfas.net/
- NESDIS STAR Global Vegetation Health Products (AVHRR, MODIS, and VIIRS NDVI products in near real time): http://www.star.nesdis.noaa.gov/smcd/emb/vci/VH/index.php
- NDVI tutorial: http://earthobservatory.nasa.gov/Library/MeasuringVegetation/
Satellite-derived Active Fire Maps
Description: Easy-to-interpret maps showing the locations of fires and burned areas along with highways, cities, and other geographical markers. "Fire Detection Maps" are daily summaries of fire locations and coverage as detected by MODIS, VIIRS, AVHRR, or GOES satellites. Fire detections are shown for the past 6, 12, and 24 hours, as well as for cumulative fire activity since the beginning of the year. An interactive "Fire Detection Viewer" also provides fire specific information such as fire name, latitude and longitude, acres burned, and date the fire was first reported.
Applications:
- Serves as a briefing tool for anyone wanting accurate summaries of fire conditions
- Appropriate for inclusion in briefings and reports
- An online archive allows access to past data
Example: Product sequences, such as this one showing southern California in 2003, make it easy to see the progression of fires. Yellow indicates recently burned areas; red indicates active fires.

Derivation: The products are compiled at the USDA Forest Service (USFS) Remote Sensing Applications Center, in cooperation with NASA Goddard Space Flight Center, the University of Alaska-Fairbanks, the University of Maryland, the National Interagency Fire Center, and the USFS Missoula Fire Sciences Lab. Each set of maps contains satellite-derived active fire detections for the 24-hour period preceding the specified time. The maps are produced and updated several times each day.
Suomi NPP and JPSS VIIRS Improvements: VIIRS higher spatial resolution increases the likelihood and accuracy of fire detections, especially toward the edge of the scan swath. An expanded swath width also eliminates gaps between orbits. With decreased data latency, products will be available sooner in support of emergency situations.
Links:
- USDA Forest Service Active Fire Mapping Program: https://fsapps.nwcg.gov/afm/
Fire Detection Algorithms and Products
Description: Several algorithms are available to identify fire locations from satellite observations. None is completely accurate; sometimes they fail to detect fires or detect too many fires, also known as false detections. Most are fully automated, although some involve human input for additional quality control.
- GOES-R Fire Detection and Characterization (FDC) Product: Automated fire detection and characterization from GOES-R satellites including a fire mask, pixel values identifying fire temperature, fire radiative power (FRP), and fire area.
- Global Imagery Browse Services (GIBS): Provides rapid access to global fire data derived from the MODIS imagers on board NASA's Aqua and Terra polar-orbiting satellites. The site includes an online fire mapping tool, the "Web Fire Mapper" that plots fire detections generated by the Fire Information for Resource Management System (FIRMS)
- NOAA-NESDIS Hazard Mapping System (HMS): Analyst quality controlled fire and smoke products that utilize the three automated fire detection algorithms listed above. Analysts can specify additional fires. The products are used by government agencies, private companies, and universities
- VIIRS Active Fire Product: Fire detections in near real time for regions around the world using data from NASA-NOAA's Suomi NPP VIIRS imager launched in October 2011 and from the JPSS-1 (NOAA-20) VIIRS imager. Additional VIIRS instruments are planned for follow-on JPSS polar-orbiter missions
Applications:
- Fire locations are overlaid on images or maps, such as MODIS and VIIRS true and false color imagery, and distributed to various users
- Fire detections are used to estimate smoke and trace gas emissions for transport and dispersion forecasts
Detections are shown as red dots in this loop of Central America, based on automated fire detections from pre-GOES-R generation GOES satellites, NOAA polar orbiters, EUMETSAT, JMA, and KMA satellites.


Example: Global Imagery Browse Services (GIBS)
Detections appear in red on this MODIS true color imagery over Australia.
Example: HMS fire detections
Detections are shown in red on this map of fires in southern California.
Example: VIIRS active fire detections
Multiple fires detections appear in red on this VIIRS true color image over the southeastern U.S. on April 12, 2012. The large plume of smoke drifting toward the Gulf of Mexico is associated with the County Line fire in northern Florida.

Derivation: The automated processing of digital multispectral satellite data is key to creating these products. Note that the NOAA-NESDIS HMS system output is quality controlled by a person.
Suomi NPP and JPSS VIIRS Improvements: In addition to the traditional shortwave fire channels carried by NOAA AVHRR and MODIS, VIIRS has the Day/Night Band (DNB), which significantly enhances satellite detection of nighttime fires.
GOES-R Improvements: The ABI imager includes a higher resolution 2 km shortwave fire channel, produces more frequent 1 to 5-minute scans, and provides more accurate pixel geolocation, improving estimates of hot spot sizes, temperatures and trends.
In addition, the GOES-R Series Geostationary Lightning Mapper (or GLM) takes continuous lightning measurements, enabling wildland fire managers to identify potential fire ignitions in fire risk areas, decreasing response time to new fires.
Links
- FDC (GOES Fire Detection and Characterization products): https://www.ncdc.noaa.gov/data-access/satellite-data/goes-r-series-satellites#FDC
- NASA Global Imagery Browse Services (GIBS): http://rapidfire.sci.gsfc.nasa.gov/
- FIMMA (Fire Identification Mapping and Monitoring Algorithms): http://www.ssd.noaa.gov/PS/FIRE/Layers/FIMMA/fimma.html
- HMS (NOAA-NESDIS Hazard Mapping System): http://www.osdpd.noaa.gov/ml/land/hms.html
- VIIRS Fire Detections: https://earthdata.nasa.gov/earth-observation-data/near-real-time/firms/viirs-i-band-active-fire-data
Geostationary and Polar-orbiting Animations
Description: Sequences of images showing fire hotspots and smoke
Applications:
- Helping to locate new fires
- Viewing trends in fire hotspots
- Watching the evolution of smoke plumes
Example: Polar-orbiting satellite imagery loops
Satellite loops are often made from sequences of geostationary satellite images. But polar-orbiting satellites can provide effective loops as well, particularly at higher latitudes where there can be significant overlap between consecutive orbits. The animation shows four days of polar NOAA S-NPP and JPSS-1 VIIRS Fire Temperature RGB images for wildfires in Alberta, Canada, from 18-21 May 2019. Though there are time gaps between the images, the sequence tells an important story of how the fires spread. The RGB composite imagery is also very useful for assessing night-time fire activity.

Example: Geostationary satellite imagery loops
Images from geostationary satellites produce smoother animations than those from polar-orbiting satellites due to the shorter time interval between scans. The animation shows GOES-16 imagery of fires in Idaho and Montana in September 2017. The orange and red hotspot areas are clearly visible, as is the smoke generated by these fires.
Suomi NPP and JPSS VIIRS, and GOES-R ABI Improvements: With decreased data latency, VIIRS imagery is available more quickly to forecasters, and loops can be constructed with channels of higher spatial resolution.
Links: FDC (GOES Fire Detection and Characterization)
MODIS and VIIRS True Color Imagery
Description: A color combination image that combines channels corresponding to the red, blue, and green wavelengths typically centered near 0.65, 0.55, and 0.47 micrometers. For MODIS this corresponds to channels 1, 4, and 3, and for VIIRS channels M5, M4, and M3. The nature of the color combination for these products resembles what the human eye would see given the same scene.
Applications
- Is the optimal satellite product for the general interpretation of smoke and other large aerosols (e.g. smog, haze, dust, volcanic ash)
- Often reveals smoke where it cannot be seen on other products
- Reveals information about the landscape (mountains, chaparral, vegetation coverage, snow cover, water bodies, etc.), which adds important context for those forecasting, monitoring, or studying fires
- Red spots or red perimeters are often added, marking the location of likely fires based on thermal anomaly information derived from the combination of shortwave and longwave infrared channels
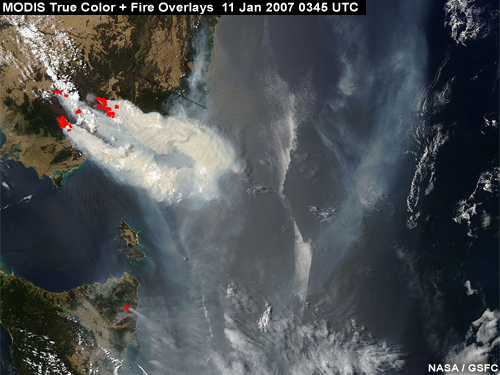
Example: This MODIS true color image shows blowing dust and smoke from the east coast of Australia. It is easy to distinguish the smoke plume from the large area of blowing dust. In contrast, smoke from burning vegetation appears relatively white, reflecting the red, green, and blue components of visible light in relatively equal amounts. Clouds are easily separated from the suspended dust in true color imagery and appear white for much the same reason. A small group of red pixels indicating hotspots or fires appears at the western end of the smoke plume. These were inserted after the channel compositing took place, using information from the thermally sensitive shortwave infrared channels on MODIS.

Derivation: Like the newer Suomi NPP and JPSS VIIRS imager, the Terra and Aqua MODIS imagers have three visible channels that correspond closely to the red, green, and blue wavelengths within the visible spectrum.
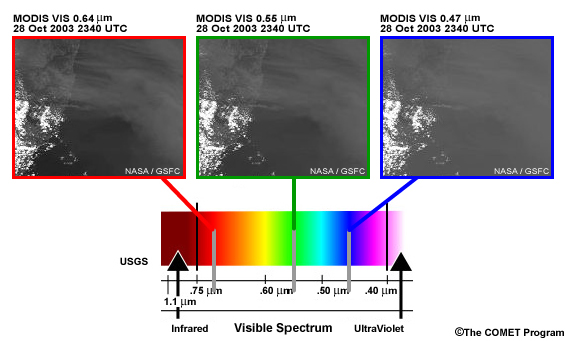
These channels are processed so that one color range is assigned to a particular wavelength region. Combining all of the color ranges produces what is known as true color imagery.
This VIIRS true color image taken on March 26, 2012 shows smoke plumes from fires burning across portions of the southeastern U.S.

Suomi NPP and JPSS VIIRS Improvements: The VIIRS channel images from which true color products are produced, are expected to arrive at data processing centers within 30 minutes after the satellite overpass.
GOES-R Series ABI Improvements: The GOES-R Series ABI's additional visible and near-infrared channels allow simulated true color imagery and fire related products to be produced for the full Earth disk every 10 minutes and across the continental U.S. every 5 minutes. 30-second and 1-minute imagery are available for two 1000x1000 km mesoscale sector areas during hazardous weather or other environmental events of interest, including during critical fire weather conditions (https://www.ospo.noaa.gov/Operations/GOES/schedules.html).
Links
- CIRA/RAMMB GOES-R RAMSDIS Online imagery: http://rammb.cira.colostate.edu/ramsdis/online/
- NASA Global Imagery Browse Services (GIBS): https://earthdata.nasa.gov/eosdis/science-system-description/eosdis-components/gibs
- USFS Imagery: https://fsapps.nwcg.gov/afm/
- CIMSS/SSEC MODIS Today (True and False Color Imagery over the continental U.S.): http://ge.ssec.wisc.edu/modis-today/
- NexSat (NRL Next-Generation Weather Satellite Demonstration Project): http://www.nrlmry.navy.mil/NEXSAT.html
- Suomi NPP/JPSS VIIRS imagery: http://rammb.cira.colostate.edu/ramsdis/online/npp_viirs.asp
False Color Imagery
Description: A color combination corresponding to visible and near-infrared wavelengths for highlighting specific features of interest. The color combination described here is designed to distinguish live from burned or dead vegetation and bare ground. For MODIS, the product uses channels 7, 2, and 1 (2.1, 0.86, and 0.65 micrometers). The VIIRS product uses nearly equivalent wavelengths represented by channels M11, M7, and M5. In this lesson, we refer to the combination as 'the false color product or image' even though it is one of many possible false color products. False color imagery differs from true color imagery in that it includes wavelengths (or channels) that fall outside the range of what the human eye would see. A nearly equivalent product from GOES-R ABI imager, known as the Day Land Cloud Fire RGB, uses bands 6, 3, and 2 (2.2, 0.86, and 0.64 micrometers).
Applications
- Shows burn scars in a brownish or brick red color; burn scars are often adjacent to a fire in progress, allowing forecasters to assess the availability of fresh fuel in the vicinity of an advancing fire
- Often conveys fire locations, especially active hot spots, as pink, orange, or shades of red
- Provides vivid depictions of landscapes and vegetation
Example: Compare the true color image with a false color image during an outbreak of forest fires in Alaska in 2005. The true color image gives an excellent view of smoke, whereas the false color enhances landscape features and individual fire elements.
Zooming in on the false color composite image, we see burn scars from current and recent fires. In addition, fire perimeters, based on the shortwave fire channel, mark the outer boundaries of hot regions. Individual fires appear in pink or orange.
Derivation: MODIS and VIIRS false color composites are made by combining information from three channels:
For MODIS:
- Channel 7 (2.1 micrometers assigned to red), a near-infrared channel capable of showing hot active fires
- Channel 2 (0.86 micrometers assigned to green), a near-infrared channel sensitive to vegetation conditions
- Channel 1 (0.65 micrometers assigned to blue), a visible channel sensitive to vegetation conditions
For VIIRS:
- Channel M11 (2.25 micrometers assigned red)
- Channel M7 (0.86 micrometers assigned green)
- Channel M5 (0.67 micrometers assigned to blue)
For GOES-ABI:
- Band 7 (2.2 micrometers assigned red)
- Band 3 (0.86 micrometers assigned blue)
- Band 2 (0.64 micrometers assigned green)
Notice the small white dots on the 2.1 micrometer image (red band on right), which are hotspots. Although the 4 micrometer region is usually thought of as the fire detection region, fires can also be detected on daytime 2.1 micrometer images, which is a key to making this combination successful.

How do we make these three bands easier to use as a forecasting product? If we combine the images by assigning each to a color input, using the red, green, and blue color model, salient features begin to pop out. Burn scars show up as brick red or brown, smoke appears bluish, and dense vegetation appears green. Fires appear bright red or orange.

Suomi NPP and JPSS VIIRS Improvements: The VIIRS channel imagery from which true color products are produced, are expected to arrive at data processing centers within 30 minutes after the satellite overpass.
GOES-R ABI Improvements: The GOES-R ABI's additional visible and near-infrared channels allow false color imagery and other fire related products to be produced for the full Earth disk at 10 minute intervals, and across the continental U.S. every 5 minutes. The mesoscale sector scanning ability allows 30-second and 1-minute imagery to be available for two 1000x1000 km areas during hazardous weather or other environmental events of interest.
Links
- CIRA/RAMMB GOES-R RAMSDIS Online imagery: http://rammb.cira.colostate.edu/ramsdis/online/
- CIRA/RAMMB Product Quick Guides: http://rammb.cira.colostate.edu/training/visit/quick_guides/
- NASA Global Imagery Browse Services (GIBS): https://earthdata.nasa.gov/eosdis/science-system-description/eosdis-components/gibs
- USFS Link to VIIRS Imagery: https://fsapps.nwcg.gov/afm/imagery_viirs.php
- USFS Link to MODIS Imagery: https://fsapps.nwcg.gov/afm/imagery.php
- CIMSS/SSEC MODIS Today (True and False Color Imagery over the continental U.S.): http://ge.ssec.wisc.edu/modis-today/
Smoke Forecasting Products
Description: Model-generated forecasts of smoke, which are produced based on the positions of known fires.
- U.S. Navy Aerosol Analysis and Prediction System (NAAPS): Forecasts smoke transport and aerosol optical thickness
- NOAA-NESDIS Hazard Mapping System (HMS): Determines the locations of fires and smoke using an analyst/algorithm mix; data are used to initialize the HYSPLIT model for smoke forecasting
- HYSPLIT (HYbrid Single-Particle Lagrangian Integrated Trajectory) model: Forecasts smoke dispersion and transport
- FLAMBE (U.S. Navy Fire Locating and Modeling of Burning Emissions) program: Estimates smoke output
- VIIRS Active Fire Product: Detects and characterizes fires; used for initializing smoke forecasting models (e.g., HRRR-Smoke model)
- NOAA National Weather Service Air Quality Forecast Guidance: Provides ozone, particulate matter, and other pollutant forecasts
- Joint NASA, NOAA, and EPA IDEA (Infusing Satellite Data into Environmental Applications) demonstration program: Produces 48-hour forecasts of aerosols and trajectories based on a blend of satellite and ground-based measurements, meteorological observations, and computer modeling.
Applications:
- Anticipating hazardous air quality from fires with a lead time of hours to days, enabling the timely issuance of public warnings
- Forecasting degraded visibilities over North America (using the NOAA Smoke Forecasting System) or globally (using NAAPS)
Example: HYSPLIT/HMS
The blue shaded areas are those forecast by the HYSPLIT model based on fires burning the day before. For comparison, the red-shaded area is the HMS analyst-drawn smoke analysis valid at the forecast time.
Example: NAAPS
This product shows the NAAPS forecast of a smoke plume over the northeastern United States and offshore waters. Smoke magnitudes appear in shades of blue. The units are aerosol optical thickness.
Example: IDEA Program
This animation shows a 48-hour forecast of aerosol optical depth (a measure of aerosol concentration) and trajectories over the continental U.S. Cloud cover appears in shades of gray. Most notable are the plumes of smoke carried eastward by westerly winds from wildfires burning in the western U.S.


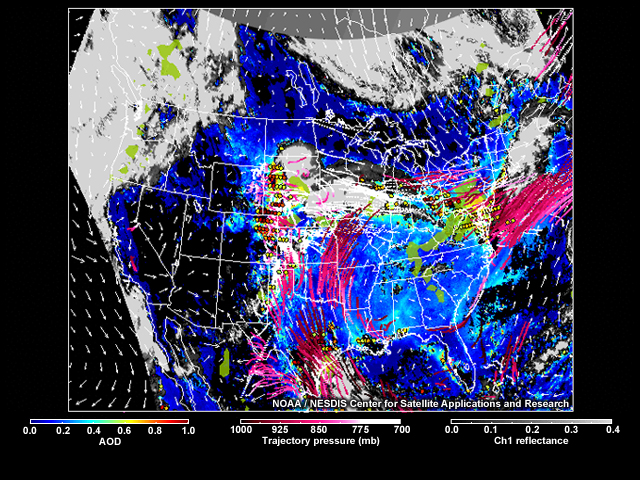
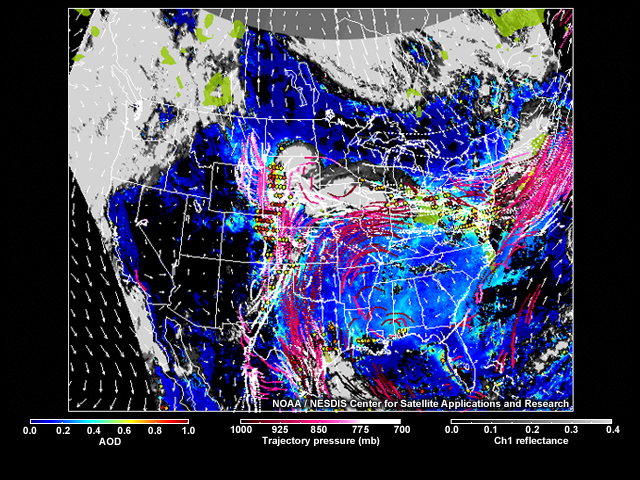
Derivation: Smoke emissions are estimated based on satellite-detected fires. Emission estimates also take into account a variety of other input parameters, such as fuel type, fuel loading, combustion efficiency, and moisture content. Using transport models, forecasts are generated to predict downwind smoke concentrations.
Suomi NPP and JPSS VIIRS Improvements: Reduced data latency to within 30 minutes of observation time will mean that satellite detections will be available for use in forecast models sooner.
GOES-R ABI Improvements: The GOES-R ABI imager's expanded spectral coverage and more frequent imaging provide a significant increase in the amount of geostationary satellite data for use in forecast models of smoke and other aerosols. Efforts like the IDEA program will help ensure the integration of new satellite datasets into air quality modeling and forecasts that benefit users and the public at large.
Links
- NOAA HRRR-Smoke Model (Experimental): https://rapidrefresh.noaa.gov/hrrr/HRRRsmoke/
- U.S. Naval Research Laboratory (Monterey) Aerosol Page (access to NAAPS and FLAMBE data): http://www.nrlmry.navy.mil/aerosol/; some products are also viewable in Google Earth via that URL
- HYSPLIT (HYbrid Single-Particle Lagrangian Integrated Trajectory) model: https://www.arl.noaa.gov/hysplit/hysplit/. COMET also has a lesson on HYSPLIT: HYSPLIT Applications for Emergency Decision Support
- NASA Global Imagery Browse Services (GIBS): https://earthdata.nasa.gov/eosdis/science-system-description/eosdis-components/gibs
- National Weather Service Air Quality Forecast Guidance: http://airquality.weather.gov/
- U.S. EPA AIRNOW Program: http://airnow.gov
- NOAA-NESDIS Hazard Mapping System (HMS): http://www.ospo.noaa.gov/Products/land/hms.html
- NOAA Smoke Forecasting System: http://www.arl.noaa.gov/smoke.php
- NOAA IDEA (Infusing Satellite Data into Environmental Applications) Program: http://www.star.nesdis.noaa.gov/smcd/spb/aq/
- GOES Fire Detection and Characterization (FDC): https://www.ncdc.noaa.gov/data-access/satellite-data/goes-r-series-satellites#FDC
Case Study
Introduction
In this section, we will examine a fire scenario that occurred in Billings, Montana in 2006. Included are comments from Don Moore, National Weather Service Science and Operations Officer in Billings, who experienced the fire.

Advantages of True Color Imagery
These true color images show how the area around Billings changed over a four and a half week period, from 6 June to 11 July 2006. Notice the distinct browning of vegetation, which often indicates an increased potential to burn.

Question
In general, what are the advantages of using true color imagery to assess fire risk? Click on each correct choice. (Choose all that apply.)
The correct answer is a), b), and c).
True color imagery resembles what an astronaut would see from space. It gives a detailed high-resolution view of vegetation color (the amount of chlorophyll present in the plant), but provides only indirect information about vegetation moisture. It provides no information about soil moisture.
Relative Greenness Maps
Question
Does the one-month greenness trend in eastern Montana heighten or reduce your concern about the area's susceptibility to fire? (Click Tab 1 and Tab 2 to switch between greeness maps.)
Tab 1
31 May - 06 June 2006

Tab 2
05 July - 11 July 2006

(Choose the best answer.)
The correct answer is a).
The maps verify what we identified on the true color imagery that the vegetation is browning in the Montana area from spring to early summer.
Relative Greenness Question
Question
Which of the following statements about the relative greenness product are correct? (Choose all that apply.)
The correct answers are a) and c).
The relative greenness product compares the greenness at a particular spot with the maximum or minimum observed during a multi-year period from 1989 to 2003, as defined by the U.S. Forest Service. It cannot directly measure vegetation moisture, but can supplement fire danger products in regions with few conventional observations.
Hotspots
This MODIS false color image shows the first glimmers of the Bundy Railroad fire on July 12, 2006. We were only able to detect it by applying an extreme zoom over that region. Even so, we can barely see the small pink dot of the hotspot, which is partially obscured by clouds. Searching for hotspots like this can be like searching for a needle in a haystack. With Suomi NPP and JPSS VIIRS, satellite products will arrive sooner, within 30 minutes of observation time, making it easier for forecasters to identify and forecast fires like this.
Location of Flames
This MODIS image from the Aqua satellite was taken several hours after the MODIS image from the Terra satellite. (Use the toggle buttons to switch between images.) As you can see, the fires have grown and red perimeters appear on the image.
Tab 1
Tab 2

Red boxes or outlines are placed on imagery to indicate the perimeter of 1 km-resolution pixels containing a positive thermal anomaly detected by MODIS.
Question
On the ground, where would you expect to find flames in the Bundy Railroad Fire? (Choose the best answer.)
The correct answer is b).
Flames always cover a smaller area than shown by red perimeters. Notice the cloud cover, which often limits the ability to see hotspots in polar-orbiting satellite images due to their infrequent coverage.
Fires in GOES Animations
Question
Fires (red dots) show up intermittently on this GOES shortwave fire animation of the same period. Why? (Choose all that apply.)
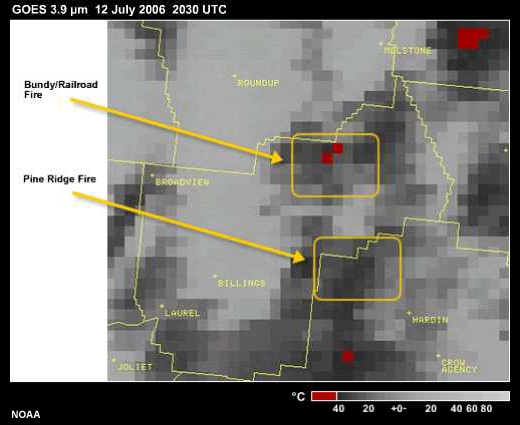

All of these reasons are possible.
In this particular situation, the fires were large enough to be detected, but intermittent cloud cover obscured them from time to time. Note that hotspots are colored red for temperature values of 40°C and higher.
The new-generation GOES-16 and GOES-17 imagery provides improved spatial resolution for viewing hotspots in shortwave IR imagery, as shown in this example from a grasslands fire in Oklahoma in 2018.

MODIS Image & Radar Reflectivity Loop
This MODIS Terra image is overlaid with a loop of enhanced radar reflectivity and includes the fire positions seen on the previous imagery. At around 7 PM on July 12, a gust front associated with frontal convection moved through the area from the west. Winds in excess of 60 miles per hour enabled the fires to make major advances over the next hour. Early in the animation, smoke streamers from the fire suggest a southwesterly wind, but later they suggest a shift to west-northwesterly. The echoes are probably due to clouds accompanying the gust front. It is possible that some of the backscattered radar signal is also due to ash from the fires.


Question
If you look closely, you can see the feature marking the wind shift. How would you describe it? (Choose the best answer.)
The correct answer is a).
The passage of the boundary, shown as a band in blue, distinctly marks the wind shift from SW to W-NW. The red perimeter marks the location of fires. After the passage of the wind shift feature, there are passing green echoes and significant convective thunderstorm cells in orange and red.
MODIS Active Fire Maps
Winds from convection and the passage of the front created very dangerous conditions. At 9:45 PM on 12 July, Yellowstone County Disaster and Emergency Services (DES) called, requesting that a Civil Emergency Message be transmitted, ordering evacuations for areas near the Bundy Railroad Fire. The next day, the Billings Gazette documented the rapid spread of the fire, with winds of 70 miles per hour in nearby Huntley. The fire was so severe that a 25-member team assumed management of it.
Here are two MODIS active fire maps from the U.S. Forest Service for 12 and 13 July. Notice the rapid spread of fires towards the southeast based on the northwesterly wind inferred earlier from the radar loop.

Question
What are advantages of the Active Fire Maps product compared to true color and false color imagery?
(Choose all that apply.)
The correct answers are b) and c).
MODIS and VIIRS Active Fire Maps show current and recent fires in the context of cities, terrain, and roads. They currently do not show smoke. The products are quality controlled and have color coding, which is useful for non-meteorologists.
False Color Imagery, 13 July
This false color image from 13 July shows how the fires spread after the previous night's wind storm. Forecasters were concerned that shifting winds would take the fires into unburned areas.
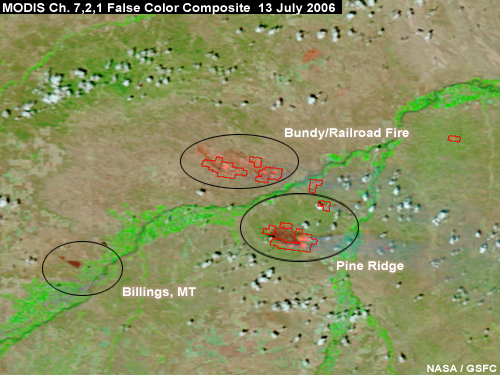
Note that although the photographs clearly document smoke on this day, the false color combination does not depict smoke very well.
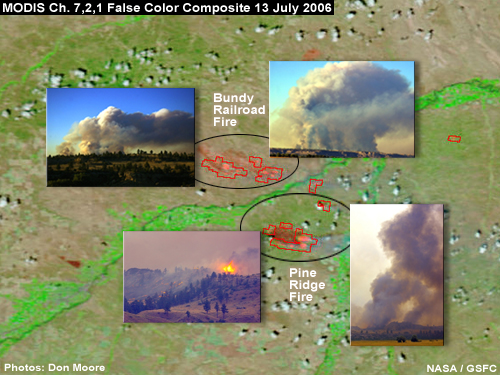
Comparing the false color image with the true color image for the same scene reaffirms that true color imagery is superior for detecting smoke. This is due to the sensitivity of the visible channels to atmospheric aerosols.
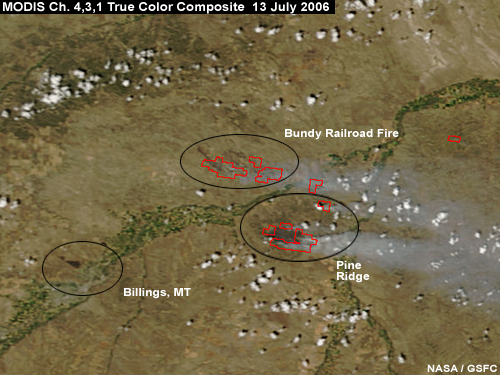
False Color Imagery, 14 July
Question
What can you say about fires, smoke, and burn scars from this MODIS false color image on the next day, 14 July? (Choose all that apply.)
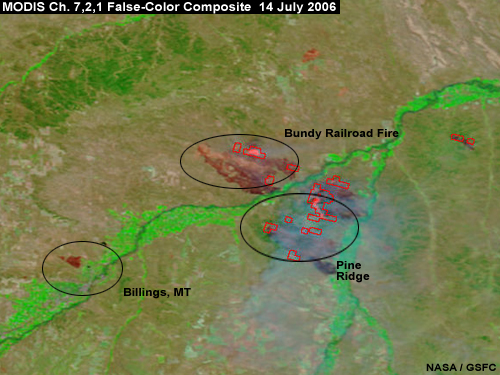
The correct answers are b), c), d) and f).
Notice the prominent burn scars and smoke signature. Pink dots mark fire sub-elements.
With the fires growing more serious, a Type 2 team was sent to the fires on 14 July 2006, with the NWS WFO turning over responsibility to local incident meteorologists early on 15 July 2006.
True and False Color Imagery
Question
Here are true color and false color images from 16 July. Which of the following statements are accurate about true and false color imagery? (Choose all that apply.)

The correct answers are c), d) and e).
True color imagery is better for identifying smoke, whereas false color shows burn scars and vegetation vividly. Red perimeters derived from shortwave infrared information can be overlaid on both true and false color imagery. The hot cores of fires (pink dots) are seen in false color imagery and come from channel 7 information (2.1 micrometers on MODIS and VIIRS).
Commentary
Here are comments from Don Moore, National Weather Service Science and Operations Officer in Billings, who experienced the fire.
"On July 12, 2006, the National Weather Service in Billings anticipated a critical fire weather day with expected dry and windy conditions ahead of and behind a cold front along with the possibility of new fire starts because of lightning. As the front began to move across the area, the storms and strong winds organized themselves into a solid line of wind in excess of 50 MPH. What made this event unusual was the duration of the strong winds; wind gusts of 50 to 70 mph were common just ahead of the storms but once the storms passed, the winds remained high. In fact, gusts of 50 mph or more were common for an hour. This created very dangerous conditions due to preexisting fires in addition to the newly started ones."

"I went home at the end of my day as usual before the event unfolded. When the strong winds hit, they didn't die down, which left me concerned. I gave work a call and after talking to the crew, decided an body on shift would be a good idea. I wasn't at the office very long before it became apparent that this was one of those bigger events because many of the spotters we were calling to determine the strength of the wind were stating they were helping to fight fires. Even locally in Billings, the event was turning out to be significant. We learned of a wildfire that started on the northwest side of town due to the recent lightning. At the time, we weren't aware exactly of its location but knew it was threatening homes. The webcam on the tall tower near our office was clearly showing smoke blowing quickly downwind, which left us concerned."
"The following day, we learned of the significance of the event, with numerous fires across our forecast area. Several of them grew into large fires in just a few hours of time. Even the fire on the outskirts of Billings remained active the following day. The fires continued to remain quite active for several days following the event."
Module Summary
General Resources

PRODUCTS FOR PRE-FIRE MONITORING
Fire danger ratings
- Derived from surface observations
- Account for current and antecedent weather, fuel types, and live and dead fuel moisture
- Can monitor trends in fire susceptibility for areas with reasonable data density
- Values between stations are interpolated, offering only a guess at actual fuel conditions
MODIS, S-NPP and JPSS VIIRS true color imagery
- Conveys vegetation "greenness" qualitatively; the greener the scene, generally the lower the susceptibility to wildfires
- High spatial resolution (1 km or greater) makes the product very useful for observing transitions in vegetation
- For some products, fire locations or fire perimeters are overlaid and typically appear in red; smoke plumes appear in gray
- Smoke can obscure the surface, making it difficult to see burn scars and other surface features of interest
NDVI-derived greenness maps
- Derived from the Normalized Difference Vegetation Index (NDVI). The NDVI product combines observations from one visible channel and one near-infrared channel.
- Measure how dense and green plant leaves and grasses are, which provides an indication of overall vegetative health and susceptibility to burning.
- Can be produced from AVHRR, MODIS, VIIRS, MSG SEVERI, and GOES-R ABI imager data.
PRODUCTS FOR POST-FIRE ANALYSIS AND MONITORING
False color imagery
- Produced using visible and near-infrared spectral channels
- Can be produced from MODIS, VIIRS, and GOES-R ABI imager data
- Can 'see through' smoke
- Burn scars appear as dark red or brown
- Burn scars alert officials about the potential for future debris flows, plant succession, and invasive species
FIRE DETECTION AND MONITORING
Shortwave vs. longwave imagery for fire detection: Shortwave imagery is particularly sensitive to hot, small fires, whereas longwave imagery has an extremely limited ability to detect fires
Sub-pixel effect: Causes fires to appear much larger on satellite products than they really are.
Missed detection: Very small or relatively cool fires that go undetected on satellite imagery
False alarm: When a person or an algorithm detects a fire that is not really there (sunglint produced by bodies of water or reflective water clouds can contribute to the mistake)
Limitations on fire detection
- Polar-orbiting satellites typically cover a fixed location twice daily, more frequently at high latitudes; geostationary temporal coverage is continuous (every 1 to 10 minutes with GOES-R ABI imaging)
- Geostationary satellites do not cover near-polar areas well due to high viewing angles
- The larger the satellite footprint (area viewed), the less detailed the fire depictions
- Cloud cover can either partially or completely obscure fires
Systems for detecting and monitoring fire
- NASA Global Imagery Browse Services (GIBS): Provides quick access to NASA fire data globally
- U.S. Forest Service Fire Detection Maps: Satellite-derived fire detections using MODIS, VIIRS, AVHRR, and GOES imager data. Maps cover the U.S. and Canada and are produced in near real time.
- NOAA-NESDIS Hazard Mapping System (HMS): An analyst-integrated fire and smoke product
- Fire Detection and Characterization (FDC): Provides automated fire detections from GOES satellites
False color image products
- Can highlight burn scars
- Often convey fire locations when a shortwave IR channel is incorporated
- Provide vivid depictions of landscapes and vegetation conditions, helping users assess the availability of fuel near an advancing fire
True color image products
- Reveals information about the landscape (mountains, chaparral, snow cover, land cover, water bodies, etc.), which adds context for those forecasting or monitoring fires
- Red spots or red perimeters are often added, marking the location of likely fires based on information from infrared shortwave 'fire' channels
- Is the optimal satellite product for the general interpretation of smoke and other aerosols; often reveals smoke where it cannot be seen in other image-based products
PRODUCTS FOR DETECTING AND FORECASTING SMOKE AND AEROSOLS
Satellite imagery
- Visible imagery is much more useful for identifying and viewing smoke than infrared imagery
- Improved nighttime visible imaging technology, as with the VIIRS Day-Night Band on board Suomi NPP and JPSS satellites, enables smoke detection at night given sufficient lunar illumination (for more information, access the COMET lesson Advances in Space-Based Nighttime Visible Observation, 2nd Edition)
- Smoke can be detected more readily in true color imagery than in any single visible channel image
Model-generated smoke forecasts
- Produced based on the satellite detection and characterization of fires
- Used to anticipate hazardous air quality with a lead time of hours to days, enabling the timely issuance of public advisories
- Can predict degraded visibilities globally
- Analysis and forecast systems:
- U.S. Navy Aerosol Analysis and Prediction System (NAAPS): Forecasts smoke transport and aerosol optical thickness
- NOAA-NESDIS Hazard Mapping System (HMS): Determines locations of fire and smoke using an analyst and algorithm mix; data from this system is used to initialize the HYSPLIT model and to forecast smoke trajectories
- HYSPLIT (HYbrid Single-Particle Lagrangian Integrated Trajectory) model: Forecasts smoke dispersion and trajectories
- FLAMBE program (Fire Locating And Modeling of Burning Emissions; a joint U.S. Navy, NASA, NOAA, and University of Alabama effort): Estimates smoke emissions, and forecasts smoke concentrations and transport
You have reached the end of the module. Please take the module quiz and module survey!
References and Resources
GOES-R and JPSS Quick Guides
- VIIRS Active Fire (Product)
- VIIRS Day Land Cloud Fire (RGB)
- VIIRS Fire Temperature (RGB)
- (GOES-R) Fire Temperature (RGB)
- (GOES-R) Day Land Cloud Fire (RGB)
GOES-R and JPSS Quick Briefs
- (GOES-R) Fire Detection and Characterization Algorithm (FDCA)
- (S-NPP, JPSS) Day Night Band (DNB)/Near Constant Contrast (NCC) imagery
Additional Online Resources
- COMET MetEd lesson - GOES-16/JPSS Case Exercise: Monitoring the Rhea Oklahoma Grassland Fire
- COMET MetEd lesson - GOES-R ABI: Next Generation Satellite Imaging
- COMET MetEd lesson - SatFC-G: IR Bands, Excluding Water Vapor
- COMET MetEd lesson - SatFC-J: The VIIRS Imager
- COMET MetEd lesson - SatFC-J: The VIIRS Day/Night Band
- COMET MetEd lesson - Introduction to VIIRS Imaging and Applications
- RAMMB CIRA Virtual Institute for Satellite Integration Training (VISIT) Quick Reference Material
- GOES-R Series Satellites Product Information and Data Access (includes Fire/Hot Spot Characterization (FDC) product)
- NOAA NESDIS JPSS VIIRS Active Fires Product Information and Data Access
- University of Maryland VIIRS Active Fire Website
- NASA VIIRS I-Band 375 m Active Fire Product Information and Data Access