Introduction
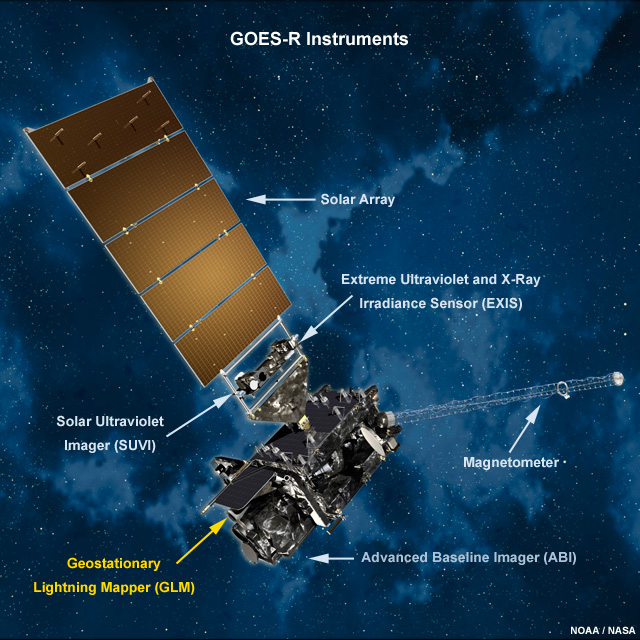
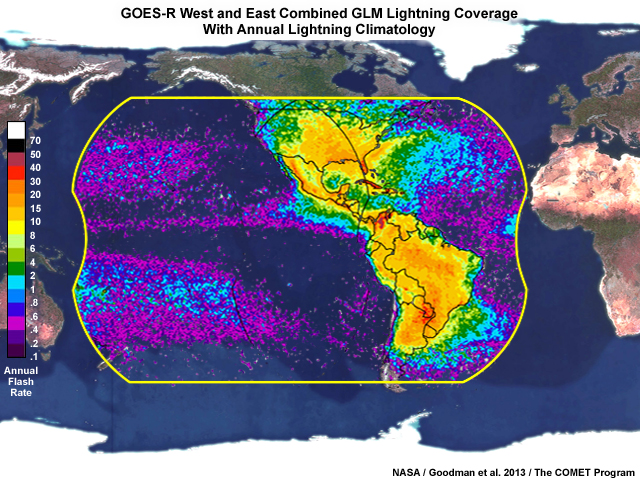
The Geostationary Lightning Mapper (GLM) on the GOES-R satellite series is the first operational lightning detector in geostationary orbit. The GLM continuously measures all lightning activity across most of the Western Hemisphere in real time. These observations are collected 24 hours a day with near-uniform, thunderstorm-scale resolution. For more information about the GLM and its capabilities, see the following COMET MetEd resources:
- NWS Satellite Foundational Course for GOES-R: Introduction to the GLM
- GOES-R Series Faculty Virtual Course: Geostationary Lightning Mapper
- GOES-R GLM: Introduction to the Geostationary Lightning Mapper
Question
GLM provides users with continuous lightning observations. How are these data advantageous to weather forecasting and communication? Choose all that apply.
The correct answers are a, c, d.
The GLM data can help improve nowcasts and warnings of thunderstorms, lightning activity, hail, damaging winds, flash floods, and tornadoes. Gathered across large geographical regions, the lightning data will provide vital information to weather-sensitive communities and industries.
Option (b) is incorrect because the GLM has at least 70% detection efficiency during both day and night, and a low 5% false detection rate. Although the GLM provides measurements of total lightning activity (intra-cloud, inter-cloud, and cloud-to-ground flashes), it cannot distinguish between the flash types, making option (e) incorrect.
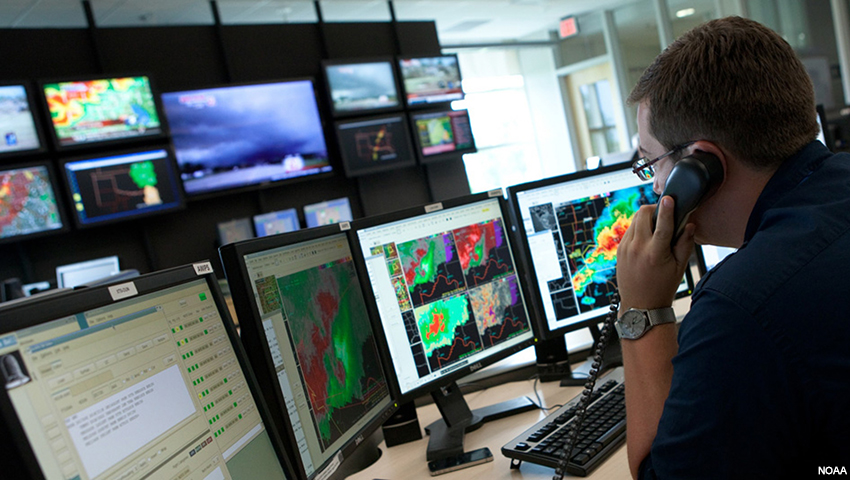
A meteorologist monitors a severe weather outbreak.
The GLM’s continuous observation feed is beneficial to severe weather forecasting and decision-making. A weather forecaster continuously monitors the weather, adjusts his or her forecast to reduce uncertainties, and considers other factors that may increase the significance of the expected weather. This process of monitoring information and adjusting one’s perspective is known as situational awareness. In this lesson, we will explore how GLM observations can be used to build situational awareness during a past severe weather event near Buenos Aires in Argentina. Throughout these exercises, we will learn how GLM observations can be used: to provide initial indications of cloud electrification, be used with other convective-monitoring tools to assess tendencies in storm strength, and to suggest the potential for severe weather. This information can improve our understanding of the severe weather event and highlight the value of GLM data in nowcasting.
Let’s begin by taking a look at the weather across South America prior to the severe weather event.
Weather Synopsis
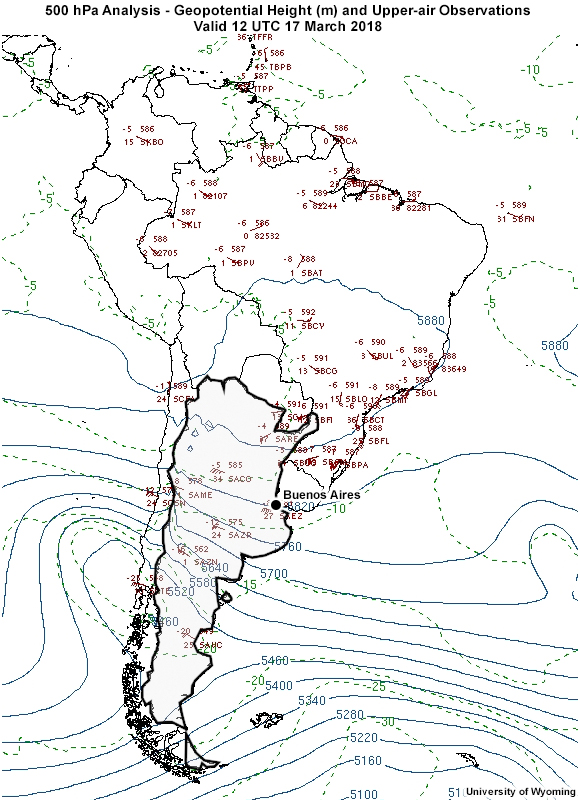
500 hPa
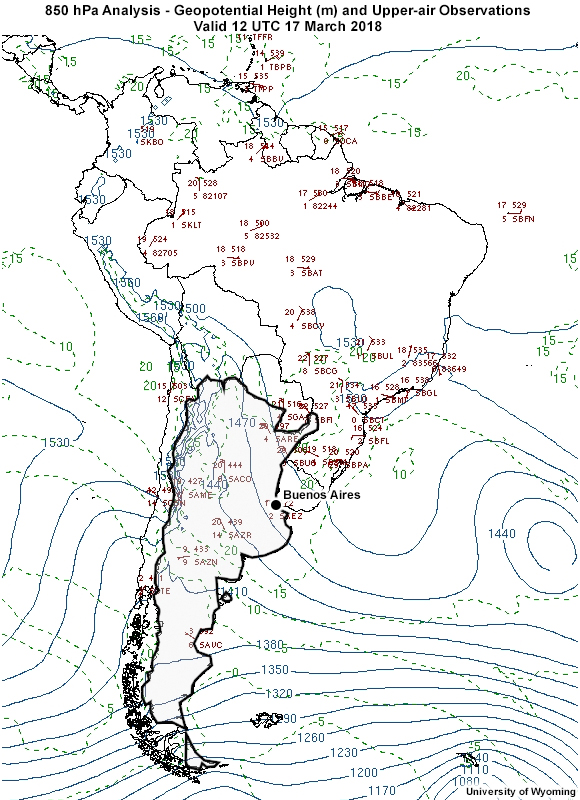
850 hPa
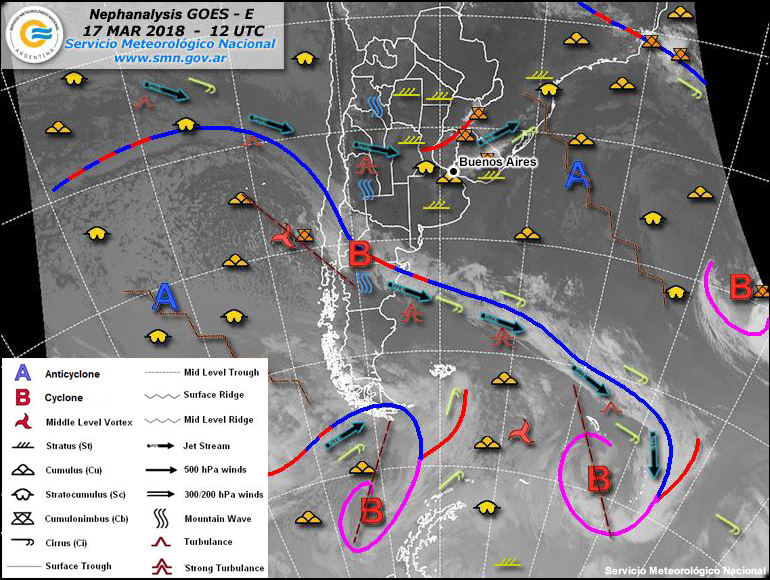
Nephanalysis
A 500 hPa trough is moving into southern Chile and Argentina in South America. Meanwhile, a ridge extends off the coast of Uruguay and Brazil. An anticyclone is located offshore of Buenos Aires, and a cyclone is located farther south and west of the city.
Question
Review the nephanalysis above. What types of clouds are present at 1200 UTC in the Buenos Aires area? Choose all that apply.
The correct answers are a, b, d.
Cumulus, stratocumulus, and stratus clouds are in the Buenos Aires area. Cumuliform clouds suggest vertical motions taking place in the atmosphere. We will monitor this area for the potential of further cumulus development.
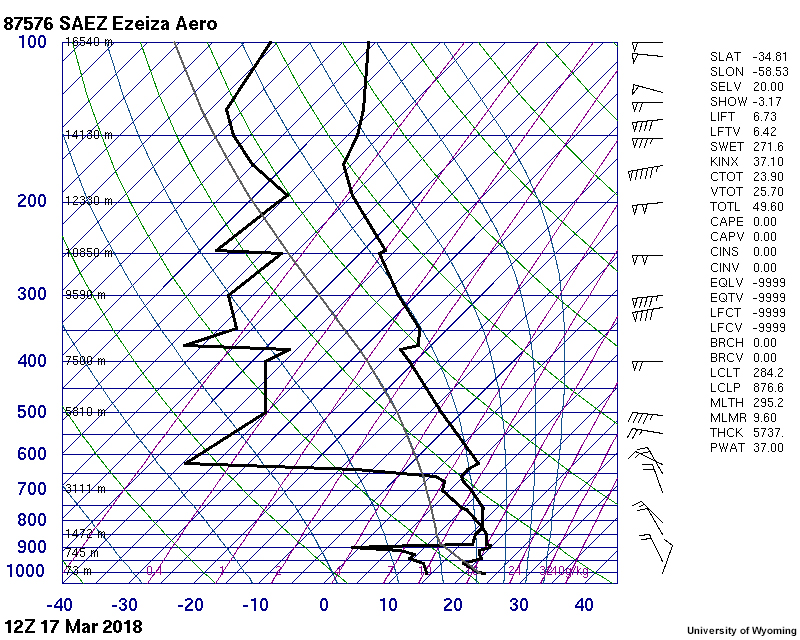
Upper-air sounding for Ezeiza International Airport in Argentina valid 1200 UTC on 17 March 2018.
The 1200 UTC sounding above is taken from the Ezeiza International Airport near Buenos Aires, Argentina. At this time, the low-level temperature profile is moist neutral, with a capping inversion aloft. However, the cumulus field suggests that vertical mixing is taking place. This mixing, along with expected surface heating as the day progresses, should destabilize the atmosphere, and lead to significant Convective Available Potential Energy (CAPE - an important measure of potential thunderstorm intensity). The sounding also shows abundant moisture and vertical wind shear that will help organize any subsequent convection. If severe convection occurs, the counter-clockwise turning of the winds with height produces shear that favors left-moving supercells.
Pre-Storm Environment
Now, we are going to look at satellite and radar observations to see what happens in the Buenos Aires area during the early afternoon hours (1500 - 1900 UTC 17 March).
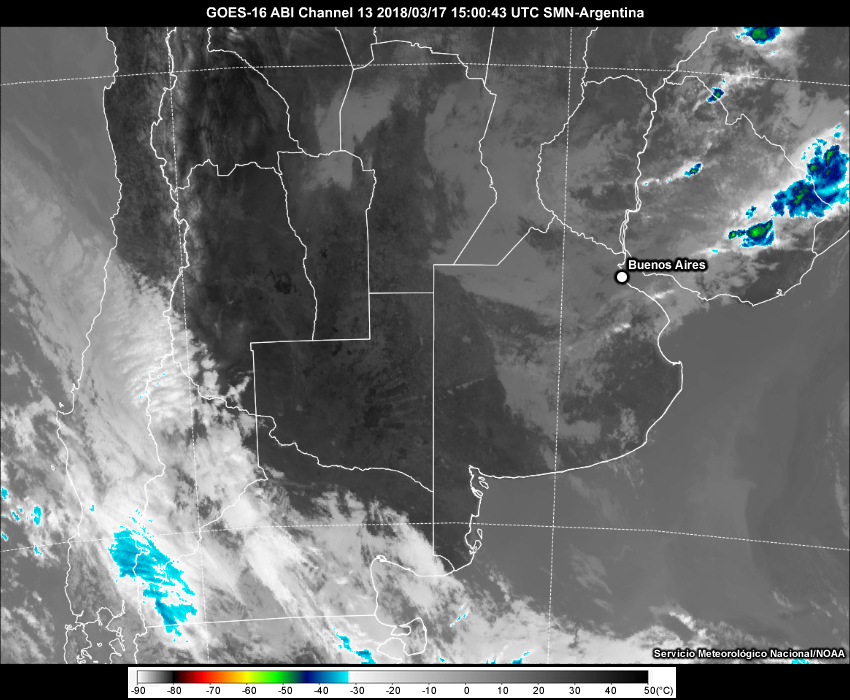
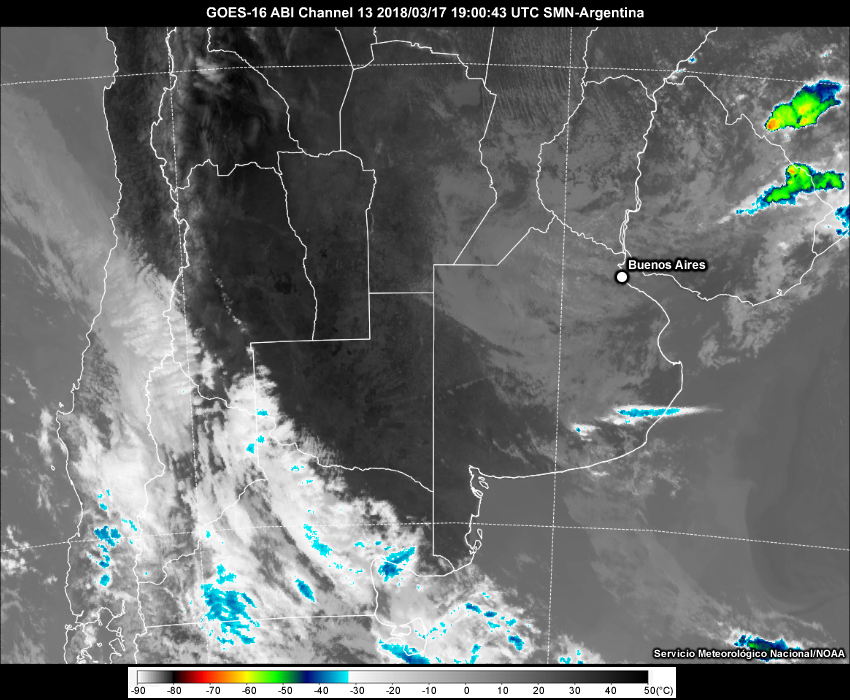
IR
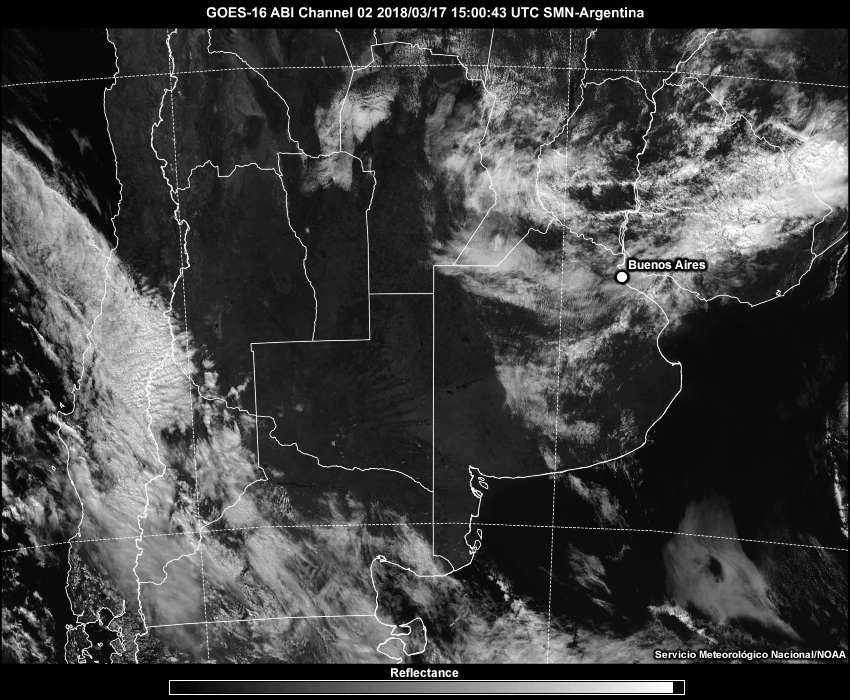
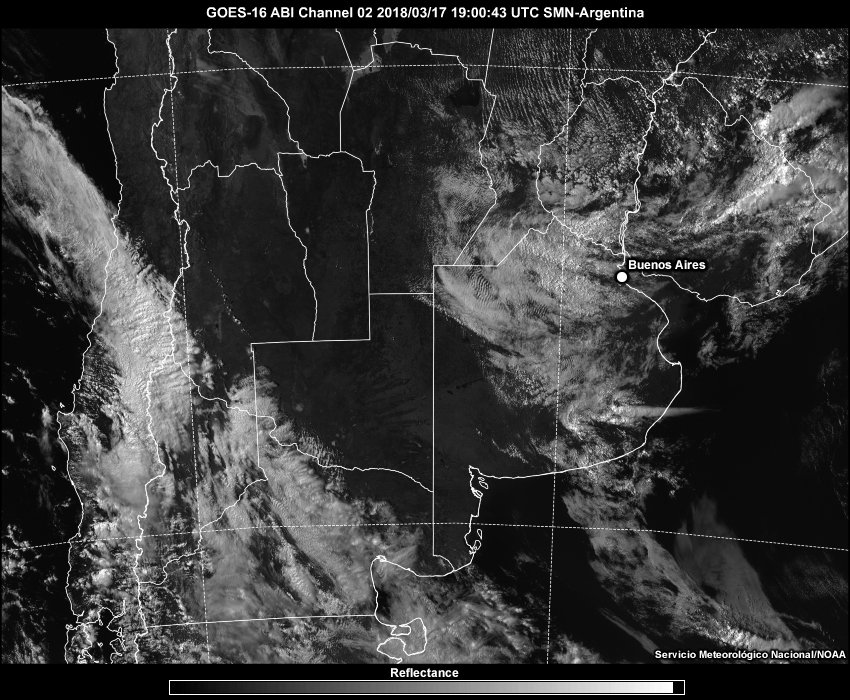
VIS
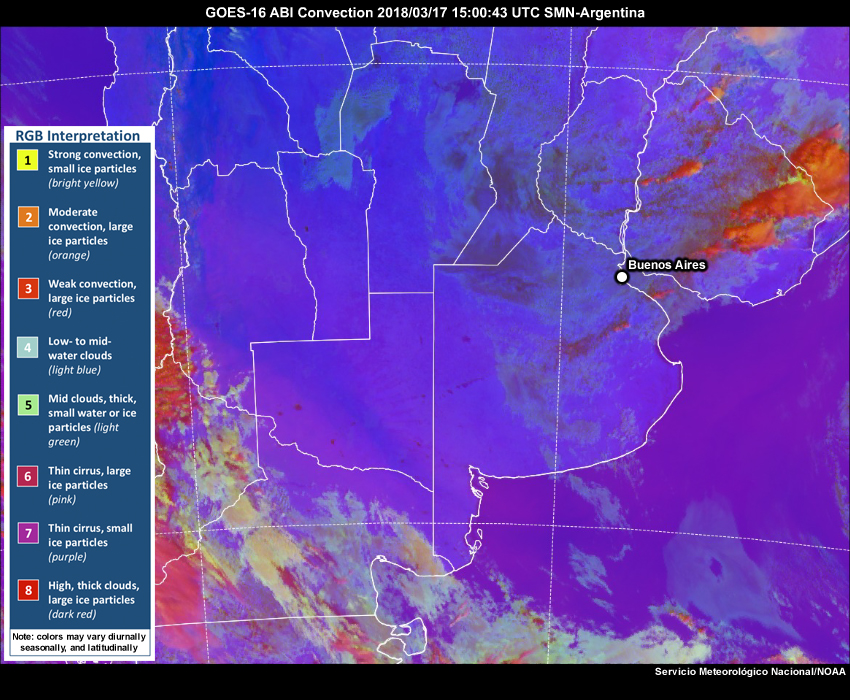
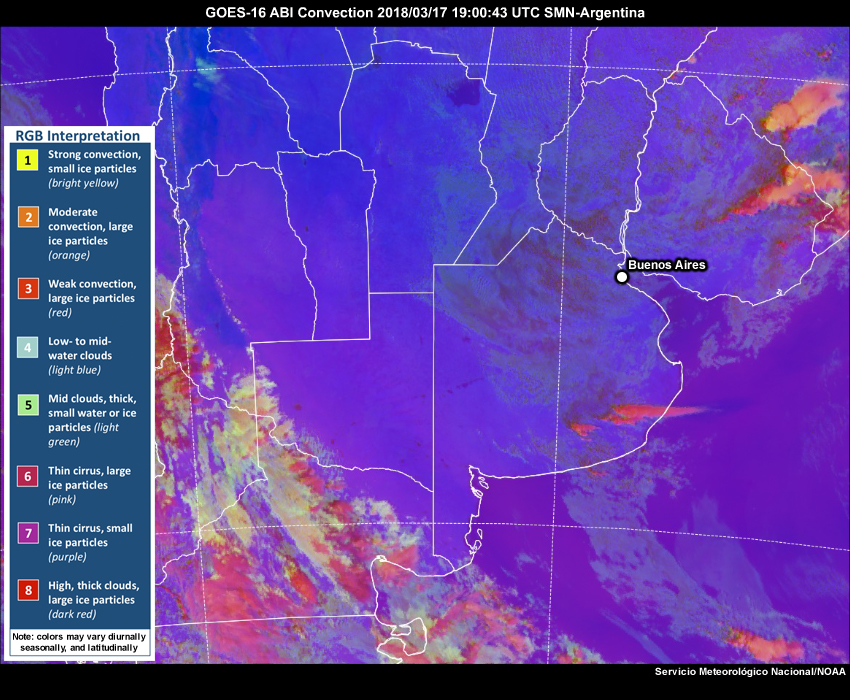
Day Convection
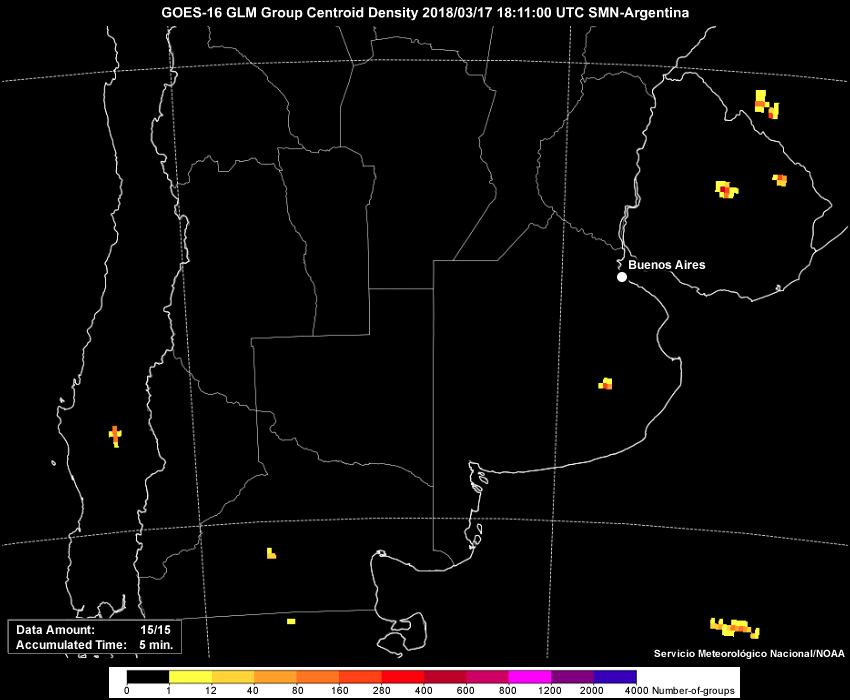
GLM Group Density
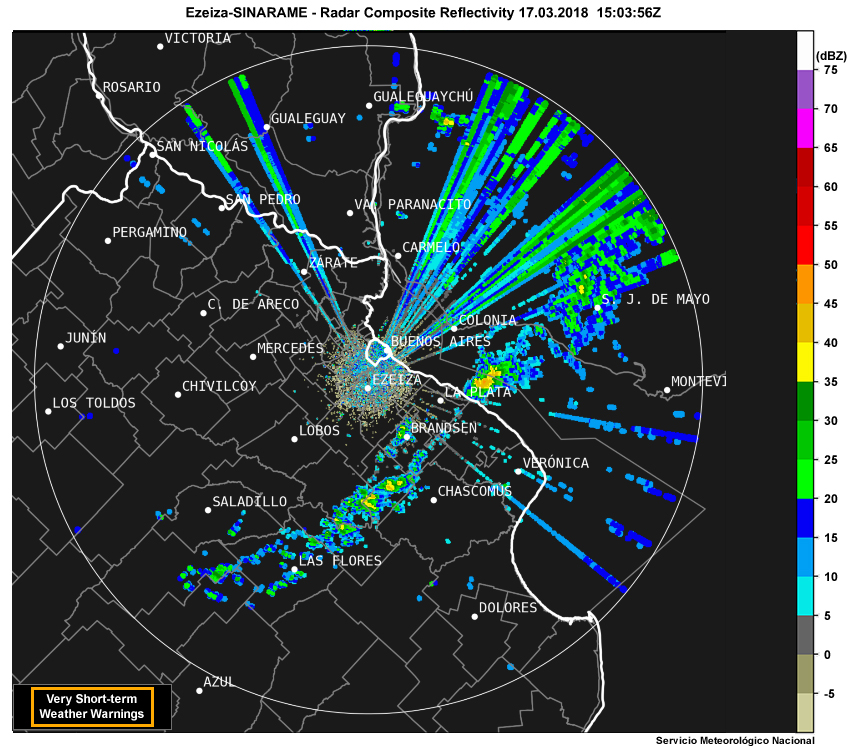
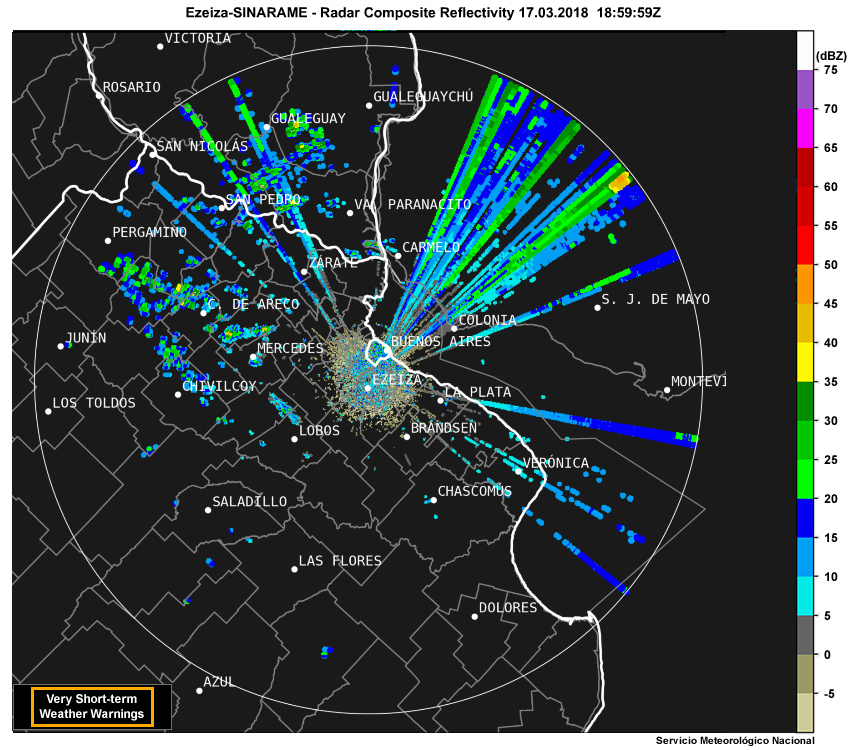
Composite Radar
Question 1 of 2
On the visible satellite image below:
- use the red pen to outline the area encompassing the gravity wave
- use the green pen to outline areas of wind-parallel cumulus streets
- use the yellow pen to outline the convergence line or boundary with active convection
- use the blue pen to outline the area of cumulus congestus
You can view the additional satellite and radar data loops above to help in your analysis.
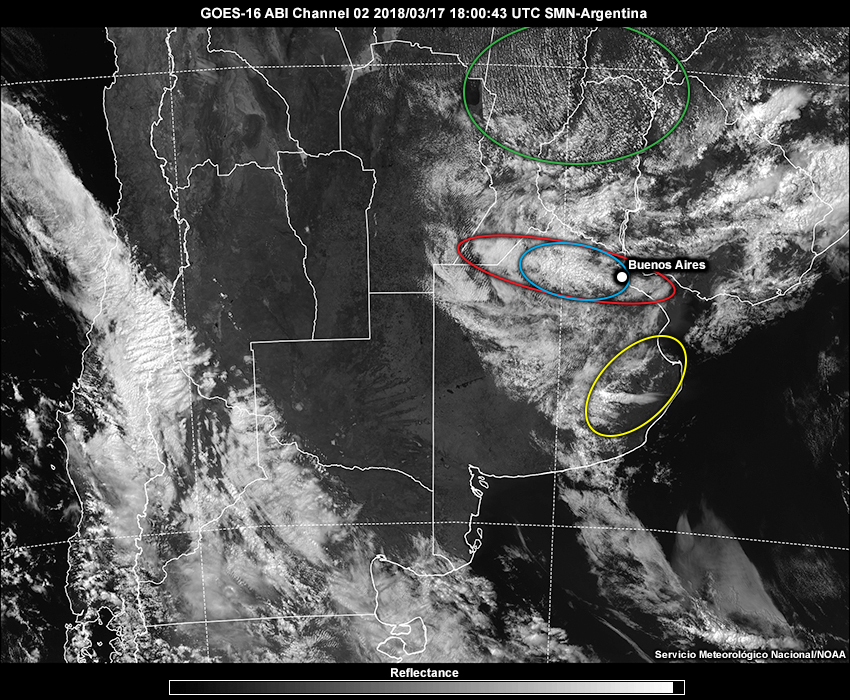
Compare your analysis to the expert analysis. Low-level cloud streets further north from Buenos Aires are a result of northerly winds. These northerly winds are associated with the South American low-level jet that transports tropical moisture south, favoring the development of organized convection across southeastern South America. A convergence line moving south and away from the Buenos Aires area is generating thunderstorms. A gravity wave is moving northeast towards Buenos Aires, where cumulus congestus develops upon its passage.
Let’s take a closer look at the area of developing cumulus congestus northwest of Buenos Aires one hour later. Review the satellite and radar observations in the tabs below and answer the following question. (Note: GLM observations are based on a group centroid density within a ~10-km grid box and a 5-minute time accumulation).
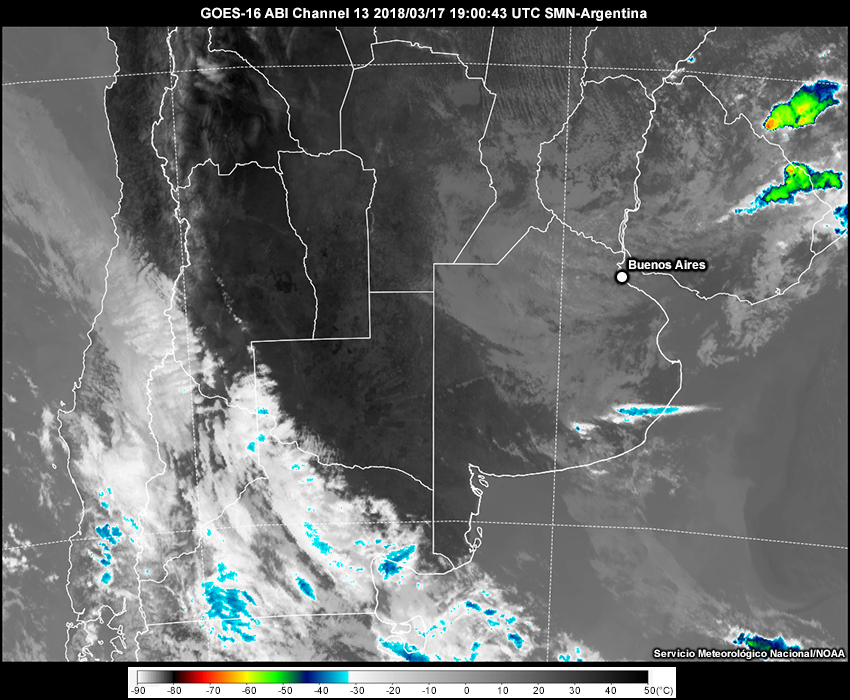
IR
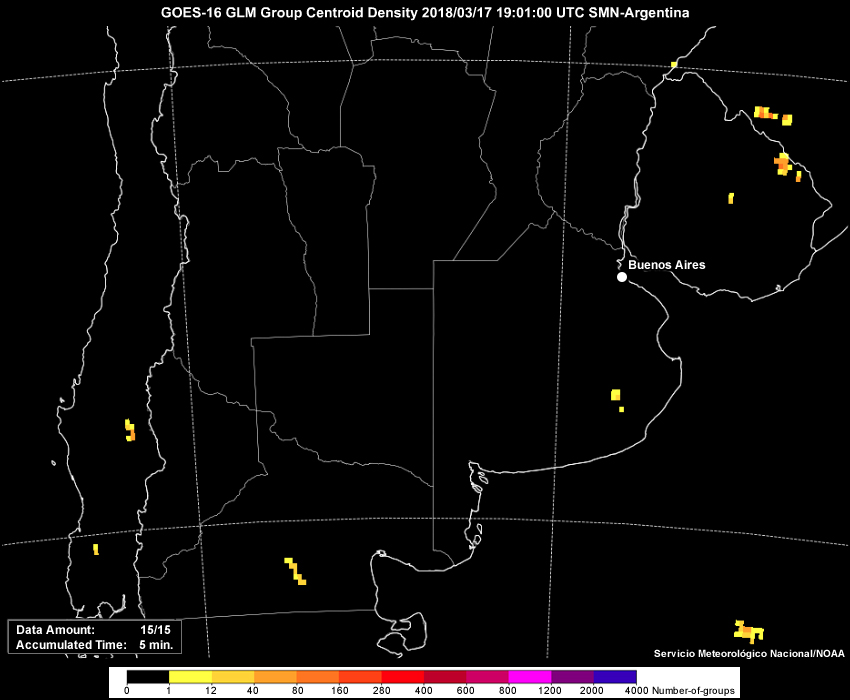
GLM Group Density

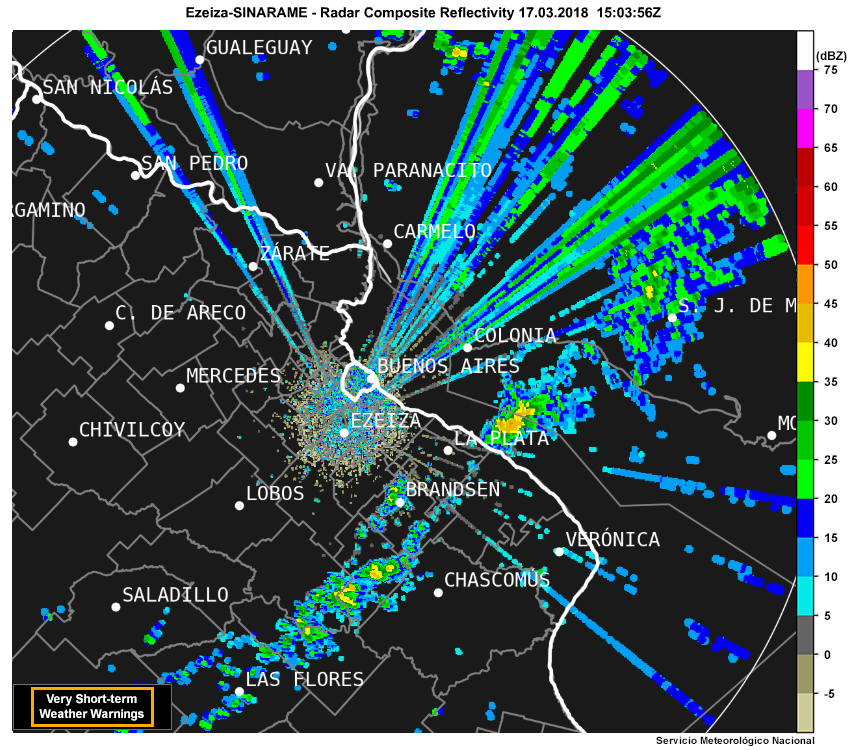
Composite Radar

Question 2 of 2
What additional activity is occurring within the area of current cumulus congestus? Choose all that apply.
The correct answers are b, e.
Within the area of cumulus congestus, we do not see vigorous convection associated with cold cloud top temperatures or active lightning detections in the GLM display. Rather, we notice that there is shallow precipitation to the northwest of Buenos Aires, and no lightning detected by the GLM instrument. We will continue to monitor the Buenos Aires area and see how the cumulus congestus northwest of Buenos Aires evolves over the next few hours.
Convective Activity
Rapidly-updating data from the GLM instrument can provide us with valuable information regarding convective storm development and evolution. To see this in practice, let’s look at satellite and radar observations further into the afternoon period (1900 - 2130 UTC 17 March) to see how the cumulus congestus field near Buenos Aires has progressed.
IR

VIS

Day Convection

GLM Group Density
Composite Radar
Question 1 of 5
Review the GLM loop above. At what time does the GLM first show a group density lightning detection near Buenos Aires? Choose the best answer.
The correct answer is c.
The GLM instrument first shows a group density lightning detection near Buenos Aires at 2041 UTC. Continue to the next question by using the gray arrows at the top right and left of this question frame.
Question 2 of 5
Review the infrared satellite imagery and radar reflectivity data prior to 2041 UTC. Use the pull-down menu to choose the answer that best fits each statement below.
The correct answers are highlighted above. The infrared satellite and radar observations show relatively warm cloud top temperatures at 2030 UTC, and moderate reflectivity values between 40-45 dBZ at 2036 UTC. At this point, we become aware that heavy rain may be developing in the area. However, GLM’s increased 5-minute temporal resolution allows us to note the presence of lightning several minutes before we receive the next infrared imagery (15 minute temporal resolution) or the next radar image (10 minute temporal resolution). This initial lightning detection from the GLM can be a helpful indicator of updraft/downdraft strength, as cloud electrification is supported by strong vertical motions.
In addition to providing information in between data scans, GLM observations can also help fill data voids. In areas with complex terrain and/or sparse radar coverage, the GLM can help forecasters locate thunderstorms and get an idea of where heavy rainfall may be occurring. Let’s look at an example from Albuquerque, New Mexico below. The first tab shows intense convection moving east of some terrain, and the 0.5° radar beam becomes blocked. The second tab shows how the GLM flash extent density was increasing fairly rapidly, allowing forecasters to monitor the storm activity without traditional radar observations.
Radar Reflectivity
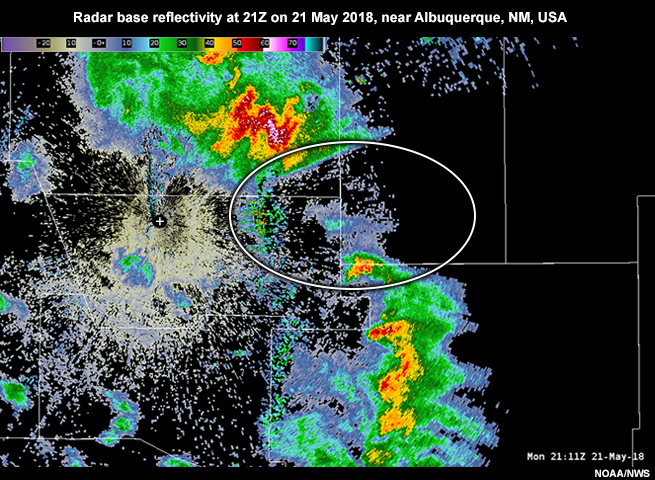
Radar base reflectivity at 21Z on 21 May 2018 showing a cluster of thunderstorms moving east of the immediate Albuquerque, New Mexico area.
GLM Flash Extent Density
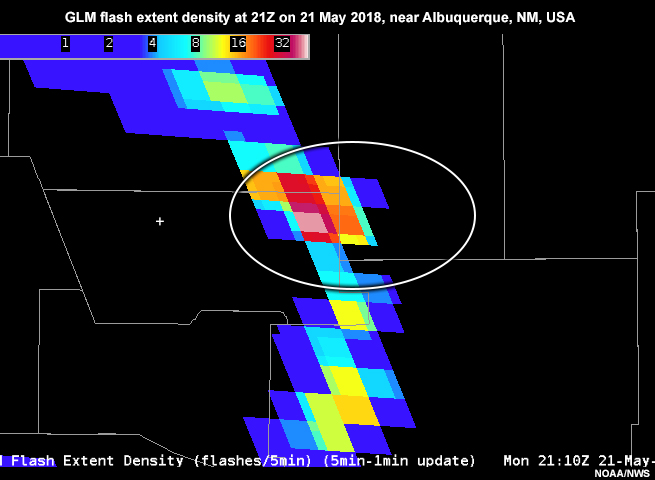
GLM flash extent density at 21Z on 21 May 2018 showing a high degree of lightning activity where the radar data is unavailable.
Continue to the next question.
Question 3 of 5
Review the GLM loop above. What is the trend in the group density lightning detections throughout the period? Choose the best answer.
The correct answer is a.
The first group density lightning detection is at 2041 UTC, and the number of detections subsequently increase as indicated by the darker shades of orange and red. This upward trend in detections provides an early indication of developing thunderstorms. What else can the trend in GLM detections tell us about the developing convection? Let’s investigate the other datasets we have at our disposal. Continue to the next question.
Question 4 of 5
Review the data loops above. Throughout the period, the trend in the GLM group density lightning detections occurs in tandem with what other observations relative to the storm cell near Buenos Aires? Choose all that apply.
The correct answers are b, c, e.
Between 1900 UTC and 2130 UTC, we can determine cooling cloud tops and initial electrification signatures based on the GLM and infrared satellite observations. Clear shadows and highly textured convective clouds extending vertically can be seen in the visible satellite imagery. We also see bright signatures in the Day Convection RGB, which are indicative of small ice particles that mark intense updrafts (i.e. greater vertical development). These features are all indicative of convective cloud development. Continue to the next question.
Question 5 of 5
Based on the trends in the satellite and radar products, what can you conclude about the intensity of the storm cell near Buenos Aires? Choose the best answer.
The correct answer is a.
Increased lightning activity, cooling cloud tops, and vertical development are all indicators that the convection near Buenos Aires is strengthening. A storm's intensification is a direct consequence of strong vertical motions, which also support electrification in the cloud's mixed phase region. As updrafts and downdrafts intensify, water and ice hydrometeors collide more often. This increases electrification within the cloud and supports the formation of lightning. This is the final question for 1900 - 2130 UTC. Scroll downward and click "next" at lower right to learn how the storm progressed.
Convective Activity » Storm Progression
Near Buenos Aires, we can see the progression in storm intensity in the radar data loop below. Thunderstorms began to develop west of Buenos Aires around 2000 UTC. Southwest of the city, a large storm cell begins to intensify and split. The left moving cell becomes the dominant storm in the area, while the right moving cell quickly dissipates. A weather warning is issued at 2123 UTC (1823 Local Time). The main storm cell is capable of producing strong winds and hail.
Composite Reflectivity
Weather Warning
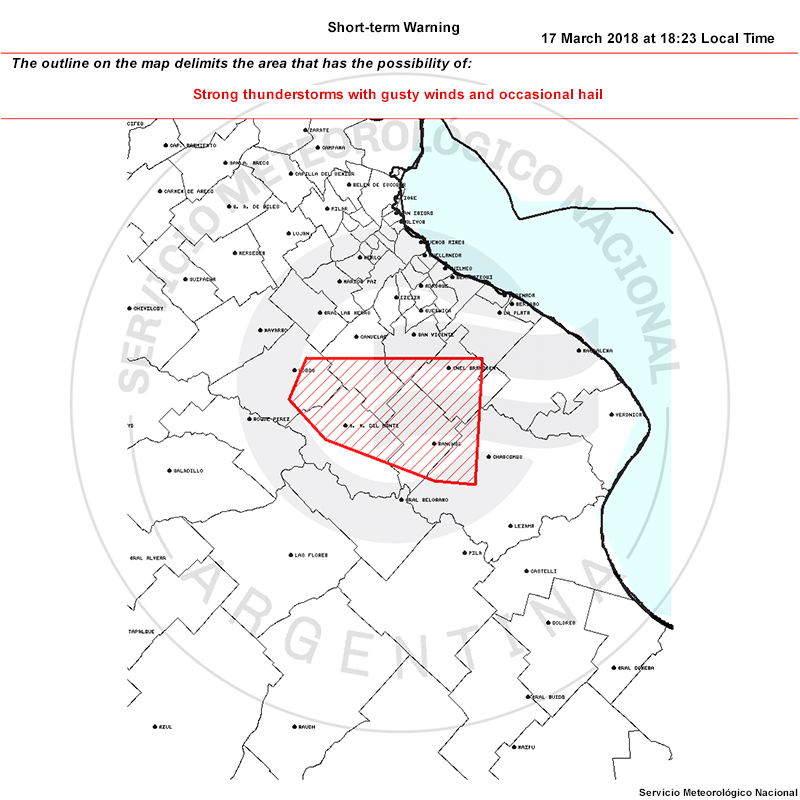
A weather warning issued by the Servicio Meteorológico Nacional at 1823 Local Time (2123 UTC) on 17 March 2018.
Let’s continue to monitor how the severe thunderstorm evolves over the next few hours.
Severe Weather Event
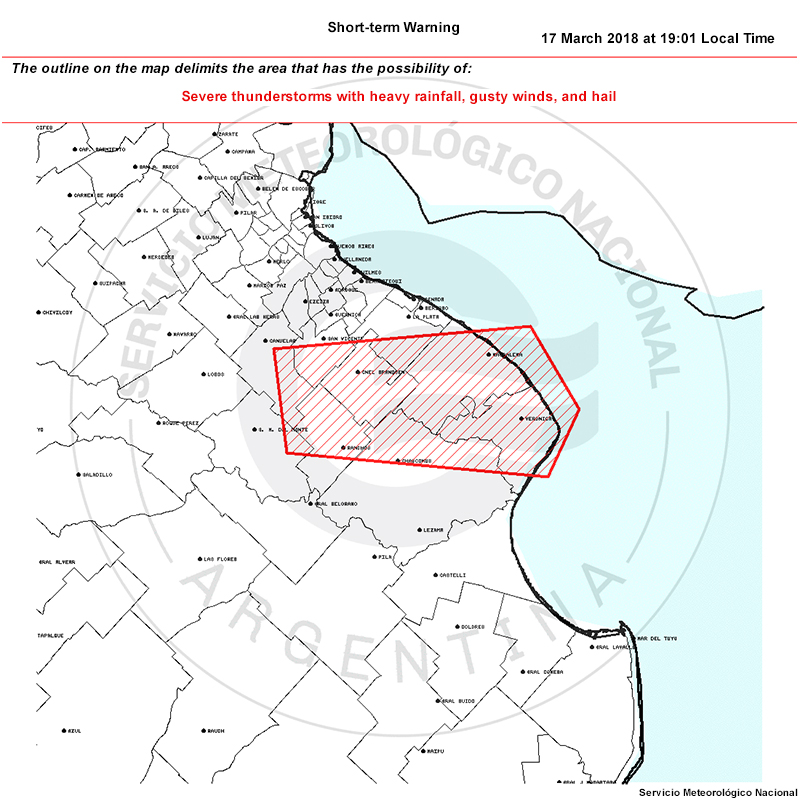
A weather warning issued by the Servicio Meteorológico Nacional at 1901 Local Time (2201 UTC) on 17 March 2018.
A second weather warning is issued at 2201 UTC as the main storm cell continues to pose the risk for strong winds, heavy rainfall, and hail.
Can the GLM help refine our understanding of the severe weather threat for the Buenos Aires area? Let’s look at satellite and radar observations into the early evening period (1900 UTC 17 March - 0000 UTC 18 March).
IR
VIS
Day Convection
GLM Group Density

Composite Radar
Question 1 of 4
On the infrared satellite image below:
- use the green pen to outline the enhanced-V signature
- use the blue pen to outline the coolest cloud top temperature
- use the white pen to mark an “X" where you would expect to find the overshooting top
You can view the additional satellite and radar data loops above to help in your analysis.
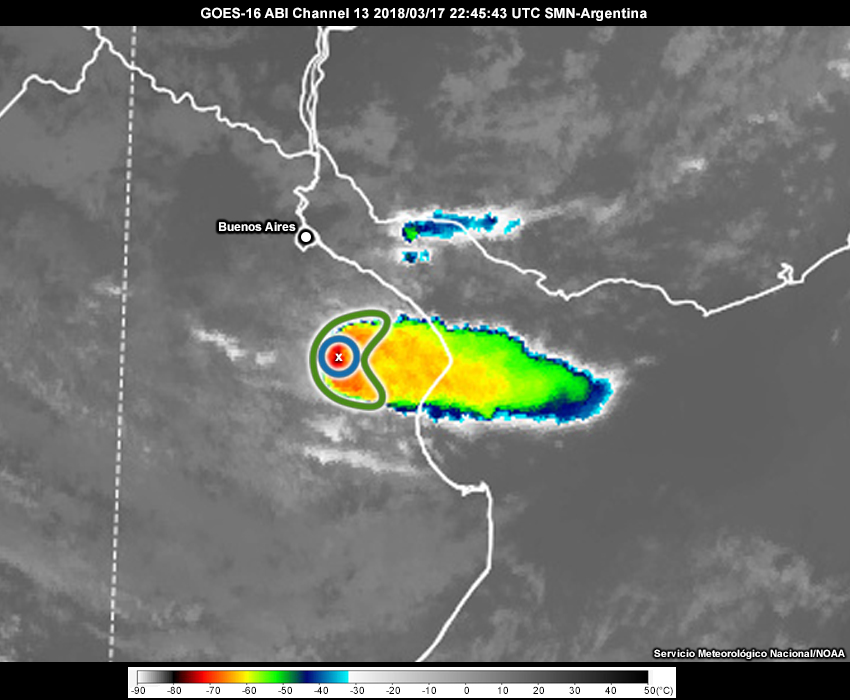
Compare your analysis to the expert analysis. An enhanced-V signature indicates cold upper-level flow around a very strong updraft. On the infrared satellite image, you can see an area of colder temperatures (shades of darker red) extending around and downwind from the updraft, or where we see the coldest cloud top temperature within the overshooting top. Continue to the next question by using the gray arrows at the top right and left of this question frame.
Question 2 of 4
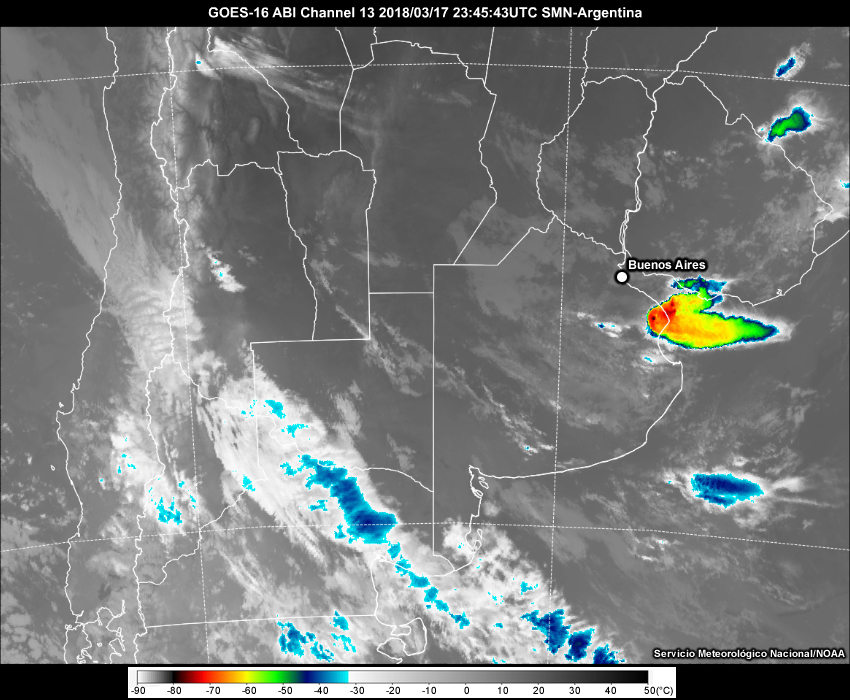
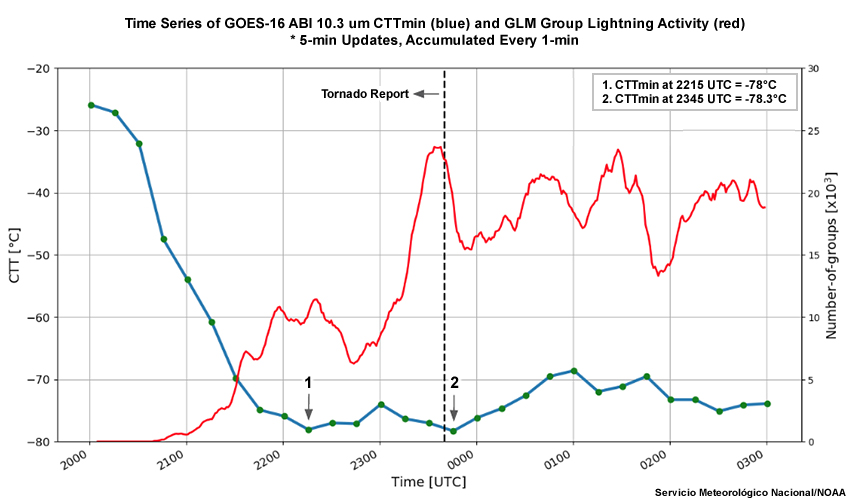
Two cloud top temperature minima have been observed with the convective cell near Buenos Aires. Review the infrared satellite imagery loop and answer the following questions.
The first minimum cloud top temperature of -78°C was observed at 2215 UTC. Another minimum cloud top temperature of -78.3°C was observed at 2345 UTC. Cloud top temperatures of -60°C or colder generally indicate a very strong updraft. Increased cloud electrification is closely related to a strengthening updraft.
Continue to the next question.
Question 3 of 4
Cloud top temperatures themselves are valuable indicators of storm strength, however, observing the temperature change can reveal trends in storm intensification and potential for severe weather.
Review the infrared satellite imagery loop. Which of the following statements best describes how the cloud top temperatures are changing between 2200 UTC 17 March and 0000 UTC 18 March? Choose the best answer.
The correct answer is d.
Despite the slight 15-minute warming period (between 2245 UTC and 2300 UTC), there is no continuous warming or cooling trend in the cloud top temperatures after that. Rather, the cloud top temperatures remain fairly steady between -75°C and -80°C. Let’s see if this is a similar case for the GLM group density lightning detections. Continue to the next question.
Question 4 of 4
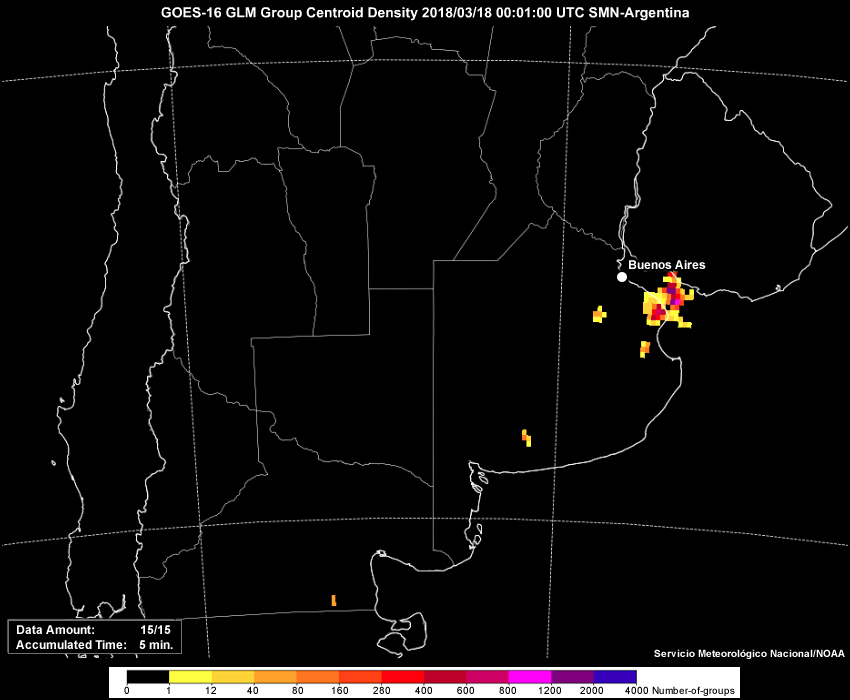
Review the GLM loop. Which of the following statements best describes the trend in the GLM group density lightning detections between 2200 UTC 17 March and 0000 UTC 18 March? Choose the best answer.
The correct answer is b.
As the cloud top temperatures warmed slightly between 2245 UTC and 2300 UTC, the number of group density lightning detections decreased. However, the rebound in cloud top cooling was not nearly as significant as the increase in lightning activity. This rapid rise in the number of group density lightning detections suggests the possibility of continued severe weather.
When researchers began examining trends in lightning activity within developing storms over the past twenty years, they noticed that some storms with rapid increases in lightning flash rates subsequently produced severe weather. Further analysis has shown that this rapid increase in total lightning typically occurs over about 10-20 minutes and is associated with strengthening updrafts. Not all severe thunderstorms demonstrate a significant rise in lightning activity, and not all storms with these rises produce severe weather. However, the notable rise in lightning activity may indicate the potential for severe weather to develop.
There is a significant increase in the number of lightning group detections between 2300 UTC and 0000 UTC as cloud top temperatures cooled to about -78°C. At 2340 UTC, a tornado was reported in Vieytes in the Buenos Aires Province of Argentina.
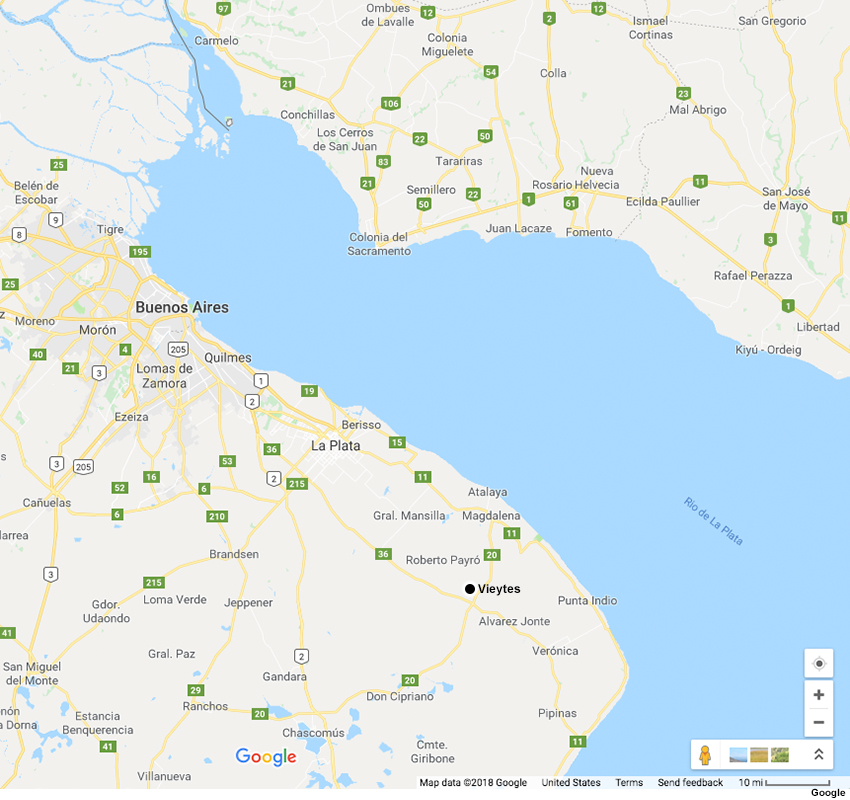
A map showing where the town of Vieytes is located in Argentina.
Scroll downward and click "next" at lower right to continue to the post-event analysis section.
Post-Severe Weather Event
Let’s take a look at satellite and radar observations into the night (0000 - 0300 UTC 18 March) to see how the storm changes after the tornado report.
IR
GLM Group Density
Question 1
Review the infrared satellite and GLM loop. Which of the following statements best describes the activity you see in the satellite data? Choose all that apply.
The correct answers are a, c, e.
Continue to the next question.
Question 2
What do the trends in the satellite data tell us about the behavior of the storm? Choose the best answer.
The correct answer is c.
Overall, the lightning activity steadies with time in the GLM, and the infrared satellite imagery shows a warming in the cloud top temperatures and a dissolving enhanced-V and overshooting top signature. These factors indicate that the convection is weakening. The main storm eventually converges with other storms from the north, transitioning into a larger MCS structure.
Summary
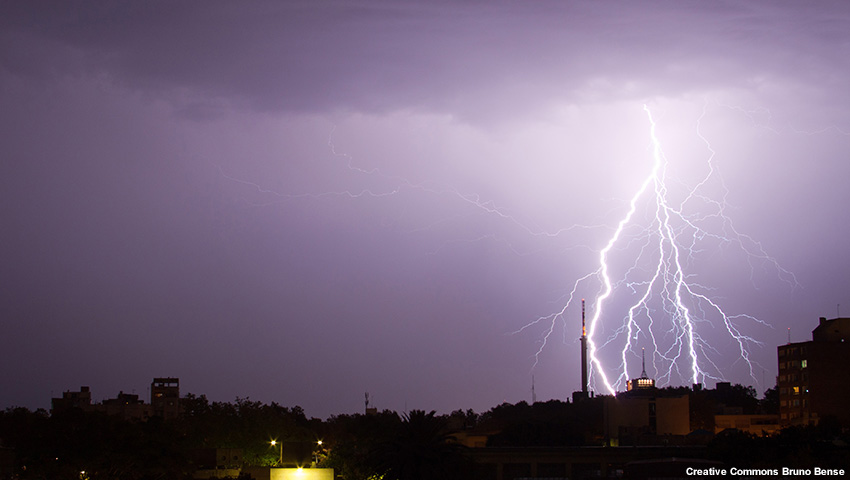
Lightning in Montevideo, Uruguay.
The GLM's continuous lightning monitoring capability will give forecasters a new tool for identifying, monitoring, and tracking developing thunderstorms 24 hours a day.
GLM observations allow forecasters to build situational awareness of a convective event by monitoring lightning flash rates and trends for individual storm cells. In this lesson we used GLM group density lightning detections to identify initial thunderstorm development near Buenos Aires and determine trends in storm intensity. Upward trends in GLM group density observations revealed a strengthening storm updraft. We were able to confirm this strengthening by analyzing increased depth and texture of the clouds, cooling cloud top temperatures, and other signatures of severe convection (such as enhanced-V, cold rings, and overshooting tops) in other satellite data.
GLM observations can complement other data sources, and is especially helpful in improving convective understanding in areas without radar coverage. The GLM instrument delivers the following:
- provides important trend information between radar scans (and between the 15-minute ABI updates),
- can indicate strong convection prior to a significant radar reflectivity signature (e.g. >~30 dBZ),
- is not affected by range-related detection efficiency degradation as does ground-based lightning detection,
- supplement other updraft strength indicators in satellite data (e.g. enhanced-V signatures, cold cloud top temperatures), and
- can alert users of imminent severe weather impacts by observing significant increases in lightning activity.
GLM observations combined with a forecaster's own experience and understanding of the local weather will benefit forecast operations and severe weather decision support efforts.
References
Geostationary Lightning Mapper Quick Guides:
- Definitions and Detection Methods
- Gridded Products - Flash Extent Density
- Data Quality
- Gridded Products - Average Flash Rate and Total Optical Energy
- GLM Full Disk Gridded Products
Geostationary Lightning Mapper Quick Briefs (.mp4):
- GLM Definitions and Detection Methods
- GLM Gridded Products
- GLM Data Quality
- GLM Average Flash Area and Total Optical Energy
- GLM Applications Overview
COMET MetEd Lesson - NWS Satellite Foundational Course for GOES-R: Introduction to the GLM
COMET MetEd Recording- GOES-R Series Faculty Virtual Course: Geostationary Lightning Mapper
COMET MetEd Lesson - GOES-R GLM: Introduction to the Geostationary Lightning Mapper
RAMMB CIRA Virtual Institute for Satellite Integration Training (VISIT) Quick Guides
Contributors
COMET Sponsors
MetEd and the COMET® Program are a part of the University Corporation for Atmospheric Research's (UCAR's) Community Programs (UCP) and are sponsored by
- NOAA's National Weather Service (NWS)
with additional funding by: - Bureau of Meteorology of Australia (BoM)
- Bureau of Reclamation, United States Department of the Interior
- European Organisation for the Exploitation of Meteorological Satellites (EUMETSAT)
- Meteorological Service of Canada (MSC)
- NOAA's National Environmental Satellite, Data and Information Service (NESDIS)
- NOAA's National Geodetic Survey (NGS)
- National Science Foundation (NSF)
- Naval Meteorology and Oceanography Command (NMOC)
- U.S. Army Corps of Engineers (USACE)
To learn more about us, please visit the COMET website.
Project Contributors
Project Lead
- Vanessa Vincente — UCAR/COMET
Instructional Design
- Andrea Smith — UCAR/COMET
Science Advisors
- Patrick Dills — UCAR/COMET
- Luciano Vidal — Servicio Meteorológico Nacional, Argentina
- Paola Salio — University of Buenos Aires, Argentina
- Martín Rugna — Servicio Meteorológico Nacional, Argentina
- María Paula Hobouchian — Servicio Meteorológico Nacional, Argentina
Additional Contributors
- Steve Goodman — NOAA/NESDIS
- Jim Gurka — University of Maryland/CICS
- Maria Ines Campos — Servicio Meteorológico Nacional, Argentina
- Scott Rudlosky — University of Maryland/CICS
Program Oversight
- Amy Stevermer — UCAR/COMET
Graphics/Animations
- Steve Deyo — UCAR/COMET
Multimedia Authoring/Interface Design
- Gary Pacheco — UCAR/COMET
COMET Staff, September 2018
Director's Office
- Dr. Elizabeth Mulvihill Page, Director
- Tim Alberta, Assistant Director Operations and IT
- Paul Kucera, Assistant Director International Programs
Business Administration
- Lorrie Alberta, Administrator
- Auliya McCauley-Hartner, Administrative Assistant
- Tara Torres, Program Coordinator
IT Services
- Bob Bubon, Systems Administrator
- Joshua Hepp, Student Assistant
- Joey Rener, Software Engineer
- Malte Winkler, Software Engineer
Instructional Services
- Dr. Alan Bol, Scientist/Instructional Designer
- Sarah Ross-Lazarov, Instructional Designer
- Tsvetomir Ross-Lazarov, Instructional Designer
International Programs
- Rosario Alfaro Ocampo, Translator/Meteorologist
- David Russi, Translations Coordinator
- Martin Steinson, Project Manager
Production and Media Services
- Steve Deyo, Graphic and 3D Designer
- Dolores Kiessling, Software Engineer
- Gary Pacheco, Web Designer and Developer
- Sylvia Quesada, Production Assistant
Science Group
- Dr. William Bua, Meteorologist
- Patrick Dills, Meteorologist
- Bryan Guarente, Instructional Designer/Meteorologist
- Matthew Kelsch, Hydrometeorologist
- Erin Regan, Student Assistant
- Andrea Smith, Meteorologist
- Amy Stevermer, Meteorologist
- Vanessa Vincente, Meteorologist