Media Gallery
Media elements used in this module are protected by a variety of copyright licenses. Please use the "copyright terms" link associated with each item below for more information.
Description:
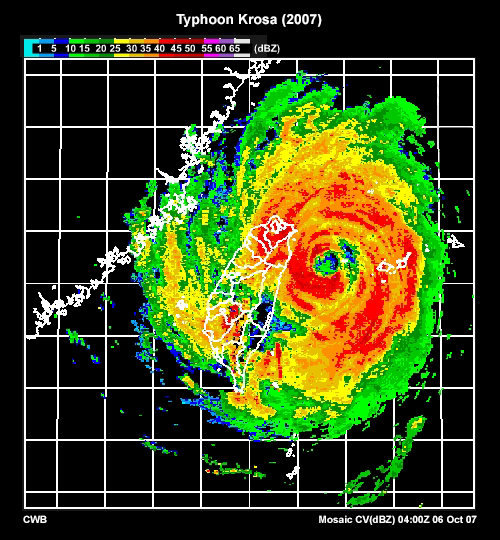
Radar image of Typhoon Krosa at 04 UTC on October 6, 2007.
File Name:
ana01_krosa_radar.jpg
Credits:
CWB
Copyright Terms:
COMET Standard Terms of Use
Description:
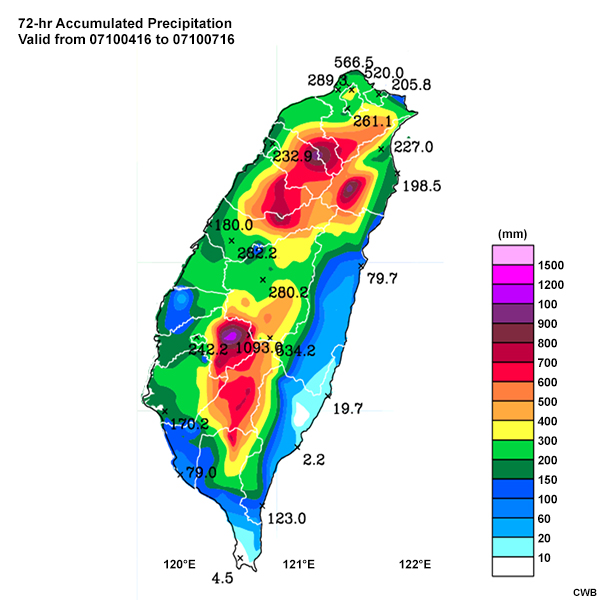
72-hour accumulated precipitation from 16 UTC October 4 to 16 UTC October 7, 2007 during Typhoon Krosa.
File Name:
ana01_krosa_rain.jpg
Credits:
CWB
Copyright Terms:
COMET Standard Terms of Use
Description:
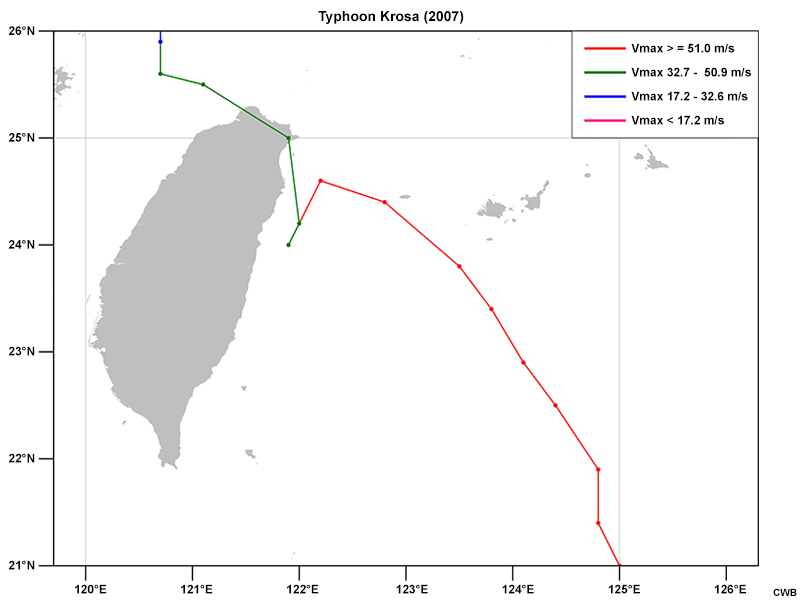
Best track and intensity of Typhoon Krosa (2007).
File Name:
ana01_krosa_track.jpg
Credits:
CWB
Copyright Terms:
COMET Standard Terms of Use
Description:
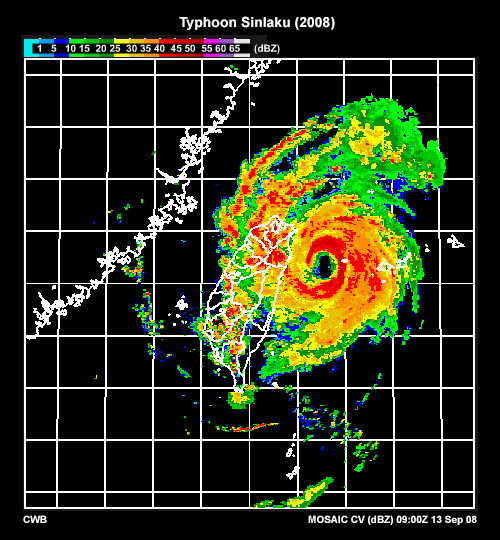
Radar image of Typhoon Sinlaku at 09 UTC on September 13, 2008.
File Name:
ana01_sinlaku_radar.jpg
Credits:
CWB
Copyright Terms:
COMET Standard Terms of Use
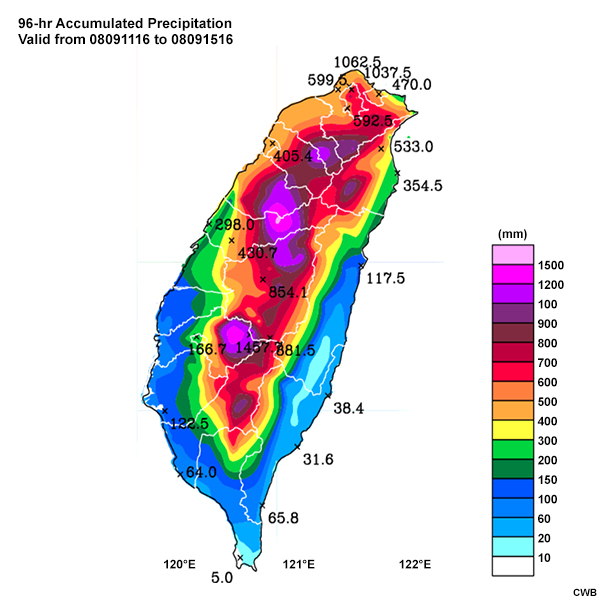
Description:
96-hour accumulated precipitation from 16 UTC September 11 to 16 UTC September 15, 2008 during Typhoon Sinlaku.
File Name:
ana01_sinlaku_rain.jpg
Credits:
CWB
Copyright Terms:
COMET Standard Terms of Use
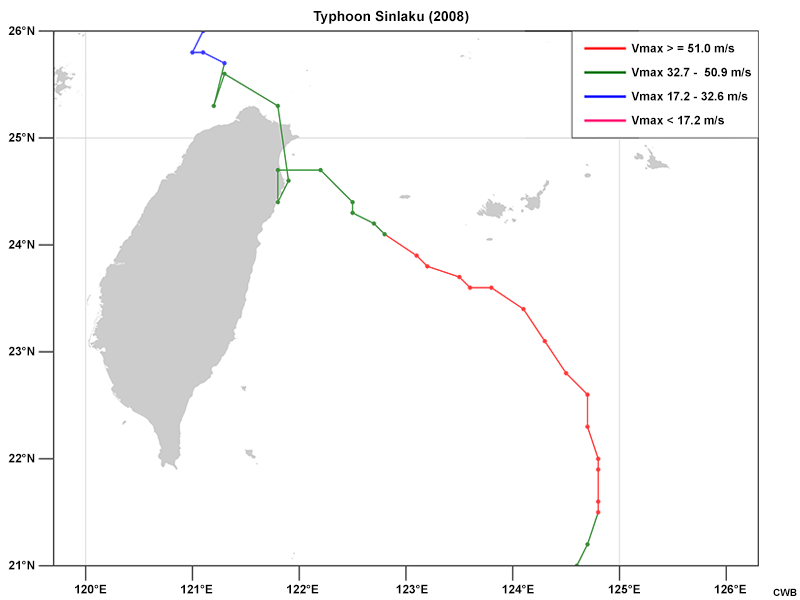
Description:
Best track and intensity of Typhoon Sinlaku (2008).
File Name:
ana01_sinlaku_track.jpg
Credits:
CWB
Copyright Terms:
COMET Standard Terms of Use
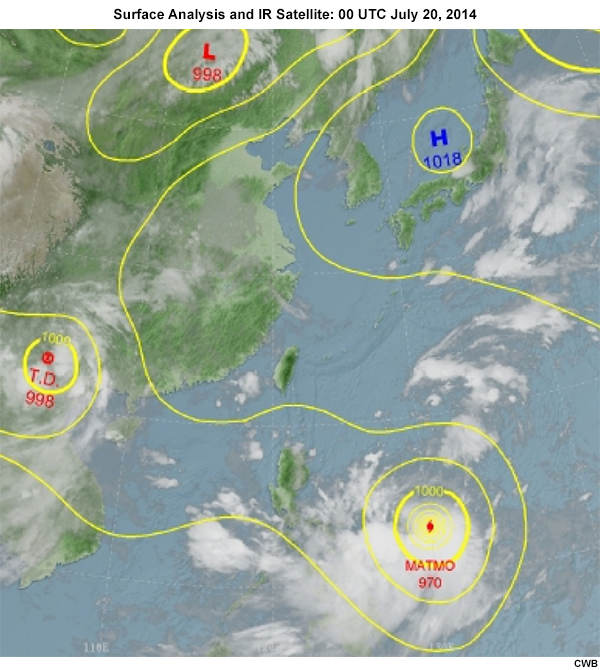
Description:
Surface weather chart overlaid with IR satellite imagery for Typhoon Matmo (2014).
File Name:
case1_01_surfchart_01.htm
Credits:
CWB
Copyright Terms:
COMET Standard Terms of Use
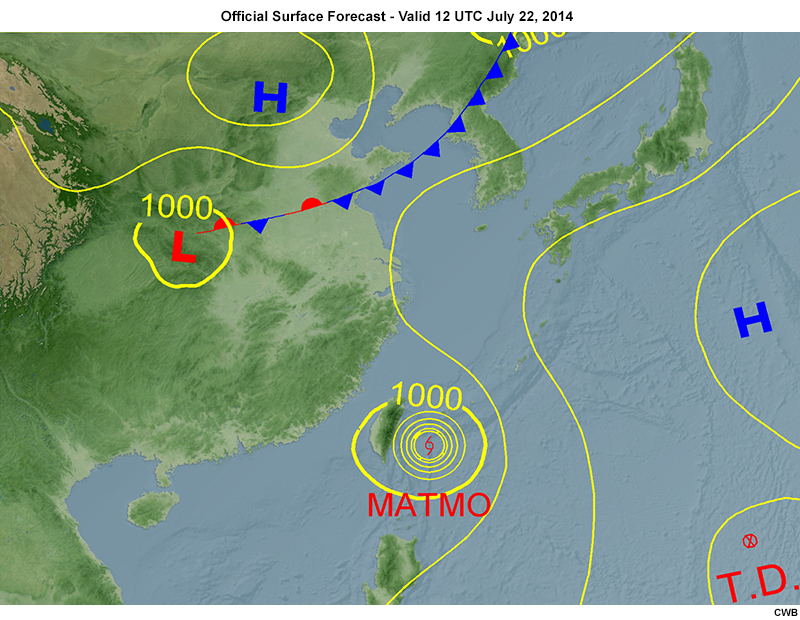
Description:
Official surface forecast chart issued at 03 UTC July 21st. The forecast hour is at 12 UTC from July 22nd to July 24th in 24-hour intervals.
File Name:
case1_02_fcstchart_01.htm
Credits:
CWB
Copyright Terms:
COMET Standard Terms of Use
Description:
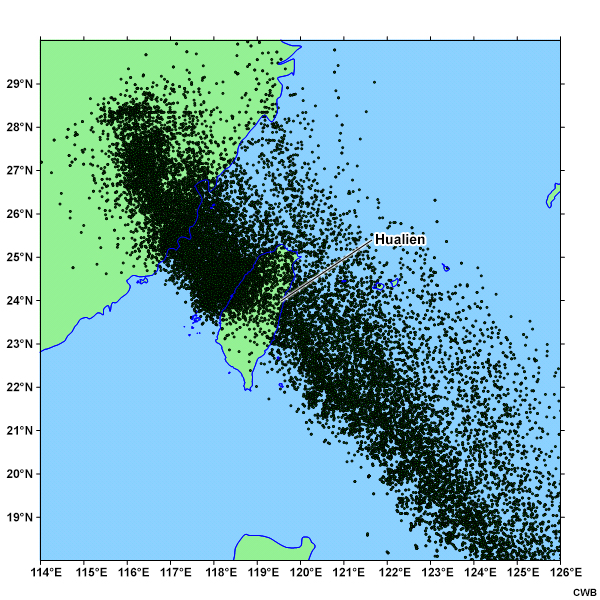
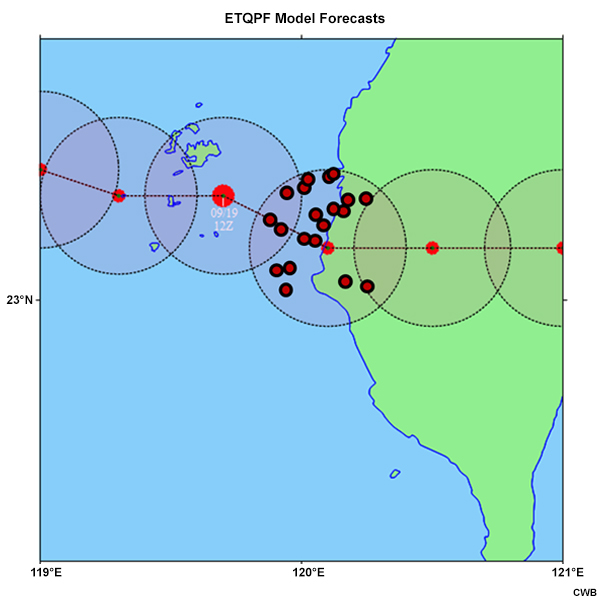
The distribution of predicted storm center locations (black dots) of Typhoon Matmo (2014) from the ensemble prediction system.
File Name:
case1_04_alldots.jpg
Credits:
CWB
Copyright Terms:
COMET Standard Terms of Use
Description:
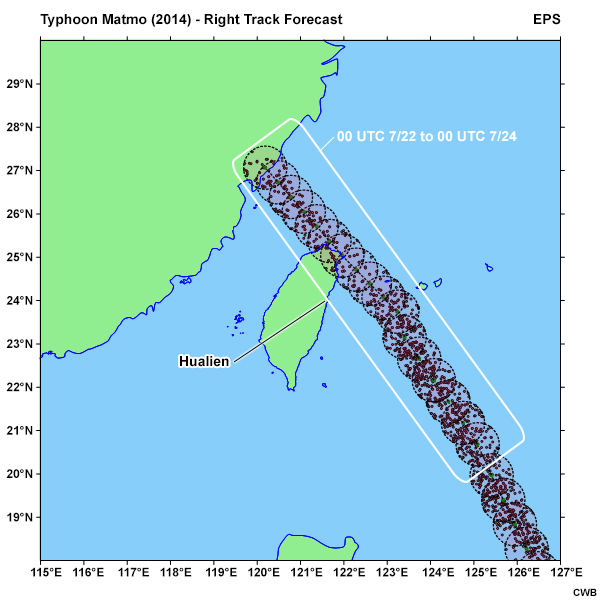
Northern track forecast of Typhoon Matmo (2014), with predicted storm center locations (black dots) using a 50-km filtering radius and translation speed of 10 km/h.
File Name:
case1_04_northtrack.jpg
Credits:
CWB
Copyright Terms:
COMET Standard Terms of Use
Description:
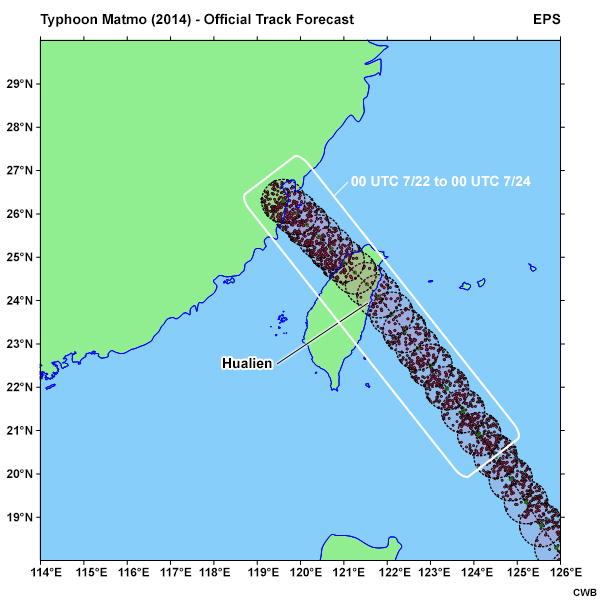
Official track forecast of Typhoon Matmo (2014), with predicted storm center locations (black dots) using a 50-km filtering radius and translation speed of 10 km/h.
File Name:
case1_04_offtrack.jpg
Credits:
CWB
Copyright Terms:
COMET Standard Terms of Use
Description:
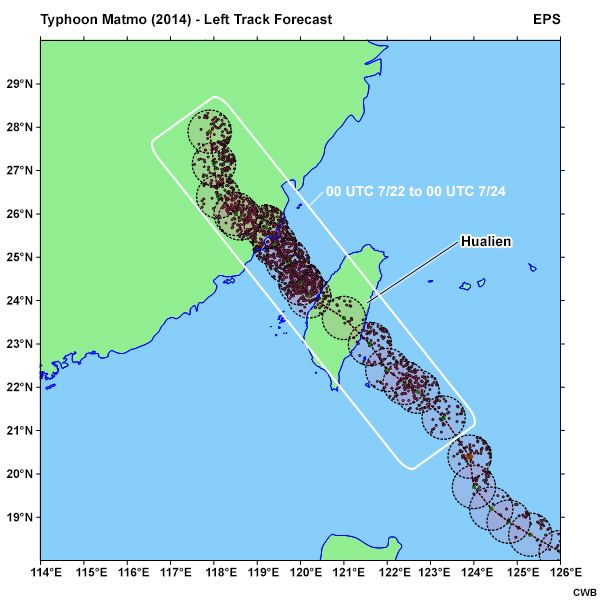
Southern track forecast of Typhoon Matmo (2014), with predicted storm center locations (black dots) using a 50-km filtering radius and translation speed of 10 km/h.
File Name:
case1_04_southtrack.jpg
Credits:
CWB
Copyright Terms:
COMET Standard Terms of Use
Description:
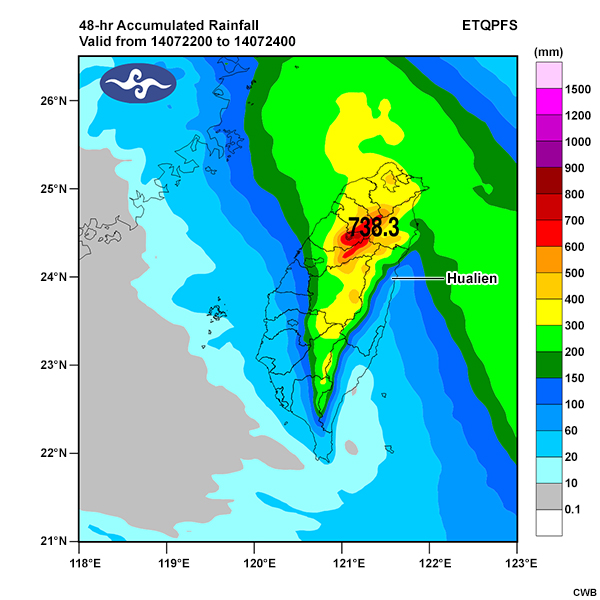
48-hour predicted accumulated rainfall of Track-R for Typhoon Matmo.
File Name:
case1_05_north.jpg
Credits:
CWB
Copyright Terms:
COMET Standard Terms of Use
Description:
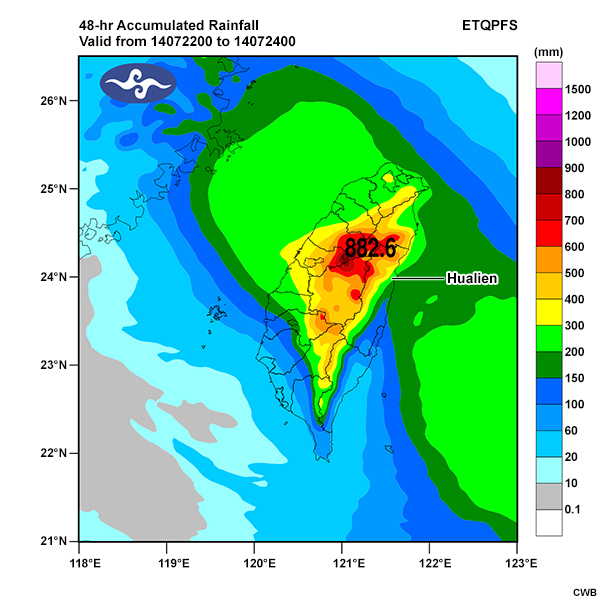
48-hour predicted accumulated rainfall of Track-O for Typhoon Matmo.
File Name:
case1_05_off.jpg
Credits:
CWB
Copyright Terms:
COMET Standard Terms of Use
Description:
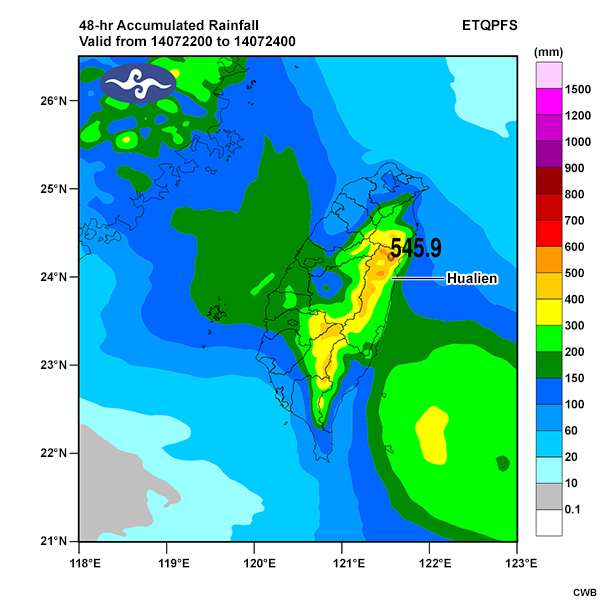
48-hour predicted accumulated rainfall of Track-L for Typhoon Matmo.
File Name:
case1_05_south.jpg
Credits:
CWB
Copyright Terms:
COMET Standard Terms of Use
Description:
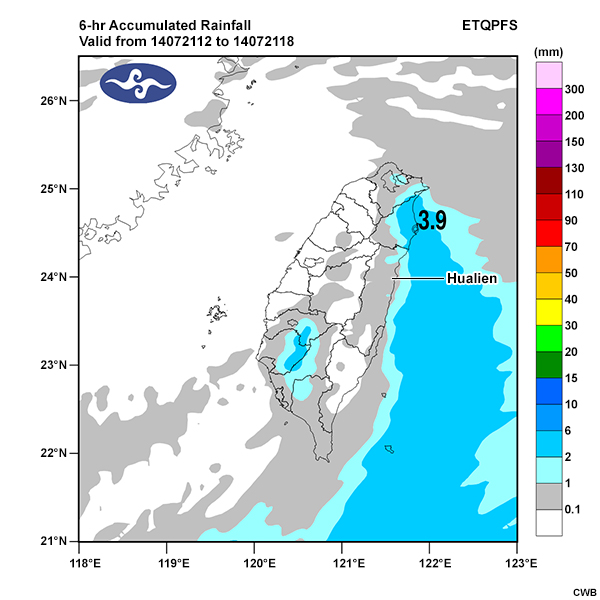
ETQPF 6-hour accumulated rainfall based on the northern track for Typhoon Matmo.
File Name:
case1_06_north_timing_01.htm
Credits:
CWB
Copyright Terms:
COMET Standard Terms of Use
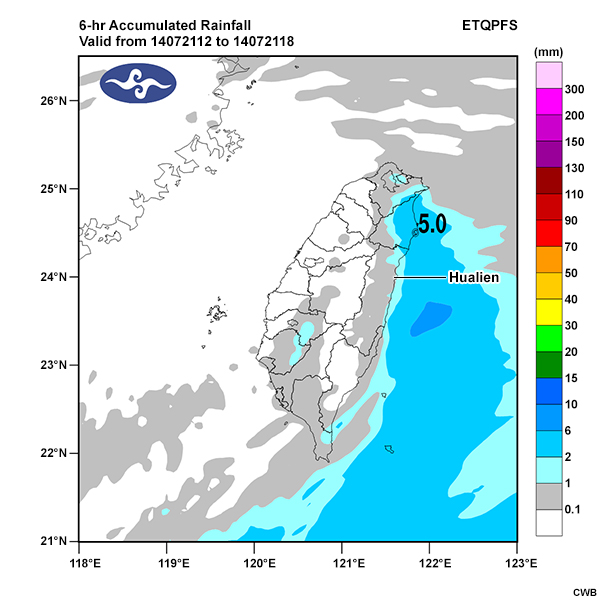
Description:
ETQPF 6-hour accumulated rainfall based on the official track for Typhoon Matmo.
File Name:
case1_06_off_timing_01.htm
Credits:
CWB
Copyright Terms:
COMET Standard Terms of Use
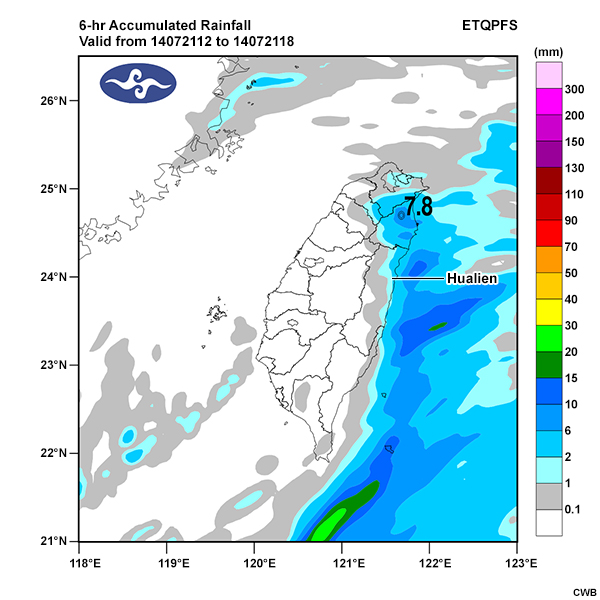
Description:
ETQPF 6-hour accumulated rainfall based on the southern track for Typhoon Matmo.
File Name:
case1_06_south_track_timing_01.htm
Credits:
CWB
Copyright Terms:
COMET Standard Terms of Use

Description:
Typhoon Matmo's (2014) actual track.
File Name:
case1_07_MatmoTrack.jpg
Credits:
CWB
Copyright Terms:
COMET Standard Terms of Use
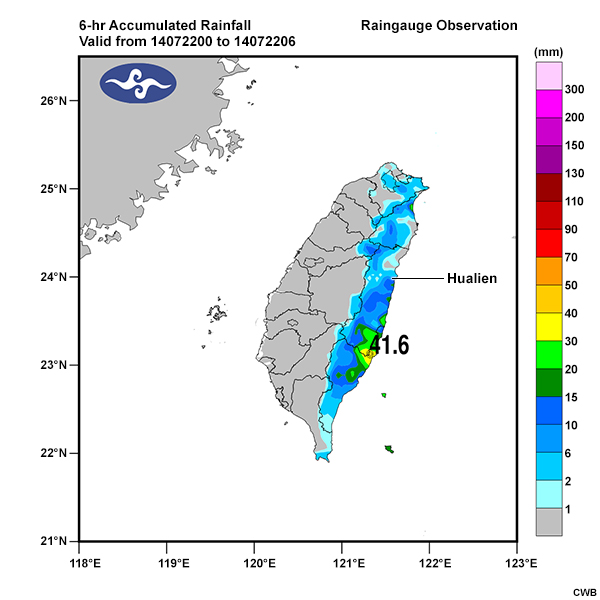
Description:
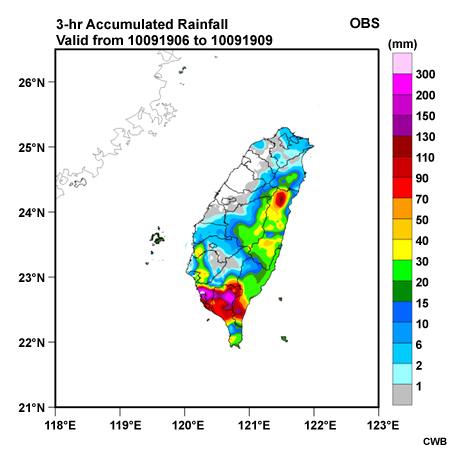
The 6-hour accumulated rainfall observations for the period 00 UTC July 22 to 00 UTC July 24, 2014 during Typhoon Matmo.
File Name:
case1_07_obs_01.htm
Credits:
CWB
Copyright Terms:
COMET Standard Terms of Use
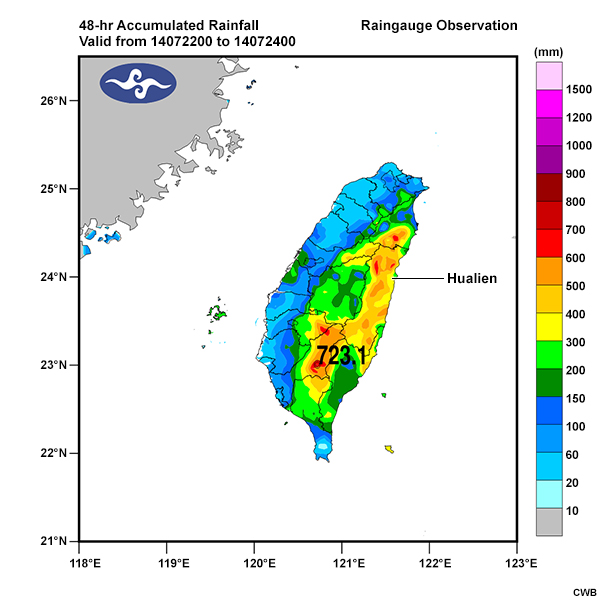
Description:
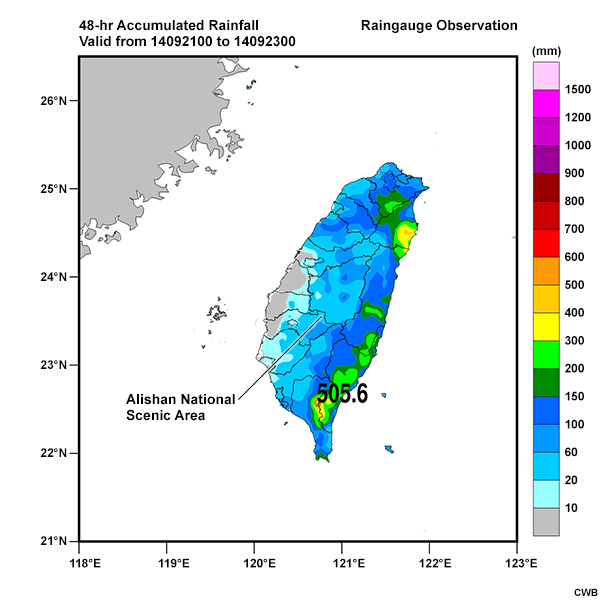
The 48-hour accumulated rainfall observations for the period 00 UTC July 22 to 00 UTC July 24, 2014 during Typhoon Matmo.
File Name:
case1_07_obs_totals.jpg
Credits:
CWB
Copyright Terms:
COMET Standard Terms of Use
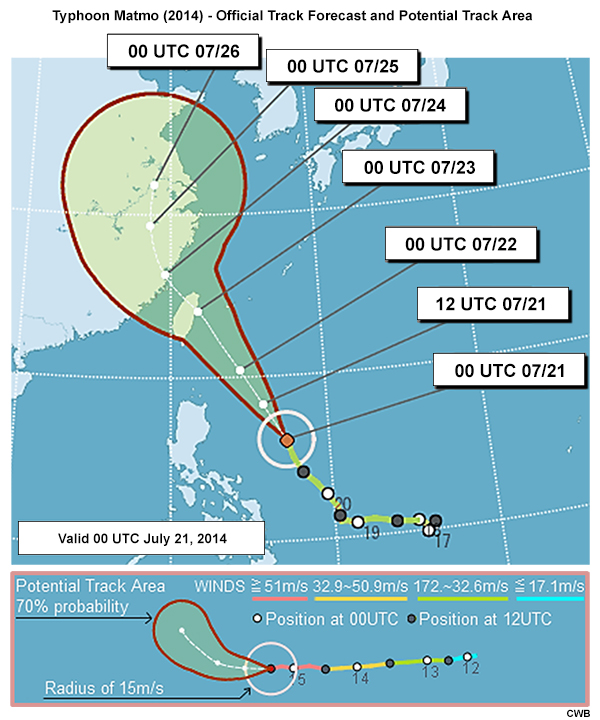
Description:
Official track forecast with potential track area for Typhoon Matmo (2014).
File Name:
case1_offtrack_pta.jpg
Credits:
CWB
Copyright Terms:
COMET Standard Terms of Use
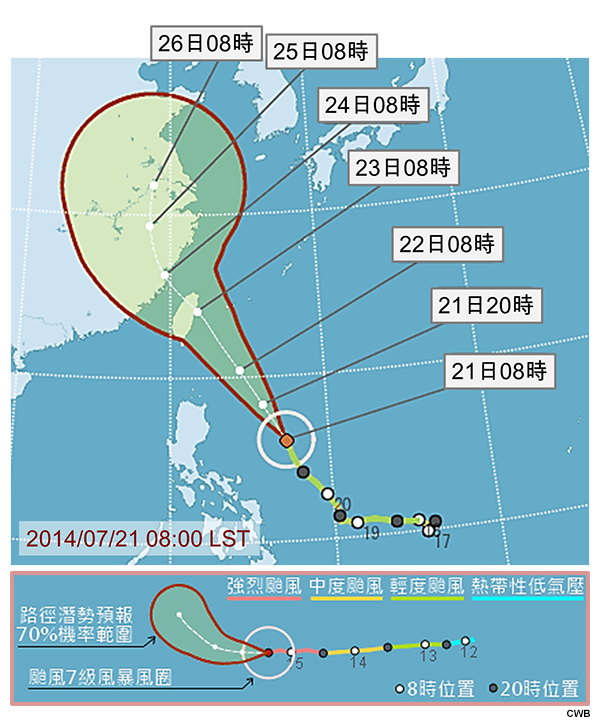
Description:
Official track forecast with potential track area for Typhoon Matmo (2014).
File Name:
case1_offtrack_pta_tw.jpg
Credits:
CWB
Copyright Terms:
COMET Standard Terms of Use
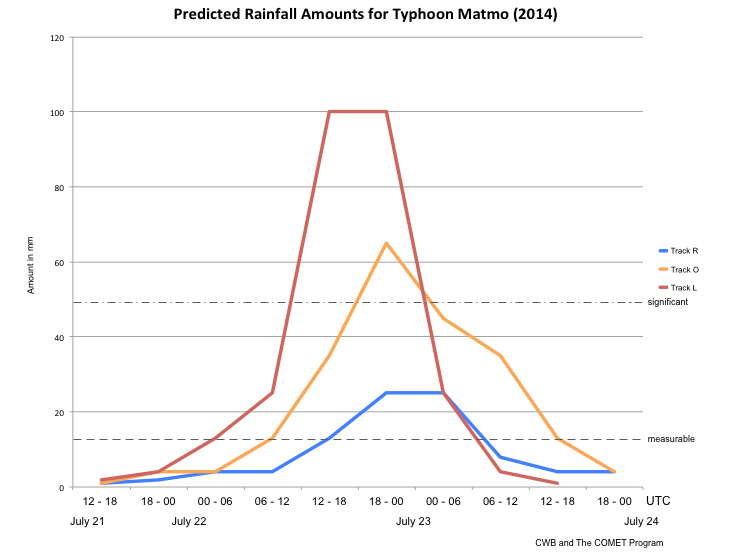
Description:
The ETQPF amounts based on the right, official, and left track forecasts for Typhoon Matmo (2014).
File Name:
case1_qpf_all_tracks.jpg
Credits:
CWB
Copyright Terms:
COMET Standard Terms of Use
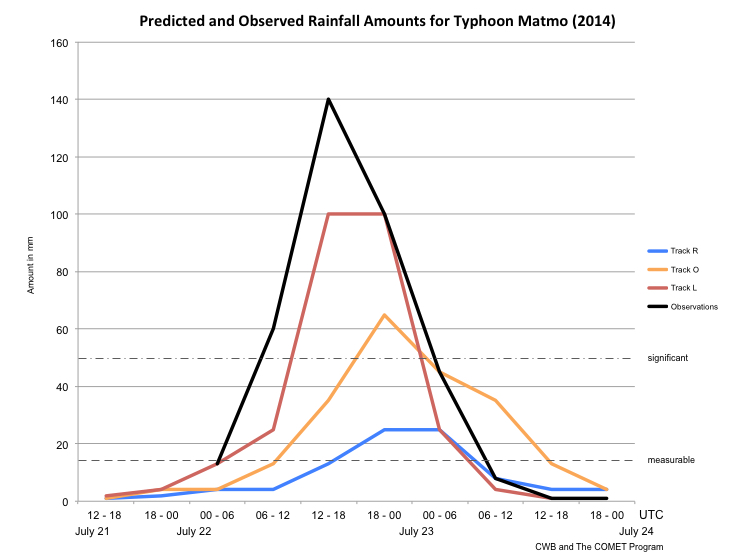
Description:
The observations and ETQPF amounts based on the right, official, and left track forecasts for Typhoon Matmo (2014).
File Name:
case1_qpfobs_all_tracks.jpg
Credits:
CWB
Copyright Terms:
COMET Standard Terms of Use
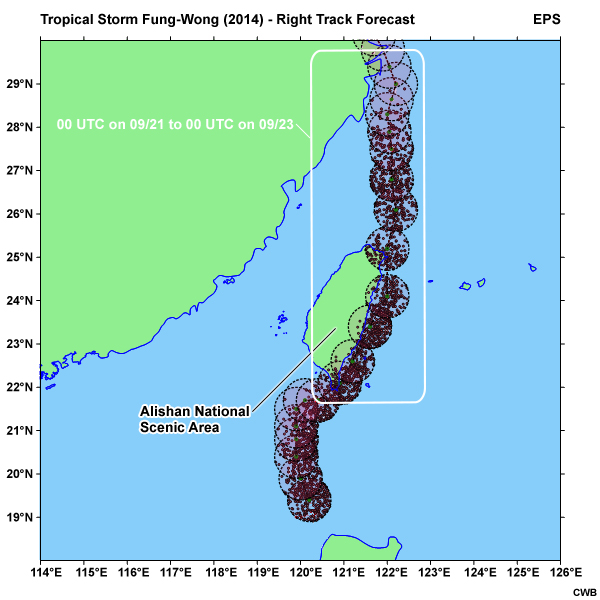
Description:
Right track forecast of Tropical Storm Fung-Wong (2014), with predicted storm center locations (black dots) using a 50-km filtering radius and translation speed error of +/- 10 km/h.
File Name:
case2_04_midtrack.jpg
Credits:
CWB
Copyright Terms:
COMET Standard Terms of Use
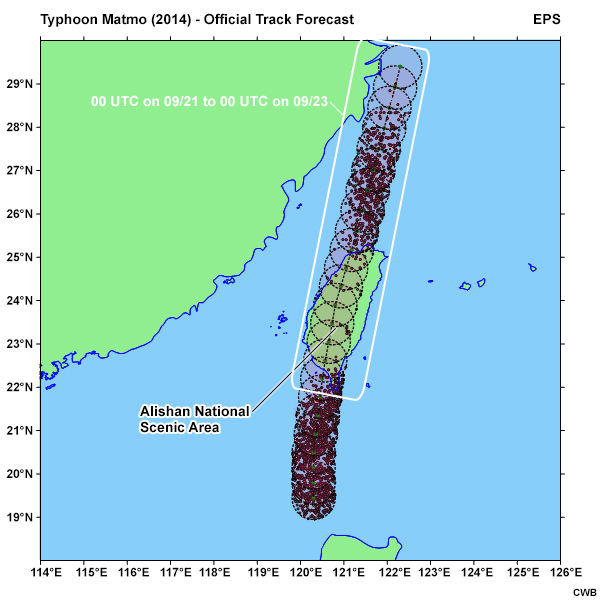
Description:
Official track forecast of Tropical Storm Fung-Wong (2014), with predicted storm center locations (black dots) using a 50-km filtering radius and translation speed error of +/- 10 km/h.
File Name:
case2_04_offtrack.jpg
Credits:
CWB
Copyright Terms:
COMET Standard Terms of Use
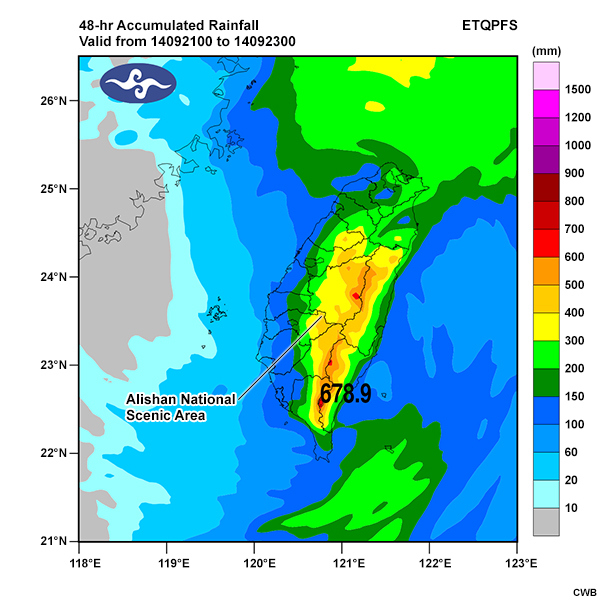
Description:
The 48-hour accumulated rainfall for the period 00 UTC September 21 to 00 UTC September 23, 2014 predicted by ETQPF model based on forecast track-O for Tropical Storm Fung-Wong.
File Name:
case2_05_off.jpg
Credits:
CWB
Copyright Terms:
COMET Standard Terms of Use
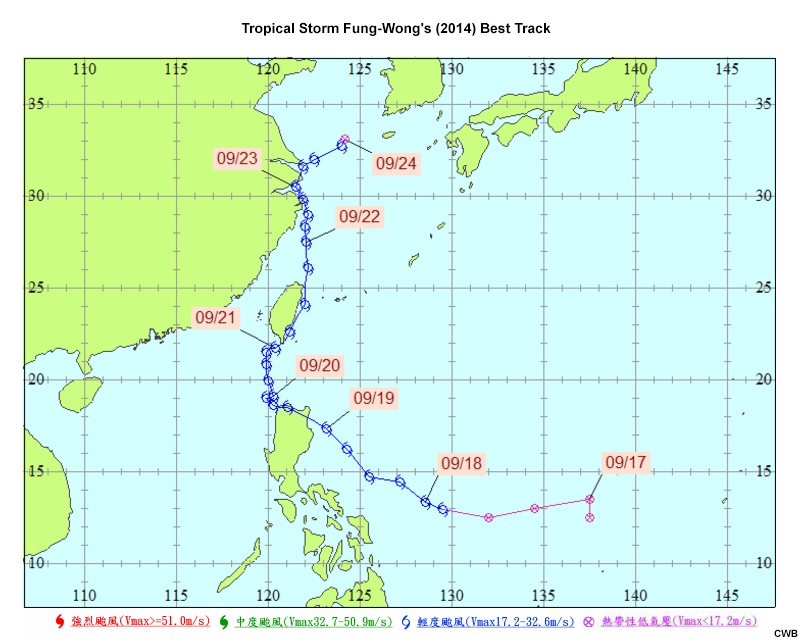
Description:
Tropical Storm Fung-Wong's (2014) actual track.
File Name:
case2_07_FWTrack.jpg
Credits:
CWB
Copyright Terms:
COMET Standard Terms of Use
Description:
The 48-hour accumulated rainfall observations for the period 00 UTC September 21 to 00 UTC September 23, 2014 during Typhoon Fung-Wong.
File Name:
case2_07_obs_48.jpg
Credits:
CWB
Copyright Terms:
COMET Standard Terms of Use
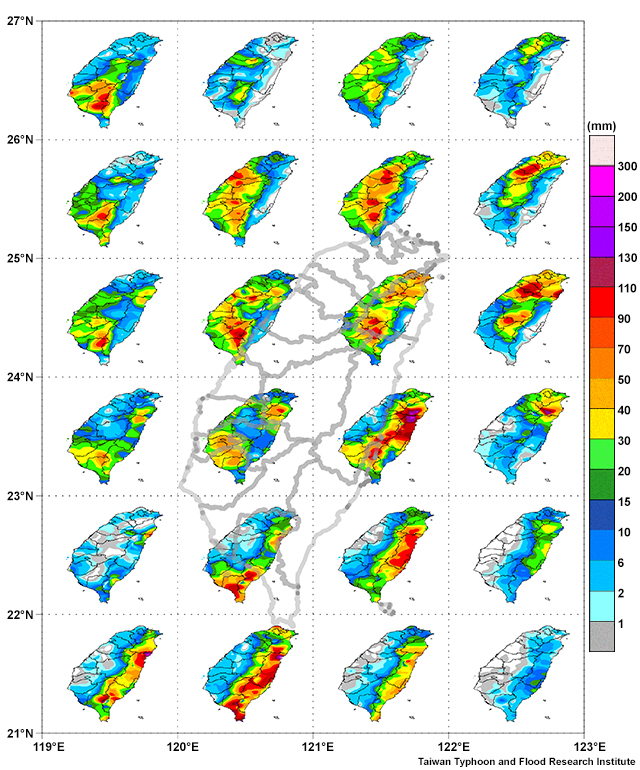
Description:
The climatological rainfall map, a statistical precipitation distribution across Taiwan relative to different typhoon positions based on a 1� x 1� grid difference. The smaller, colorful islands describe the 3-hour precipitation distribution that could occur if the typhoon was in that grid space relative to Taiwan (background island outline).
File Name:
clim02_puzzle_map_01.jpg
Credits:
Taiwan Typhoon and Flood Research Institute
Copyright Terms:
COMET Standard Terms of Use
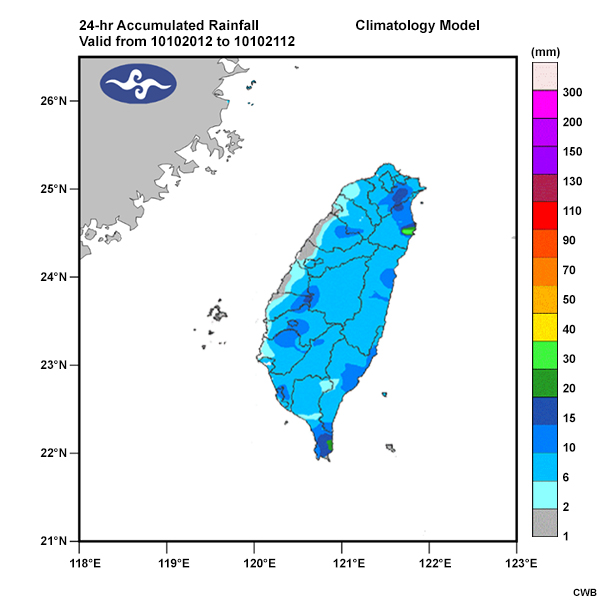
Description:
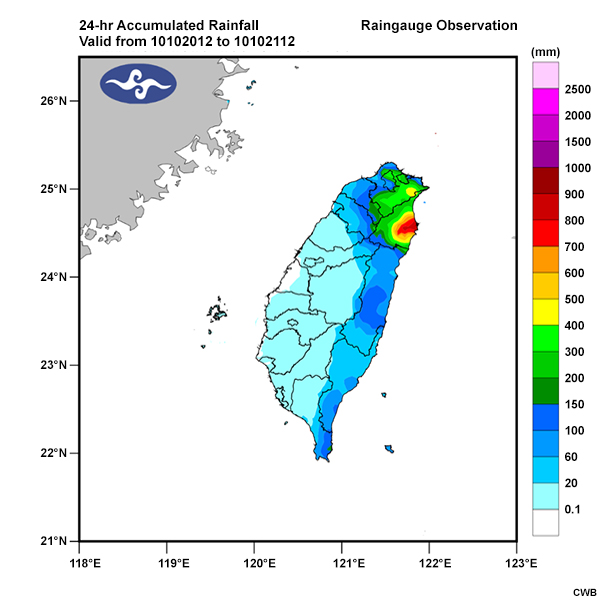
The 24-hour accumulated rainfall from the climatology model based on the best track of Typhoon Megi for the period 12 UTC October 20 to 12 UTC October 21, 2010. Note that the rainfall scale maximizes at 300 mm.
File Name:
clim03_megi_climodel.jpg
Credits:
CWB
Copyright Terms:
COMET Standard Terms of Use
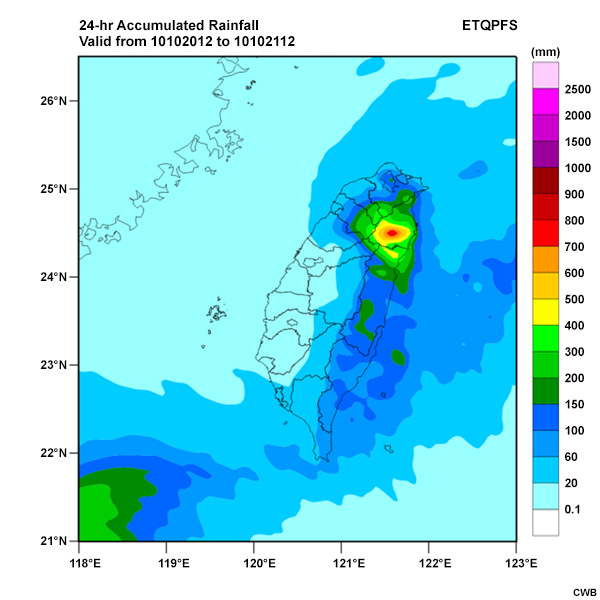
Description:
The 24-hour accumulated rainfall from the ETQPF model based on the best track of Typhoon Megi for the period 12 UTC October 20 to 12 UTC October 21, 2010.
File Name:
clim03_megi_etqpf.jpg
Credits:
CWB
Copyright Terms:
COMET Standard Terms of Use
Description:
The 24-hour accumulated rainfall observations based on the best track of Typhoon Megi for the period 12 UTC October 20 to 12 UTC October 21, 2010.
File Name:
clim03_megi_obs.jpg
Credits:
CWB
Copyright Terms:
COMET Standard Terms of Use
Description:
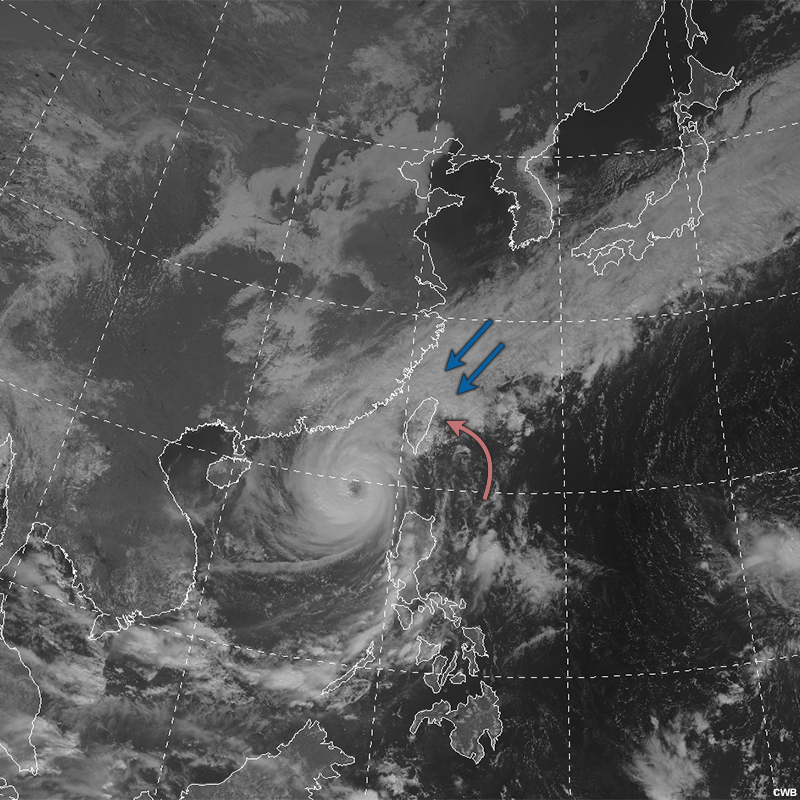
Visible satellite image of Typhoon Megi at 0330 UTC on October 21, 2010. The arrows show that the cool, northeasterly monsoonal flow (blue arrow) and the warm, moist southerly flow from the typhoon (red arrow) converged over northeastern Taiwan.
File Name:
clim03_megi_vis.jpg
Credits:
CWB
Copyright Terms:
COMET Standard Terms of Use
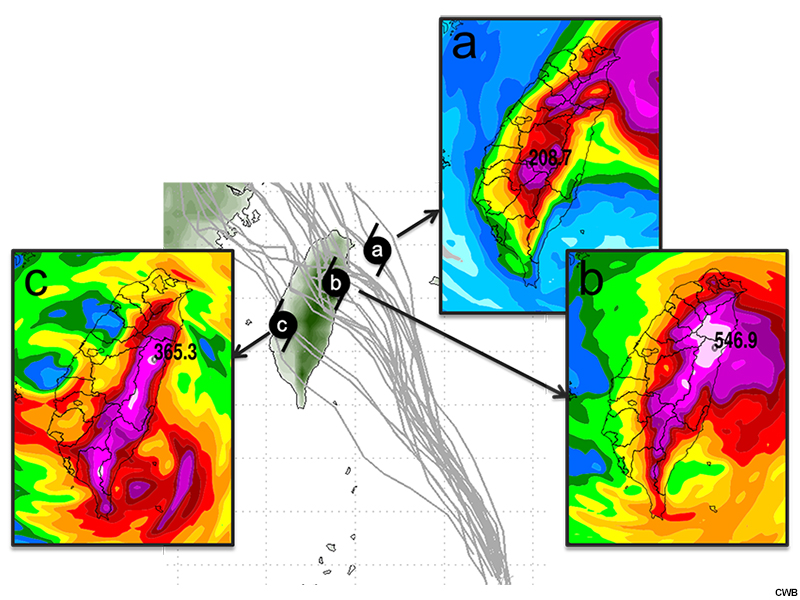
Description:
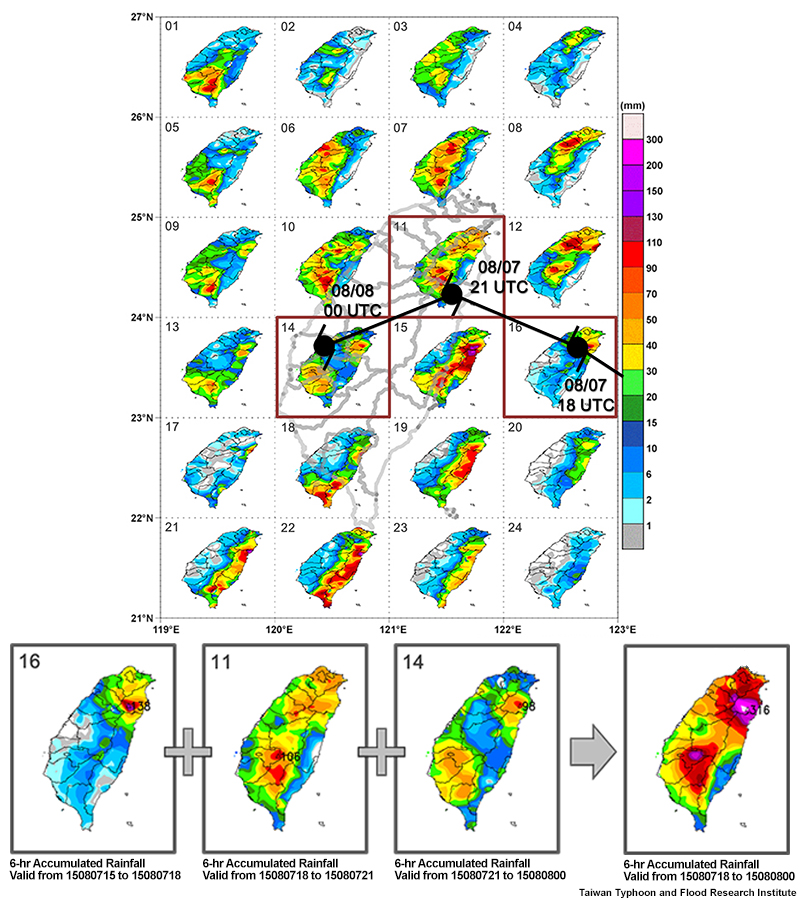
The top image is the climatological rainfall map with the best track of Typhoon Soudelor (2015). The bottom image shows the three specific grid boxes from the climatological rainfall map that will be used to generate the 6-hr quantitative precipitation forecast for Typhoon Soudelor valid on 00 UTC August 8, 2015.
File Name:
climo02_map_qpf.jpg
Credits:
Taiwan Typhoon and Flood Research Institute
Copyright Terms:
COMET Standard Terms of Use
Description:
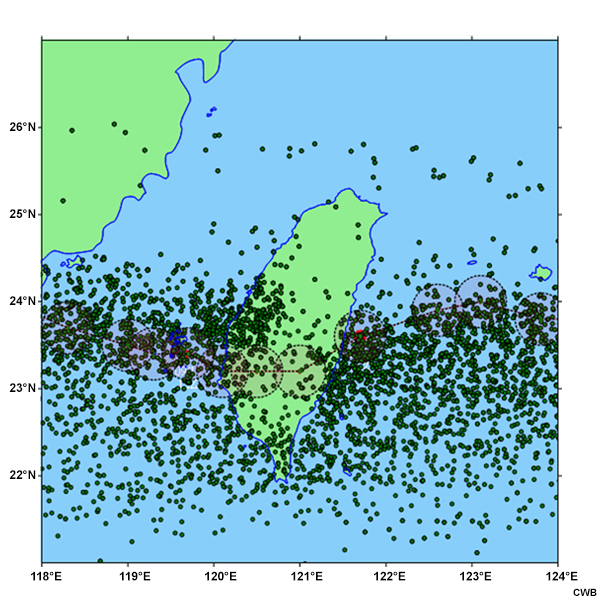
The distribution of predicted center locations (black dots) of Typhoon Fanapi (2010) in 3-hour intervals from the ensemble prediction system. Each dot is associated with a 3-hour accumulated QPF. The dashed red line is for a given typhoon track with position locations every 3 hours, and a 30 km filtering radius is centered at each position (pink circle).
File Name:
etqpf01_AllDots.jpg
Credits:
CWB
Copyright Terms:
COMET Standard Terms of Use
Description:
Image showing various ETQPFs based on typhoon positions.
File Name:
etqpf02_FiltCases.jpg
Credits:
CWB
Copyright Terms:
COMET Standard Terms of Use
Description:
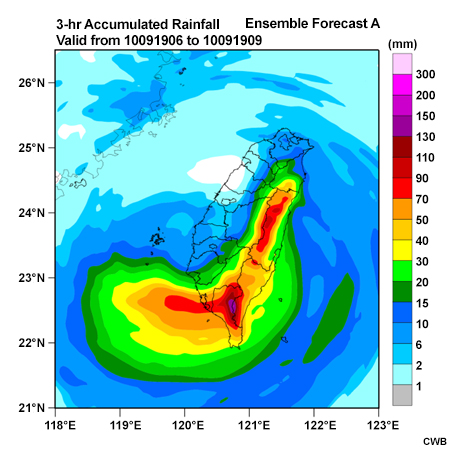
Ensemble Forecast A
File Name:
etqpf03_criteria_a.jpg
Credits:
CWB
Copyright Terms:
COMET Standard Terms of Use
Description:
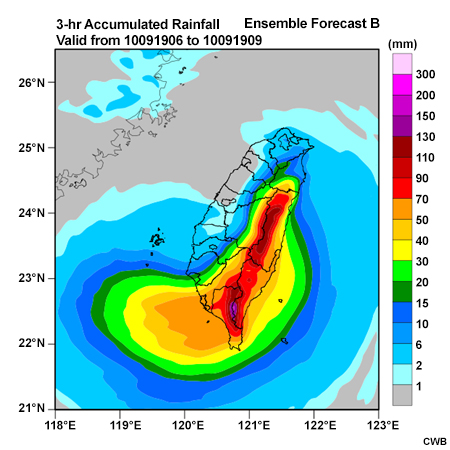
Ensemble Forecast B
File Name:
etqpf03_criteria_b.jpg
Credits:
CWB
Copyright Terms:
COMET Standard Terms of Use
Description:
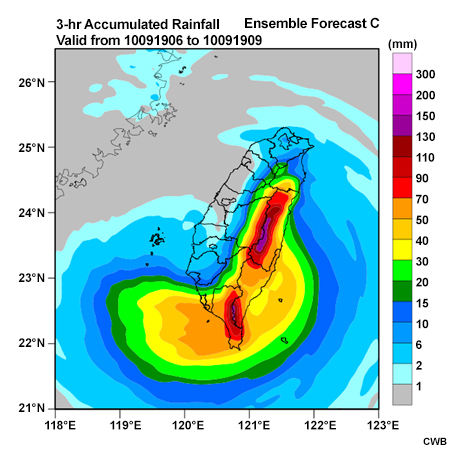
Ensemble Forecast C
File Name:
etqpf03_criteria_c.jpg
Credits:
CWB
Copyright Terms:
COMET Standard Terms of Use
Description:
Observed rainfall.
File Name:
etqpf03_obs_d.jpg
Credits:
CWB
Copyright Terms:
COMET Standard Terms of Use
Description:
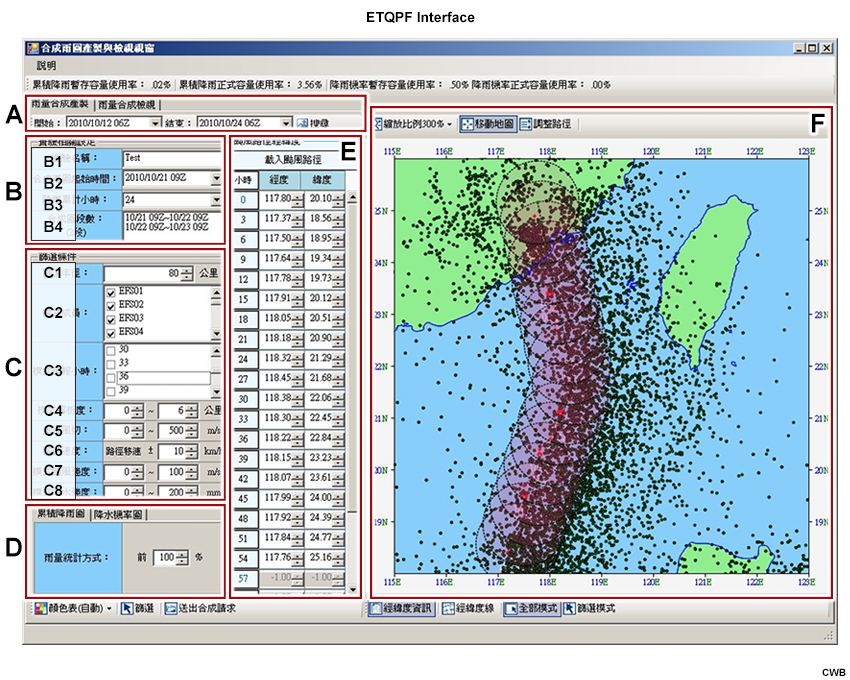
The ETQPF interface that displays A) time period of available QPFs, B) experiment-related settings, B1) name of experiment, B2) composite precipitation start time, B3) accumulated hours, B4) composite periods, C) filtering conditions, C1) filtering radius, C2) ensemble members, C3) model forecast hours, C4) model resolution, C5) vertical wind shear, C6) translation speed error, C7) storm intensity, C8) precipitation intensity, D) percentile of rainfall amount, E) typhoon track setting (to load from official track), and F) interactive interface for predicted track adjustment.
File Name:
etqpf05_interface.jpg
Credits:
CWB
Copyright Terms:
COMET Standard Terms of Use
Description:
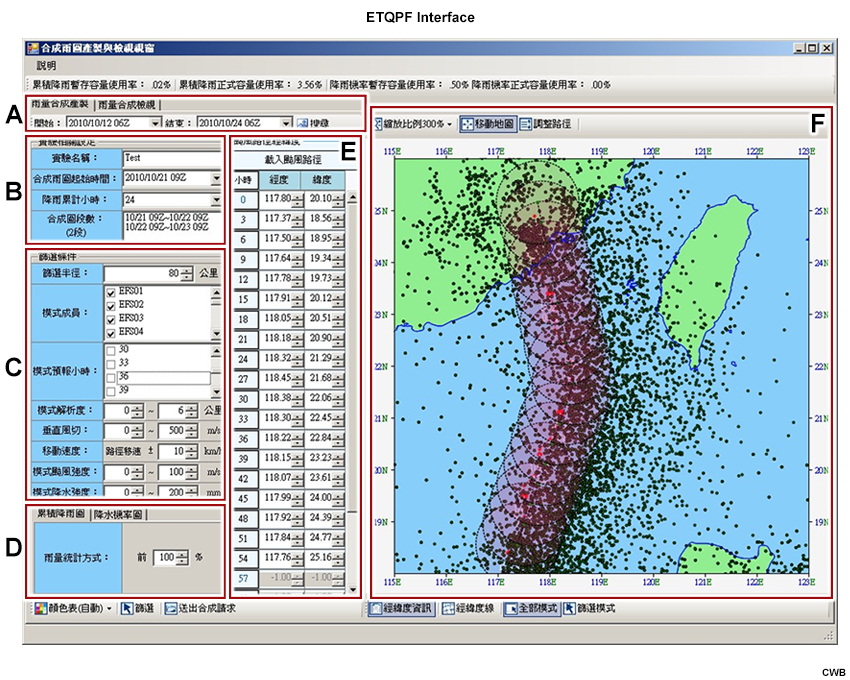
The ETQPF interface that displays A) time period of available QPFs, B) experiment-related settings, B1) name of experiment, B2) composite precipitation start time, B3) accumulated hours, B4) composite periods, C) filtering conditions, C1) filtering radius, C2) ensemble members, C3) model forecast hours, C4) model resolution, C5) vertical wind shear, C6) translation speed error, C7) storm intensity, C8) precipitation intensity, D) percentile of rainfall amount, E) typhoon track setting (to load from official track), and F) interactive interface for predicted track adjustment.
File Name:
etqpf05_interface_tw.jpg
Credits:
CWB
Copyright Terms:
COMET Standard Terms of Use
Description:
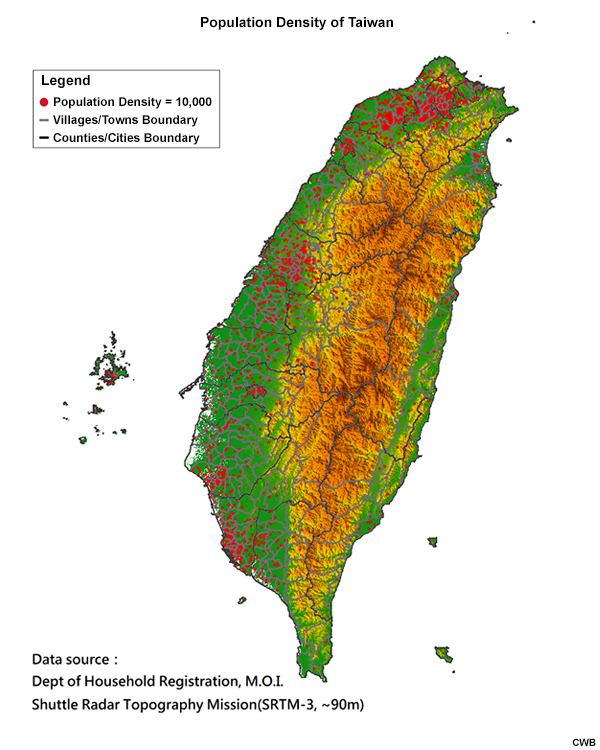
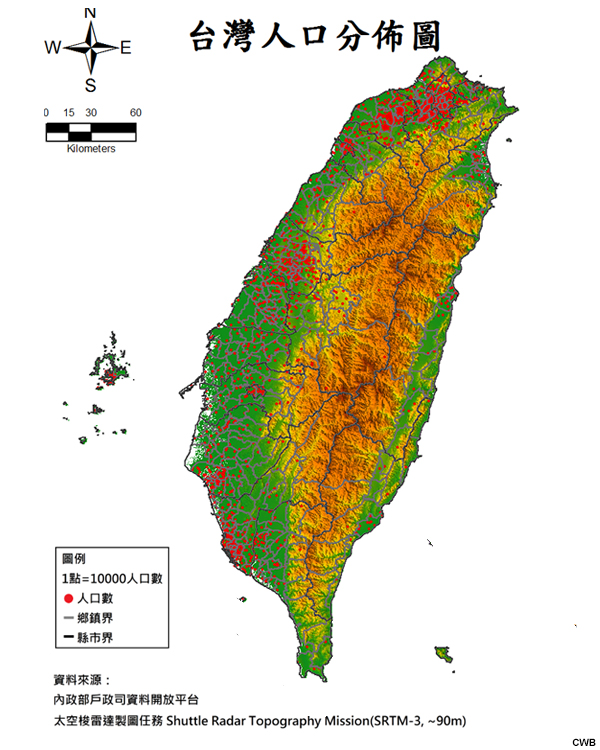
Population density map of Taiwan.
File Name:
intro01_population_eng.jpg
Credits:
CWB
Copyright Terms:
COMET Standard Terms of Use
Description:
Population density map of Taiwan.
File Name:
intro01_population_tw.jpg
Credits:
CWB
Copyright Terms:
COMET Standard Terms of Use

Description:
Track forecast for Typhoon Matmo (2014).
File Name:
intro02_track_matmo.jpg
Credits:
CWB
Copyright Terms:
COMET Standard Terms of Use
Description:
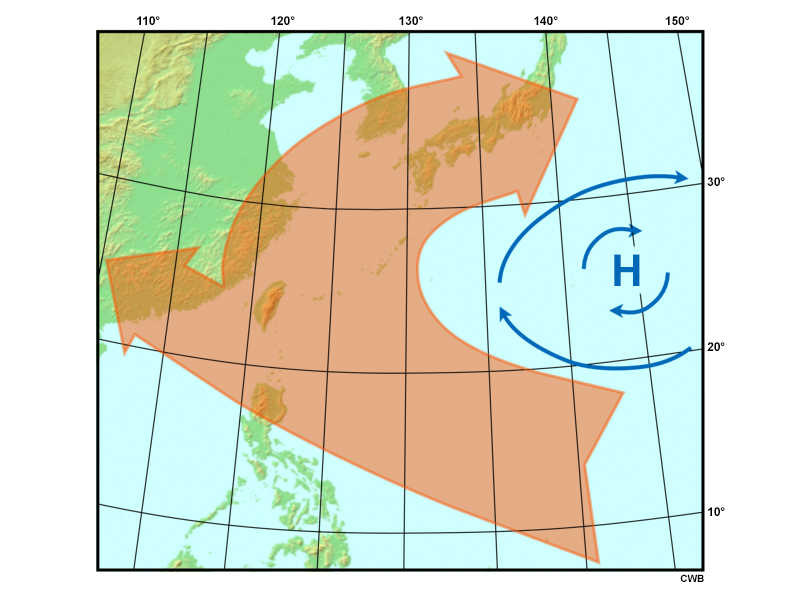
Typical paths of typhoons originating in the Northwest Pacific Ocean that are influenced by the Pacific subtropical high.
File Name:
intro03_track_01.jpg
Credits:
CWB
Copyright Terms:
COMET Standard Terms of Use
Description:
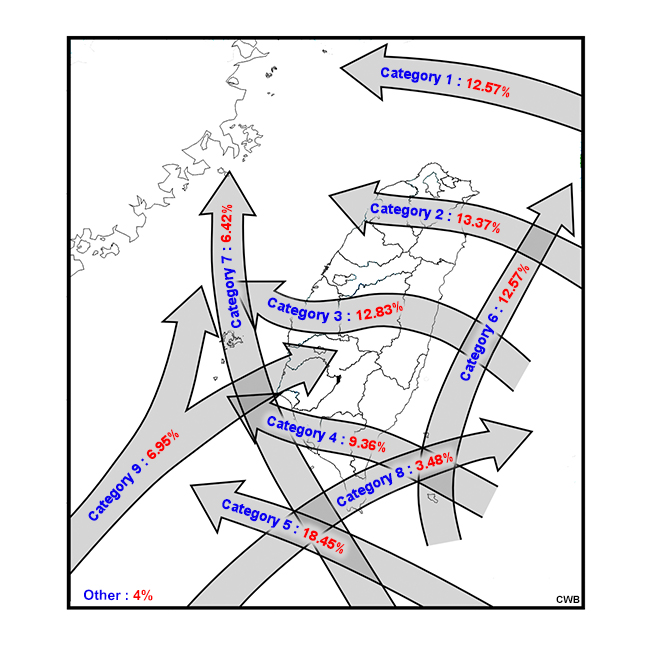
Categorical distribution of the typical paths of typhoons that impact Taiwan, and the percent of storms that fall into each category.
File Name:
intro03_track_02_eng.jpg
Credits:
CWB
Copyright Terms:
COMET Standard Terms of Use
Description:
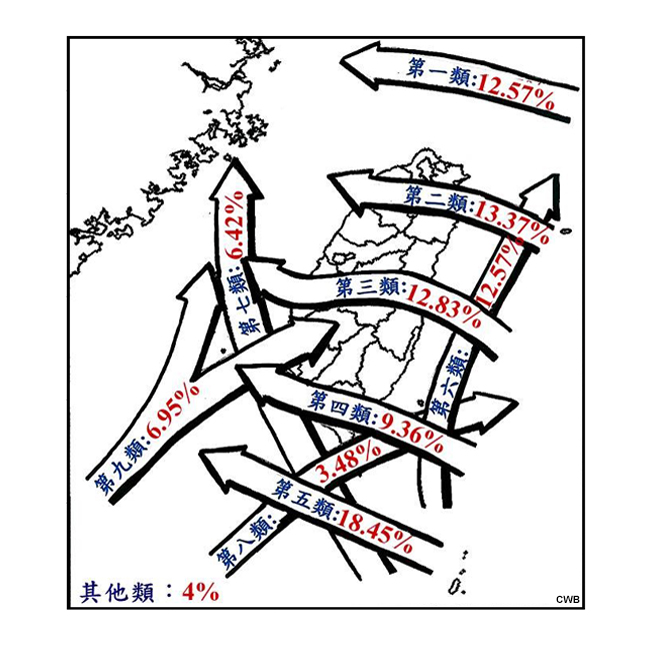
Categorical distribution of the typical paths of typhoons that impact Taiwan, and the percent of storms that fall into each category.
File Name:
intro03_track_02_tw.jpg
Credits:
CWB
Copyright Terms:
COMET Standard Terms of Use
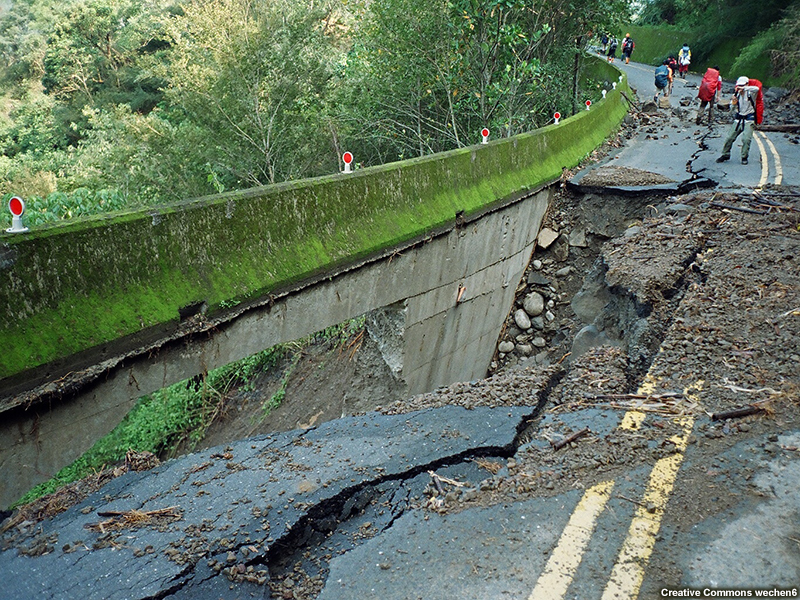
Description:
Road damage due to Typhoon Morakot (2009).
File Name:
intro04_disaster_01.jpg
Credits:
Creative Commons wechen6
Copyright Terms:
Creative Commons Attribution-Noncommercial-Share Alike 2.0 Generic
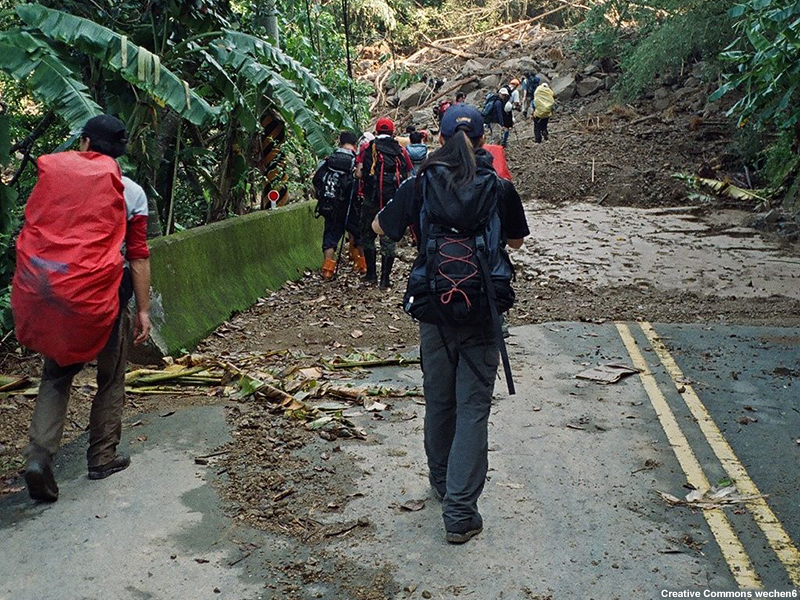
Description:
Landslides blocking roads due to Typhoon Morakot (2009).
File Name:
intro04_disaster_02.jpg
Credits:
Creative Commons wechen6
Copyright Terms:
Creative Commons Attribution-Noncommercial-Share Alike 2.0 Generic
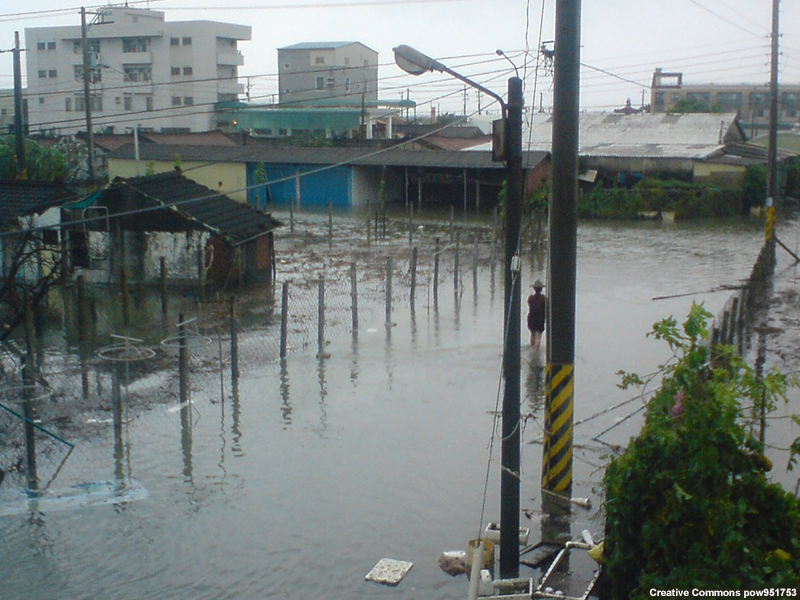
Description:
Flooding due to due to Typhoon Morakot (2009).
File Name:
intro04_disaster_03.jpg
Credits:
Creative Commons pow951753
Copyright Terms:
Creative Commons Attribution-Noncommercial-Share Alike 2.0 Generic
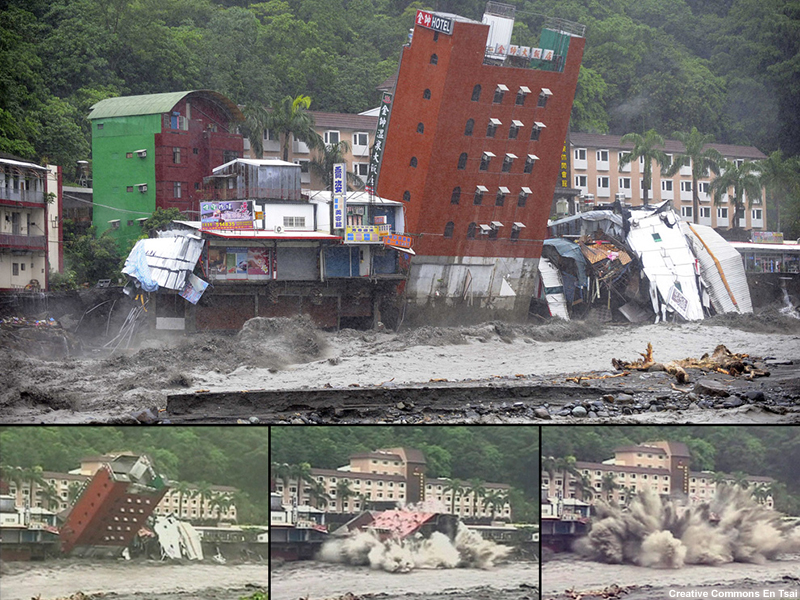
Description:
Damage to the Jinshuai Hotel due to Typhoon Morakot (2009).
File Name:
intro04_disaster_04.jpg
Credits:
Creative Commons En Tsai
Copyright Terms:
Creative Commons Attribution-Noncommercial-Share Alike 2.0 Generic
Description:
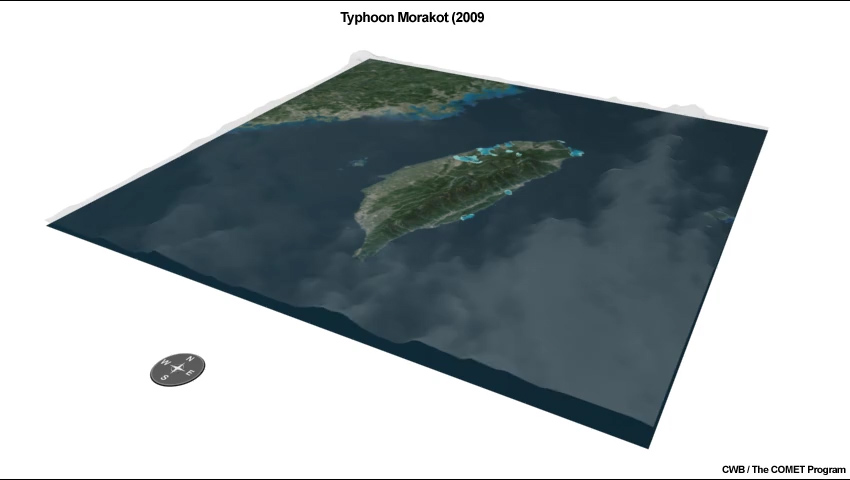
Animation of the topographic phase-locked effect with Typhoon Morakot (2009).
File Name:
morakot_topo_effect.mp4
Credits:
The COMET Program
Copyright Terms:
COMET Standard Terms of Use
Description:
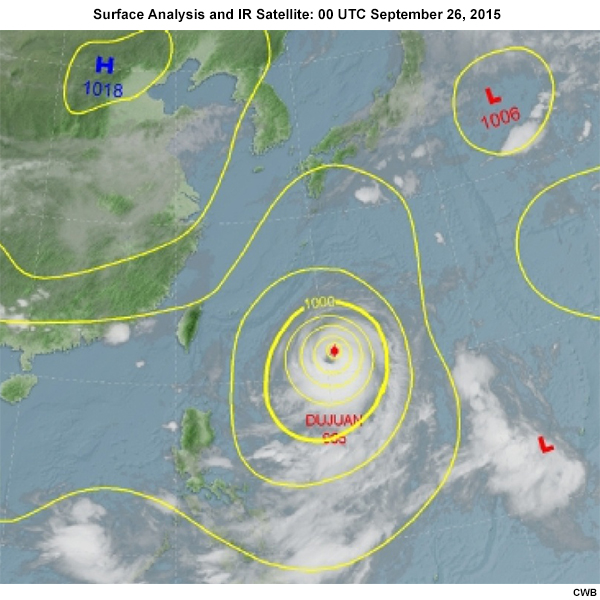
Surface weather chart overlaid with IR satellite for Typhoon Dujuan.
File Name:
quiz02_surfchart_01.htm
Credits:
CWB
Copyright Terms:
COMET Standard Terms of Use
Description:
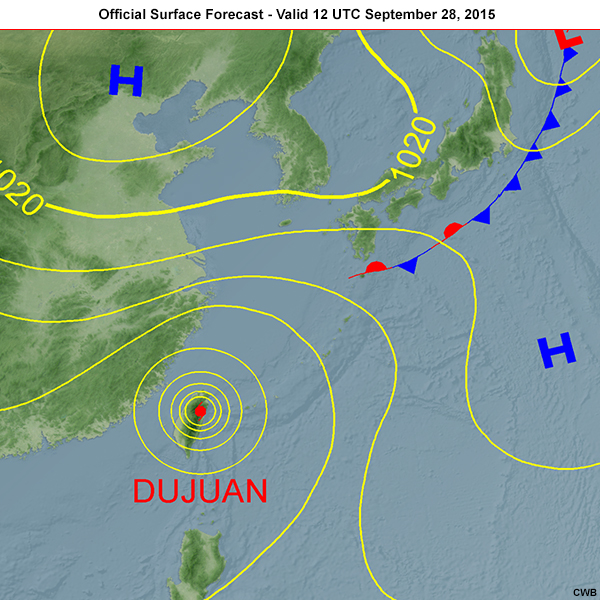
Official surface forecast charts issued at 03 UTC September 27th. The forecast hour is at 12 UTC from September 28 to September 29, 2015 in 24-hour intervals.
File Name:
quiz04_fcstchart_01.htm
Credits:
CWB
Copyright Terms:
COMET Standard Terms of Use

Description:
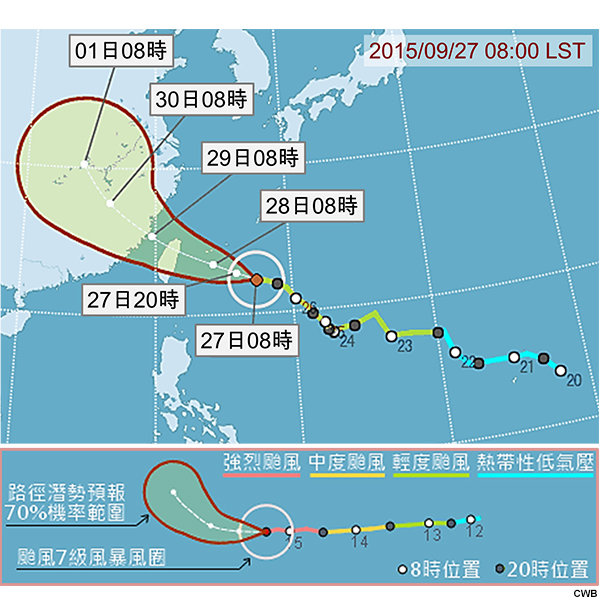
Official track forecast with potential track area for Typhoon Dujuan (2015).
File Name:
quiz04_offtrack_pta.jpg
Credits:
CWB
Copyright Terms:
COMET Standard Terms of Use
Description:
Official track forecast with potential track area for Typhoon Dujuan (2015).
File Name:
quiz04_offtrack_pta_tw.jpg
Credits:
CWB
Copyright Terms:
COMET Standard Terms of Use
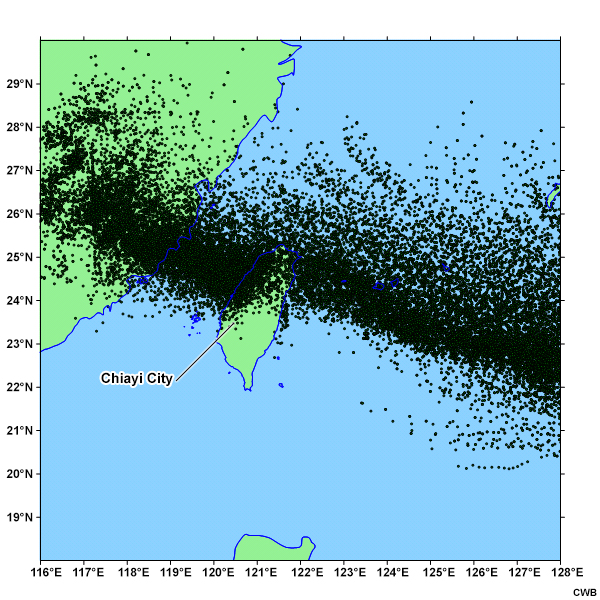
Description:
The distribution of predicted center locations (black dots) of Typhoon Dujuan (2015) from the ensemble prediction system.
File Name:
quiz05_alldots.jpg
Credits:
CWB
Copyright Terms:
COMET Standard Terms of Use
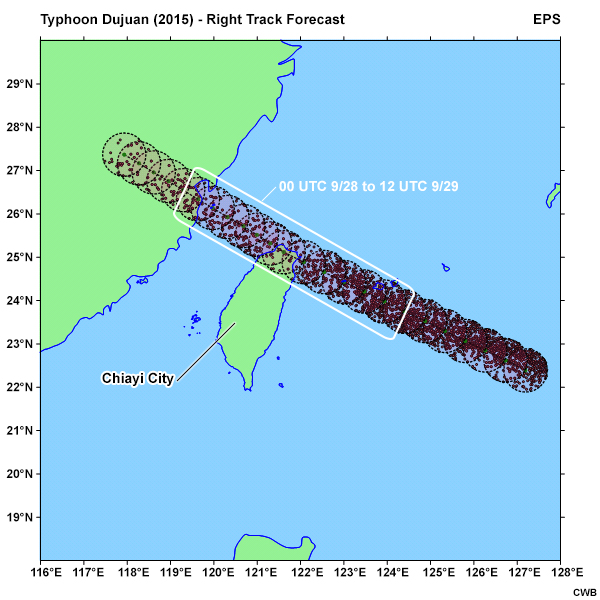
Description:
Northern track forecast of Typhoon Dujuan (2015), with predicted storm center locations (black dots) using a 50-km filtering radius and translation speed of 10 km/h.
File Name:
quiz05_northtrack.jpg
Credits:
CWB
Copyright Terms:
COMET Standard Terms of Use
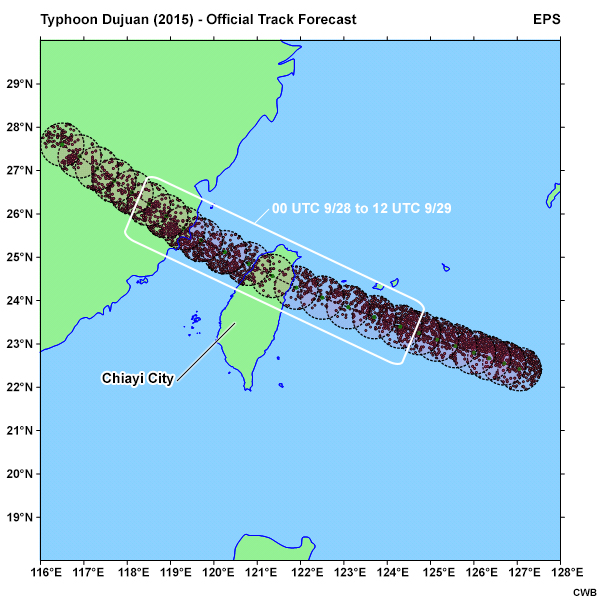
Description:
Official track forecast of Typhoon Dujuan (2015), with predicted storm center locations (black dots) using a 50-km filtering radius and translation speed of 10 km/h.
File Name:
quiz05_offtrack.jpg
Credits:
CWB
Copyright Terms:
COMET Standard Terms of Use
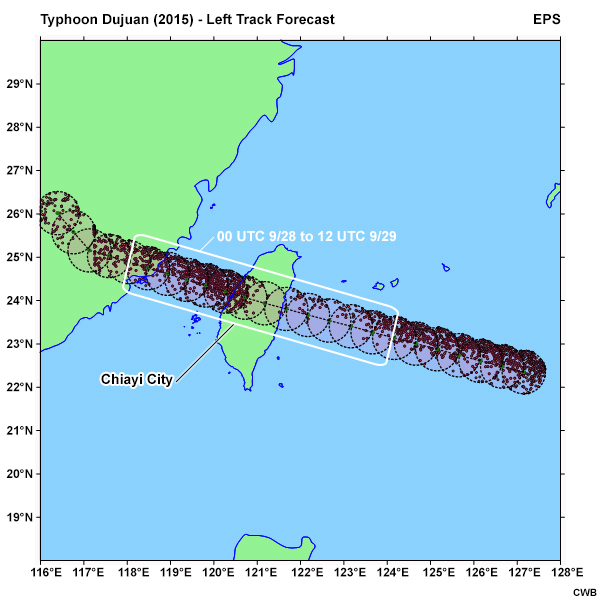
Description:
Southern track forecast of Typhoon Dujuan (2015), with predicted storm center locations (black dots) using a 50-km filtering radius and translation speed of 10 km/h.
File Name:
quiz05_southtrack.jpg
Credits:
CWB
Copyright Terms:
COMET Standard Terms of Use
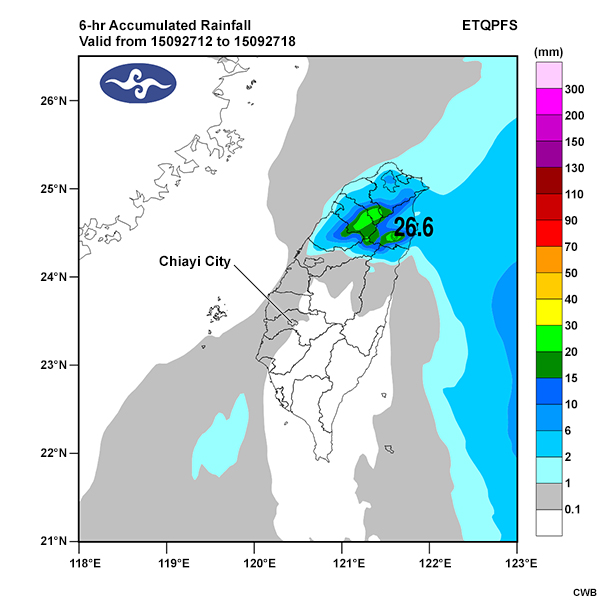
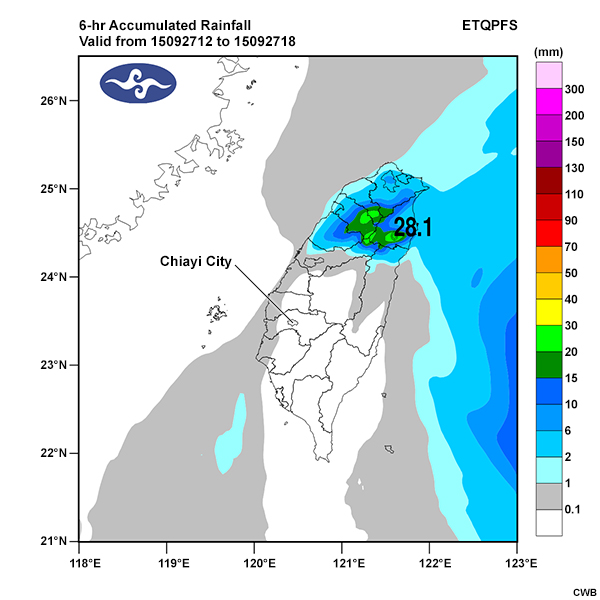
Description:
ETQPF 6-hr accumulated rainfall forecasts for the northern track of Typhoon Dujuan.
File Name:
quiz06_north_092712-092718_01.htm
Credits:
CWB
Copyright Terms:
COMET Standard Terms of Use
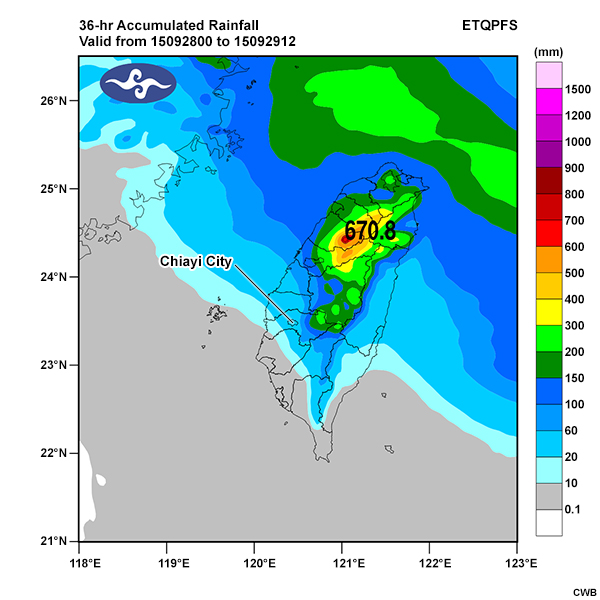
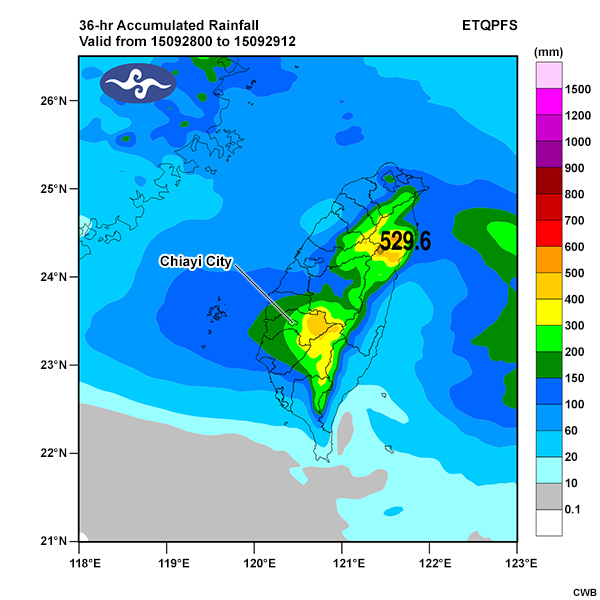
Description:
ETQPF 36-hr accumulated rainfall forecast for the northern track of Typhoon Dujuan.
File Name:
quiz06_north_092800-092912.jpg
Credits:
CWB
Copyright Terms:
COMET Standard Terms of Use
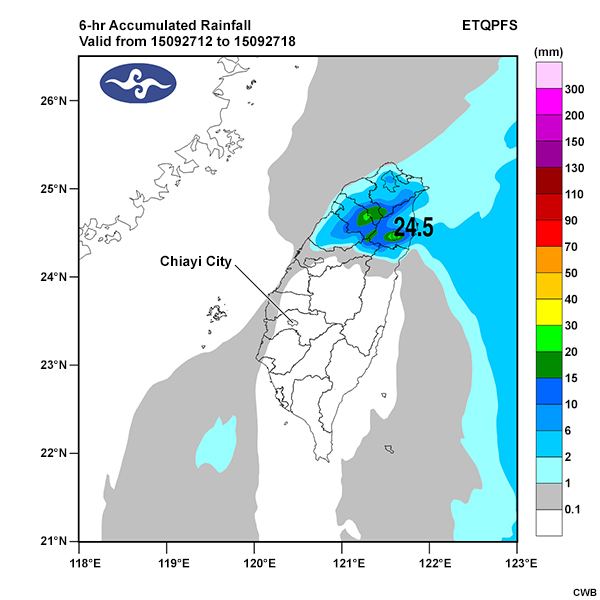
Description:
ETQPF 6-hr accumulated rainfall forecasts for the official track of Typhoon Dujuan.
File Name:
quiz06_off_092712-092718_01.htm
Credits:
CWB
Copyright Terms:
COMET Standard Terms of Use
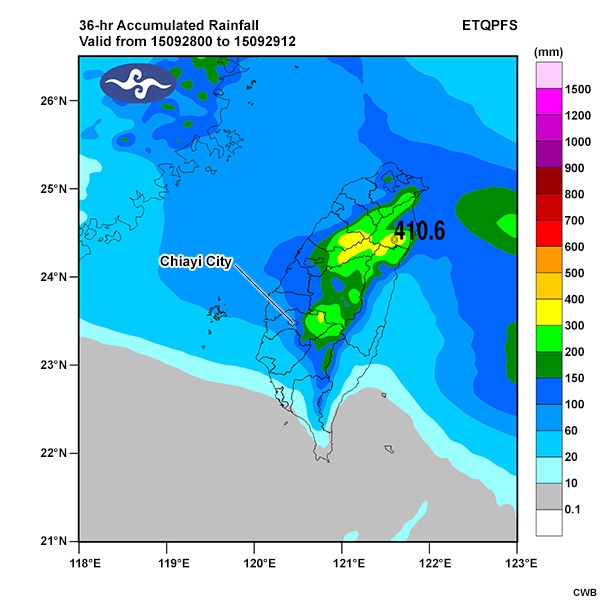
Description:
ETQPF 36-hr accumulated rainfall forecast for the official track of Typhoon Dujuan.
File Name:
quiz06_off_092800-092912.jpg
Credits:
CWB
Copyright Terms:
COMET Standard Terms of Use
Description:
ETQPF 6-hr accumulated rainfall forecasts for the southern track of Typhoon Dujuan.
File Name:
quiz06_south_092712-092718_01.htm
Credits:
CWB
Copyright Terms:
COMET Standard Terms of Use
Description:
ETQPF 36-hr accumulated rainfall forecast for the southern track of Typhoon Dujuan.
File Name:
quiz06_south_092800-092912.jpg
Credits:
CWB
Copyright Terms:
COMET Standard Terms of Use
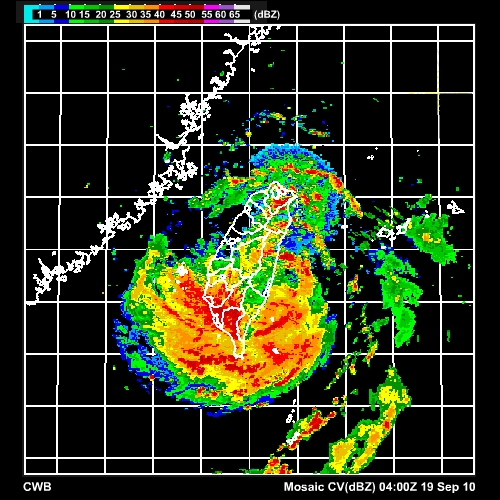
Description:
Radar imagery loop for the period 04 to 12 UTC September 19, 2010 during Typhoon Fanapi.
File Name:
sample_radar_loop_0001.htm
Credits:
CWB
Copyright Terms:
COMET Standard Terms of Use
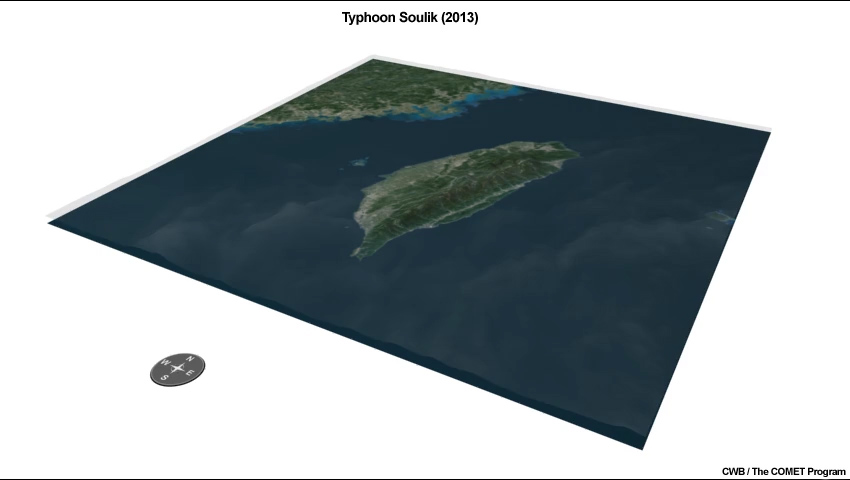
Description:
Animation of the topographic phase-locked effect with Typhoon Soulik (2013).
File Name:
soulik_topo_effect.mp4
Credits:
The COMET Program
Copyright Terms:
COMET Standard Terms of Use
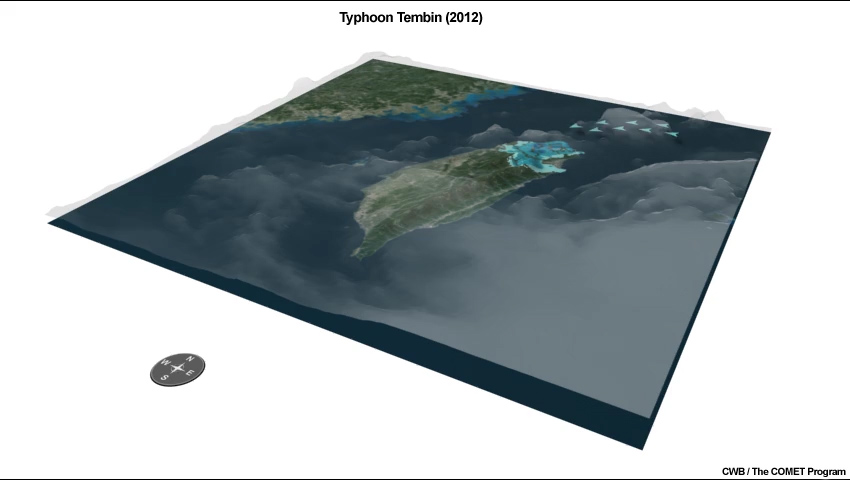
Description:
Animation of the topographic phase-locked effect with Typhoon Tembin (2012).
File Name:
tembin_topo_effect.mp4
Credits:
The COMET Program
Copyright Terms:
COMET Standard Terms of Use
Description:
Three different QPFs, each from a different ensemble member track forecast and valid for the same time period.
File Name:
three_etqpf.jpg
Credits:
CWB
Copyright Terms:
COMET Standard Terms of Use
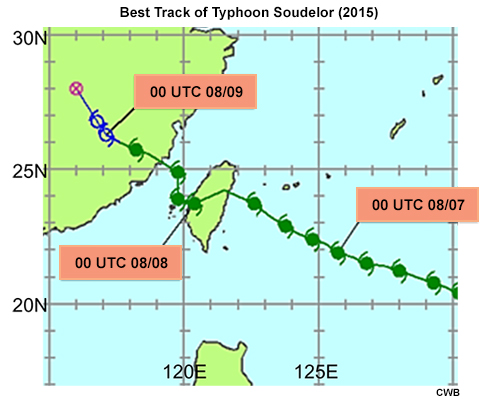
Description:
Best track of Typhoon Soudelor (2015).
File Name:
vs01_soudelor_track.jpg
Credits:
CWB
Copyright Terms:
COMET Standard Terms of Use
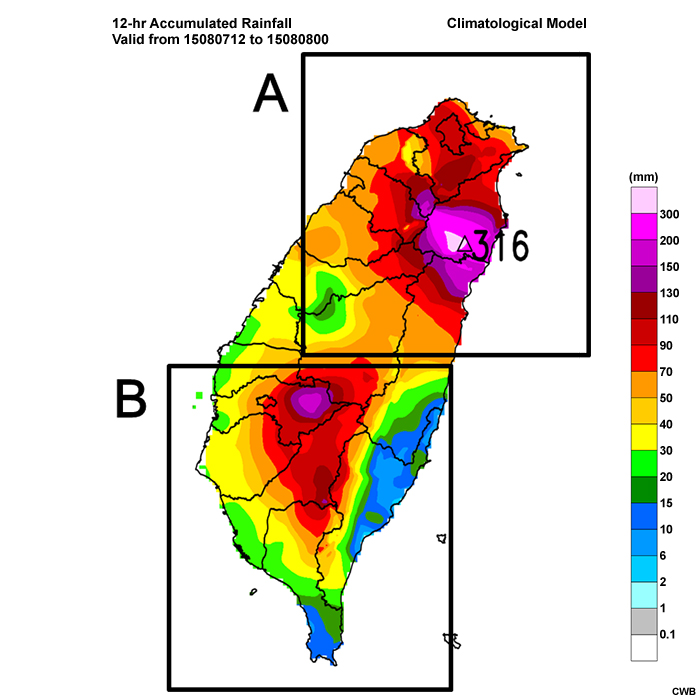
Description:
The 12-hour accumulated rainfall from the climatology model for the period 12 UTC August 7 to 00 UTC August 8, 2015 during Typhoon Soudelor.
File Name:
vs02_fan_clim.jpg
Credits:
CWB
Copyright Terms:
COMET Standard Terms of Use
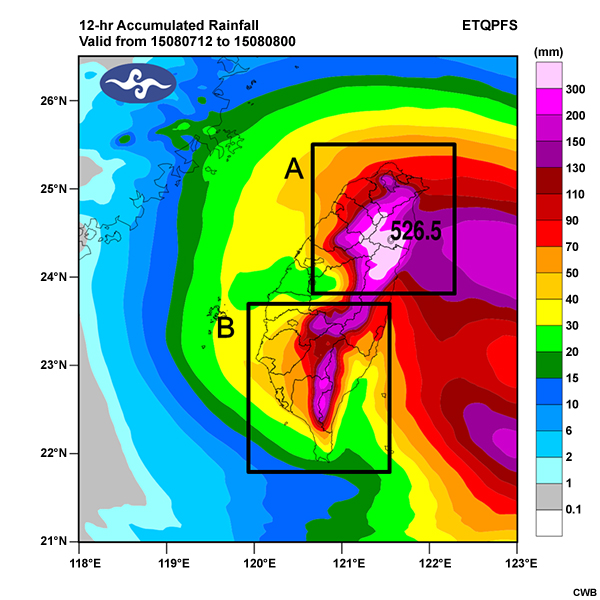
Description:
The 12-hour accumulated rainfall from the ETQPF model for the period 12 UTC August 7 to 00 UTC August 8, 2015 during Typhoon Soudelor.
File Name:
vs02_fan_etqpf.jpg
Credits:
CWB
Copyright Terms:
COMET Standard Terms of Use
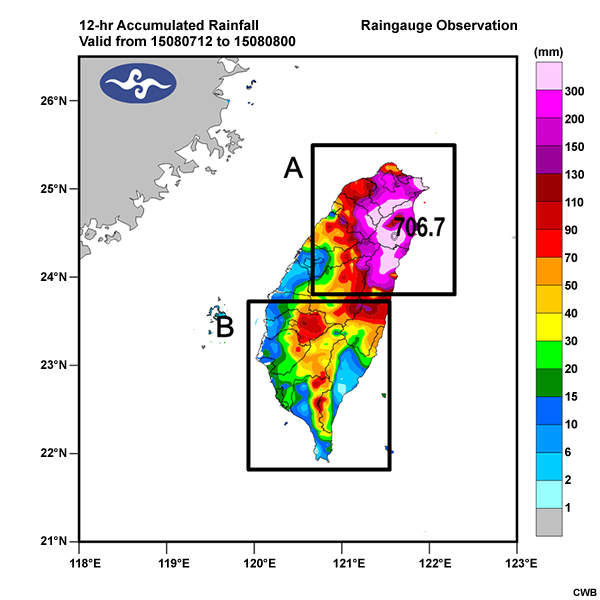
Description:
The 12-hour accumulated rainfall observations for the period 12 UTC August 7 to 00 UTC August 8, 2015 during Typhoon Soudelor.
File Name:
vs02_fan_obs.jpg
Credits:
CWB
Copyright Terms:
COMET Standard Terms of Use