Introduction
Typhoons are considered the most dangerous natural disaster in Taiwan, even when they do not make landfall. In the past one hundred years, an average of 3 to 4 typhoons approached Taiwan annually.
The image below shows that typhoons originating in the Northwest Pacific Ocean travel westbound because they are mainly steered by the Pacific subtropical high. In general, a typhoon follows a predictable path when the large-scale steering flow is prominent, and behaves more erratically otherwise.
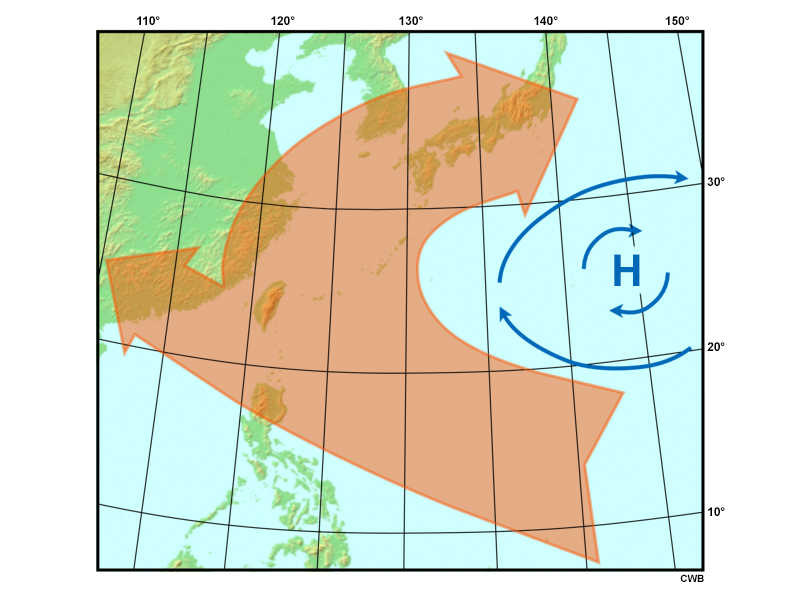
Typical paths of typhoons originating in the Northwest Pacific Ocean that are influenced by the Pacific subtropical high.
The image below categorizes the typical paths of the typhoons that have approached Taiwan. Nearly 67% of the typhoons move westward, emphasizing the influence of the subtropical high on the track of a typhoon in the western Pacific Ocean.
Categorical Paths
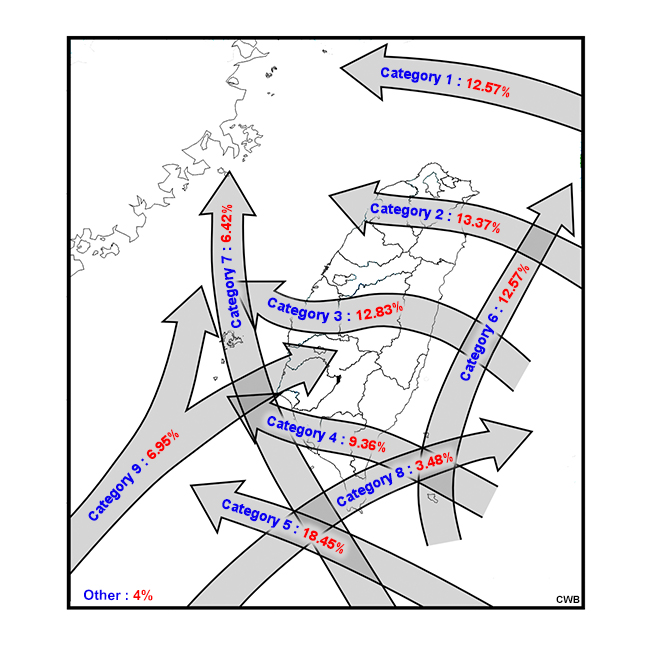
Categorical distribution of the typical paths of typhoons that impact Taiwan, and the percent of storms that fall into each category.
侵臺颱風之路徑分類
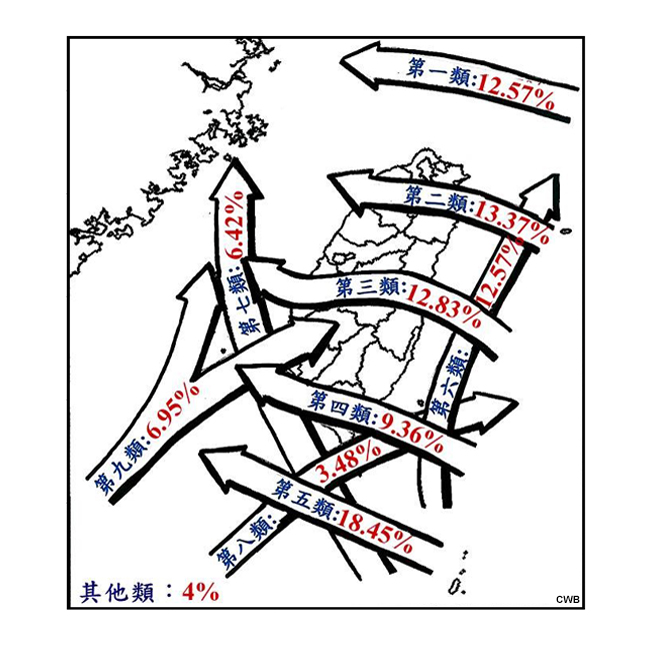
侵臺颱風之主要路徑分類及其所對應的百分比。
Taiwan is a subtropical island (400 km long and 150 km wide) with a steep, north-south orientated mountain range called the Central Mountain Range (CMR). The CMR rises above 3,000 m over a distance of 50 km.
Taiwan Population
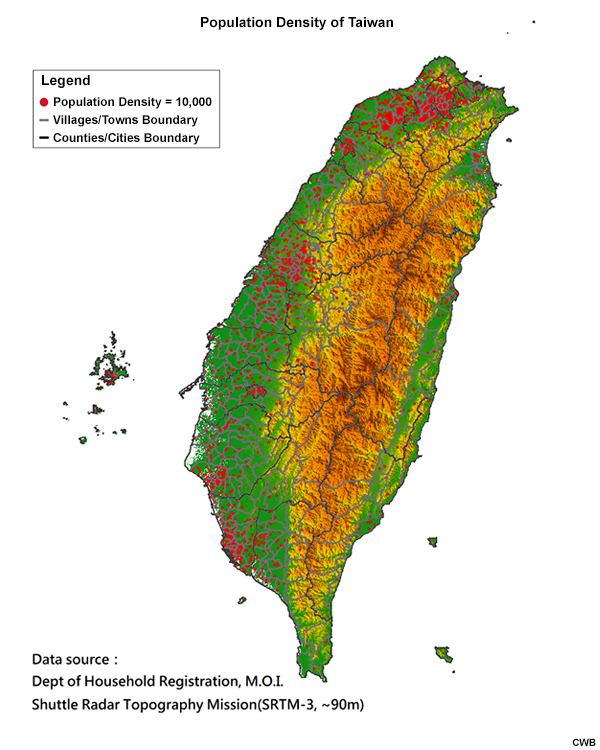
臺灣人口分佈圖
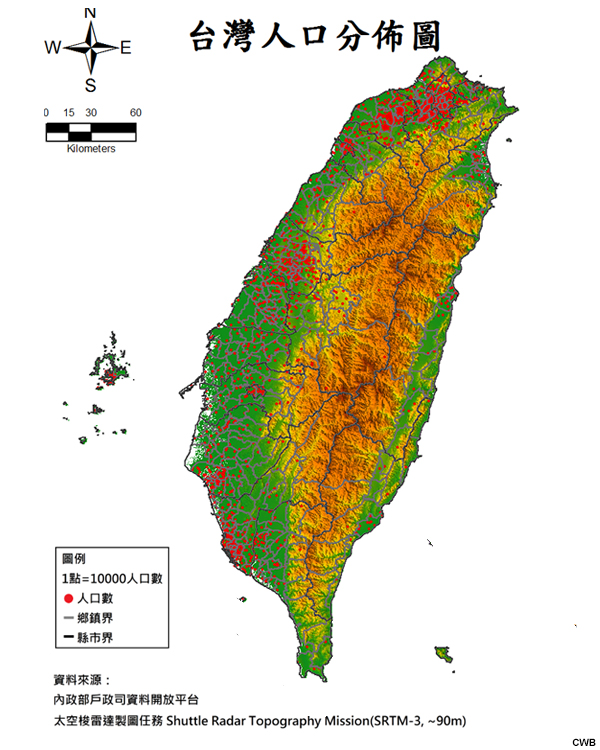
Consequently, the elevated terrain has an influence on the typhoon-related torrential rainfalls, which can cause great devastation in the form of flooding, landslides, and debris flows. For example, Typhoon Morakot (2009) brought 2,855 mm of rain over a 4-day period that led to “massive mudslides and severe flooding, resulting in 619 deaths and 76 missing persons” (Wu and Yang 2011).
Road Damage Content
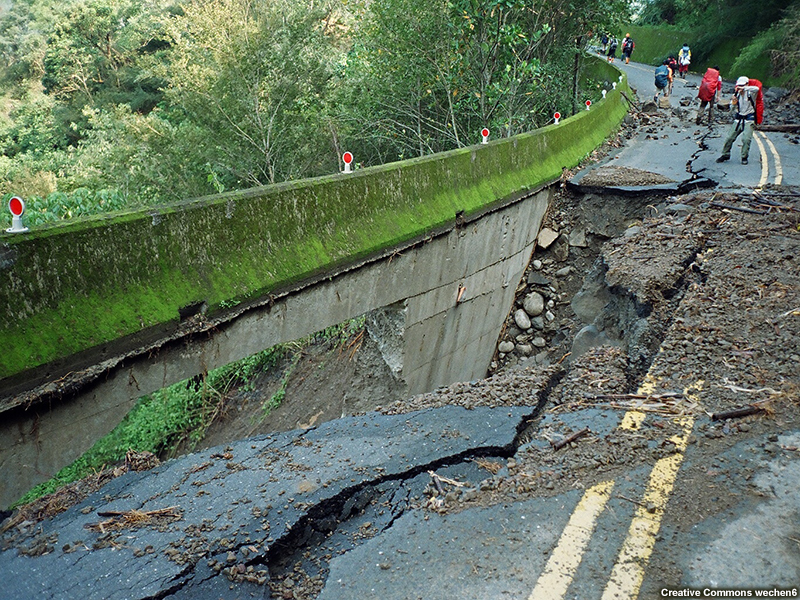
Road damage due to Typhoon Morakot (2009).
Landslides Content
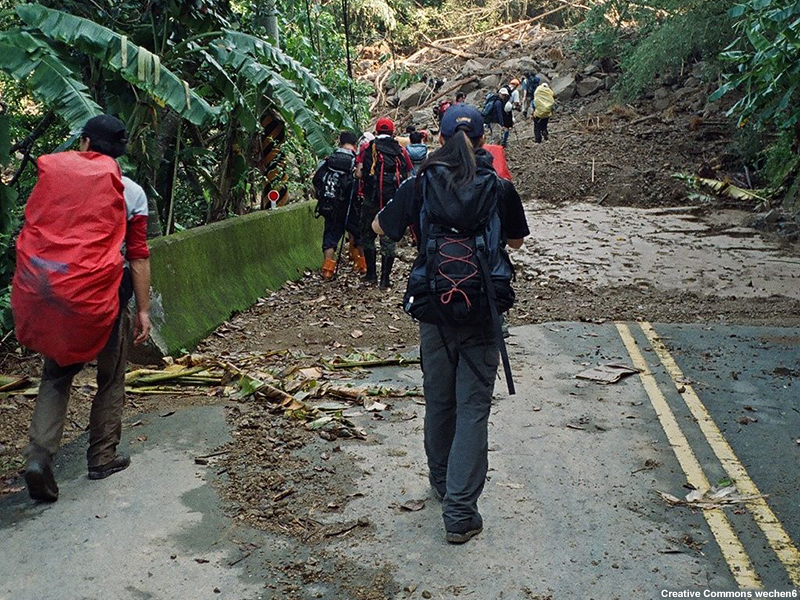
Landslides blocking roads due to Typhoon Morakot (2009).
Flooding Content
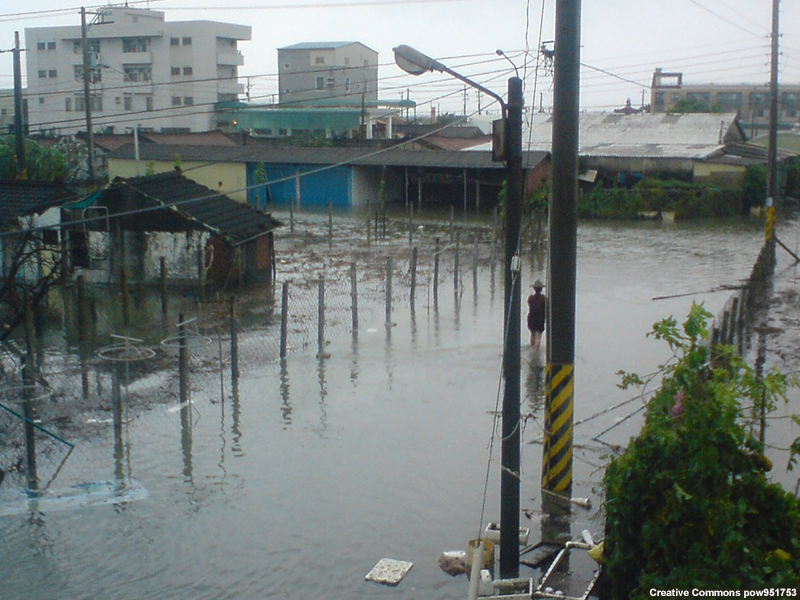
Flooding due to Typhoon Morakot (2009).
Structural Damage Content
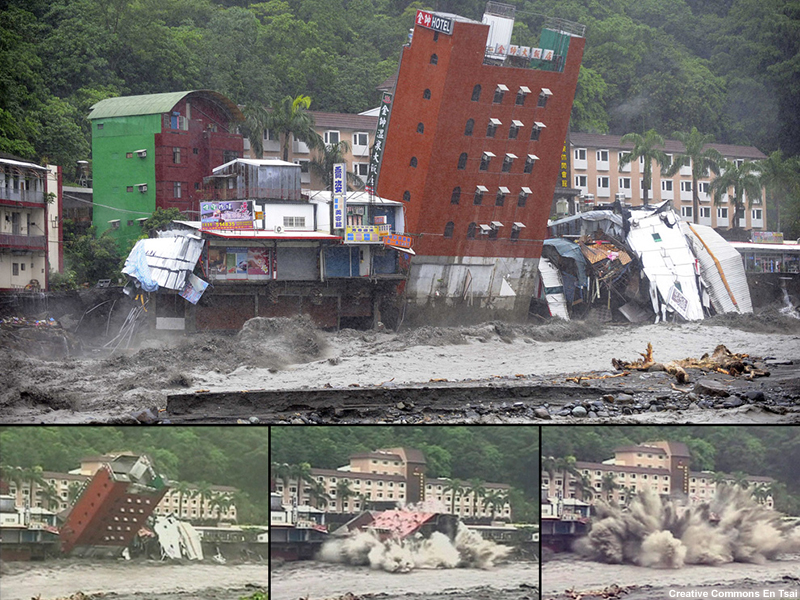
Damage to the Jinshuai Hotel due to Typhoon Morakot (2009).
The torrential rainfall threat makes it imperative for forecasters to provide the best possible quantitative precipitation forecasts (QPFs). These QPFs may help emergency operation centers (EOCs) in their preparation, mitigation, and recovery efforts for typhoon-related events in Taiwan. However, the interaction between the CMR and a typhoon’s circulation, structure, and intensity presents a major challenge to producing accurate precipitation forecasts.
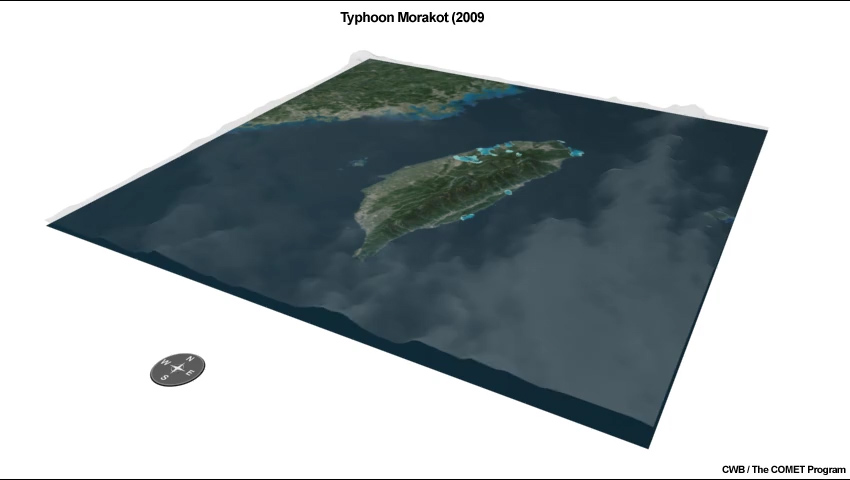
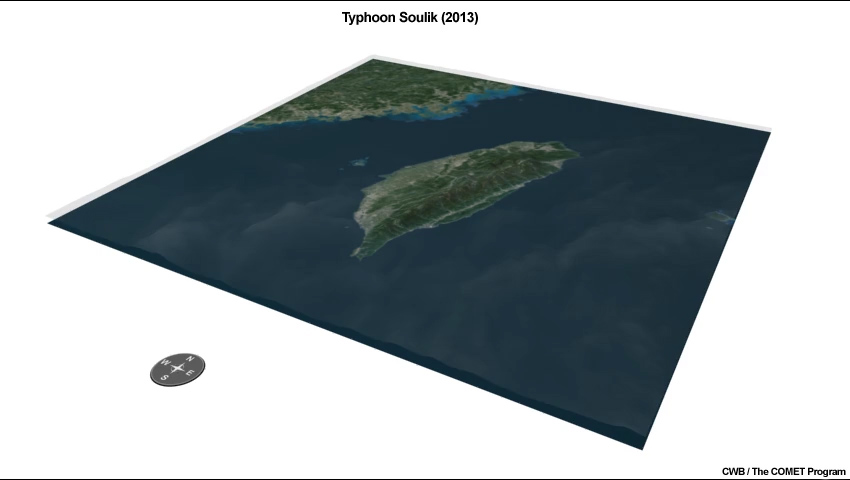
A typhoon's rainfall pattern is usually phase-locked with the elevated terrain of Taiwan's CMR, an interaction known as the "topographic phase-locked effect". Certain parts of the island can experience great amounts of precipitation, depending on the typhoon's specific position relative to the CMR and how its moisture interacts with the topography when it is in that position.
The animations in the tabs below show how the interaction between the CMR and the typhoon’s circulation, structure, and intensity influence precipitation distributions across the island.
Morakot (2009) Content
Soulik (2013) Content
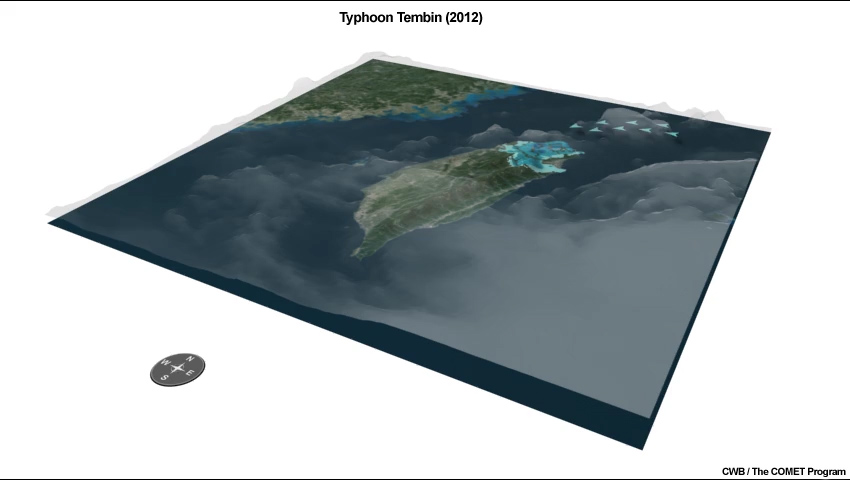
Tembin (2012) Content
Consequently, several QPF techniques have been developed based on these interactions. These include historical case guidance, such as the analogue method and the typhoon rainfall climatology model (hereafter climatology model), and ensemble forecasting from numerical weather prediction (NWP) models.
After completing this lesson, you will be able to:
● Describe the forecast process and the QPF guidance used to make typhoon QPFs in Taiwan.
- Explain why the confidence level of each QPF guidance changes along with the forecast hour.
● Explain how the climatology model generates typhoon QPFs and describe its advantages and disadvantages.
● Explain how the Ensemble Typhoon QPF (ETQPF) model creates precipitation forecasts and describe its advantages and disadvantages.
● Explain the advantages of using forecast uncertainty information to estimate and convey the typhoon threat instead of a deterministic-only approach.
- Use the ETQPF model to estimate the risk of heavy precipitation for locations in Taiwan based on the uncertainty of a typhoon’s track.
Typhoon QPF Guidance
The Central Weather Bureau (CWB) generates an official typhoon track forecast prior to forecasting typhoon rainfall over Taiwan. The official track is based on the consensus track derived from several NWP models, such as the ECMWF and GFS. As the track uncertainty grows with longer-term forecasts, the forecasters’ confidence in the track forecast will decrease.
Once the official track forecast and details of the typhoon’s structure and intensity have been determined, forecasters generate typhoon QPFs. Historical case guidance, such as the analogue method and the climatology model, and ensemble forecasting are used to produce the typhoon QPFs. The ensemble forecast guidance includes a non-selected ensemble mean (i.e. to average all QPFs in the same forecast period) and a selected ensemble mean (i.e. to average using particular QPFs, such as in the ETQPF model). Each guidance has its advantages and limitations.
Let us learn more about these QPF guidance tools.
Typhoon QPF Guidance » Analogue Method
Due to the topographic phase-locked effect, typhoons approaching Taiwan along similar tracks usually have similar rainfall patterns. Once the official track is determined, forecasters survey historical typhoons with similar tracks and compare their intensities and structures to the current storm to generate reasonable typhoon QPFs. This analogue method has provided and continues to provide important QPF guidance to forecasters. Even though substantial progress of NWP in recent years has created new QPF guidance, the analogue method is still an important tool in forecasting typhoon precipitation.
A major advantage of the analogue method is that forecasters can recall their past experiences with typhoon events, and reference historical rainfall observations to the current track forecast. The public can also be reminded to take precautions based on their experiences with a past typhoon event.
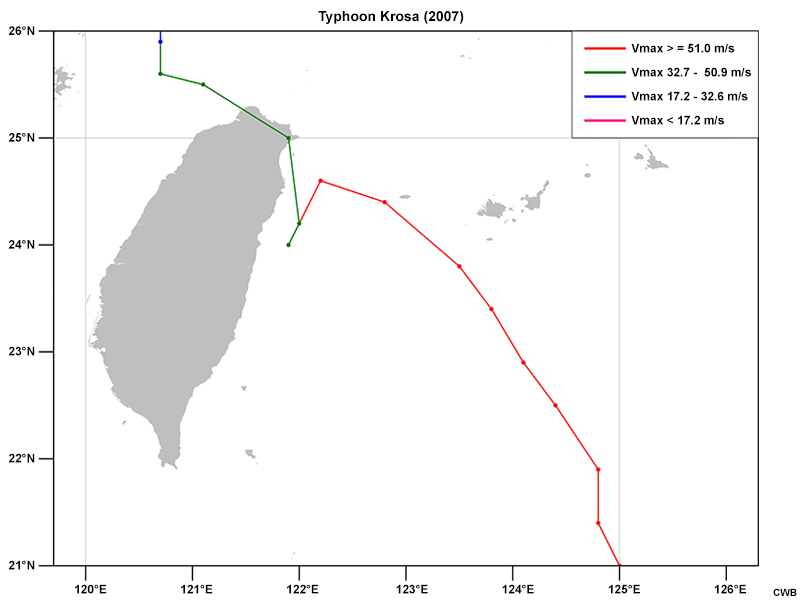
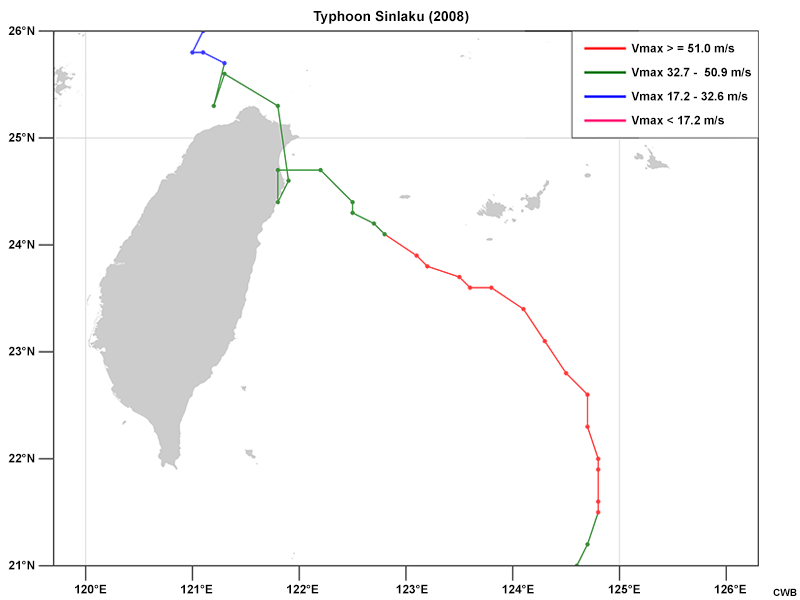
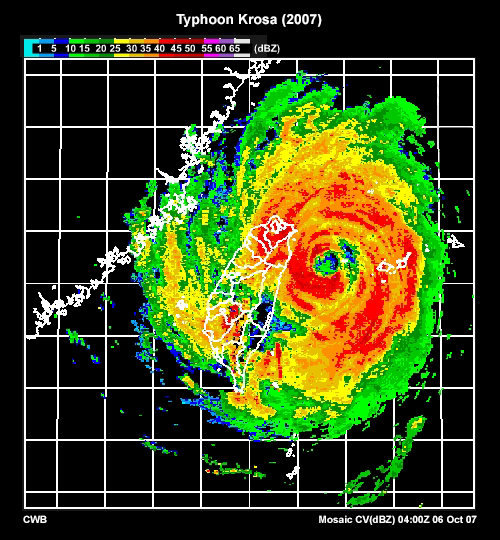
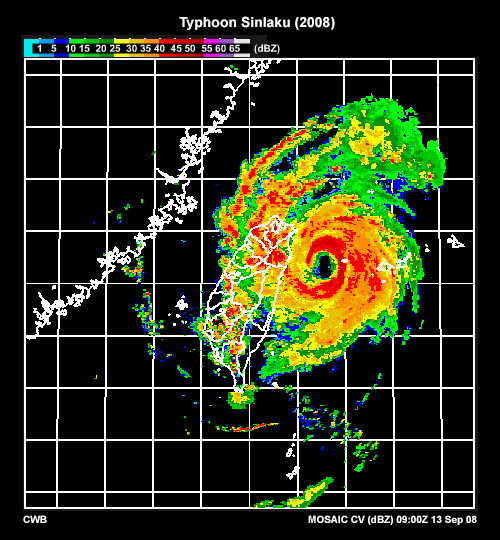
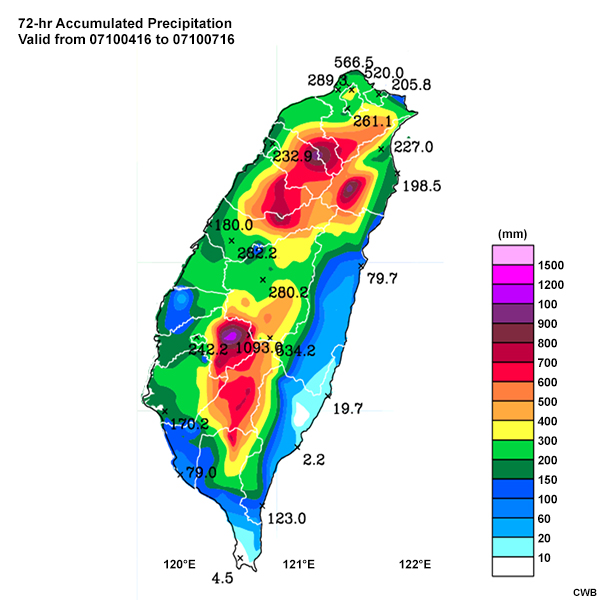
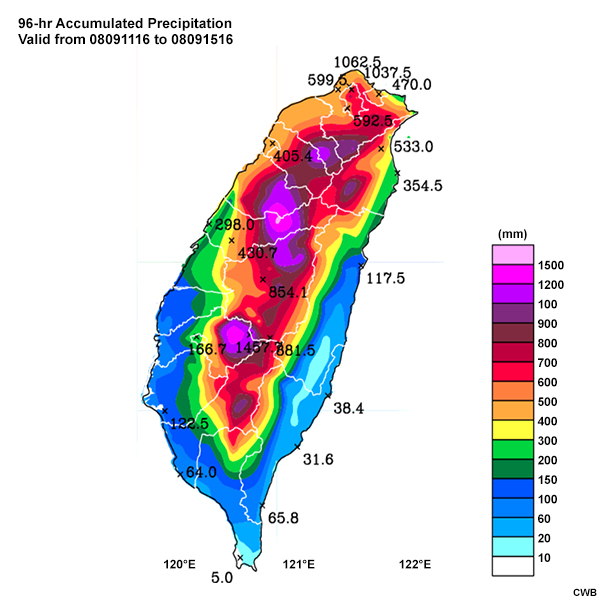
The tabs below contain observation data for two typhoon events. Each tab offers access to images showing the best track (observed track), radar, and precipitation observations. Review the two typhoon cases to answer the question that follows.
Track
Composite Reflectivity
Precipitation
Question
Select True or False for the statement below.
If two typhoons follow a similar track, the precipitation that falls from each will vary due to their differing translation speeds, structures, and surrounding environments.
The correct answer is a.
A disadvantage of the analogue method is that no two typhoons are identical. Differences in storm translation speeds, structures, and environments result in different precipitation distributions and amounts between the two storms. If an individual survived one typhoon, there is no guarantee that they will survive another one of similar strength or path!
Typhoon QPF Guidance » Climatology Model vs ETQPF Model
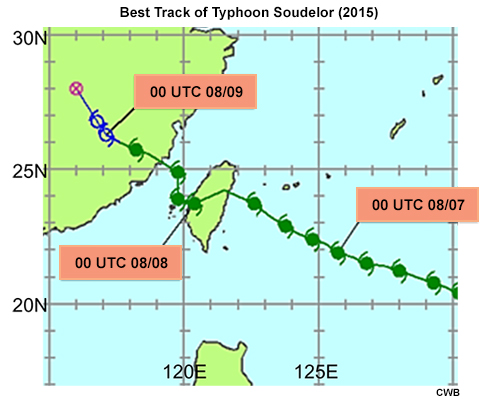
The two typhoon QPF guidance tools that CWB forecasters have more confidence in are the climatology model and ETQPF model. Let us compare the performance between the climatology and ETQPF model during Typhoon Soudelor (2015) as it approached Taiwan.
In 2015, Typhoon Soudelor made landfall over Taiwan before dawn on August 8th, with maximum winds of 173 km/h (48 m/s), and then moved into the Taiwan Strait in the morning.
Let us look at the 12-hour precipitation forecasts and observations based on the best track of Typhoon Soudelor, valid from 12 UTC August 7 to 00 UTC August 8, 2015.
Climatology Model Content
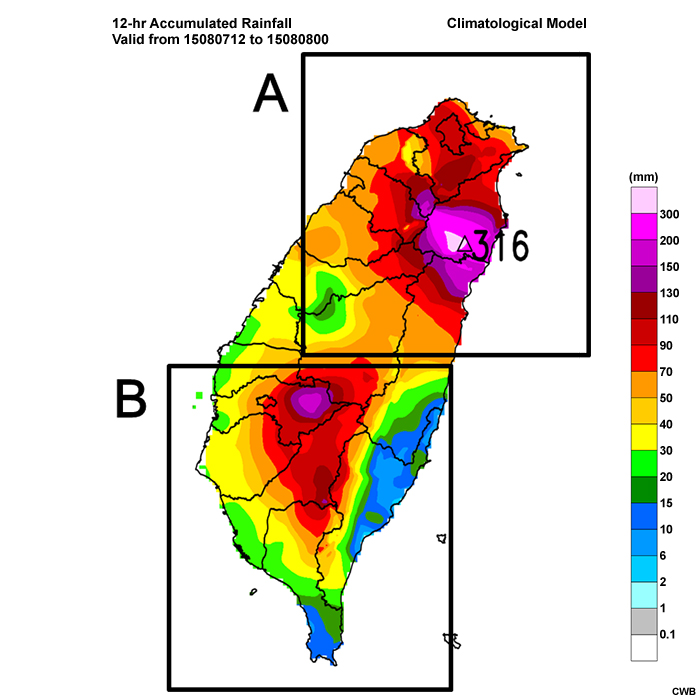
The 12-hour accumulated rainfall from the climatology model for the period 12 UTC August 7 to 00 UTC August 8, 2015 during Typhoon Soudelor.
ETQPF Model Content
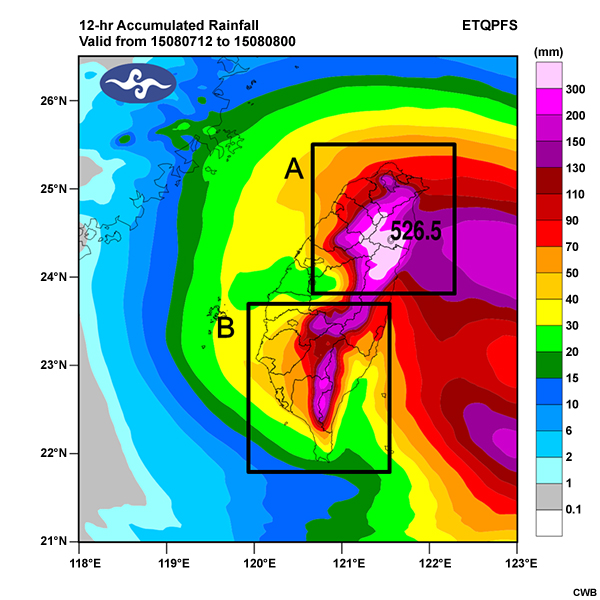
The 12-hour accumulated rainfall from the ETQPF model for the period 12 UTC August 7 to 00 UTC August 8, 2015 during Typhoon Soudelor.
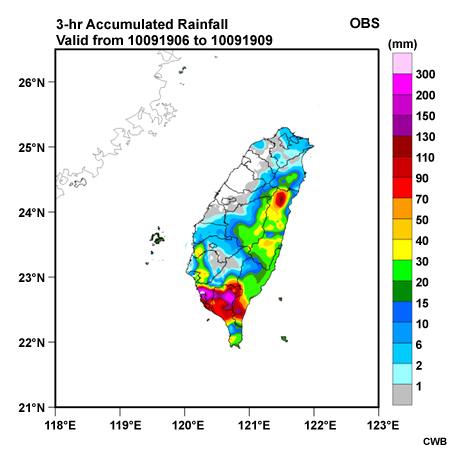
Observations Content
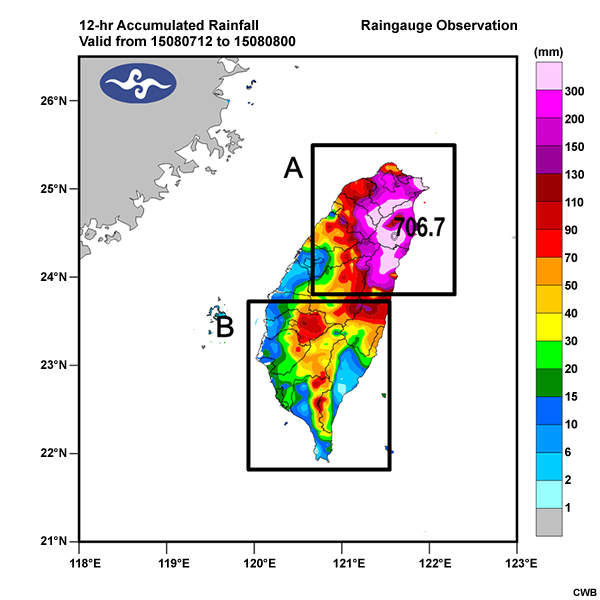
The 12-hour accumulated rainfall observations for the period 12 UTC August 7 to 00 UTC August 8, 2015 during Typhoon Soudelor.
Question
Compare the precipitation forecasts from the climatology model and ETQPF model to the observations. How well did the two forecasts predict the rainfall distribution and amount of maximum precipitation for domain A and B?
Select Very well, Well, or Poorly for each model.
Precipitation Distribution
Domain A
Precipitation Distribution - The rain gauge observations showed that much of the precipitation fell across northeastern and south-central Taiwan. In both domains, the climatology model predicted the rainfall distribution well, and the ETQPF model predicted the rainfall distribution across these parts of the island very well.
Maximum Precipitation - For northeastern Taiwan (domain A), the climatology model underestimated the maximum amount. It predicted 316 mm of rainfall, while 706.7 mm was observed. The ETQPF model also underpredicted the maximum amount, but was closer with a forecast of 526.5 mm. In southern Taiwan (domain B), the climatology model predicted maximum precipitation ranges of 150 to 200 mm, while the ETQPF model predicted 200 to 300 mm, when ranges between 110 and 130 mm were observed.
The comparison above is based on the best track. While both models appear to have predicted the overall precipitation distribution well, the ETQPF model predicted the location and amount of maximum precipitation better than the climatology model. This indicates that if the official track forecast is close to the best track, the ETQPF model would perform better than the climatology model.
Let us learn more about these two models.
Typhoon QPF Guidance » Climatology Model
Accurately predicting typhoon-related precipitation in Taiwan is challenging, primarily because of the elevated CMR. The rainfall is highly correlated with the typhoon’s position relative to the mountain range. This close relationship implies that the terrain’s lifting of the typhoon circulation plays a major role in determining the distribution and amount of typhoon rainfall, resulting in a phase-locked effect between the rainfall pattern and the terrain across Taiwan. A statistical approach based on the topographic phase-locked effect provides an important reference for operational typhoon rainfall forecasts at the CWB in Taiwan. For a given typhoon position forecast, the typhoon QPF can be obtained from the climatology of historical typhoon positions and associated rainfall observations. This concept is the basis of the climatology model for typhoon QPF.
The climatology model uses hourly rainfall data collected at 371 stations from 85 typhoons between 1989 and 2007. To construct a climatological rainfall map, all hourly rainfall data (including no rain) at each station is averaged within a 0.1° latitude x 0.1° longitude grid box that past typhoon centers have been in (for more details, see Lee et al. 2006).
An example of a climatological rainfall map is shown below. The average value at each grid box represents the climatological rainfall of each station when the typhoon center is located in the 1° x 1° grid box. The smaller, colorful islands describe the 3-hr statistical precipitation distribution that could occur if the typhoon was in that grid space relative to Taiwan (background island outline). In general, for a given typhoon position forecast, the climatology model can provide reasonable estimates of both the distribution and amount of precipitation.
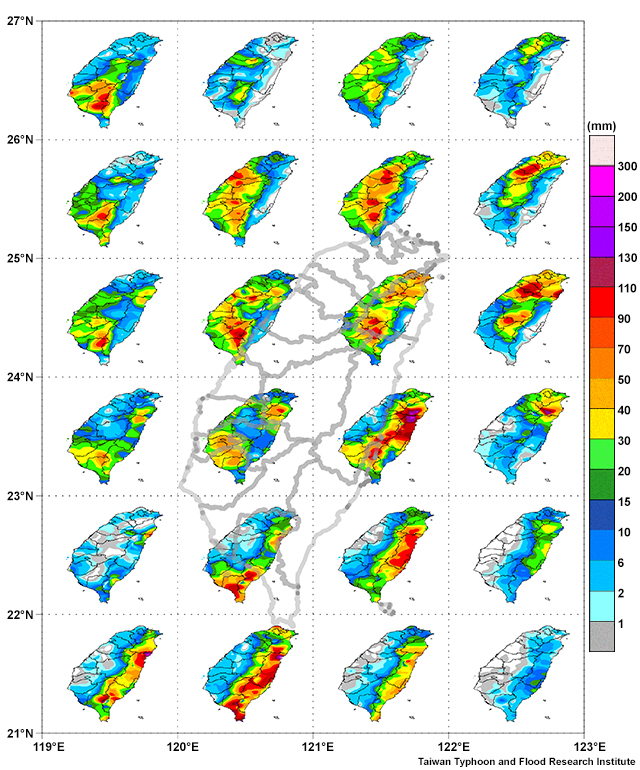
The climatological rainfall map, a statistical precipitation distribution across Taiwan relative to different typhoon positions based on a 1° x 1° grid difference. The smaller, colorful islands describe the 3-hour precipitation distribution that could occur if the typhoon was in that grid space relative to Taiwan (background island outline).
The image below helps illustrate how the climatology model generates a typhoon QPF. Let us return to the case of Typhoon Soudelor (2015). The best track of Typhoon Soudelor is shown in black on the climatological rainfall map for the period between 18 UTC August 7 to 00 UTC August 8.
The climatology model generates the QPF for this period by adding up the statistical precipitation distribution from each grid box that the typhoon center hits. In this case, the center of Typhoon Soudelor hits grid box #16, #11, and #14.
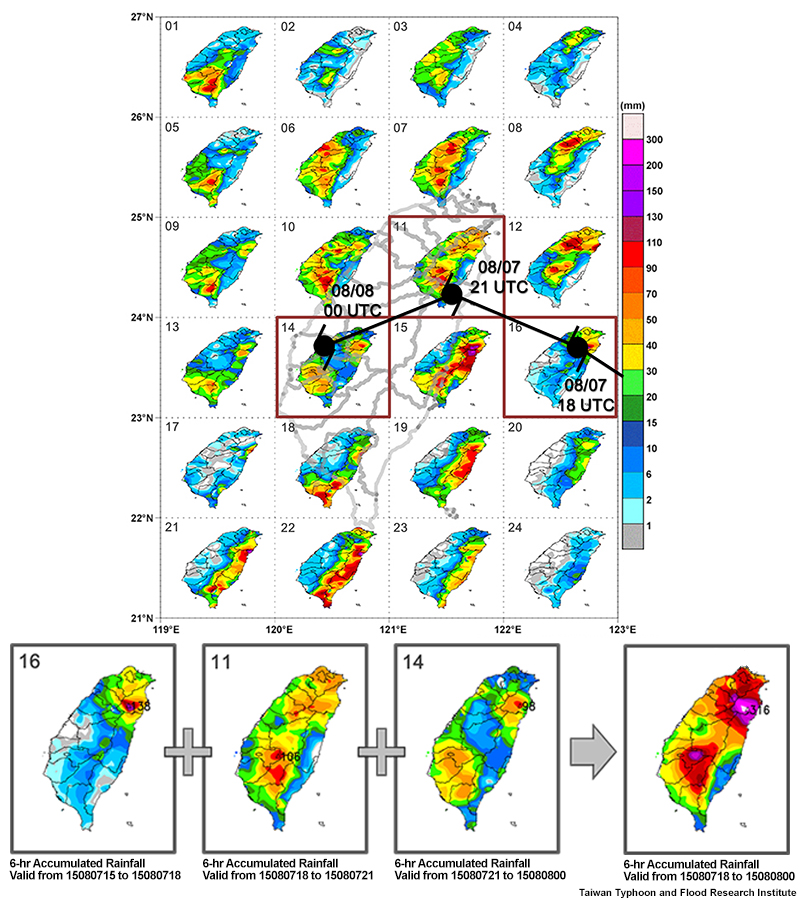
The top image is the climatological rainfall map with the best track of Typhoon Soudelor (2015). The bottom image shows the three specific grid boxes from the climatological rainfall map that will be used to generate the 6-hr quantitative precipitation forecast for Typhoon Soudelor valid on 00 UTC August 8, 2015.
The climatology model is successful most of the time because of the close relationship between a typhoon’s position relative to the CMR and the typhoon rainfall pattern. However, the topographic phase-locked effect is not the only factor used to determine a typhoon’s rainfall over Taiwan. This is problematic for the climatology model because it cannot account for case-specific precipitation variability. This was the case for Typhoon Megi (2010) when it was in the South China Sea. The climatology model could not capture the distant rainfall over northeastern Taiwan that resulted from the interaction between northerly monsoonal flow and the typhoon’s outer circulation (see image and tabs below).
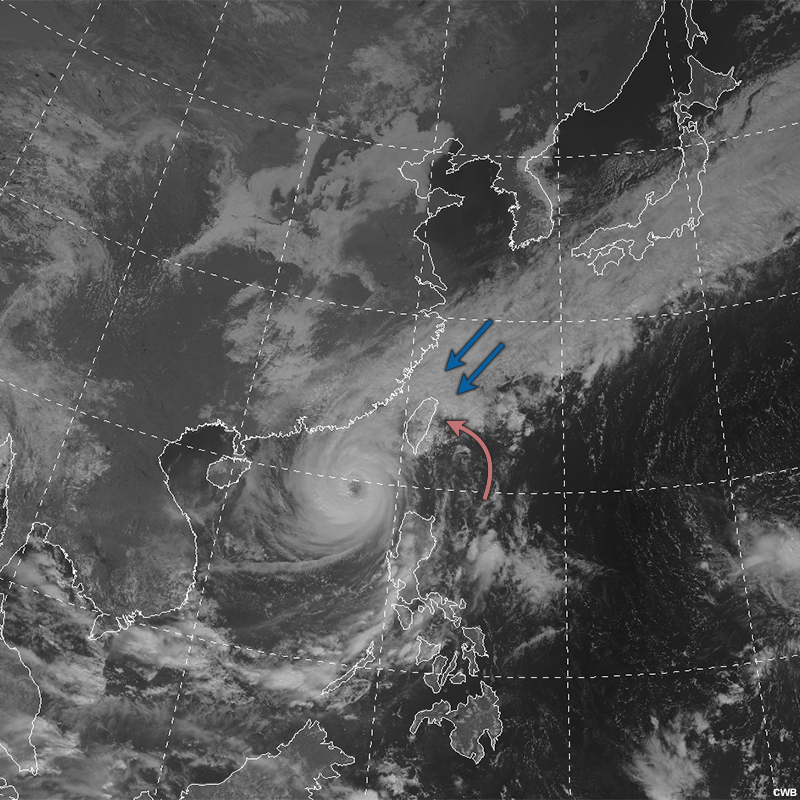
Visible satellite image of Typhoon Megi at 0330 UTC on October 21, 2010. The arrows show that the cool, northeasterly monsoon flow (blue arrows) and the warm, moist southerly flow from the typhoon (red arrow) converged over northeastern Taiwan.
Climatology Model Content
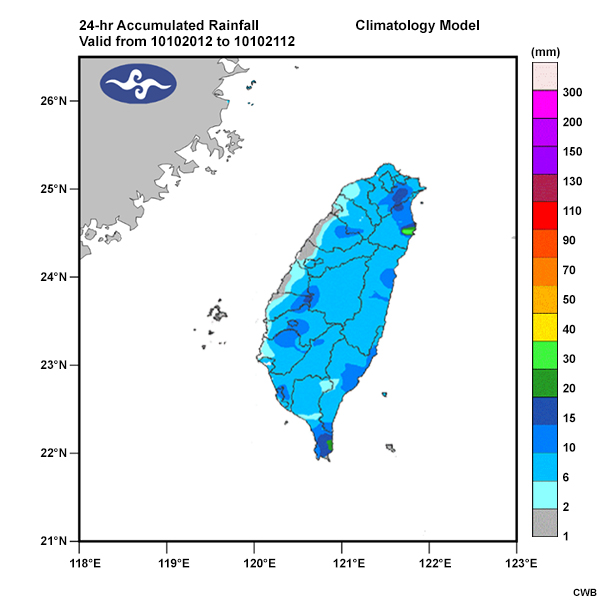
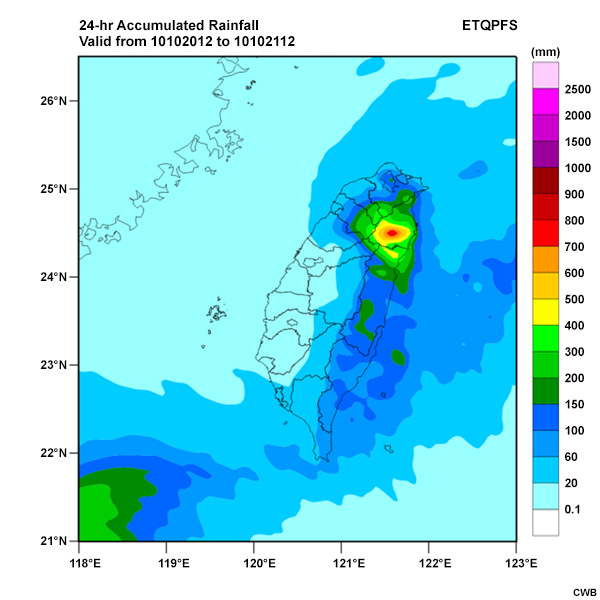
The 24-hour accumulated rainfall from the climatology model based on the best track of Typhoon Megi for the period 12 UTC October 20 to 12 UTC October 21, 2010. Note that the rainfall scale maximum is 300 mm.
Observations Content
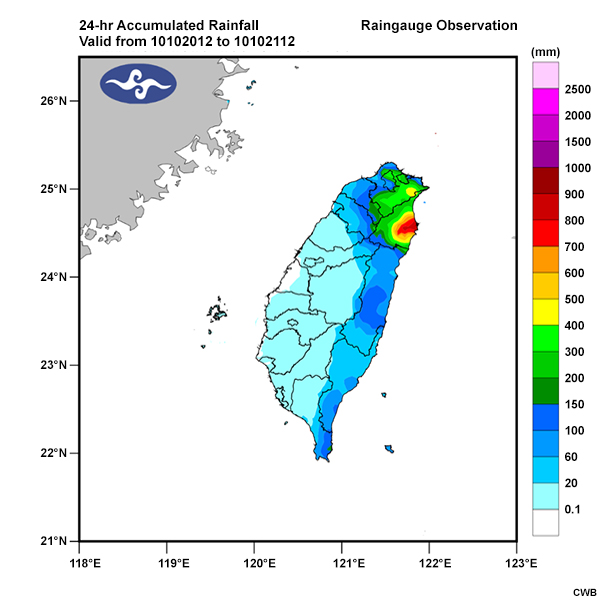
The 24-hour accumulated rainfall observations based on the best track of Typhoon Megi for the period 12 UTC October 20 to 12 UTC October 21, 2010.
The same is true during the summer, when it is possible for typhoons to interact with the southwest monsoon and bring heavy precipitation to southern Taiwan.
Another limitation of the climatology model is that limited historical cases restrict its applicability. For example, some grids may have minimal precipitation records because only a few typhoons have passed through those grids.
Typhoon QPF Guidance » NWP and the Ensemble Technique
Numerical weather prediction (NWP) models can overcome the disadvantages of using historical data by capturing the dynamical processes of specific weather situations. As model resolution increases, NWP models can provide QPF guidance that is more useful. Yet, it is difficult to create a model that will perform well in all situations and forecast lead times. Therefore, research organizations around the world have developed ensembles to help assess many possible forecast outcomes.
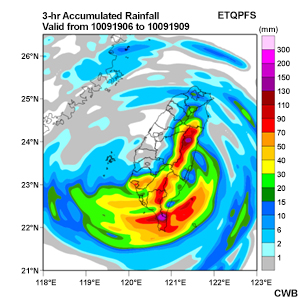
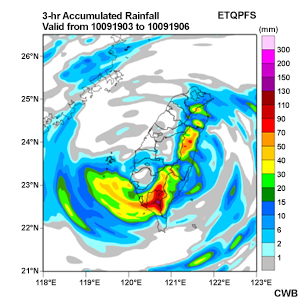
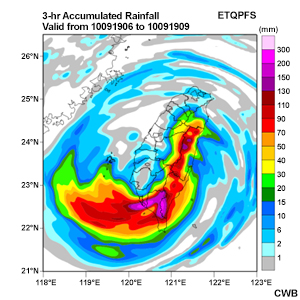
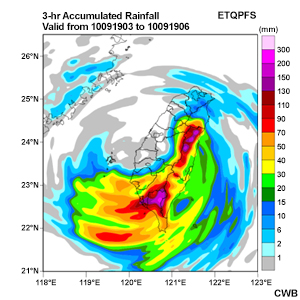
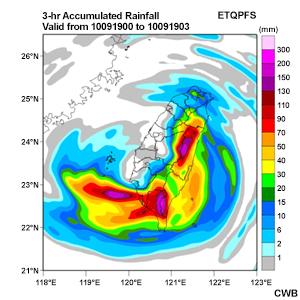
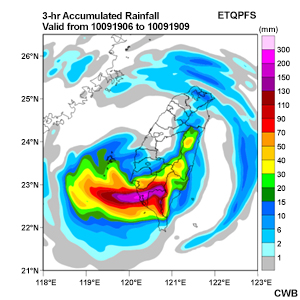
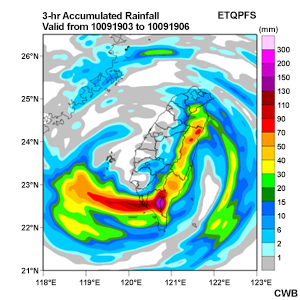
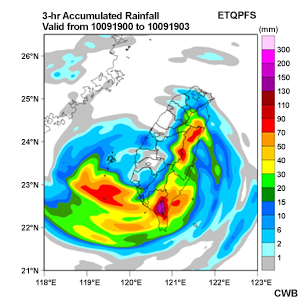
One way to use ensemble typhoon QPF guidance is to use the non-selected ensemble mean (i.e. to average all QPFs in the same forecast period). Review the image and answer the question below.
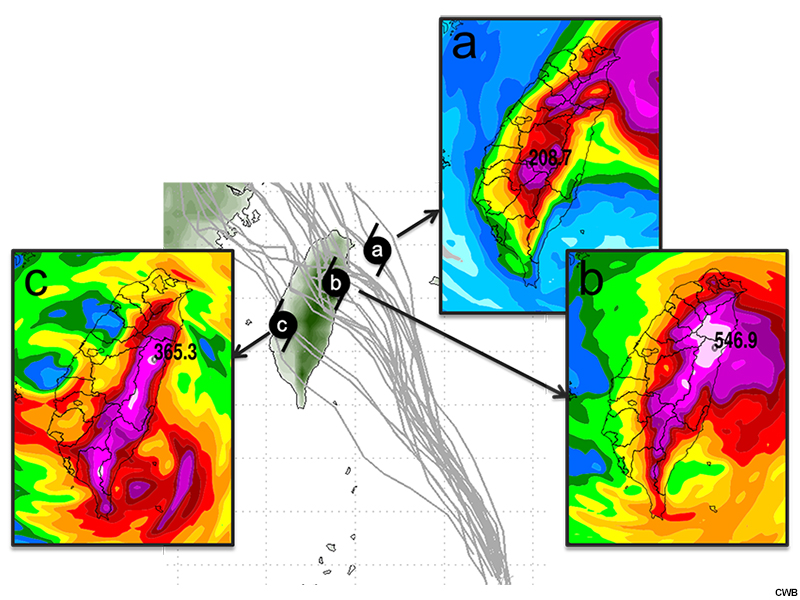
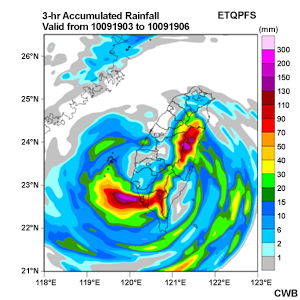
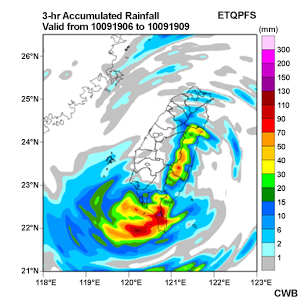
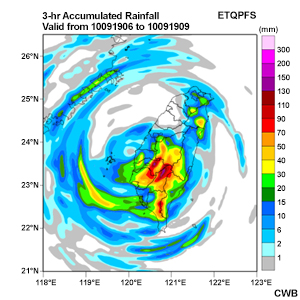
Three different QPFs, each from a different ensemble member track forecast and valid for the same time period.
Question
The image above shows three QPFs from different ensemble member tracks valid for the same forecast period. The black typhoon symbols indicate the possible position of the typhoon. Keeping in mind Taiwan’s topographic phase-locked effect, how accurately do you think the average of these three QPFs would predict the precipitation pattern compared to observations?
Select the best answer.
The correct answer is c.
The spread in the predicted typhoon locations is due to track uncertainties. Each individual typhoon position could result in a different precipitation pattern due to the topographic phase-locked effect. Averaging the precipitation forecasts from these three positions will smooth the extremes and produce an inaccurate depiction of the pattern. How can we gather more useful information from ensemble QPF forecasts? Let us learn about the Ensemble Typhoon QPF (ETQPF) model in Taiwan.
Typhoon QPF Guidance » What is the ETQPF Model?
The ETQPF model incorporates the concept of the climatology model, but uses QPFs from an ensemble prediction system (EPS) instead of historical rainfall observations. As of 2016, the ETQPF model uses a 38-member ensemble that consists of 20 WRF members from the CWB and 18 WRF members from the Taiwan Cooperative Precipitation Ensemble Forecast Experiment operated by the Taiwan Typhoon and Flood Research Institute (TTFRI). The EPS runs four times (0000, 0600, 1200, and 1800 UTC) a day. The horizontal resolution in the WRF’s innermost nested domain is 5 km.
In the ETQPF model (example shown below), each black dot indicates a 3-hr typhoon location forecast and an associated 3-hr accumulated QPF from the EPS. The black dots are referred to as the "ensemble cases". To avoid model spin-up issues during the first few hours, only 9-hr through 72-hr forecasts of the 3-hr accumulated quantitative precipitation are used.
Once a forecaster has chosen a forecast track (shown as a dashed red line), they can select the ensemble cases along the track that fall within a 30 km radius (pink circle). These pink circles (filtering radii) encompass the possible storm center locations with the associated QPFs for these locations. The pink circles DO NOT indicate the storm’s size. By averaging the QPFs along the selected track, forecasters can obtain the QPF estimate (i.e., the ETQPF modeled precipitation).
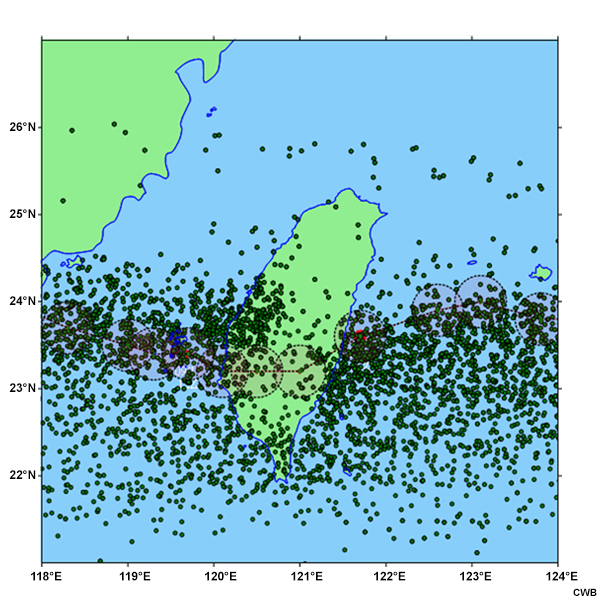
The distribution of predicted center locations (black dots) of Typhoon Fanapi (2010) in 3-hour intervals from the ensemble prediction system. Each dot is associated with a 3-hour accumulated QPF. The dashed red line is for a given typhoon track with position locations every 3 hours, and a 30 km filtering radius (pink circle) is centered at each position.
Move your cursor over the blinking red dots to magnify them.
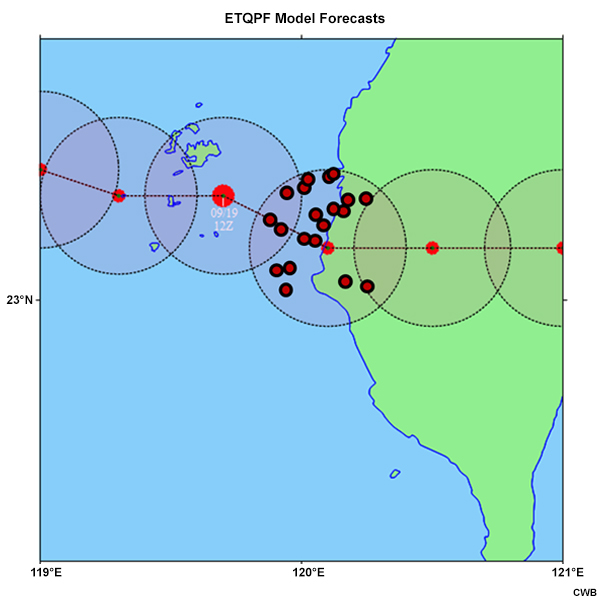
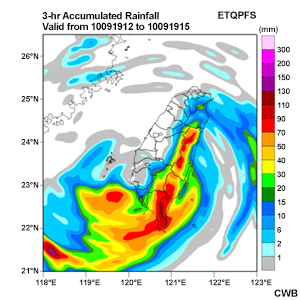
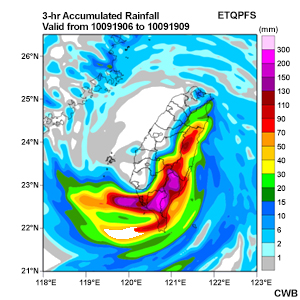
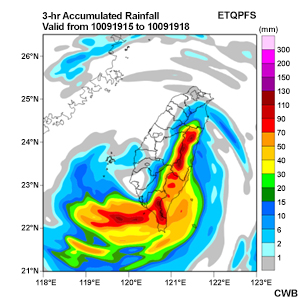

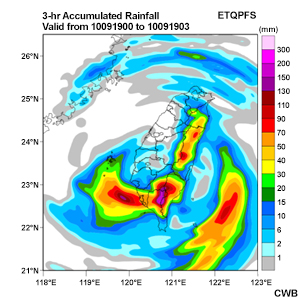
The 3-hr accumulated rainfall from selected QPF cases, using a 30-km filtering radius and translation speed error within +/- 5 km/h along the best track of Typhoon Fanapi at 0900 UTC 19 September 2010.
As shown in the image above, the ETQPF model requires enough ensemble spread in typhoon locations to cover the typhoon track forecast. Due to the topographic phase-locked effect, the QPF over Taiwan is more sensitive to the typhoon’s location than the model’s initial and valid forecast times. In order to take into account all possible track outcomes and improve ensemble spread, the ETQPF model includes past multi-day forecast runs and runs from other research institutions.
The accuracy of the ETQPF model is strongly dependent on the accuracy of the selected typhoon track forecast. Even a small change in the track could result in big changes to the precipitation distribution and amounts over Taiwan. “In general, the performance of the official forecast track or consensus track from multiple models is better than that of a single model. Consequently, the ETQPF model based on the official/consensus track forecast is expected to improve typhoon QPF due to reduced track error.”Hong et al. (2015) For example, Hong et al. (2015) found that the 72-h accumulated ETQPFs based on the best track are “generally reliable and very comparable to the observations, especially for rainfall patterns.”
The main advantage of the ETQPF model is that its forecasts are based on the near real-time ensemble prediction for a specific storm that is approaching Taiwan. It is capable of representing the interaction between the typhoon’s circulation and the surrounding environment.
Depending on the case, the ETQPF model has the potential to capture the mesoscale precipitation processes occurring over Taiwan. Let us return to the case of Typhoon Megi (2010), where interactions between the typhoon and monsoon produced the greatest rainfall over northeastern Taiwan.
The 24-hour accumulated rainfall observations based on the best track of Typhoon Megi for the period 12 UTC October 20 to 12 UTC October 21, 2010.
The climatology model failed to predict the observed rainfall pattern. Note that the rainfall scale of the climatology model tops out at 300 mm.
On the other hand, the accumulated ETQPF was fairly similar to the observations. Since precipitation fell in Taiwan while Typhoon Megi was away from the island, this indicates that the ETQPF model was able to represent this distant rainfall mechanism. You can find more case comparisons in Hong et al. (2015).
The ETQPF model can provide the typhoon QPF ‘‘scenarios’’ based on different track forecasts. This is valuable information for risk assessment and decision-making in disaster preparation and mitigation. Furthermore, certain criteria can be applied to further refine the potential scenarios, as shown in the image below of the ETQPF interface. Forecasters can adjust the numerical values of the criteria thresholds to determine if the QPF is sensitive to the criteria values. For example, the user could select a higher or lower typhoon translation speed error value and see how the QPF reacts by increasing or decreasing the precipitation.
These criteria include:
- the filtering radius
- typhoon translation speed error
- typhoon intensity
- vertical wind shear
- forecast hour
- the particular model
- precipitation intensity and percentile
ETQPF Interface
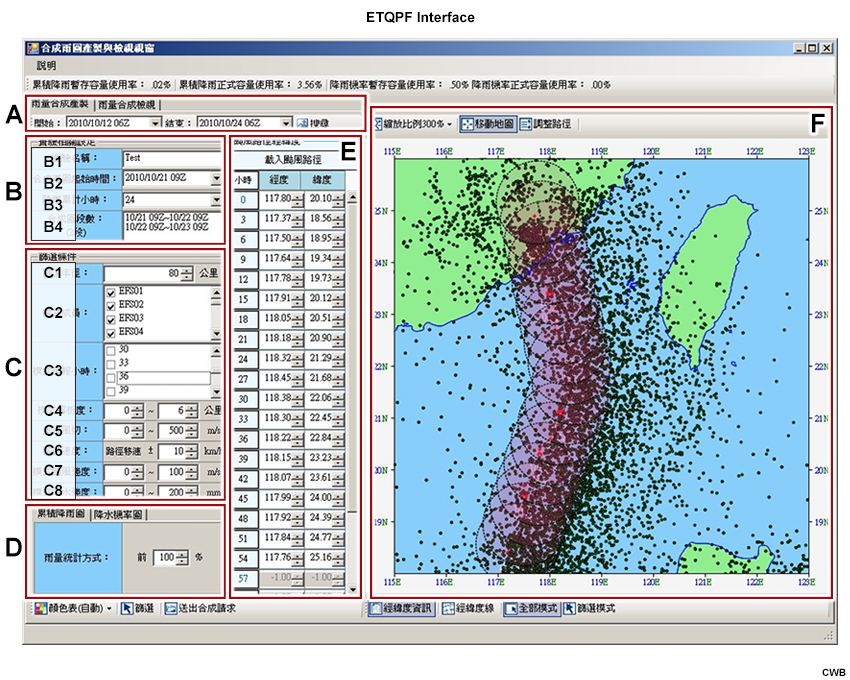
The ETQPF interface that displays A) time period of available QPFs, B) experiment-related settings, B1) name of experiment, B2) composite precipitation start time, B3) accumulated hours, B4) composite periods, C) filtering conditions, C1) filtering radius, C2) ensemble members, C3) model forecast hours, C4) model resolution, C5) vertical wind shear, C6) translation speed error, C7) storm intensity, C8) precipitation intensity, D) percentile of rainfall amount, E) typhoon track setting (to load from official track), and F) interactive interface for predicted track adjustment.
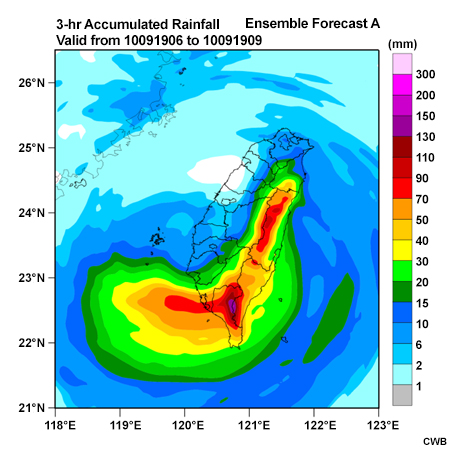
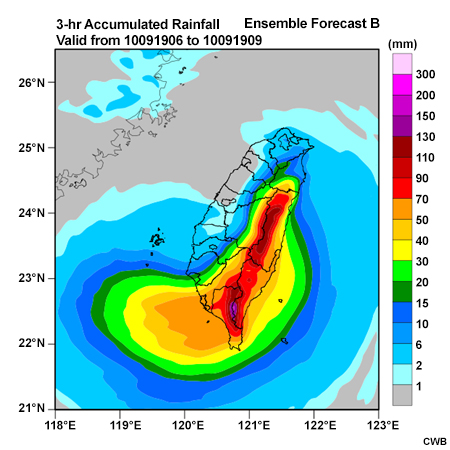
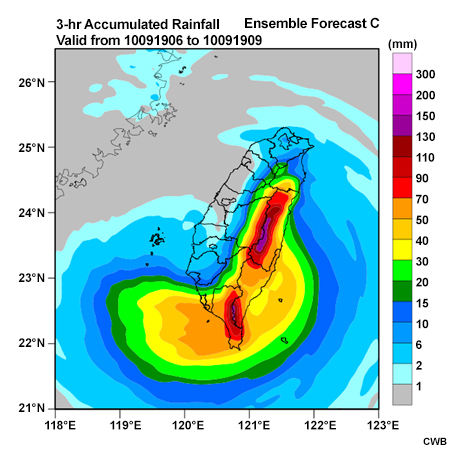
The tabs below show three different ensemble rainfall forecasts compared to observations. Ensemble forecast A shows the rainfall of ensemble cases (black dots) within a filter radii of 30 km and a translation speed error of +/- 5 km/h along the best track. Ensemble forecast B is the same as A, but includes ensemble cases within a 50 km radius. Ensemble forecast C is the same as A, but has no translation speed assigned.
Question
Compare the ensemble forecasts to the observations. Which ensemble forecast best resembles the observations?
Select the best answer.
Ensemble Forecast A + Observations Content
Ensemble Forecast B + Observations Content
Ensemble Forecast C + Observations Content
The correct answer is a.
Ensemble forecast A resembles the observations best. It represents the locations and amounts of greatest precipitation better than B and C. The radar imagery below shows a narrow, stationary convection band that increased precipitation amounts in the southern part of Taiwan. The band is discernible in ensemble forecast A.
In situations where forecasters feel confident in their track and translation speed forecasts, it may be useful to select a more restricted ETQPF model criteria. Forecasters can use stricter criteria that will enable the ensemble to filter out unlikely forecast scenarios. The ETQPF model will eliminate the less likely scenarios and could provide a more reliable forecast. The interaction between the human forecaster and the ETQPF model (Human–Machine Interaction Information System) is necessary in order to optimally handle the forecast uncertainty. Naturally, this will depend on the weather situation, the forecaster’s experience and confidence in the forecast, and the accuracy of the ensemble guidance.
The main disadvantage of the ETQPF model is that it averages the precipitation amounts from selected cases. This average reduces the possibility of extreme rainfall amounts in the ETQPF. The resulting underprediction is especially noticeable in weak phase-locked rainfall systems, such as mesoscale convective systems. Another disadvantage is error in rainfall estimates due to the systematic bias of the numerical models. Hong et al. (2015) indicated that the model QPF from an EPS tended to overpredict rainfall over steep mountainous areas.
Estimating Vulnerability
Question
Based on your knowledge about numerical weather predictability, which of the following do you think will work well in estimating and conveying heavy rainfall vulnerability?
Select the best answer.
The correct answer is b.
It is better to use ensemble forecasts when you are estimating and communicating the risk of heavy rainfall, or any other weather-related hazard. An ensemble is composed of a "family" of predicted storms where each forecast scenario is based on different conditions. Considering multiple scenarios provides a range of possible forecast outcomes, which gives you insight into the forecast uncertainties. Based on this information, a forecaster can determine their confidence in the forecast. For example, an ensemble can vary the official track forecast to generate numerous alternative scenarios, from which a forecaster can glean the spread and uncertainties in the storm track. With this information, forecasters can better estimate and communicate the precipitation vulnerability from a particular storm.
While useful in estimating vulnerability, deterministic NWP models are strongly dependent on accurate meteorological input to produce reliable forecasts. Limited observational coverage and using simple approximations to represent atmospheric processes in NWP models makes it impossible to produce forecasts with no error. Therefore, it is better to use multiple forecasts to estimate the forecast uncertainties and communicate the vulnerability of weather hazards.
The following table shows the confidence level that a sample of CWB forecasters have in the guidance tools they use to create the typhoon QPF. The level of confidence is highly dependent on the uncertainty of the track forecast. 5 shows greatest confidence; 1 lowest confidence
Confidence in QPF Guidance Tool Based on Forecast Hour up to Three Days
0-24 hours |
24-48 hours |
48-72 hours |
|
Analogue Method |
2 |
2 |
2 |
Climatology Model |
3 |
3 |
2 |
Non-selected Ensemble Mean |
3 |
2 |
1 |
Selected Ensemble Mean (ETQPF model) |
5 |
4 |
3 |
Question
Review the chart above. Based on what you have learned about each guidance type, decide whether the statements below correctly describe the reason for the confidence level in the chart.
Select True or False for the statements below.
The correct answers are displayed above. Broadly speaking, the further into the future that model forecasts go, the larger the uncertainty in the typhoon track, position, and intensity. Thus, the confidence level in the guidance is lower.
Supporting Emergency Operations
When preparing to answer questions from the emergency operation centers (EOCs), forecasters need to be aware of their needs. EOCs are concerned with the general threat of heavy rain and flooding across their area, but often need specific threat information for key locations, too.
At present, EOCs in Taiwan can incorporate the ETQPF model output or observations into their decision-making software and adjust their plans accordingly. Thus, it is important that the CWB frequently updates their QPF and rain gauge observation data.
In order to make their decisions, EOCs want to know:
- where will it rain?
- how much will it rain?
- when will the precipitation begin?
- when will the precipitation be over?
What should forecasters do when there is large track uncertainty?
Each community has different critical thresholds and timing requirements. Forecasters provide decision-makers with their best possible forecast, along with related forecast uncertainties. This should include a range of alternative yet plausible forecast scenarios, so that the spectrum of outcomes can be assessed to reveal acceptable margins of safety. In the next section, we will practice supporting the EOCs by providing them with relevant weather information.
Case Study
Overnight on July 17, 2014, Tropical Storm Matmo formed in the Northwest Pacific Ocean east of the Philippines. The storm moved northwest towards Taiwan, and strengthened to a typhoon by early afternoon on July 19th. Typhoon Matmo was predicted to have maximum winds of ~38 m/s near its center (categorized as moderately intense by CWB) as it neared Taiwan.
You have been contacted by an EOC manager who would like to know how much rain will fall over Hualien City, when it will begin and end, and when will the significant rain arrive. You are preparing a 0300 UTC forecast (11:00 a.m. local time) on July 21st. (Note: In general, we need to provide rainfall information for an entire region. In this module, we will practice with prediction for a specific location.)
Surface Analysis and Satellite Content
Surface Forecast Content
The surface analysis and surface forecasts indicate that the typhoon could be steered by the subtropical high and travel northwestward. After reviewing observations and other guidance, you have determined that the typhoon could impact Taiwan sometime between July 22nd and 23rd.
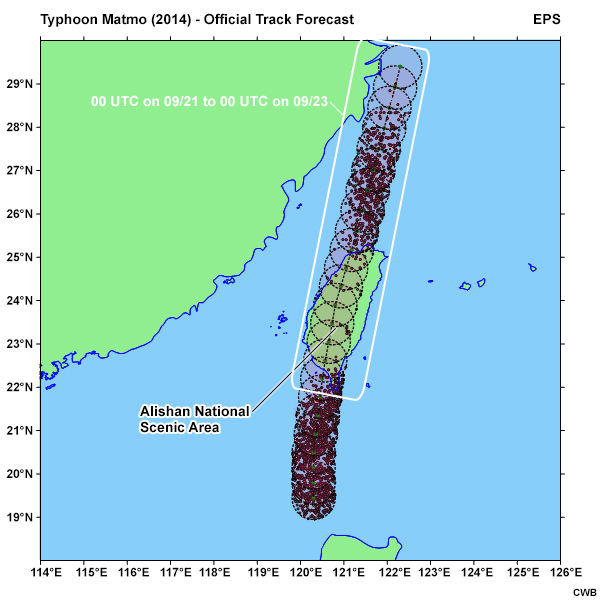
Potential Track Area
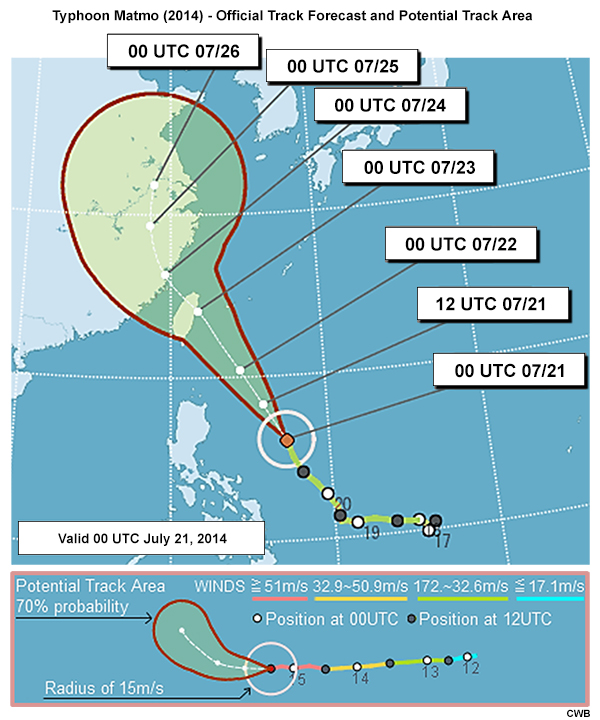
颱風路徑潛勢預報圖
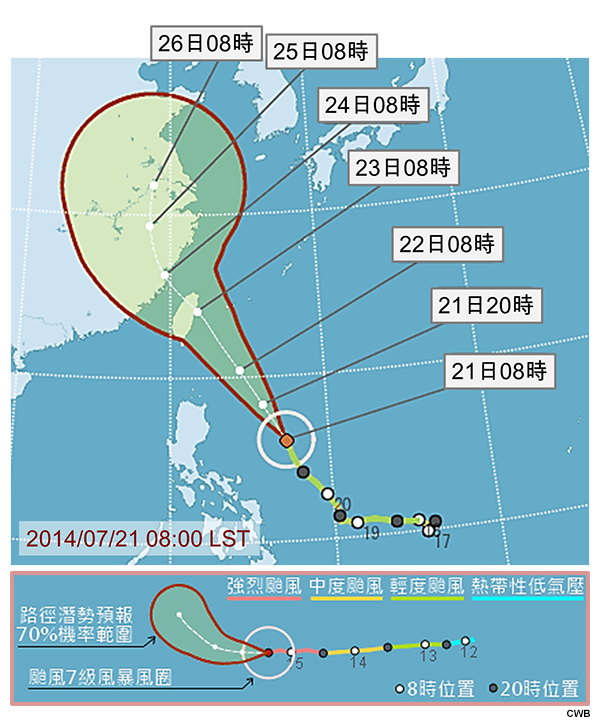
The official track (track-O) brings the typhoon towards northeast Taiwan, with landfall to the north of Hualien City during the morning on July 23rd. According to the potential track area (image above), the track uncertainty in the 48-hr forecast was about 500 km, which is very large.
Case Study » Potential Precipitation Amount
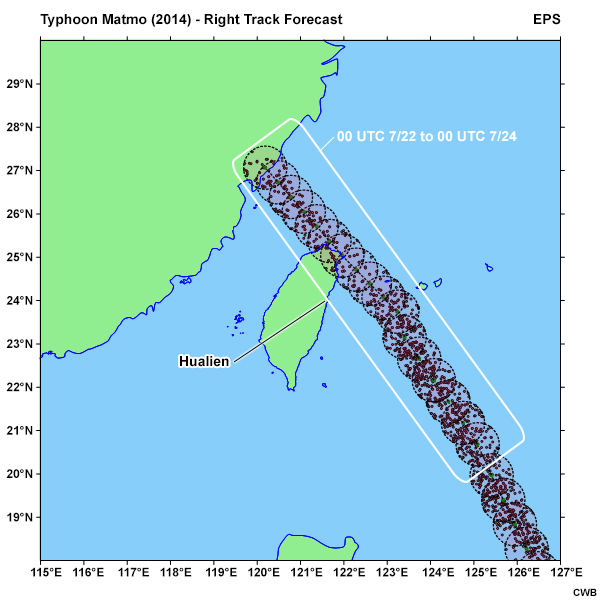
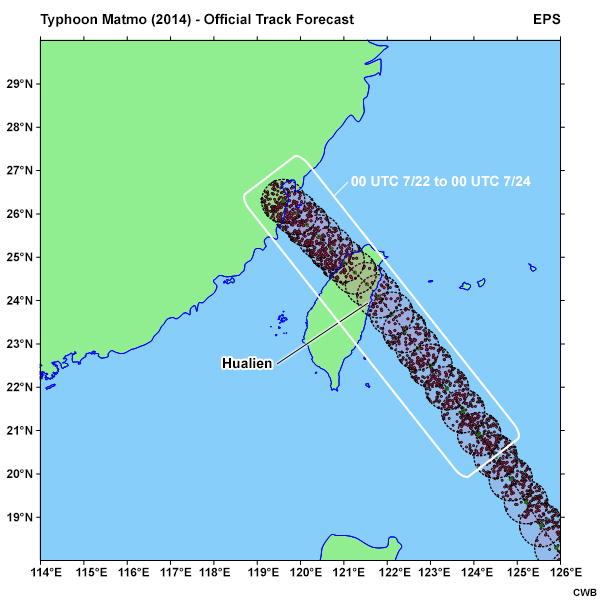
You have selected two potential tracks, one is to the right of the official track, and another is to the left (i.e., track-R and track-L). Track-L forecasts landfall to the south of Hualien City. Track-R will take the typhoon farther north from Hualien City. All tracks use a 50-km filtering radius and translation speed error of +/- 10 km/h.
Track-R Content
Track-O Content
Track-L Content
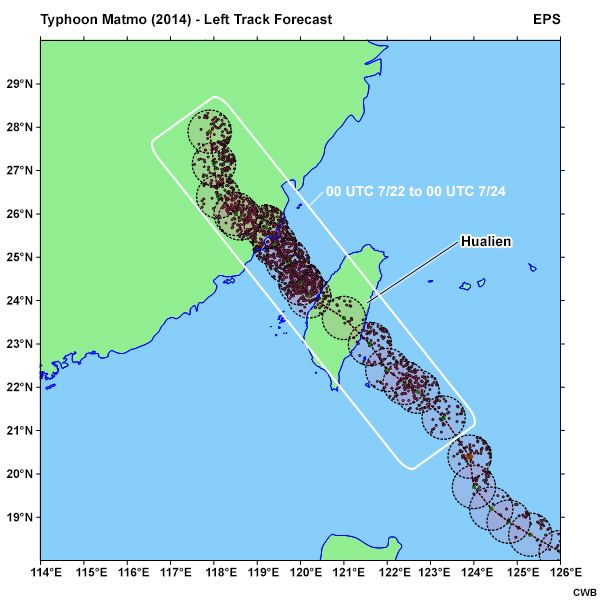
As shown in the image below with the black dots, the ensemble spread could cover all three tracks.
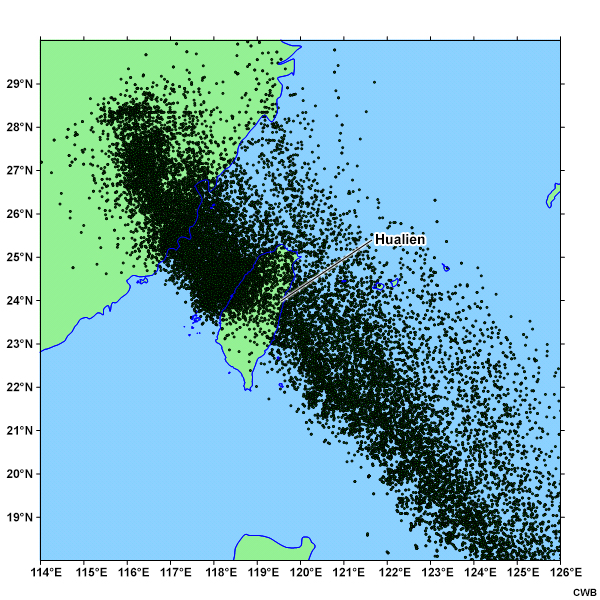
The distribution of predicted storm center locations (black dots) of Typhoon Matmo (2014) from the ensemble prediction system.
With this information, you are ready to look at the ETQPFs. Review the 48-hr ETQPFs from 00 UTC on July 22 through 00 UTC on July 24 and determine how much rain is predicted to fall over Hualien City.
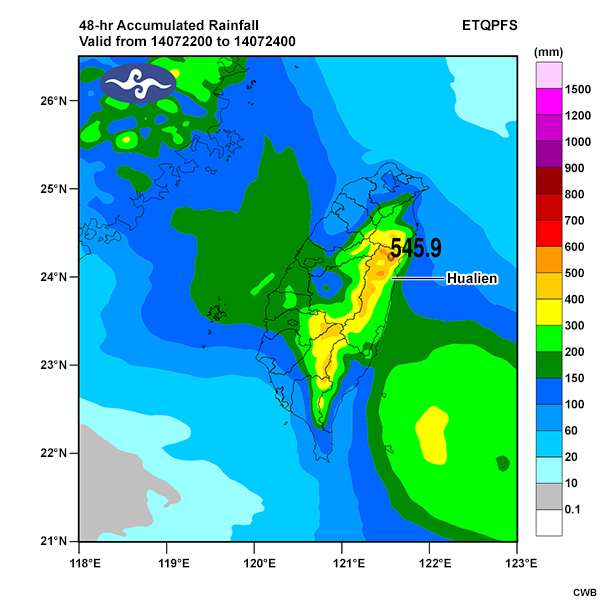
Track-R ETQPF HL:60-100 Content
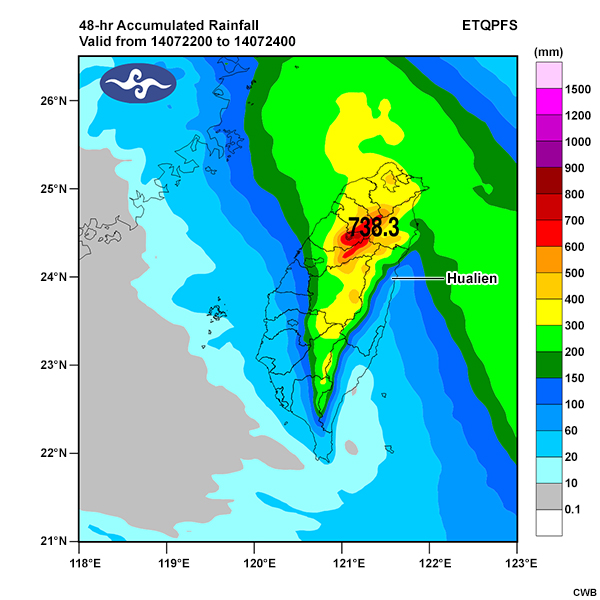
Track-O ETQPF HL: 200-300 Content
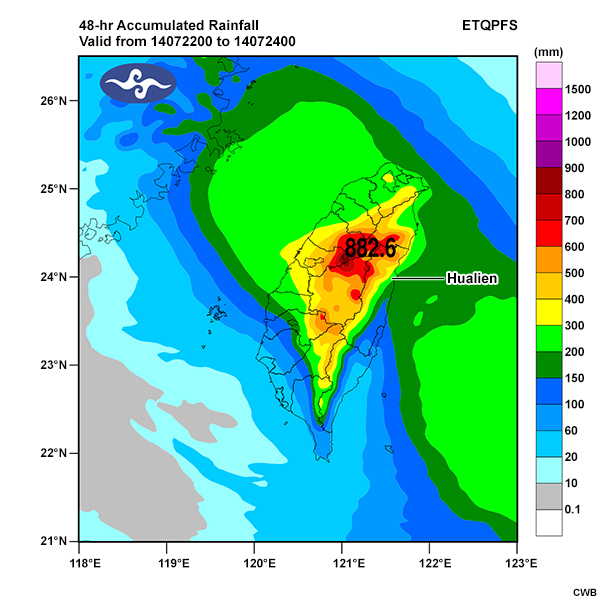
Track-L ETQPF HL: 200-300 Content
Question
What is the possible 48-hr accumulated rainfall range for Hualien City between 0000 UTC July 22nd and 0000 UTC July 24th?
Select the best answer.
The correct answer is d.
The three ETQPFs indicate a precipitation range between 60 mm and 300 mm over Hualien City. This is a very large range (it covers 48 hours), but it is necessary in order to account for all possible precipitation outcomes across Taiwan. The range in option d considers the results from all three tracks. Options a and c are incorrect because they are based on a single track forecast (i.e. a deterministic forecast) and fail to consider the uncertainty in the typhoon track forecast. Option b is incorrect because it does not account for the risk of greatest precipitation in track-O and track-L.
Continue to the next section to determine the potential timings of the event.
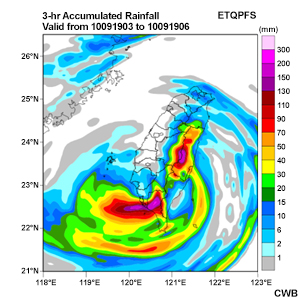
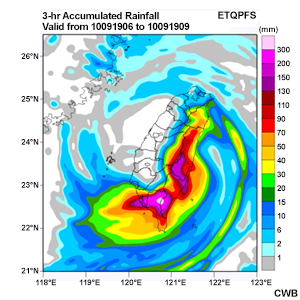
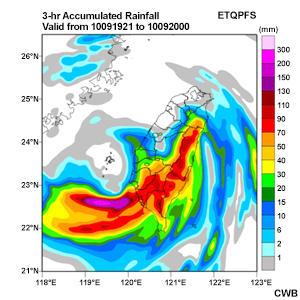
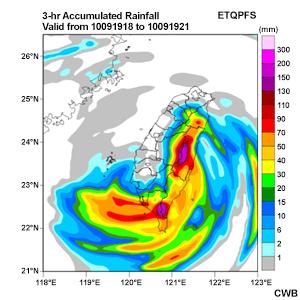
Case Study » Potential Timing
Next, the EOC is concerned about the possible start and end time of the precipitation (measurable precipitation is greater than 15 mm in any given 6-hr period), as well as the timing for significant rainfall. The tabs below show animations of the 6-hour accumulated rainfall from 12 UTC on July 21 to 00 UTC on July 24. Review the animations and answer the questions that follow.
Track-R
Track-O
Track-L
Use the arrows or radio buttons to advance through Questions 1-3. Be sure to complete all questions before continuing.
Question 1 of 3
What is the most likely time period that precipitation could begin over Hualien City for each track?
Select the best answer for each track.
The best answers are displayed above. In track-O, it is possible for Hualien City to experience light precipitation (<15mm/6hrs) earlier than the evening of July 22nd. However, the greatest increase in precipitation is between 12 and 18 UTC - the early evening to overnight hours local time. If the typhoon moves further south than the official track, then the precipitation could start sooner, between the early afternoon and early evening on July 22nd. If track-R materializes, the start time period of the precipitation could shift 6 hours later.
It is better not to give timing information with a resolution higher than 6 hours when you are forecasting this far in advance. The correct answer is the most likely time period for the event, but it could begin earlier or later. It is better to use broad time descriptors (like early evening to overnight) to indicate what time(s) of the day are most likely to experience precipitation. In this way, our language accounts for the uncertainty in the forecast.
Question 2 of 3
Next, you need to determine when significant rain (> 50 mm/6hrs) is likely to fall over Hualien City during this period.
When could significant precipitation arrive over Hualien City for each track?
Select the best answer for each track.
The best answers are displayed above. Based on track-O, significant precipitation could begin sometime between overnight on July 22nd and early morning on July 23rd over Hualien City. Track-L suggests that the significant precipitation could occur earlier than the official track, sometime between the early evening and overnight on July 22nd. Track-R shows no significant precipitation over Hualien City.
Question 3 of 3
Next, you need to determine when the precipitation will end.
When could the precipitation end over Hualien City for each track?
Select the best answer for each track.
The best answers are displayed above. In track-O, the ETQPF model indicates that the greatest precipitation decrease is between early evening and overnight on July 23rd. The very light precipitation that could continue later is below 15 mm.
The other track forecasts show the precipitation decreasing the most earlier than the official track, bringing the precipitation to an end between early afternoon and early evening on July 23rd.
Based on the QPFs of the tracks above, we could summarize the QPF scenarios in the time series below.
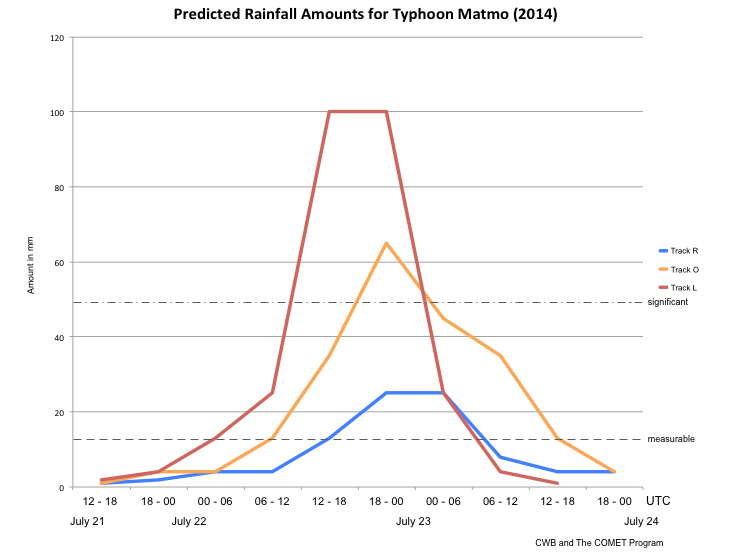
Case Study » Communicating the Threat
Question
Based on your findings, which of the following will you convey to the EOC manager for this community?
Select the best answer.
The correct answer is a.
Based on the official track forecast, we found that the timing possibilities for the onset, cessation, and expected period of significant rainfall is correctly described in option a. Also, option a better describes the track uncertainty of the situation. In operational settings, EOCs usually prepare for the worst-case scenarios. Track-L, which makes landfall to the south of Hualien City, shows higher risk than the other tracks since the city is on the windward side of the mountains. It is better to convey this risk instead of only using the information from the official track. Option b is incorrect because it does not consider the greatest rainfall amount from track-O and track-L. Option c is incorrect because it conveys only the information of official track, which makes it deterministic.
Case Study » What happened?
Review the following observations and answer the questions that follow. Select the best answer for each question.
48-hr Accumulated Rainfall Content
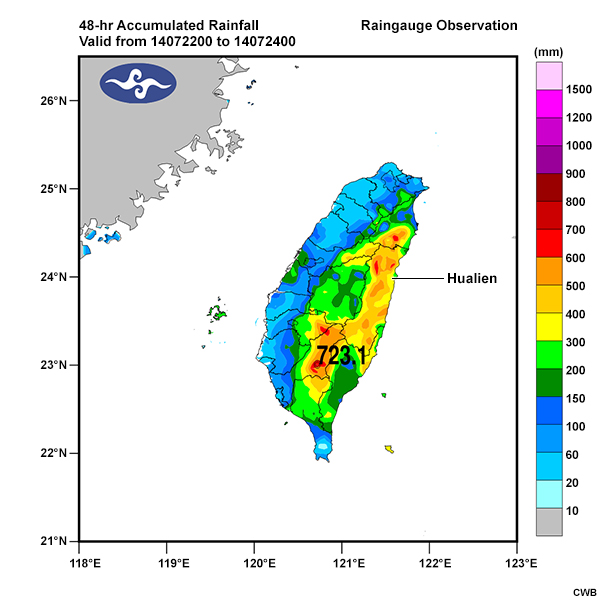
The 48-hour accumulated rainfall observations for the period 00 UTC July 22 to 00 UTC July 24, 2014 during Typhoon Matmo.
6-hr Accumulated Rainfall Animation Content
Question
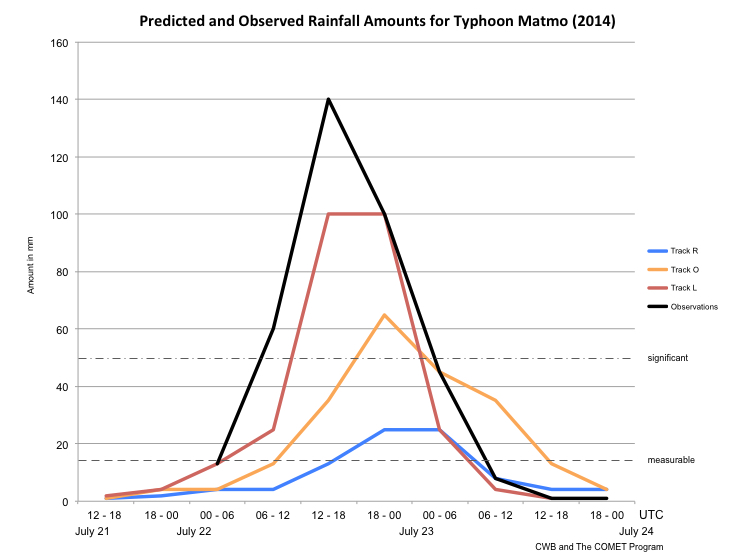
The correct answers are displayed above. As you can see in the best track below, Typhoon Matmo made landfall farther south than the official forecast, and also brought heavy rain to areas east of the mountains. The time series shows that the rainfall trend in the observations is closer to what was predicted by track-L, but the precipitation amount is higher (ranged from 300 to 400 mm) and the period of significant precipitation occurred 6 hours earlier (between early afternoon and early evening on July 22nd). The precipitation began at the same time as the significant precipitation, and ended between the early afternoon and evening on July 23rd.

This case study shows the challenges of typhoon QPF in Taiwan. In reality, track-L is the best track of Typhoon Matmo. In the track-L time series, the ETQPF model produced reasonable precipitation estimates compared to observations. However, even acceptable track prediction errors (e.g. track-O and track-R) could result in large differences in possible QPF scenarios. Therefore, it is necessary to provide EOCs with possible forecast scenarios instead of deterministic forecast information. In this way, EOCs could make their risk assessments based on all possible scenarios.
For example, the ETQPF generated at 0300 UTC September 20th for Tropical Storm Fung-Wong (2014) was based on the following tracks:
Track-R Content
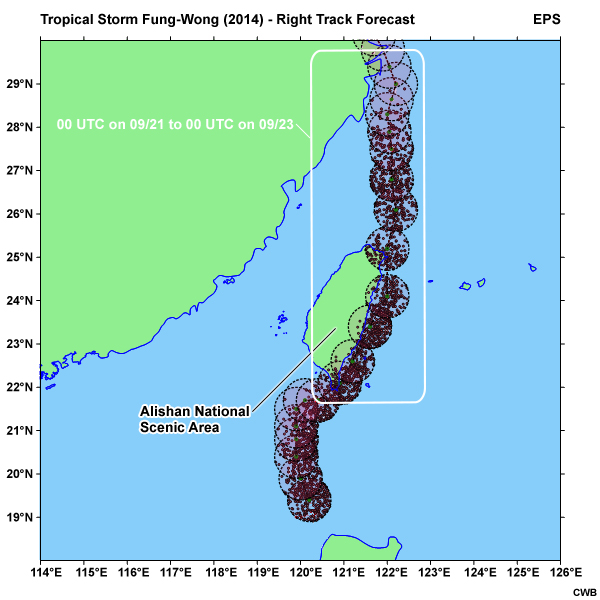
Right track forecast (track-R) of Tropical Storm Fung-Wong (2014), with predicted storm center locations (black dots) using a 50-km filtering radius and translation speed error of +/- 10 km/h.
Track-O Content
Official track forecast of Tropical Storm Fung-Wong (2014), with predicted storm center locations (black dots) using a 50-km filtering radius and translation speed error of +/- 10 km/h.
These track forecasts brought the storm to the right (track-R) and left (track-O) of the CMR, and resulted in very different precipitation forecast scenarios. The best track of Tropical Storm Fung-Wong resembles forecast track-R as shown in the image below:
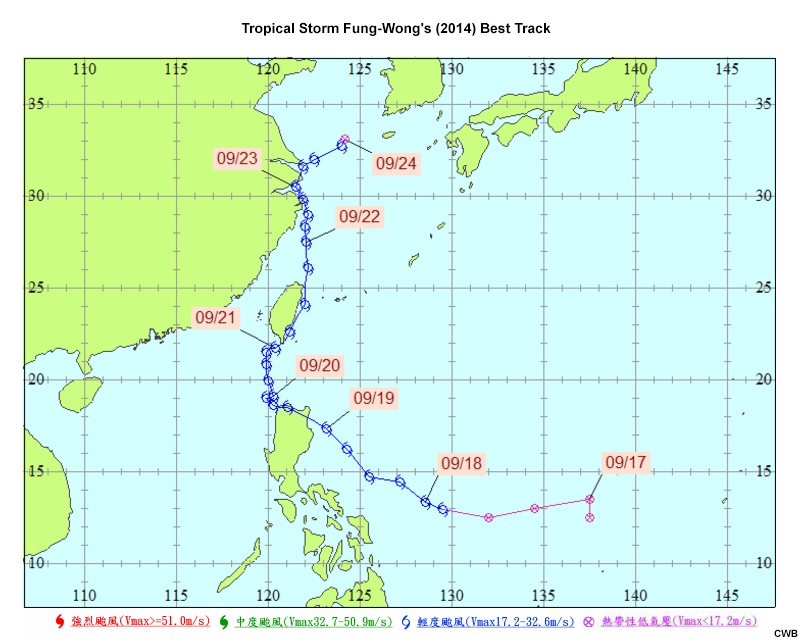
Tropical Storm Fung-Wong produced the following precipitation distribution:
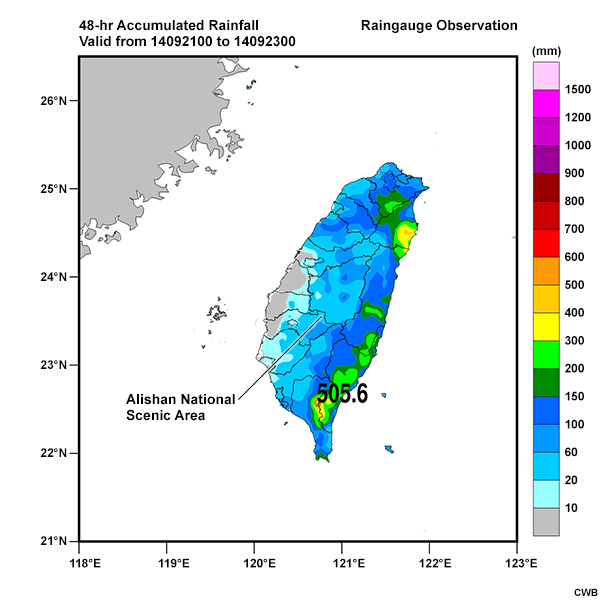
The 48-hour accumulated rainfall observations for the period 00 UTC September 21 to 00 UTC September 23, 2014 during Typhoon Fung-Wong.
As shown in the observations, the 48-hr accumulated rainfall ranged from 20 to 60 mm in the Alishan area. However, the precipitation was forecast to be between 400 and 500 mm based on forecast track-O.
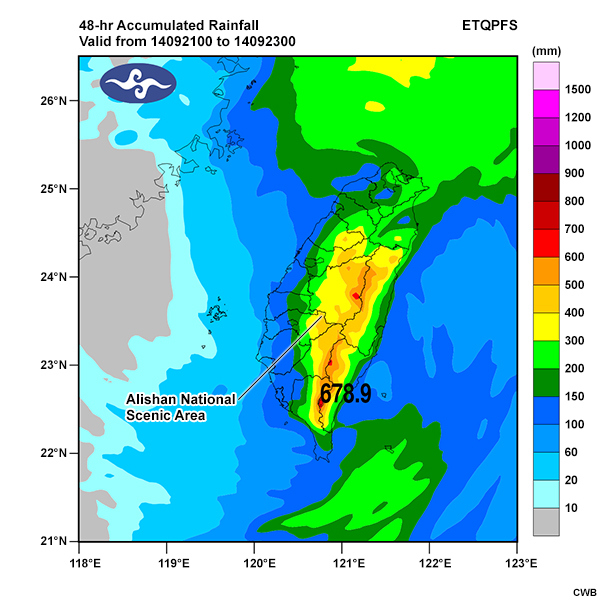
The 48-hour accumulated rainfall for the period 00 UTC September 21 to 00 UTC September 23, 2014 predicted by ETQPF model based on forecast track-O for Tropical Storm Fung-Wong.
The typhoon's position relative to the CMR is critical to determining the distribution and amount of rainfall. This is why it is important to provide possible forecast scenarios to EOCs.
Summary
The torrential downpours that typhoons bring to Taiwan cause great devastation in the form of flooding, landslides, and debris flows. This makes it imperative for forecasters to provide the best possible quantitative precipitation forecast (QPF) in order to help emergency operation centers (EOCs) in their preparation, mitigation, and recovery efforts after typhoon-related events in Taiwan. However, the interaction between the Central Mountain Range and a typhoon’s circulation, structure, and intensity presents a major challenge when producing accurate typhoon QPFs. Furthermore, a typhoon's position relative to the CMR plays a major role in the distribution and amount of precipitation that falls on the island.
This lesson introduced the typhoon QPF forecasting methodology used by the CWB, including the role played by the analogue method and the typhoon rainfall climatology model in Taiwan. The lesson discussed the advantages and limitations of the Ensemble Typhoon QPF model, and included a case to help learners practice interpreting this guidance and summarizing it to EOCs.
The lesson also highlighted the need to communicate possible forecast scenarios to show the uncertainties associated with typhoon forecasting instead of using deterministic forecast information. The learners also practiced communicating the risk to EOCs by using:
- broad time descriptors to indicate what time(s) of the day are most likely to experience precipitation
- precipitation ranges
In this way, forecasters can account for possible variations in the typhoon tracks and precipitation ranges. Since typhoon flooding is a devastating hazard and the current state of the science does not allow for precise forecasts of precipitation distributions and amounts, it is important to consider areas that may have a chance of significant precipitation. These areas at risk will need to initiate preparation efforts in order to mitigate the impacts of typhoon flooding.
References
Hong, J.-S., C.-T. Fong, L.-F. Hsiao, Y.-C. Yu, and C.-Y. Tzeng, 2015: Ensemble typhoon quantitative precipitation forecasts model in Taiwan. Weather and Forecasting, 30(1), 217-237.
Lee, C.-S., L.-R. Huang, H.-S. Shen, and S.-T. Wang, 2006: A climatology model for forecasting typhoon rainfall in Taiwan. Nat. Hazards, 37, 87–105.
Wu, C.-C., and M.-J. Yang, 2011: Preface to the special issue on "Typhoon Morakot (2009): Observation, modeling, and forecasting." Terr. Atmos. Ocean. Sci, 22.
Contributors
COMET Sponsors
MetEd and the COMET® Program are a part of the University Corporation for Atmospheric Research's (UCAR's) Community Programs (UCP) and are sponsored by NOAA's National Weather Service (NWS), with additional funding by:
- Bureau of Meteorology of Australia (BoM)
- Bureau of Reclamation, United States Department of the Interior
- European Organisation for the Exploitation of Meteorological Satellites (EUMETSAT)
- Meteorological Service of Canada (MSC)
- NOAA's National Environmental Satellite, Data and Information Service (NESDIS)
- NOAA's National Geodetic Survey (NGS)
- Naval Meteorology and Oceanography Command (NMOC)
- U.S. Army Corps of Engineers (USACE)
To learn more about us, please visit the COMET website.
Project Contributors
Program Manager
- Bruce Muller — UCAR/COMET
Project Lead
- Tsvetomir Ross-Lazarov — UCAR/COMET
Principal Science Advisors
- 呂國臣 (Dr. Kuo-Chen Lu), Deputy Director - Central Weather Bureau/Meteorological Forecast Center
- 洪景山 (Dr. Jing-Shan Hong), Senior Technical Specialist - Central Weather Bureau/Meteorological Information Center
- 馮欽賜 (Dr. Chin-Tzu Fong), Deputy Director - Central Weather Bureau/Meteorological Information Center
- 黃椿喜 (Dr. Treng-shi Huang), Section Chief - Central Weather Bureau/Meteorological Forecast Center
- 劉人瑋 (Jen-Wei Liu), Associate Technical Specialist, Central Weather Bureau/Meteorological Forecast Center
- Vanessa Vincente, Meteorologist — UCAR/COMET
- Bryan Guarente, Meteorologist — UCAR/COMET
Science Advisors
- 蘇奕叡 (Yi-Jui Su), Research Assistant - Central Weather Bureau/Meteorological Information Center
- 陳新淦 (Shin-Gan Chen), Associate Technical Specialist - Central Weather Bureau/Meteorological Forecast Center
- 陳薏蘋 (Yi-Pin Chen), Junior Technical Specialist - Central Weather Bureau/Meteorological Forecast Center
- 李志昕 (Chih-Hsin Li), Associate Technical Specialist - Central Weather Bureau/Meteorological Information Center
Instructional Design
- Tsvetomir Ross-Lazarov — UCAR/COMET
Graphics/Animations
- Steve Deyo — UCAR/COMET
Multimedia Authoring/Interface Design
- Gary Pacheco — UCAR/COMET
COMET Staff, October 2016
Director's Office
- Dr. Rich Jeffries, Director
- Dr. Greg Byrd, Deputy Director
Business Administration
- Dr. Elizabeth Mulvihill Page, Group Manager
- Lorrie Alberta, Administrator
IT Services
- Tim Alberta, Group Manager
- Bob Bubon, Systems Administrator
- Dolores Kiessling, Software Engineer
- Joey Rener, Student Assistant
- Malte Winkler, Software Engineer
Instructional and Media Services
- Bruce Muller, Group Manager
- Dr. Alan Bol, Scientist/Instructional Designer
- Steve Deyo, Graphic and 3D Designer
- Lon Goldstein, Instructional Designer
- Bryan Guarente, Instructional Designer
- Lindsay Johnson, Student Assistant
- Dr. Vickie Johnson, Instructional Designer (Casual)
- Gary Pacheco, Web Designer and Developer
- Sylvia Quesada, Production Assistant
- Sarah Ross-Lazarov, Instructional Designer (Casual)
- Tsvetomir Ross-Lazarov, Instructional Designer
- David Russi, Spanish Translations
- Andrea Smith, Meteorologist/Instructional Designer
- Marianne Weingroff, Instructional Designer
Science Group
- Wendy Schreiber-Abshire, Group Manager
- Paula Brown, Visiting Meteorologist, CIRA/Colorado State University
- Dr. William Bua, Meteorologist
- Dr. Frank Bub, Oceanographer (Casual)
- Lis Cohen, Meteorologist (Casual)
- Patrick Dills, Meteorologist
- Matthew Kelsch, Hydrometeorologist
- Dr. Elizabeth Mulvihill Page, Meteorologist
- Amy Stevermer, Meteorologist
- Vanessa Vincente, Meteorologist