1.0 Using Satellite Tools for Surface Flooding » 1.1 Motivation
Flooding is one of the deadliest and costliest weather phenomena in the United States and around the world.
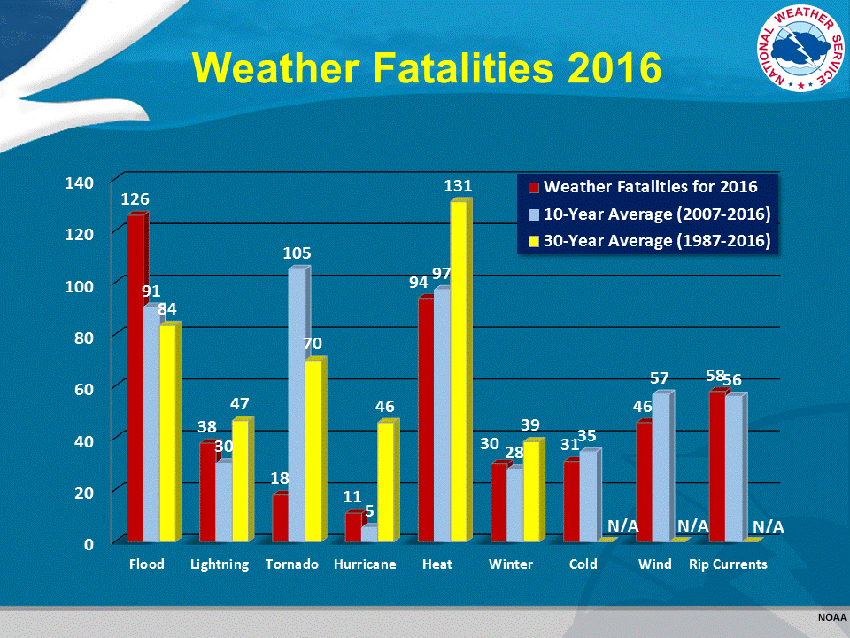
Question
What do these bar graphs show regarding flood-related fatalities in the United States?
The correct answers are shown above.
Floods were the deadliest of the listed phenomena in 2016, and the second deadliest (behind heat waves) for the 30-year period of 1987-2016.
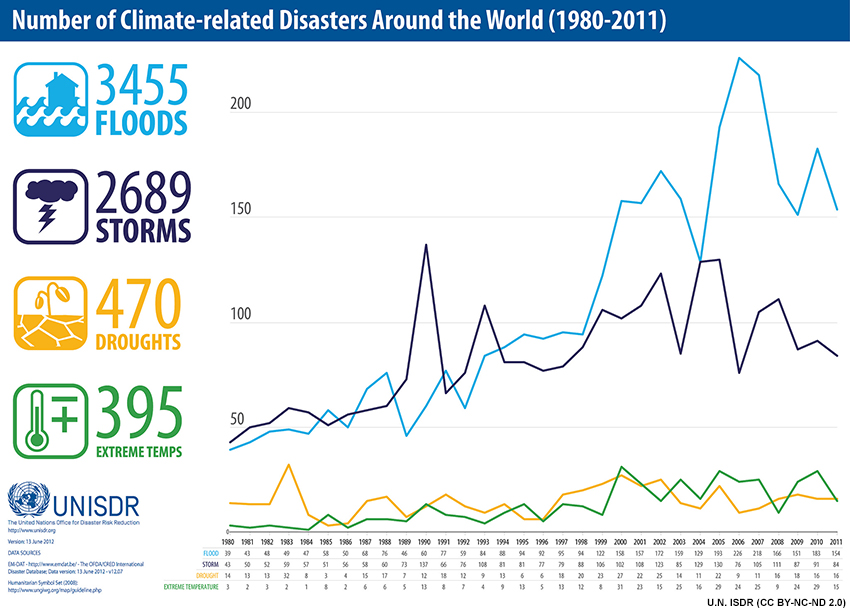
Worldwide the number of flood disasters increased more than threefold between 1980 and 2011, and the number of flood disasters outpaces storms, droughts, and extreme temperature.
Recent developments in satellite data provide real-time tools for flood detection and mapping using visible, infrared (IR), and composite high-resolution data. Satellite data are making it possible to provide detailed flood analyses and forecast tools in both developed and underdeveloped regions.