Introduction
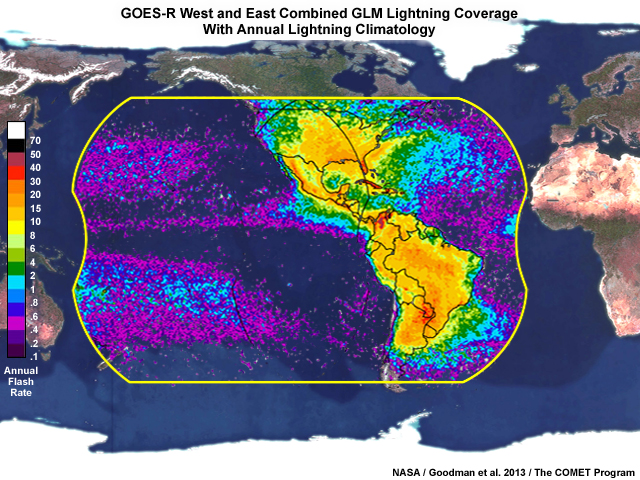
The Geostationary Lightning Mapper (GLM) on the GOES-R satellite series is the first operational lightning detector in geostationary orbit. The GLM continuously measures all lightning activity across most of the Western Hemisphere in real time. These observations are collected 24 hours a day with near-uniform, thunderstorm-scale resolution.
GLM products can aid forecasters and decision makers in a variety of situations ranging from situational awareness to active warning decision support. This lesson shows several recent examples from forecasters participating in NOAA’s Hazardous Weather Testbed (HWT) Spring Experiment 2018. Specifically, we will look at the flash extent density gridded product, and how it can add value to diagnosis and nowcasting of convective initiation, storm intensification, and areal extent of lightning. We’ll also discuss limitations to keep in mind while using GLM gridded products, and we’ll take a peek at other gridded products currently in development.
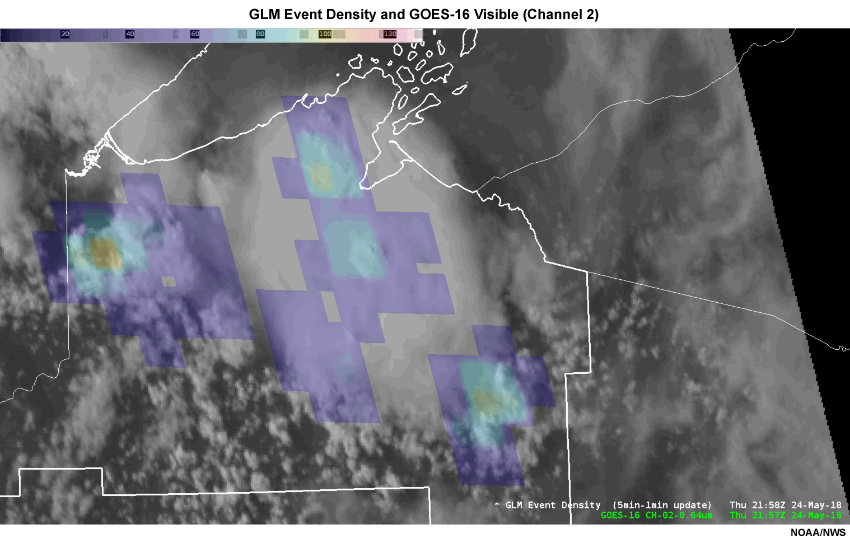
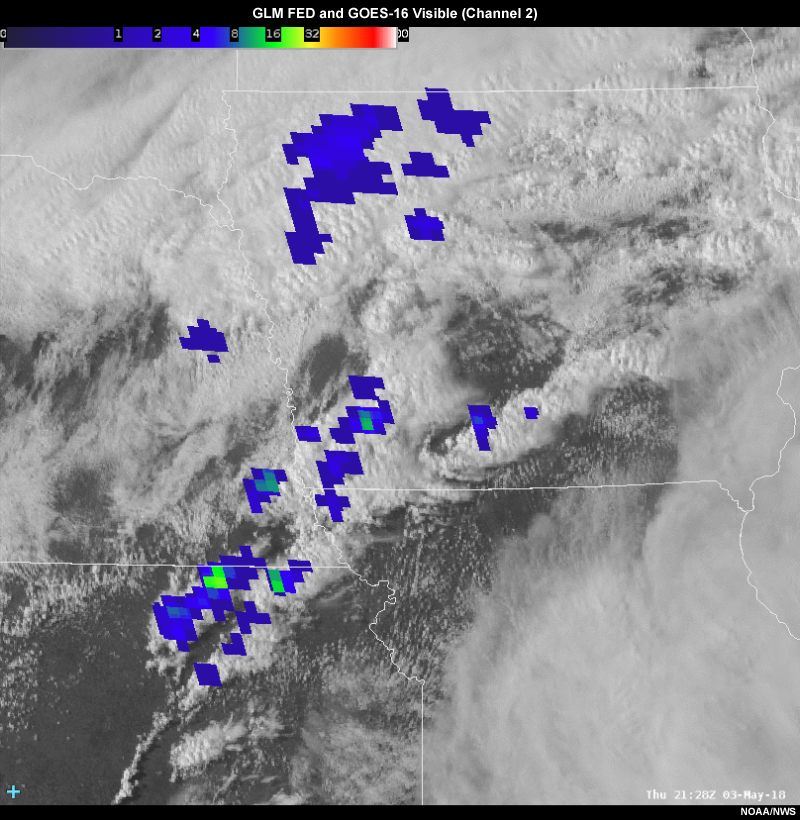
GOES-16 Channel 2 visible imagery with color-shaded GLM Event Density
For more information about the GLM instrument and its capabilities, see the following COMET MetEd resources:
Overview of Flash Extent Density
This lesson primarily relies upon the gridded product Flash Extent Density (FED), the first National Weather Service (NWS) grid variable derived from GLM. FED is created by re-gridding GLM flashes to the 2 x 2 km grid native to GOES-R ABI.
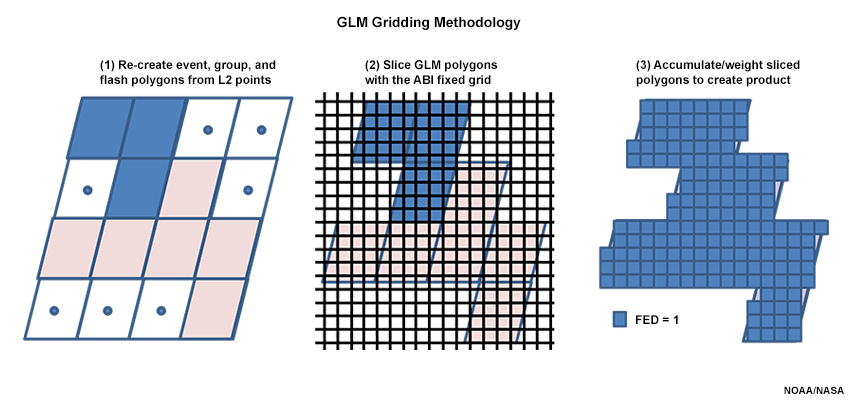
GLM level 2 flashes are initially plotted on 8 km polygons, and then sliced to match ABI’s 2 km fixed grid. The gridboxes are then assigned values based on the polygon intersections and values to create flash extent density. FED is the number of flashes that occur within a grid cell over a given period of time, and its units are flashes per minute or per n minutes, depending on averaging period. In this lesson, we will examine examples using 1-minute averages and 5-minute averages updated every minute - both averaging times allow forecasters to discern lightning activity and extent trends. FED best portrays, in a single product, the quantity and extent of GLM flashes/events.
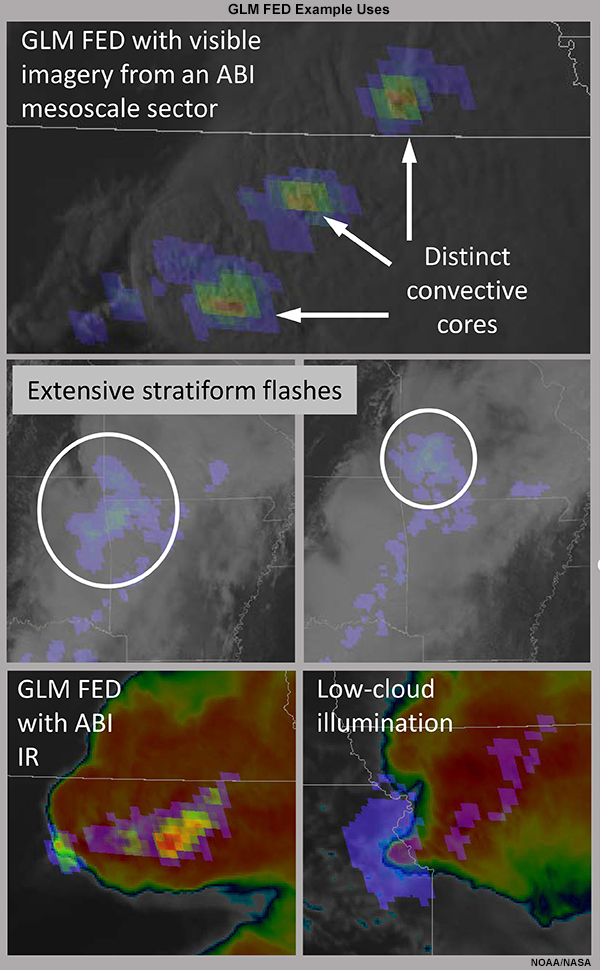
FED displays information about thunderstorm cores, stratiform activity and can show areas in which low-level clouds are illuminated by surrounding lightning strikes.
FED can be used to help identify convective initiation, the strongest storm cores, and potential severe impacts. The areal extent of flashes can be viewed as well, allowing forecasters to better see stratiform lightning and communicate to stakeholders and the public when flashes may occur away from precipitation.
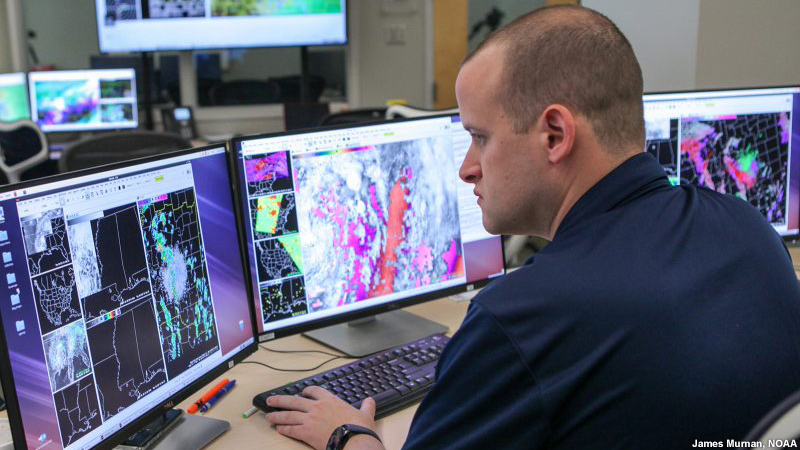
David Stark, a meteorologist with the NOAA National Weather Service New York forecast office, in the Hazardous Weather Testbed working with GLM data.
To explore the operational forecasting capabilities of GLM FED in detail, the next section shows several recent examples discussed during the Hazardous Weather Testbed 2018 Spring Experiment.
Value Added to Operational Forecasting
Value Added to Operational Forecasting » Comparison to Longstanding Observing Methods
FED and other gridded products allow us to see not only cloud-to-ground (CG) strikes, but also in-cloud and cloud-to-cloud lightning. However, unlike ground based lightning-detection networks such as the National Lightning Detection Network (NLDN) or Earth Networks Total Lightning Network (ENTLN), GLM does not distinguish between these lightning types. Overall, GLM captures more than 70% of all strikes regardless of type, and over 90% of lightning activity at night, when illumination is easier to detect. Ground-based networks excel at capturing cloud-to-ground strikes, with greater than 80% detection where observations are dense, but have varying detection efficiencies between 40% and 70% elsewhere and for in-cloud lightning.
This means GLM adds considerable value in areas without other means of lightning observation and in those with sparsely located ground sensors or radars, such as the interior west of the US.
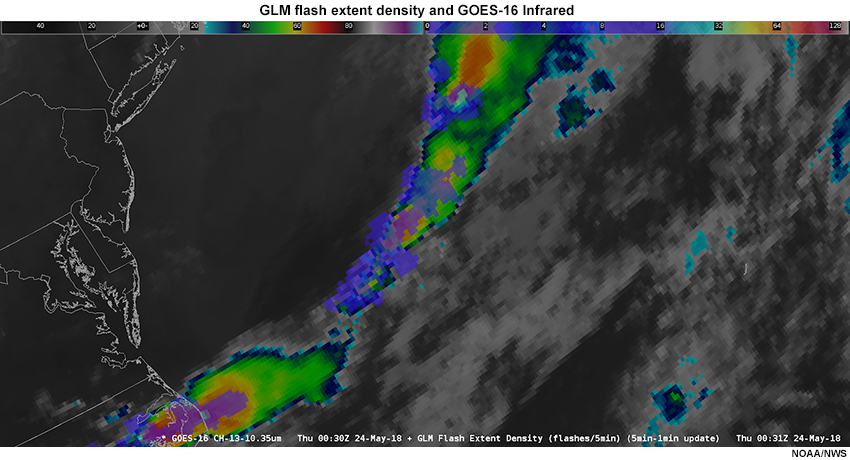
FED overlaid on GOES-16 longwave IR, showing lightning activity near colder cloud top temperatures over the Atlantic Ocean.
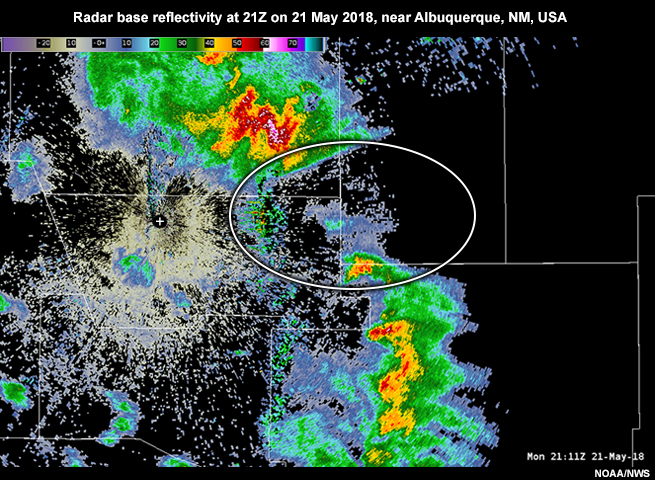
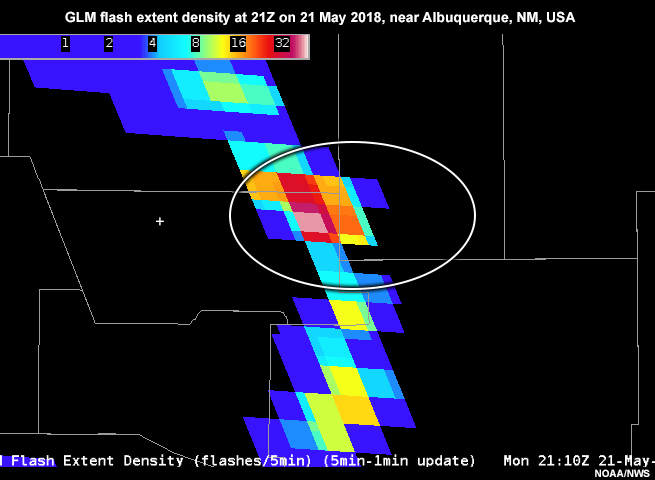
The quick example below shows just one example of additional coverage: GLM providing flash information beyond radar-blocking terrain outside of Albuquerque, New Mexico. In this case very strong FED values confirmed that the thunderstorm cell within the blocked area was intensifying.
Radar
GLM FED
In addition to GLM’s enhanced coverage area, its observing frequency is every 20 seconds, averaged and updated as frequently as every 1 minute. These products provide forecasters with detailed information about storm trends between longer GOES-16 ABI update periods and local radar scans, whose update frequencies are approximately every 5 minutes in North America but typically ten or more minutes in other regions. Diagnosing convective initiation in particular becomes easier with GLM’s added areal coverage and frequency of updates, as we’ll see in the next section.
Value Added to Operational Forecasting » Detection of Convective Initiation
GLM’s 1-minute update frequency and additional coverage improves insight into convective initiation as compared to GOES-16 channels and ground-based radar. Typically forecasters monitor cloud top temperatures on longwave IR, and notice cells which exhibit strong cloud-top cooling rates of about 10ºC to 20ºC per 15 minutes. Radar reflectivity above 35dBZ is another rule of thumb used to diagnose the start of convective activity.
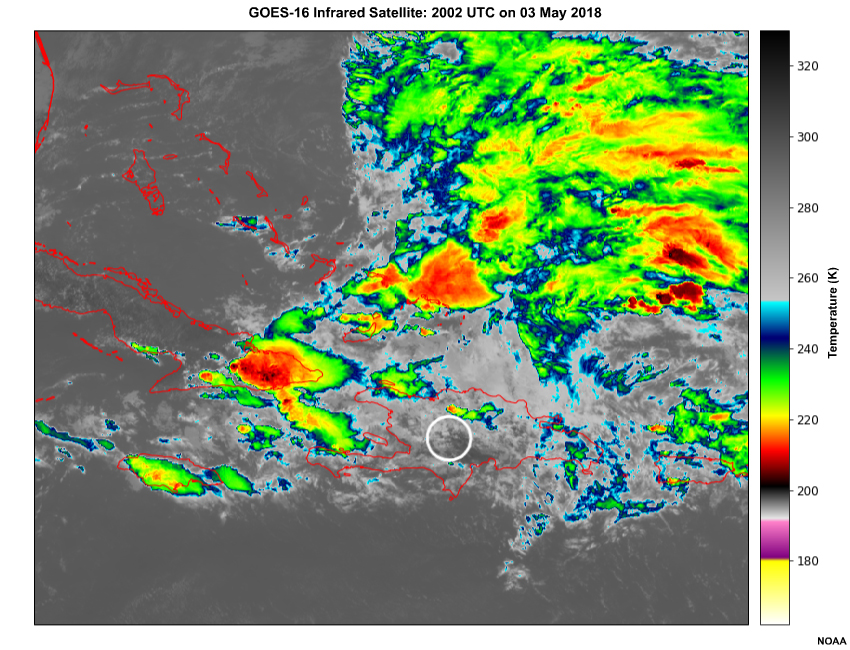
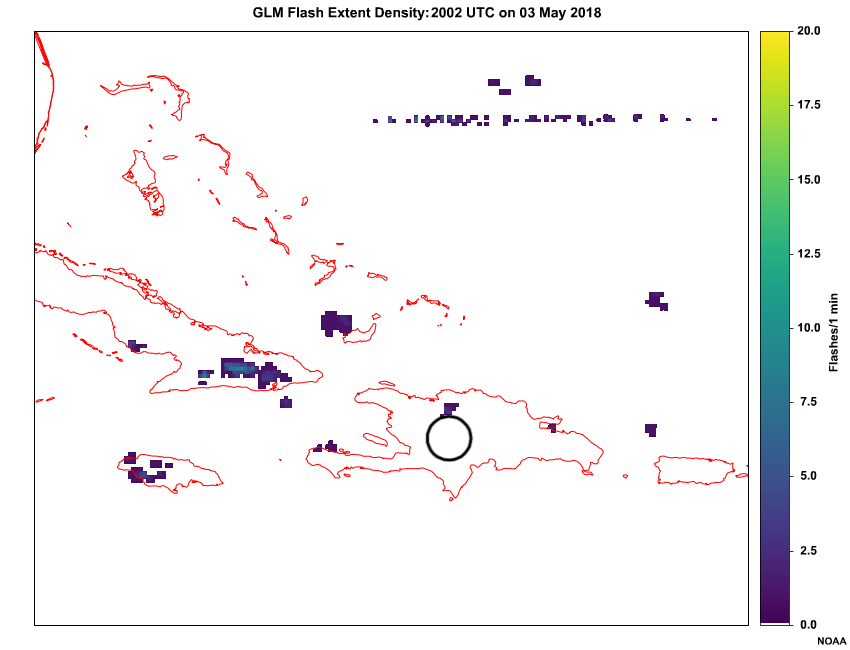
In the example below, IR and FED are plotted over the Caribbean. The local radar was down for repairs at the time.
IR
GLM FED
At the beginning of the loop, we can see one strong cell in the northern portion of the area, with cloud top temperatures nearing -50ºC. At that time, GLM was also reporting moderate FED values for the cell. There are several other areas of cumulus congestus, with cloud top temperatures in the -10ºC to -20ºC range.
A few minutes later, however, we notice flash activity from GLM in the outlined area. At this point, IR imagery still shows relatively warm cloud top temperatures - it isn’t until approximately 2027 UTC that a forecaster might ordinarily diagnose convective initiation and the threat of lightning. In this case, GLM alerted users to convective activity several to tens of minutes before traditional IR diagnosis methods might allow.
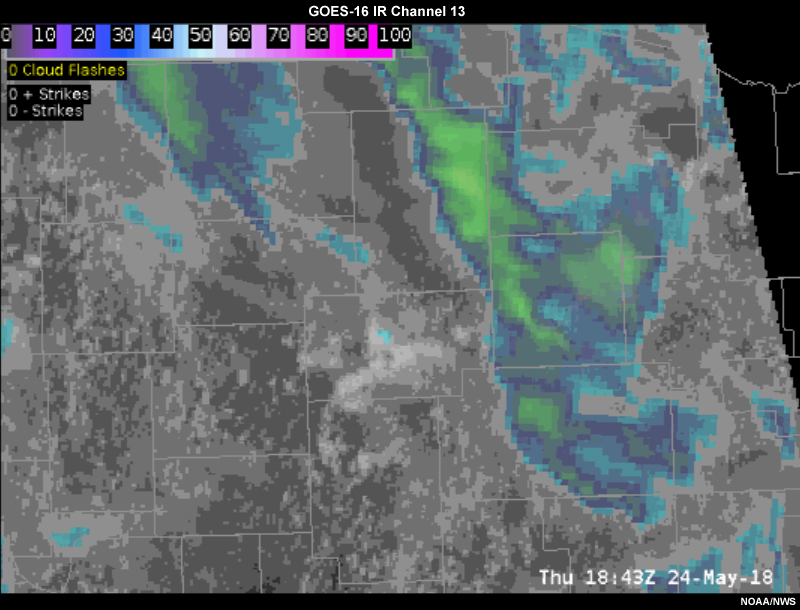
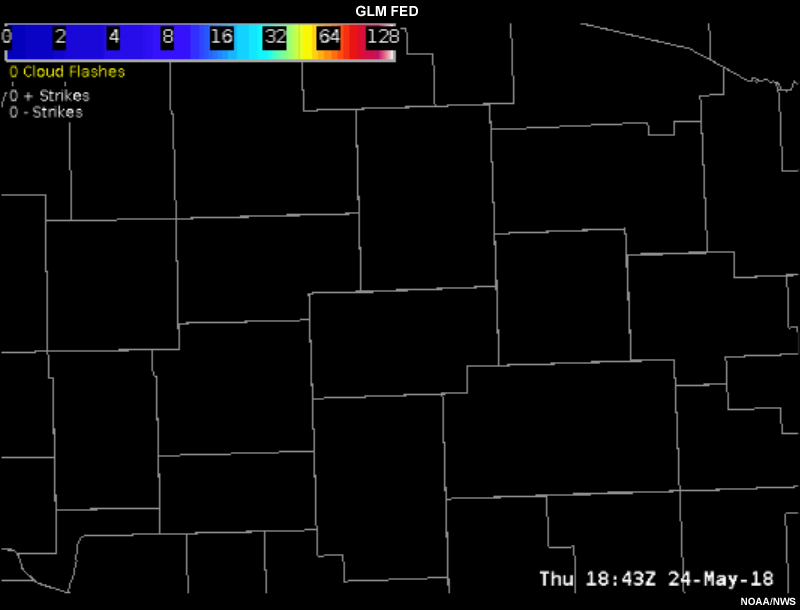
Let’s try another example. View the loops for north-central Wisconsin on May 24 and then answer the questions in the subsequent set of tabs below.
IR
FED
Be sure to click through all the tabs to view and answer the full question set below.
Q1
Question 1 of 4
Approximately when do IR cloud top temperatures and trends first indicate convective initiation?
The correct answer is c.
By about 1910 UTC, cloud top temperatures have decreased to approximately -30ºC and a noticeable dominant cell is emerging in the south-central area of the region.
Question 2
Question 2 of 4
At what time does the GLM flash extent density field first show activity?
The correct answer is b.
GLM flash extent density shows positive values at approximately 1855 UTC, a couple minutes before cloud top temperatures and trends suggest convective initiation and a discrete cell forming.
Question 3
Question 3 of 4
Later in the loop, positive FED values are displayed in the northwest section of the forecast area. At what time does flash activity first occur in that region?
The correct answer is c.
Flash activity occurs in the northwest portion of forecast area at 1922 UTC.
Question 4
Question 4 of 4
At what time do IR temperatures and/or trends first indicate convection in the northwest portion of forecast area?
The correct answer is d.
IR shows cooler cloud top temperatures (approximately -25ºC) starting at 1930 UTC, within a few minutes after the first lightning activity. Furthermore, the noticeable cooling was limited to a few, non-adjacent pixels.
In this case over Wisconsin, GLM provided lightning information to diagnose convective initiation alongside or just a couple minutes earlier than using IR imagery alone. This can confirm what forecasters are already noticing and increase confidence in prioritizing cells for continued monitoring.
Here’s what forecasters on the HWT Spring Experiment forecast desk had to say about using GLM products to monitor these storms in Wisconsin:
“…a noticeable increasing lightning trend with ENTLN data wasn't really noticed until 1905-1910Z as well, so GLM was able to capture the initial electrification of this storm with few minutes extra lead time. On a day like today when monitoring areas of cumulus for the first convective echoes to develop, GLM was especially useful.” 24 May 2018, Blog post: “GLM first identified developing storm in WI”
This is the last question in this series.
Value Added to Operational Forecasting » Storm Intensification
When researchers began examining trends in lightning activity within developing storms, they noticed that some storms with rapid increases in lightning subsequently produced severe impacts. Further analysis has shown that this rapid and significant increase or "jump" in total lightning typically occurs over about 10-20 minutes and is associated with strengthening updrafts. While not all severe thunderstorms demonstrate a lightning jump and not all storms with jumps produce severe weather, the mere presence of a lightning jump indicates the potential for severe weather to develop.
These lightning jumps may occur in newly developing convection or within established, mature storms. An example of a rapid lightning increase within an evolving convective line is shown in the tabs below for a storm system affecting southeastern Pennsylvania and southern New Jersey.
GLM FED
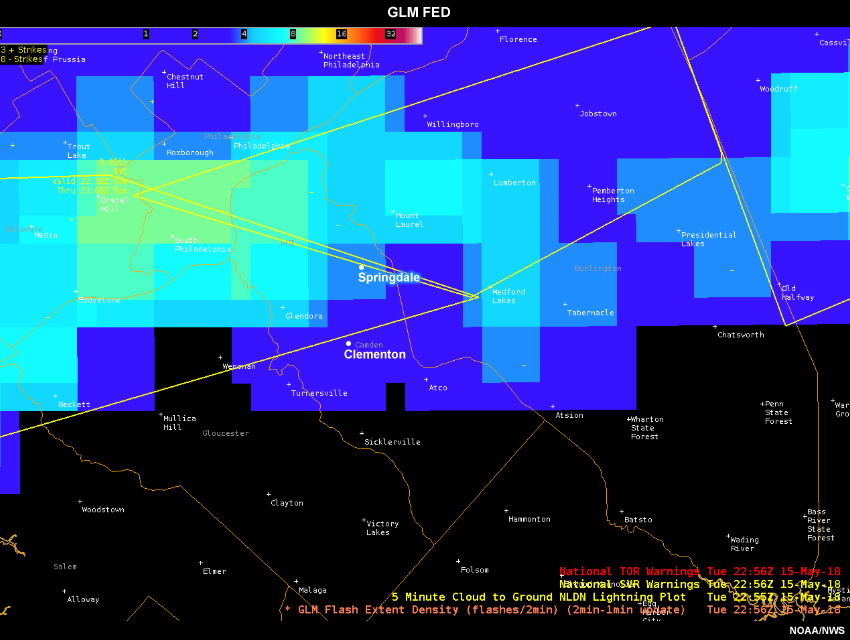
Local Radar
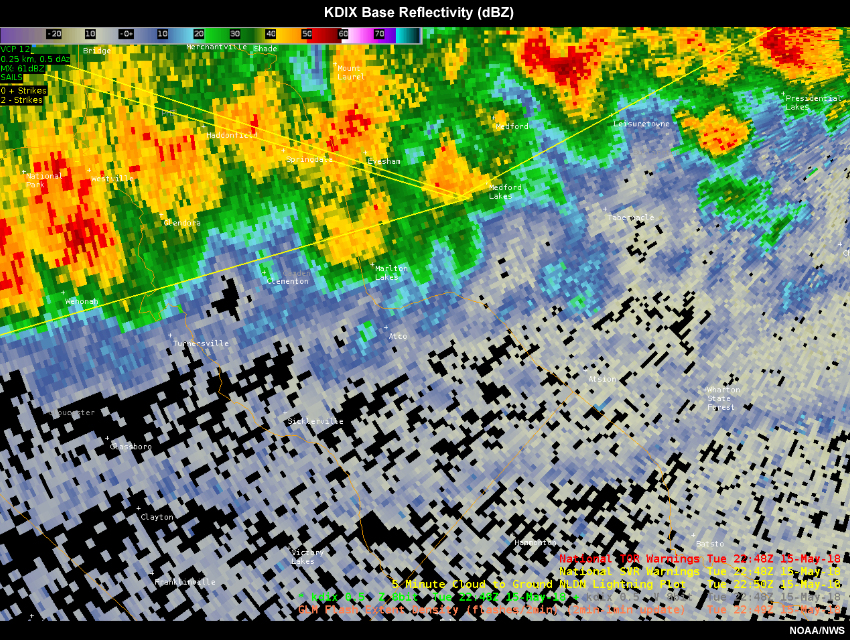
In the first few minutes, FED values are relatively uniform across the convective line and have values around 6 flashes every 2 minutes. By 2258 UTC, a central area of much higher FED values appears with the dominant cell near the center of the region, over Springdale and Clementon in Camden County, New Jersey. Over the following several minutes, the cells all weaken somewhat according to radar, decreasing by about 5-10 dBZ. However, FED continues to show continued strong lightning activity in an even larger, centralized area just south of Clementon. This region of high FED values corresponds with the new cell that develops just afterward and produces 65+ dBZ readings. This example is one of many observed lightning activity increases that occurred with storm cell splits or mergers during the Spring Experiment.
It is important to note that lightning jumps are not necessarily defined by specific values or thresholds. FED values will vary from storm-to-storm, by season, by averaging time of the product, and by day versus night (when flashes are relatively brighter compared to surroundings, and more easily detected). GLM may also produce lower lightning rates than what forecasters are used to seeing from ground-based networks due to grid resolution and how the flashes are classified. It is the trend of a rapid increase in flashes/events that is the more important factor.
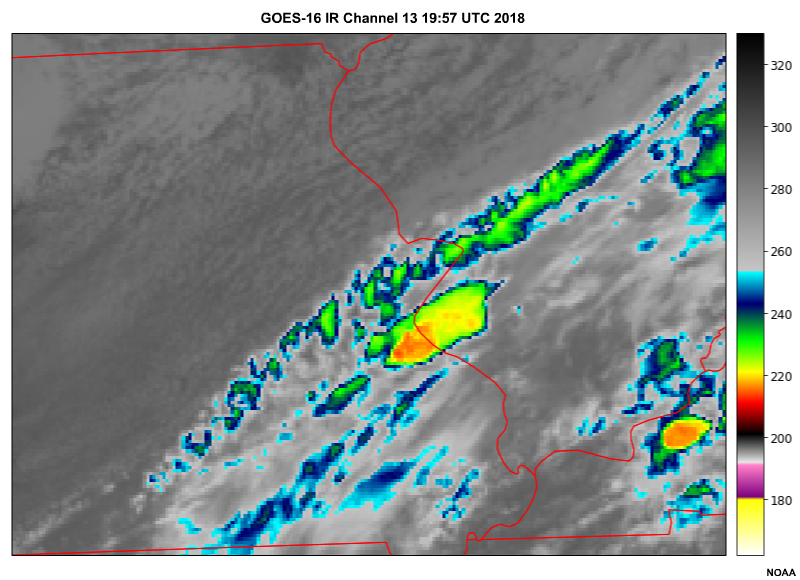
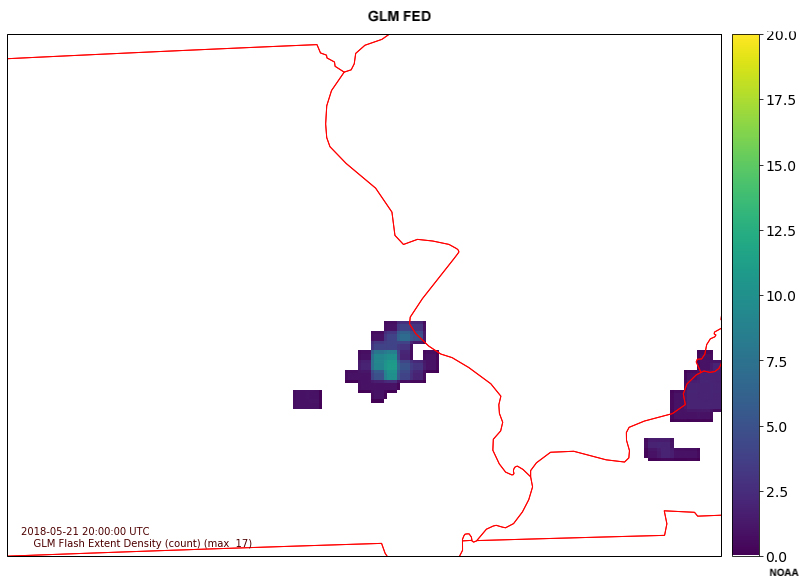
Let’s look at another example of a rapid lightning increase. The tabs below show convective activity near St. Louis, MO in May 2018. Examine the IR, FED and radar loops therein and answer the questions in the subsequent tabs. The radar-cross section location is shown in the 4th tab.
GOES-16 IR
GLM FED
KLSX Radar
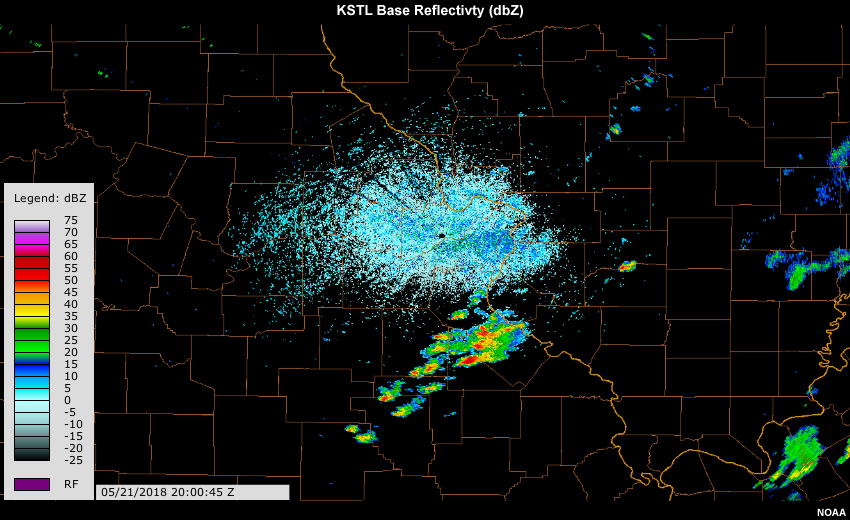
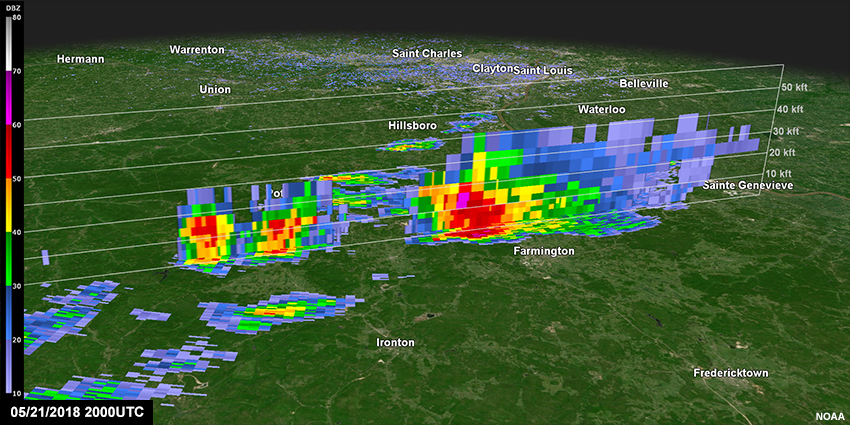
Radar Cross Section Location
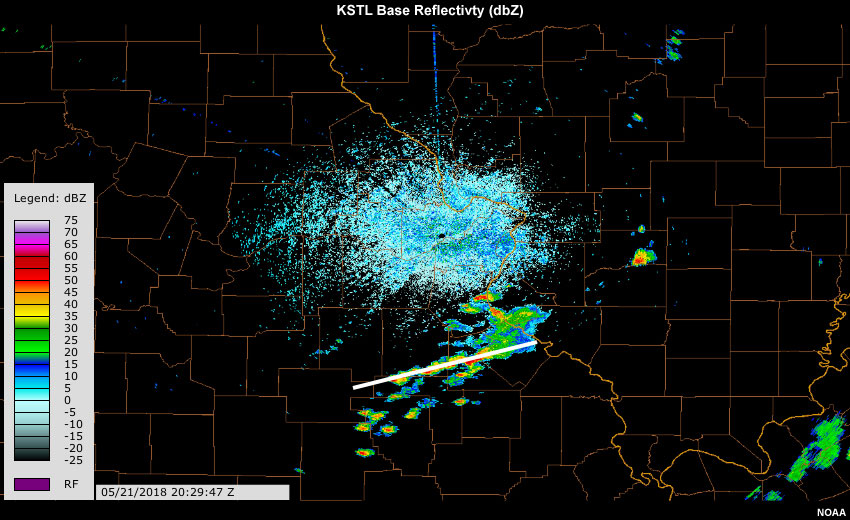
Radar Cross Section
Q1
Question 1 of 3
At approximately what time does a rapid lightning increase begin according to the loop of FED?
At 2012 UTC, when FED values increase to 15 flashes per minute and higher.
Q2
Question 2 of 3
At approximately what time do FED values return to levels below 15 flashes per minute?
The elevated lightning levels end when values return back below 15 flashes per minute, at approximately 2028 UTC.
Q3
Question 3 of 3
When and where would you expect severe surface impacts based on this rapid lightning increase and the supporting loops? What type of severe impacts might you expect?
One would want to monitor the strongest, slow-moving cell south of St. Louis for hail and/or strong winds. While lightning jumps can indicate the potential for severe weather, they do not result in severe impacts all the time, nor do all severe thunderstorms exhibit lightning jumps.
In the strongest, easternmost cell, we can see that echo tops nearing 50,000 ft and a weak echo region are present in the radar cross sections from about 2008 UTC through approximately 2021 UTC. After that, at approximately 2021 through 2020 UTC, the core of 60-70 dBZ reflectivity values is found at lower elevations, suggesting hail and/or very heavy rain is likely to reach the ground. Hail and strong winds appear to be the primary threat, and other observations and variables should be consulted for a final prognosis. In this case, 1” hail was reported at 2023 UTC in the aforementioned cell. After 2028 UTC, we can observe that the storm began to dissipate, consistent with the observed decrease in FED at that time.
This is the end of the current question series. Scroll down the page to view another severe weather event with rapid lightning increases.
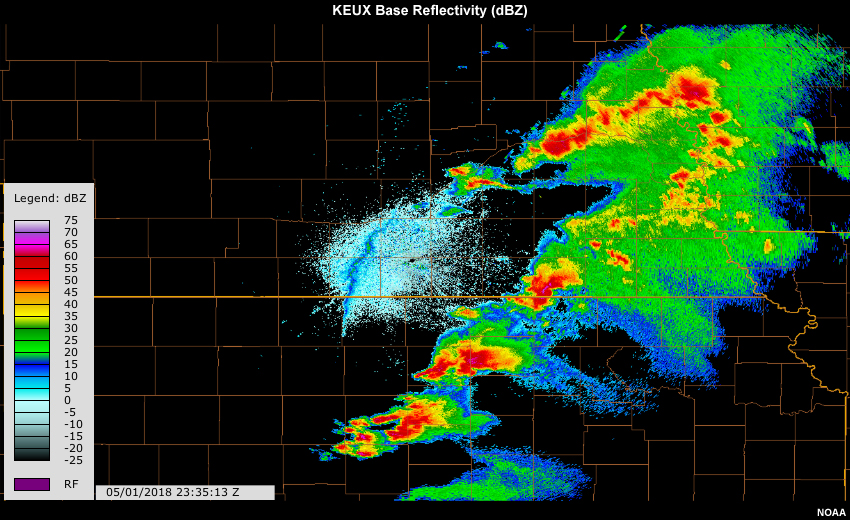
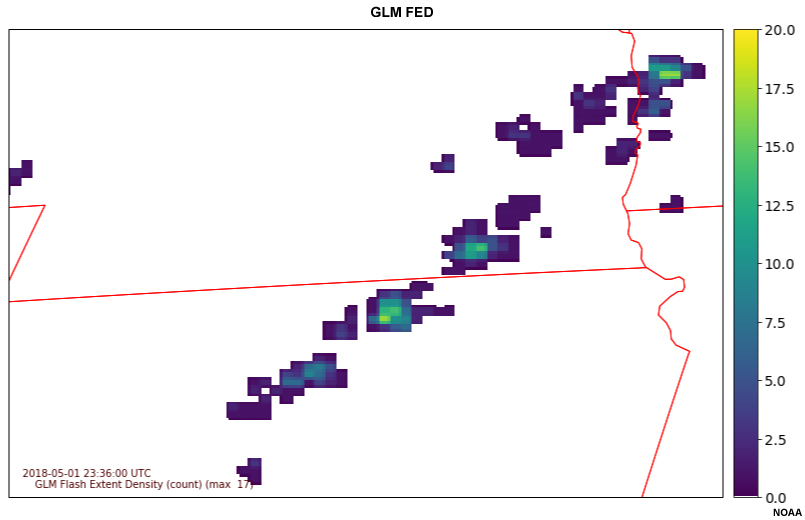
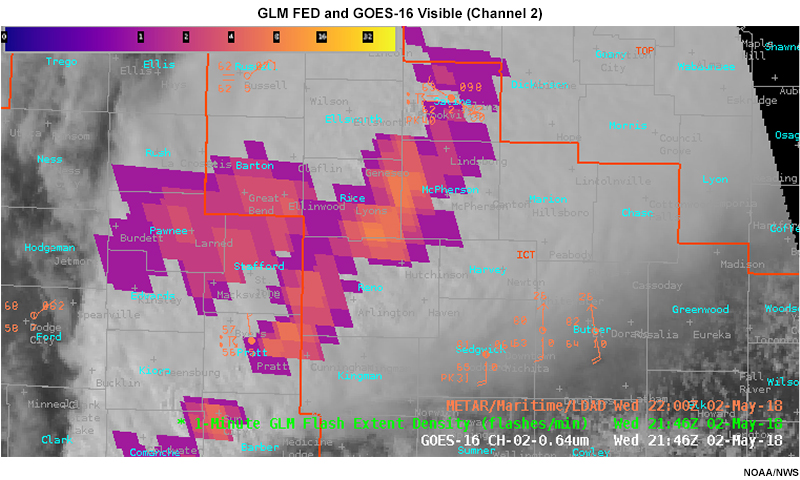
Some additional examples of rapid lightning increases occurred over Nebraska and Kansas during a very active severe weather day in May 2018. Examine the tabs with radar and FED loops below, and then answer the subsequent question set below.
KUEX Radar
GLM FED
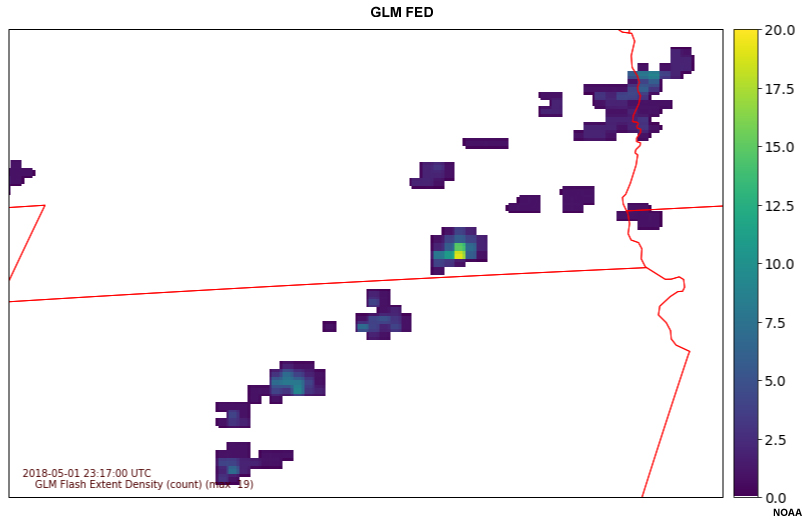
Cell Labels
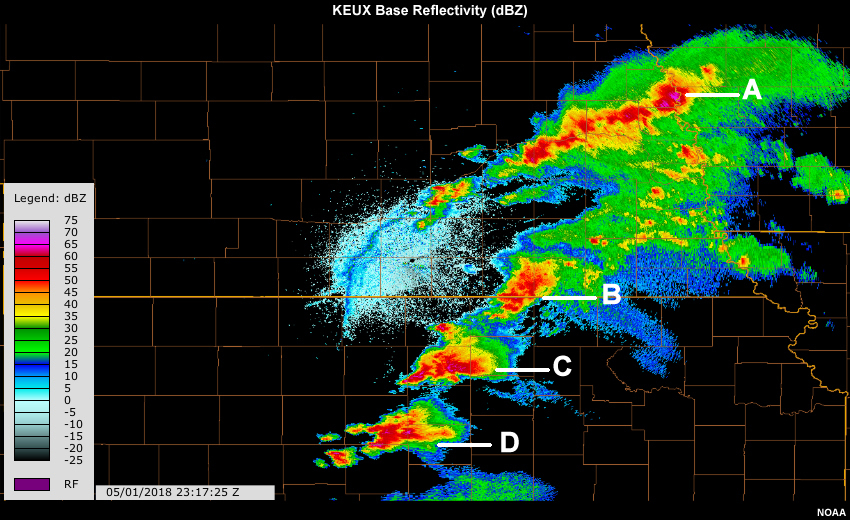
Note the individual thunderstorm names in tab 3 above to help you answer the questions.
Question
Cell A begins to show consistently higher values of FED around 17 - 20 flashes per minute between approximately 2323 UTC and 2031 UTC.
The first instance of damaging surface winds and hail from the cell was reported at 2331 UTC.
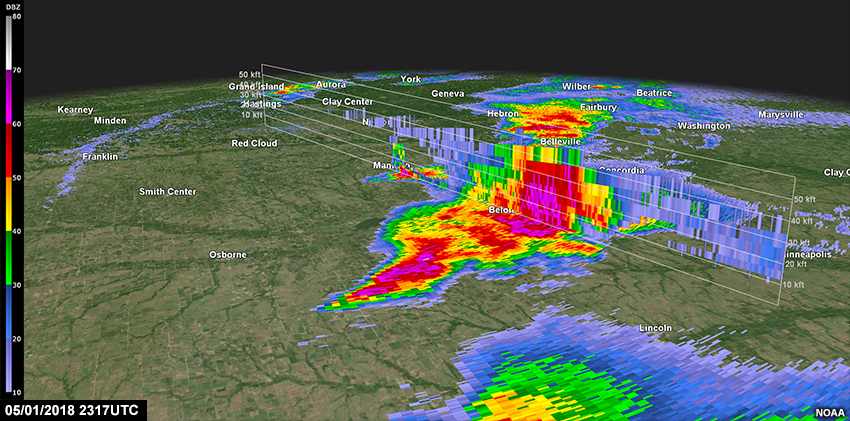
Next, we will look at cell C (just south of Nebraska-Kansas border) in more detail in the loops below. Radar cross sections of cell C are provided in the fourth tab - these begin at the location of the radar and cut across the strongest reflectivity area of the core of the storm at each timestep. An example cross section location is shown in tab 3.
KUEX Radar
GLM FED
Radar Cross Section Location
Radar Cross Section
Answer the questions about cell C using the loops above and tabs below.
Question 1
Question 1 of 2
Choose the statement that best describes the trend in GLM FED values for cell C throughout the loop.
The correct answer is b.
Choice B is correct. Additionally, a broadening of strong lightning activity within the core of the storm begins at about 2350 UTC, when multiple adjacent pixels have FED values of 20 flashes per minute.
Q2
Question 2 of 2
When would you expect severe impacts from cell C based on the lightning trends noted in the previous question?
Based on recent research into lightning jumps, we would note the sharp increase in lightning activity at 2340 and expect this increased activity to last for 10-20 minutes, followed by severe impacts sometime shortly after that. In the case of cell C, we do not see strong lightning activity abate, but instead continue through to the end of the loop at 0025 UTC. Thus, we might expect severe impacts to occur after the initial jump, any time from about 2355 to the end of loop.
If we check the radar cross sections, we can see a weak echo region and core reflectivity values of 50-60 dBZ reaching 40,000 ft at 2317 UTC, the beginning of the timeframe. By approximately 2052 UTC, we can see core reflectivity values of 50-60 dBZ reaching 50,000 ft along with a more pronounced weak echo region, and thereafter some ingestions of a nearby cell to the west and some restructuring.
A 225-meter wide tornado was first reported with this cell at 2359 UTC, and stayed on the ground for an additional 20 minutes, covering 16 kilometers. Multiple reports of large hail accompanied the storm during this time.
In addition to the lightning jump and severe impacts discussed for cell C, you probably also noticed other rapid lightning increases and sustained high levels of FED within cells B and D. Cell B produced a brief tornado and baseball size hail between about 0020 UTC and 0030 UTC May 2, at the end of this loop. Cell D resulted in a long-track, EF-3 tornado shortly later at about 0045 UTC.
It should be noted that some of these same thunderstorms previously produced brief tornado touchdowns and around 1 inch hail without any marked lightning jump/increase - remember that not every thunderstorm exhibits a lightning jump before producing severe effects, and not every storm that displays a lightning jump results in severe impacts. Nonetheless, a lightning jump noted on FED or other GLM gridded products can serve as important corroborating evidence in a forecaster’s toolkit, providing extra confidence to issue timelier warnings.
Value Added to Operational Forecasting » Areal Extent & Decision Support
GLM gridded products are also helping forecasters visualize the areal extent of lightning activity overall, and are adding to decision support services.
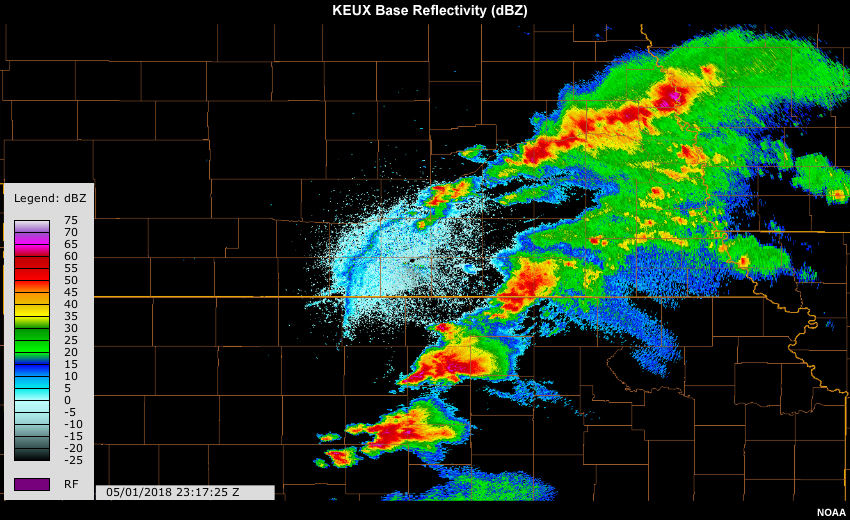
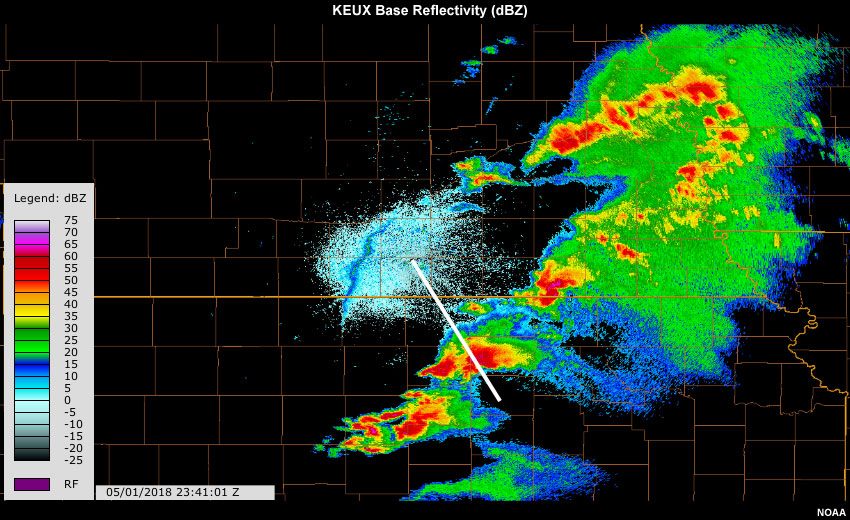
For example, GLM illustrates the extent of lightning within the trailing stratiform regions quite well. In the tabs below, we can see just how far westward the lightning extends. In this case from south-central Kansas, lightning extends approximately 95 km westward from the back edge of the convective line.
GLM FED
Local Base Reflectivity (dBZ)
This information becomes more important when considering that in-cloud and cloud-to-cloud lightning often precedes the first cloud-to-ground strikes by several minutes. Forecasters have observed GLM detecting lightning activity up to 20 minutes before any CG strikes, and were able to use this information to alert local officials of lightning threats to outdoor events and aviation services.
Forecasters in the HWT Spring Experiment had this to say about GLM and aviation services overall:
“One thing that GLM data is going to change for aviation forecasters at the Aviation Weather Center, Central Weather Service Units, etc. is Convective SIGMET (C-SIG) and CWA size…As GLM data becomes available to aviation forecasters, I think it is going to open some eyes as to just how much areal extent to lightning there can be in individual thunderstorms & clusters/lines/line segments.” - 23 May 2018 HWT Spring Experiment blog post, “Aviation t-storm forecasting/warning: GLM Avg Flash Area vs CWA and SIGMET sizes”
Let’s take a look at another example where GLM can be especially effective - anvil lightning occurring well ahead of the main storm core. The loop below shows a zoomed-in view of a supercell anvil. Local Sioux Falls composite radar imagery shows the eastern portion of the anvil, with maximum reflectivity reaching about 30 dBZ. Yellow Xs show individual GLM flashes while GLM event density is gridded and overlaid. NLDN cloud-to-ground strikes are plotted in salmon.
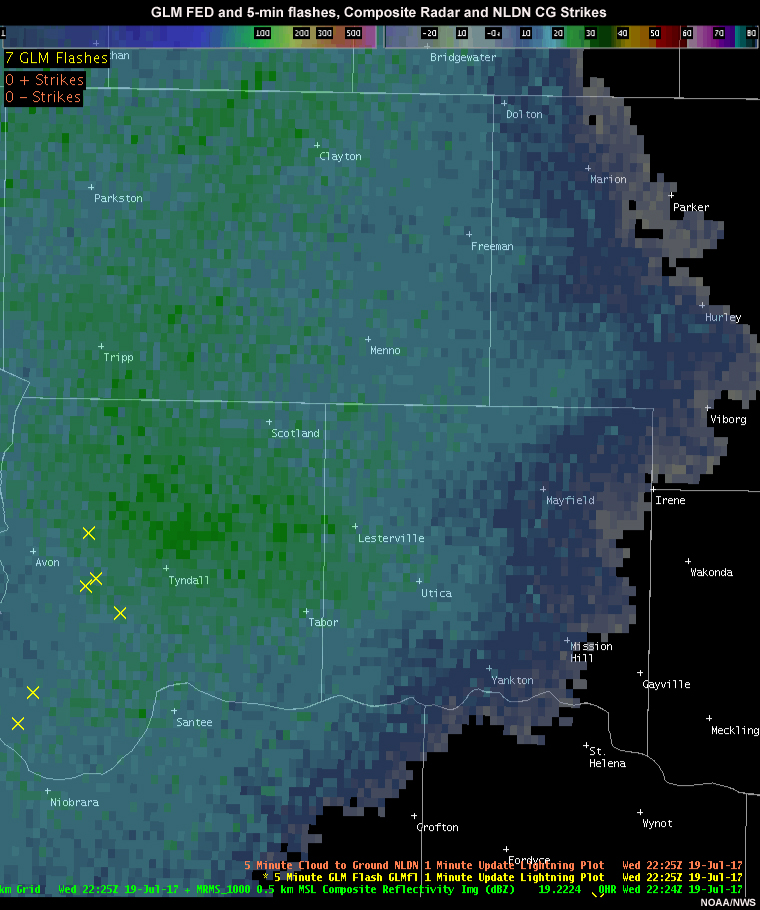
We can see that GLM detected several flashes and events per minute, and preceded the first cloud-to-ground strikes detected by NLDN by a few minutes. Notably, these lightning strikes extended up to 140 miles away from the core of precipitation with this storm, as shown by the reflectivity and white dot (location of CG strike) below.
Helpful Hints and Future Work
Helpful Hints and Future Work » Parallax Issues
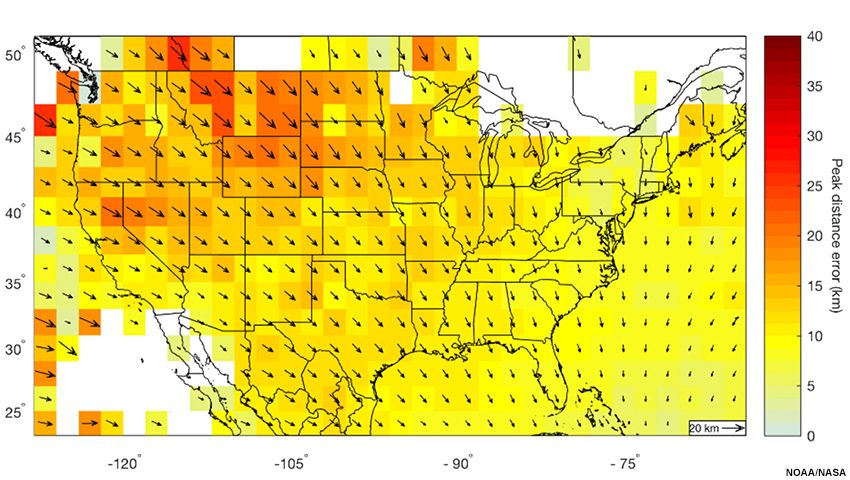
GLM inherently contains parallax errors, similar to those of the GOES-16 ABI instrument. The image below shows the direction vector and peak distance offset that must be applied for GLM to match information from ground-based networks.
We can see this effect in action in the animation by toggling back and forth between tabs below. Ground-based ENTLN flash activity is plotted in the first tab while GLM FED is plotted in the second. The pixels of high FED values are clearly displaced northward and slightly westward by at least several kilometers compared to the area of ENTLN activity.
ENTLN
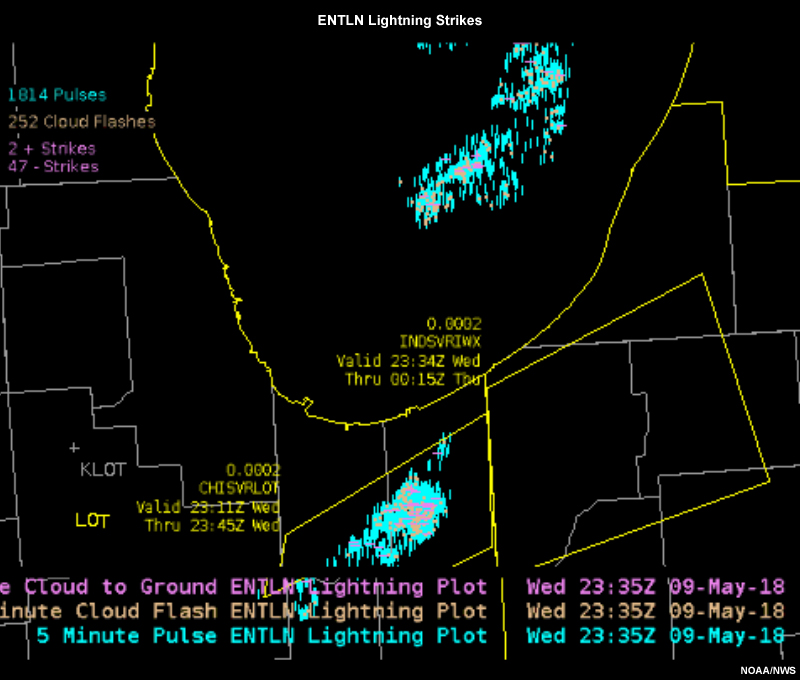
GLM FED

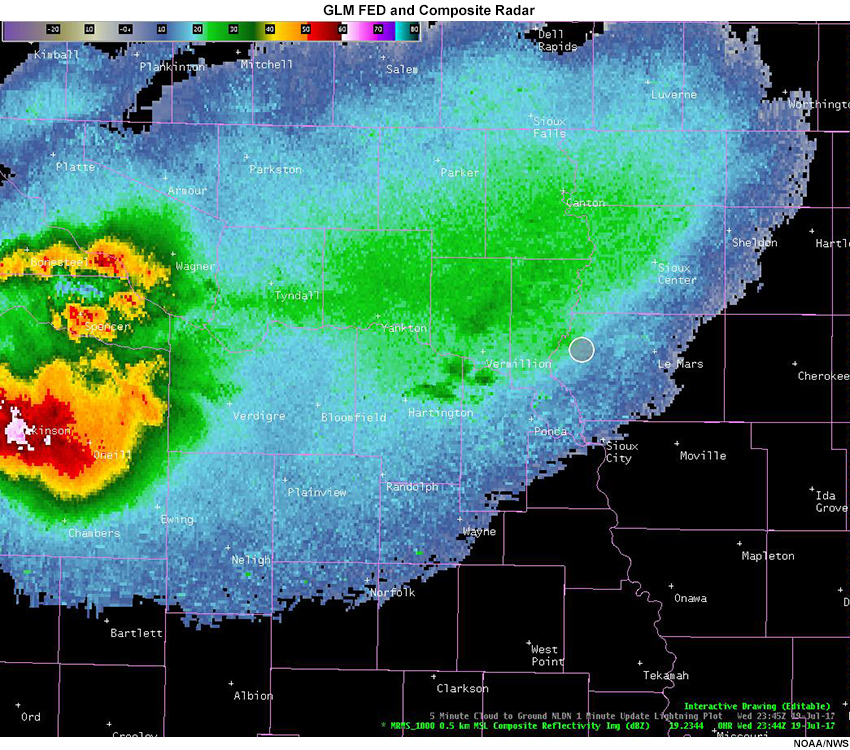
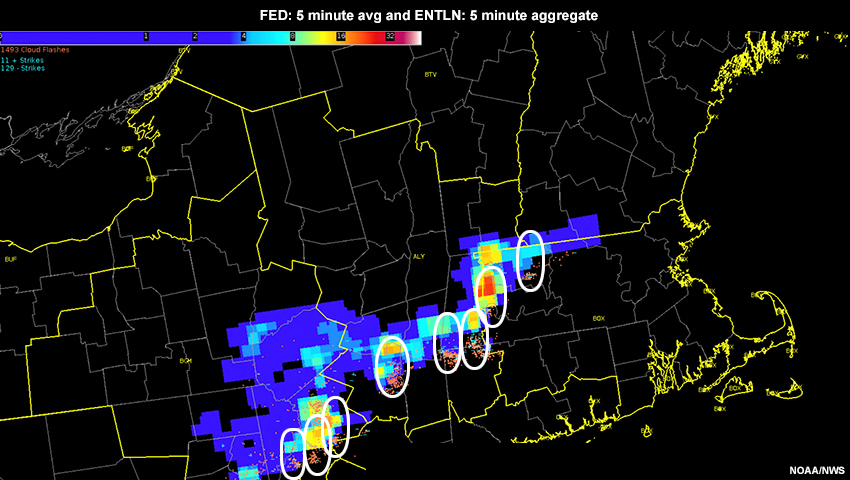
Let’s look at another example. In this eastern portion of the US, we’d expect the GLM FED pixels to be displaced slightly north of the true lightning flash positions. One can easily see that the most of the GLM FED field lies north and or slightly west of the ENTLN strike points displayed in orange. Several pairs of lightning activity within thunderstorm cores are very obviously displaced in the north-south direction, as outlined in white.
Ideally, forecasters are already using GLM and ENTLN and/or NLDN information together as mentioned earlier. Overlaying both GLM information with ground-based information often makes the comparison easier. Becoming familiar with the general distance error and its direction over your forecast area of responsibility will help you quickly recognize when lightning is simply occurring outside of the main convective area for a meteorological reason, whether you are seeing parallax effects, or a combination thereof. In both cases, a forecaster must communicate the lightning threat and its approximate location overall. Using GLM in conjunction with ground-based networks can provide more detailed and frequently earlier threat information.
Helpful Hints and Future Work » Averaging Times
GLM gridded products can be calculated using one of several averaging times. The most common are 1-minute averages and running 5-minute averages that are updated every minute.
The loop below begins with the 1-minute FED product and then at 2212 UTC switches to the 5-minute averages updated every minute.
Because the averaging time is longer, the values of flash extent density are higher in the 5-minute product. Spring Experiment forecasters also generally reported preferring the 5-minute product because trends showed up more consistently frame-to-frame, making it easier to diagnose lightning jumps and the areal extent of lightning activity. Alternatively, while the 1-minute product appears more ‘jumpy’, it can be faster in helping forecasters first spot a trend and is useful for viewing high-energy flashes and short bursts of high-density lightning activity.
Helpful Hints and Future Work » Products Coming Soon
We focused primarily on FED in this lesson, but two other common gridded products are currently being vetted for operational use in the US National Weather Service: Average Flash Area (AFA) and Total Optical Energy (TOE). While these products have been in testing only for the last two years, forecasters working through the HWT are reporting that they are useful on their own and especially to confirm thoughts regarding FED and other satellite and/or radar observations.
GLM FED
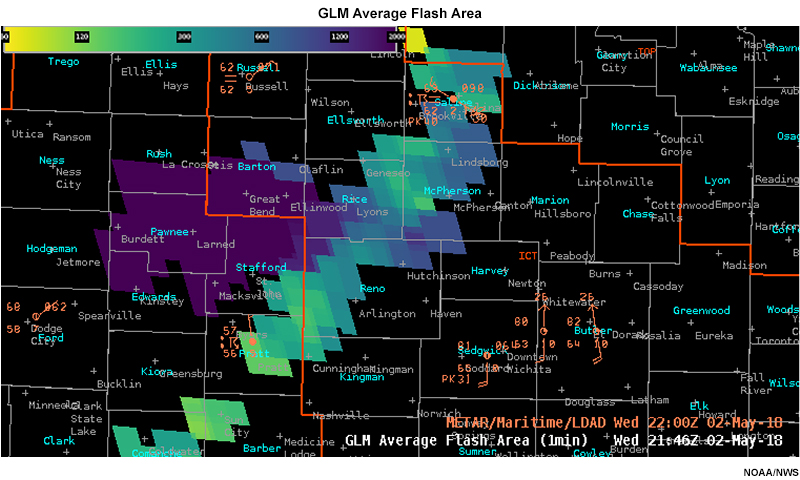
GLM AFA
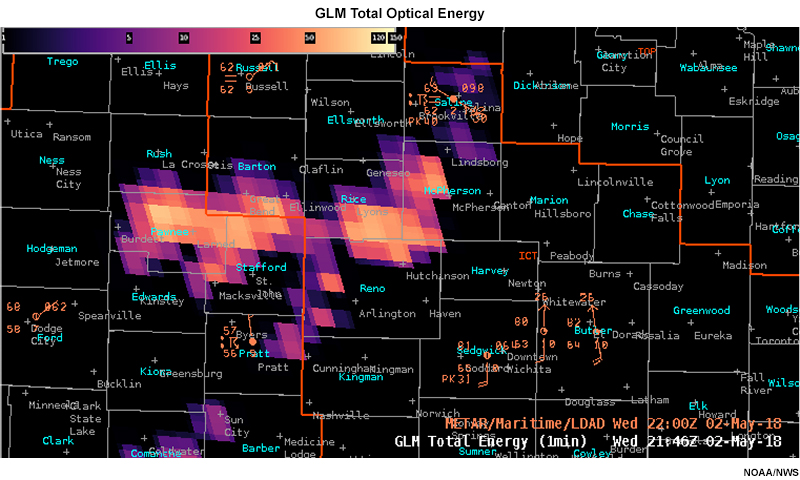
GLM TOE
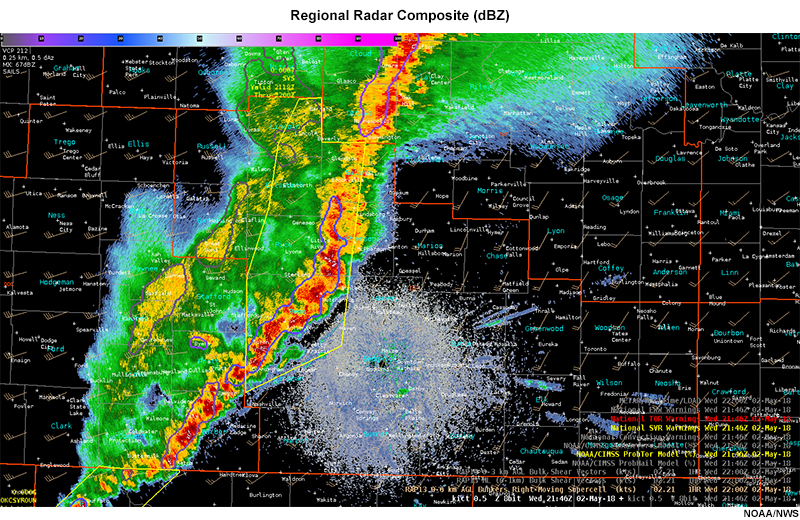
Regional Reflectivity
Here are the fundamental calculations involved in AFA and TOE, and the key ways that they will add value to gridded density or event products.
AFA
- AFA is the average area of all GLM flashes spatially coincident with each 2x2 km grid cell.
- The AFA color map accentuates small flashes (yellow and green) to highlight newly developing or rapidly intensifying convection. AFA in the tab above shows small flashes, mostly less than 300 km2, within the leading convective line.
- AFA indicates the occurrence of large and/or long flashes (purple and indigo) and helps differentiate stratiform flashes from embedded, newly-developing convection. Above, we can see a large area of indigo shading, indicating flashes covering over 1200 km2.
- AFA trends are indicative of storm life cycles, helping forecasters diagnose frequent small flashes associated with the most intense convection and larger flashes common as storms weaken.
TOE
- TOE is the sum of all optical energy that GLM observes within each grid cell, and has units of femtoJoules (fJ: 10-15 J).
- TOE directly depicts optical lightning observations, providing the most intuitive GLM portrayal - akin to watching a light bulb brighten or dim as the storms grow or decay, respectively.
- TOE helps characterize the cloud scene, especially at night where it can help distinguish between deep convection and dimmer, low-level clouds it often illuminates. In the tab above, we can see that TOE is highest near the apex of the bow echo and in the higher reflectivity area within the trailing stratiform region.
- TOE indicates actual lightning channel locations within stratiform regions, allowing forecasters to identify where ground strikes are more likely within broad anvils or decaying convective complexes. Above we can see an east-west oriented channel of high energy within the larger stratiform region.
Summary
GLM is the first operational lightning detector in geostationary orbit, and its first operational gridded product in the US National Weather Service is flash extent density (FED). FED provides a measure of the quantity and extent of GLM flashes/events. Its units are flashes per number of minutes in an averaging period, usually 1 minute or 5 minutes. FED can help forecasters identify convective initiation, areal extent of lightning, the strongest storm cores, and potential severe impacts.
In this lesson we saw several examples where GLM FED added value to the traditional convective forecasting tools of radar and GOES channel information. FED was useful in diagnosing convective initiation several minutes before local radar reflectivity values and/or infrared cloud top temperatures suggested it. It also highlighted storm cells with rapid lightning increases, or lightning jumps, several to tens of minutes before they produced damaging effects of large hail, tornadoes and straight-line winds. FED shows the sometimes surprisingly large areal extent of anvil lightning, and can be used to provide situational awareness for public events and aviation services.
We also examined some caveats of GLM gridded products - namely, parallax issues in which the gridded data is displaced several to tens of kilometers away from ground-based measurements.
Finally, we examined future products: Average Flash Area (AFA) and Total Optical Energy (TOE). AFA can help forecasters distinguish intensifying lightning among developing cells versus decaying, more stratiform lightning. TOE helps characterize the cloudscape, especially at night where low clouds are often lit by stronger convection, and it shows individual lightning channels.
Contributors
COMET Sponsors
MetEd and the COMET® Program are a part of the University Corporation for Atmospheric Research's (UCAR's) Community Programs (UCP) and are sponsored by
- NOAA's National Weather Service (NWS)
with additional funding by: - Bureau of Meteorology of Australia (BoM)
- Bureau of Reclamation, United States Department of the Interior
- European Organisation for the Exploitation of Meteorological Satellites (EUMETSAT)
- Meteorological Service of Canada (MSC)
- NOAA's National Environmental Satellite, Data and Information Service (NESDIS)
- NOAA's National Geodetic Survey (NGS)
- National Science Foundation (NSF)
- Naval Meteorology and Oceanography Command (NMOC)
- U.S. Army Corps of Engineers (USACE)
To learn more about us, please visit the COMET website.
Project Contributors
Project Lead & Instructional Design
- Andrea Smith - The COMET Program
Science Advisors
- Steve Goodman - NOAA NESDIS
- Michael Bowlan - NOAA Storm Prediction Center
- Patrick Dills - The COMET Program
Graphics/Animations
- Steve Deyo - The COMET Program
Data Services and Visualization
- Justin Richling - The COMET Program
Multimedia Authoring/Interface Design
- Gary Pacheco - The COMET Program
Program Oversight
- Amy Stevermer - The COMET Program
COMET Staff, October 2018
Director's Office
- Dr. Elizabeth Mulvihill Page, Director
- Tim Alberta, Assistant Director Operations and IT
- Paul Kucera, Assistant Director International Programs
Business Administration
- Lorrie Alberta, Administrator
- Auliya McCauley-Hartner, Administrative Assistant
- Tara Torres, Program Coordinator
IT Services
- Bob Bubon, Systems Administrator
- Joshua Hepp, Student Assistant
- Joey Rener, Software Engineer
- Malte Winkler, Software Engineer
Instructional Services
- Dr. Alan Bol, Scientist/Instructional Designer
- Tony Mancus, Instructional Designer
- Sarah Ross-Lazarov, Instructional Designer
- Tsvetomir Ross-Lazarov, Instructional Designer
International Programs
- Rosario Alfaro Ocampo, Translator/Meteorologist
- David Russi, Translations Coordinator
- Martin Steinson, Project Manager
Production and Media Services
- Steve Deyo, Graphic and 3D Designer
- Dolores Kiessling, Software Engineer
- Gary Pacheco, Web Designer and Developer
- Sylvia Quesada, Production Assistant
Science Group
- Dr. William Bua, Meteorologist
- Patrick Dills, Meteorologist
- Bryan Guarente, Instructional Designer/Meteorologist
- Matthew Kelsch, Hydrometeorologist
- Erin Regan, Student Assistant
- Andrea Smith, Meteorologist
- Amy Stevermer, Meteorologist
- Vanessa Vincente, Meteorologist