Introduction
Ensemble Prediction System (EPS) guidance allows forecasters to provide probabilistic and forecast uncertainty information to various customers. Typically, an EPS produces more data than can reasonably be integrated into most operational forecasting settings. Therefore, EPS products have been developed to represent the distribution of the different runs ("members") based on common statistics.
Question
In what ways can probabilistic forecast guidance positively influence your forecast process? Choose all that apply.
The correct answers are a), c), and d).
Incorporating probabilistic guidance into your forecast process is an advantage not only for deciding whether watch and warning criteria will be met, but also for deciding if user-specific thresholds are likely to be exceeded, such as the temperature at which certain aircraft can no longer operate or the temperature at which asphalt roads will rupture. Decision-makers rely on weather information like this every day to determine the appropriate precautions to take, develop contingency plans, and adequately prepare the community in advance of a weather event and its potential impacts.
In this lesson, you will assume the role of a forecaster in the Deutscher Wetterdienst (DWD), a German Meteorological Office. You will investigate forecast guidance for a potential winter weather event across Germany on Saturday, January 7. You will assess deterministic and probabilistic forecast guidance and regional observations, as well as communicate this forecast information to your fellow forecasters at shift changes.
Your office often receives phone calls from various agencies responsible for clearing the roads of snow, and they typically need information about event timing, spatial extent, temperatures, and amount of expected snowfall. You will speak with a local decision-maker about what to expect during the weekend based on their needs.
During the first few days of the new year (2017), the country was affected by a cold spell resulting in 850 hPa temperatures reaching between -8°C to -12°C (shown in the loop below), and surface temperatures near 0°C.
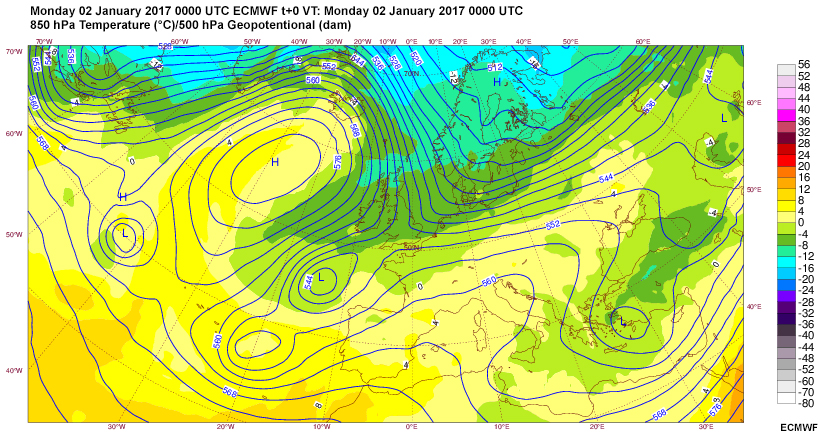
A loop of 850 hPa temperature and 500 hPa geopotential heights valid at 0000 UTC from January 2 through January 4, 2017.
In the next section, you will look at the forecast guidance from January 4, approximately three days before the main precipitation event across Germany.
Day 3 Forecast
The forecast headlines read “Below Freezing Through Weekend”. It is 13 UTC on Wednesday, January 4 and a winter precipitation event is forecast for the weekend over eastern France, Belgium, Netherlands, Luxembourg, and Germany. DWD is forecasting snow over much of Germany as a system moves in from the northwest. Much of central Europe is expecting colder than normal temperatures as a large, nearly-meridional ridge sets up west of the United Kingdom, spilling Arctic air into Central and Eastern Europe. The surface low centered initially in the southeast Baltic Sea will move into the Baltic states and further south toward the weekend.
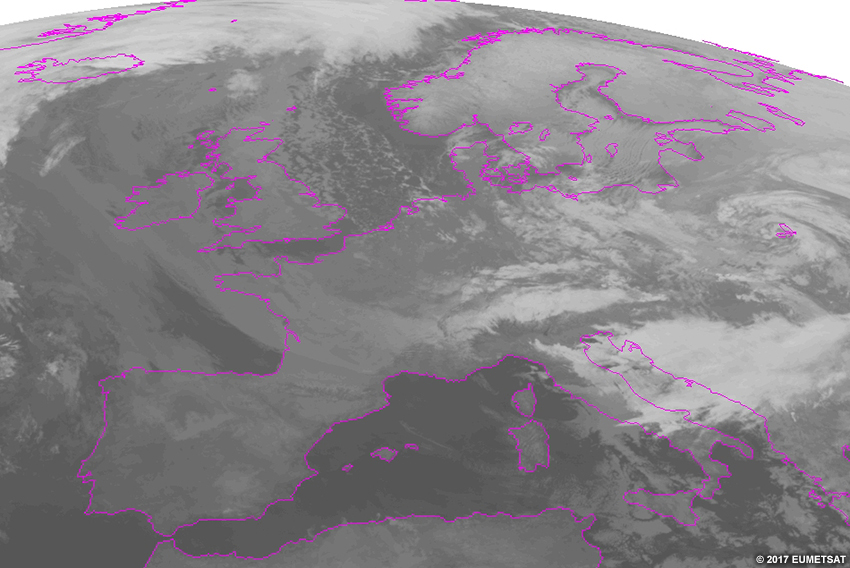
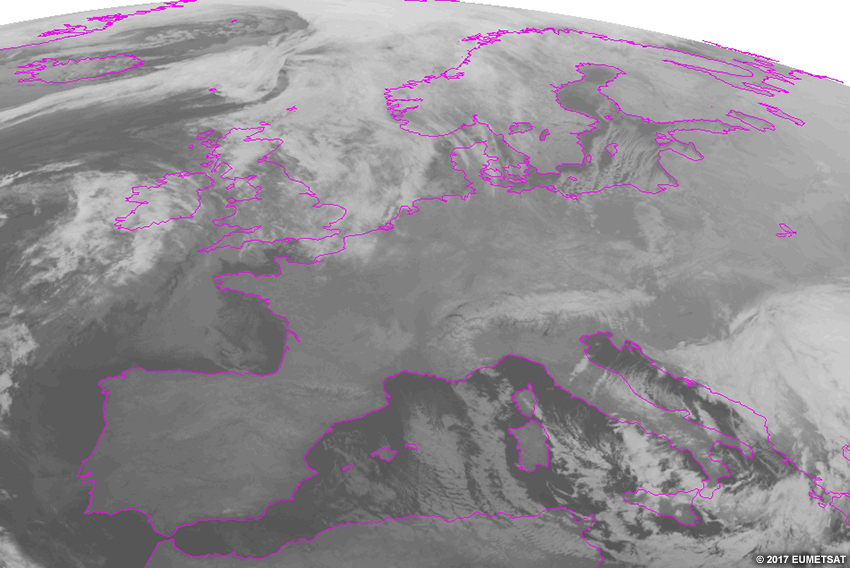
IR Satellite
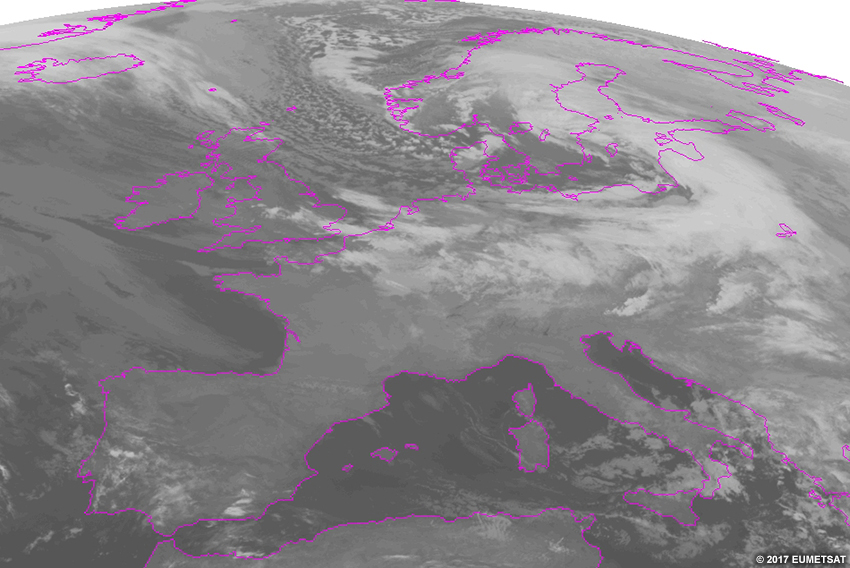
IR satellite loop from 00-12 UTC on January 4, 2017.
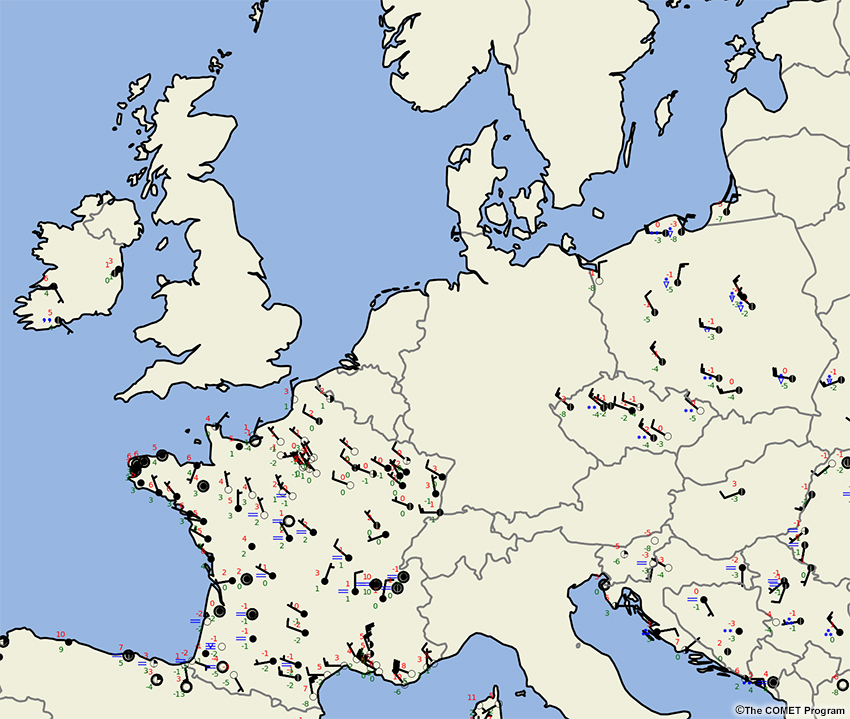
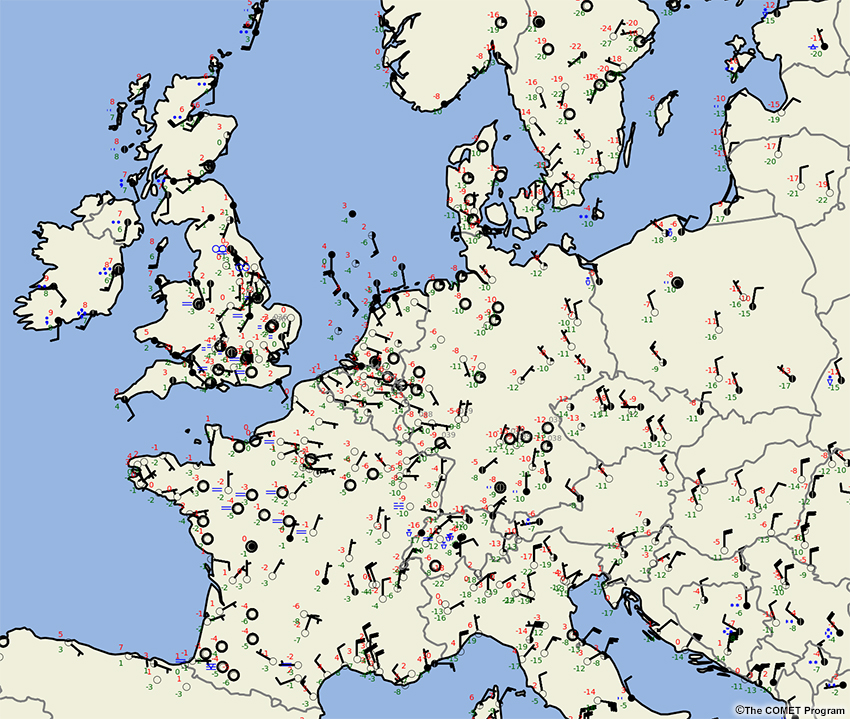
Surface Observations (Europe)
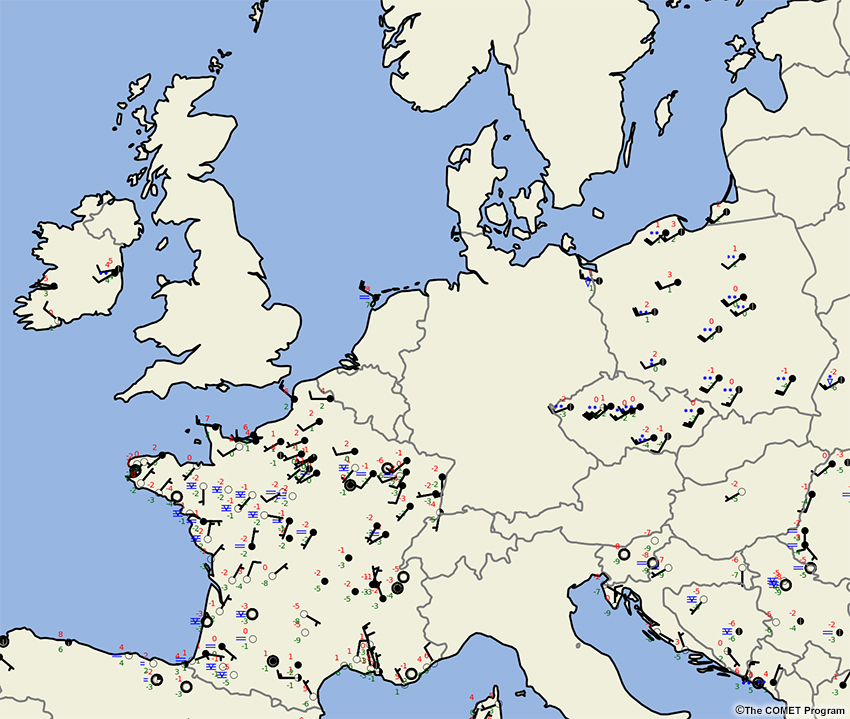
A loop of surface observations over Europe from 00-12 UTC on January 4, 2017.
The previous forecaster left you with this information about the January 7 (day 3) outlook, which they stressed contained the greatest uncertainty in temperature and precipitation type over the next week:
- Temperatures will remain dangerously cold in Poland and the mountains of Germany over the next day, possibly reaching the lowest temperature Germany has experienced in the last 7 years (-25˚C).
- Precipitation is expected across Germany. Southern and eastern portions of the forecast area are consistently expecting snow, beginning around 00 UTC on January 7 and ending around 06 UTC on January 8 for locations such as Stuttgart and Munich. Precipitation totals (in liquid equivalent) are estimated around 3-8 mm for Stuttgart and 6-12 mm for Munich.
- Surface temperatures will remain close to 0°C on January 7 in northwest Germany as the next system moves into the area.
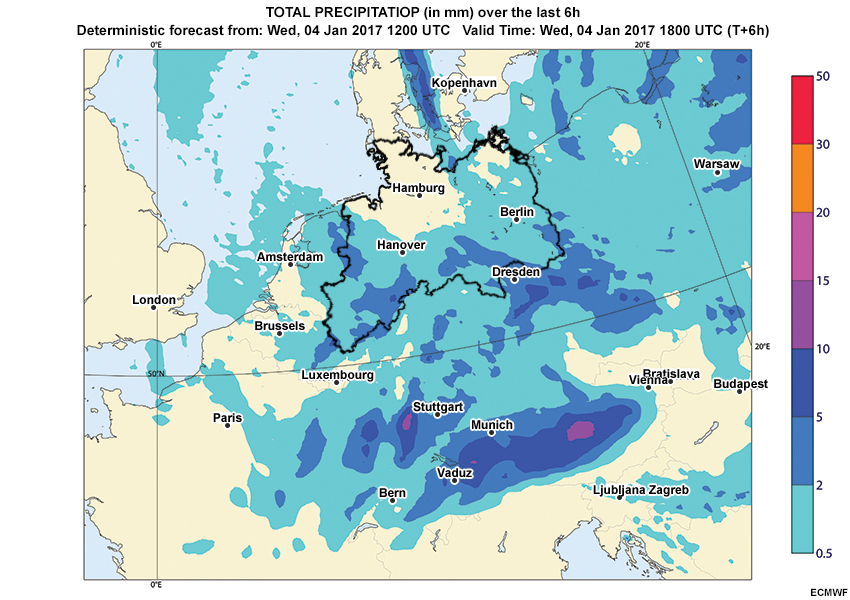
Your area of responsibility includes many of the states in northern Germany, as shown below. During your shift, you decide to first look at the deterministic forecast guidance for a general overview of the situation forecast for January 7-8.
Question 1
Question 1 of 3
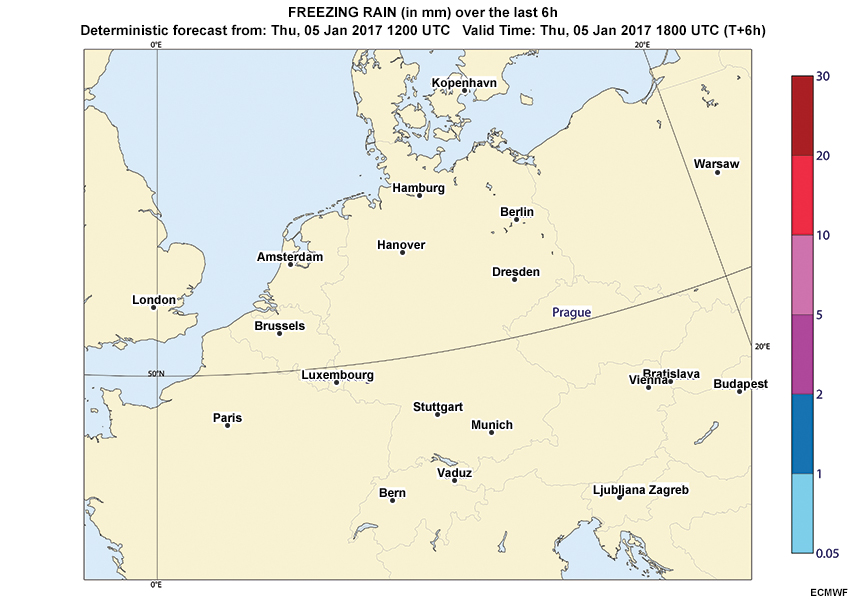
Based on the deterministic QPF, when will measurable precipitation begin (>0.5 mm) and end (<0.5 mm) in the cities below?
Hanover
The correct answers are highlighted above.
The area of precipitation is expected to be in a northeast to southwest orientation, and move to the south and east. Precipitation will begin between the morning and early afternoon (06-12 UTC) on January 7 for cities in northwest Germany (e.g. Hanover), whereas it may begin later in the afternoon (12-18 UTC) for cities in northeast Germany (e.g. Berlin). Precipitation will end in the evening and overnight on January 7 for Hanover, while it may end later into the morning on January 8 in Berlin.
Question 2
Question 2 of 3
Based on the deterministic QPF and using the precipitation legend, what is the range in total precipitation (liquid equivalent, in mm) for the cities below during the precipitation period you previously identified? (Note: The period is based on the earliest start time and latest end time.)
Hanover
The correct answers are highlighted above.
The minimum accumulation is calculated by adding the lowest precipitation bin values throughout the precipitation period. The maximum accumulation is calculated by adding the highest precipitation bin values throughout the precipitation period. Total precipitation is likely to range from 1-4 mm in Hanover and 3-7 mm in Berlin. Northeast areas of Germany, including Berlin, may receive more total precipitation than the northwest areas, including Hanover.
Question 3
Question 3 of 3
Based on the deterministic guidance and forecasting briefing summary above, how would you summarize the forecast situation in terms of precipitation amount and type across northern Germany for the next forecaster on shift?
A useful summary might look similar to this one: “I am concerned about the precipitation event across northern Germany this weekend. Precipitation is forecast to begin sometime on January 7th and end overnight into the 8th. The deterministic model suggests less than 5 mm of precipitation in Hanover, and slightly higher amounts in Berlin. But with temperatures near 0°C on the 7th as the next system comes ashore, we need to keep an eye on precipitation type."
Your summary may have provided a general overview of the forecast precipitation timing, amounts, and challenges in expected precipitation type for January 7 across northern Germany. Also, you may have communicated concerns for potential surface impacts. These details will help give the next forecaster on shift an idea of the forecast challenges and what factors to monitor closely as the forecast progresses.
The next forecaster on shift considers your concerns for northern Germany, and will continue to monitor the forecast overnight for the weekend precipitation event.
Day 2 Forecast
IR Satellite
IR satellite loop from 00-12 UTC on January 5, 2017.
Surface Observations
A loop of surface observations over Europe from 00-12 UTC on January 5, 2017.
It is 18 UTC on Thursday, January 5, and you are about to speak to the forecaster who worked the afternoon shift on the current forecast weather conditions. Here is what the afternoon forecaster had to say:
“I am concerned about the type of precipitation we may expect on January 7 in Hanover. The forecast guidance suggests the potential for snow, freezing rain, and ice pellets across the city. Cold air is still spilling in from the northeast. It looks like the anticyclonic branch of the warm conveyor belt off the coast is still going to impact the area, but there’s uncertainty in the temperature profiles. It appears that the most critical period of the precipitation event, when we expect the greatest surface impacts, is during the evening on January 7 around 1800 UTC.”
Given the potential for mixed precipitation in Hanover, you decide to first look at how the deterministic forecast guidance may have changed since yesterday’s run, as well as the outlook for freezing rain and snow in the city.
Deterministic Snow QPF
Deterministic Freezing Rain QPF
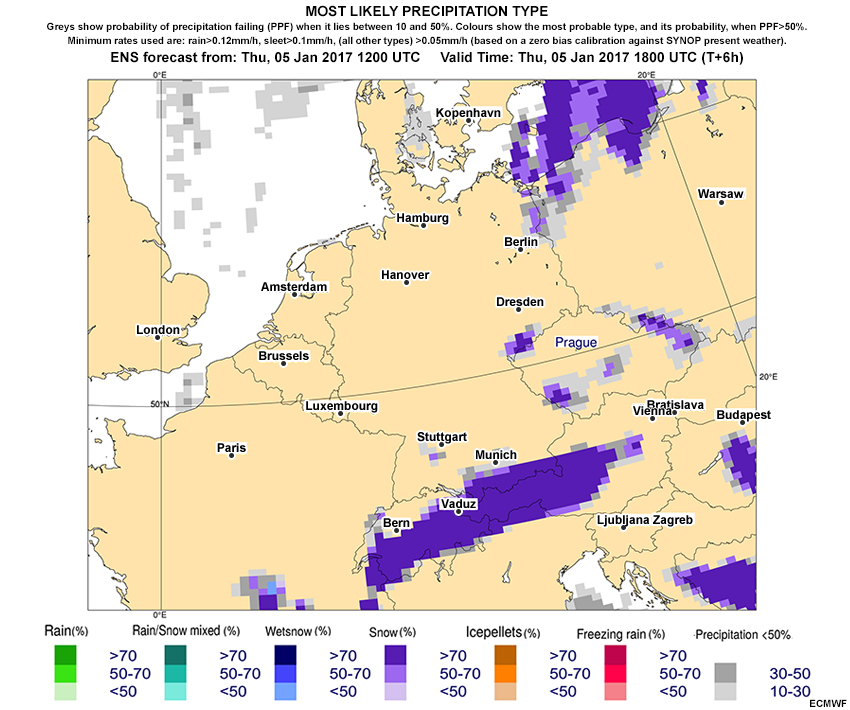
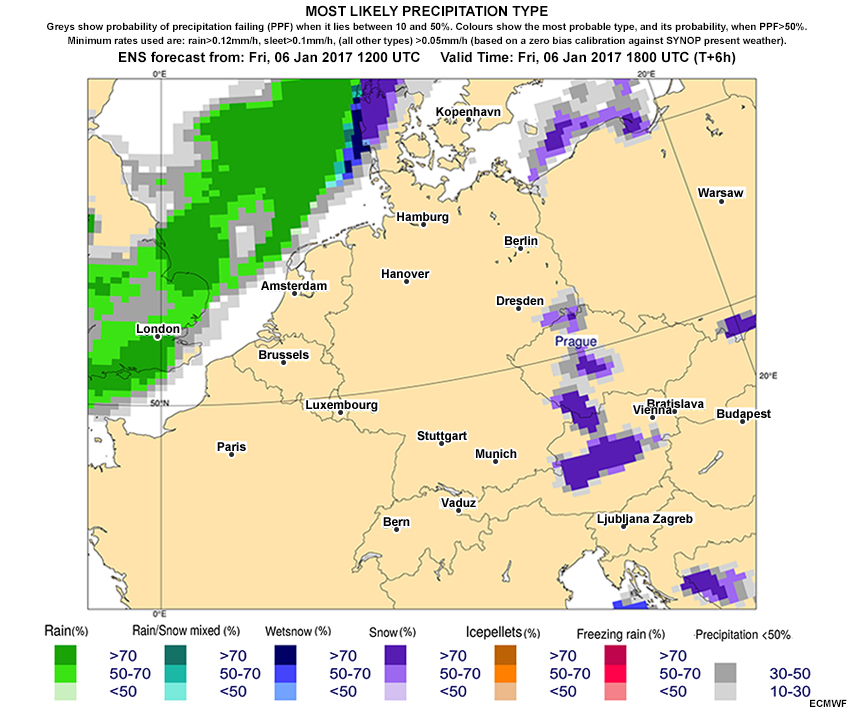
Deterministic Most Likely Precip. Type
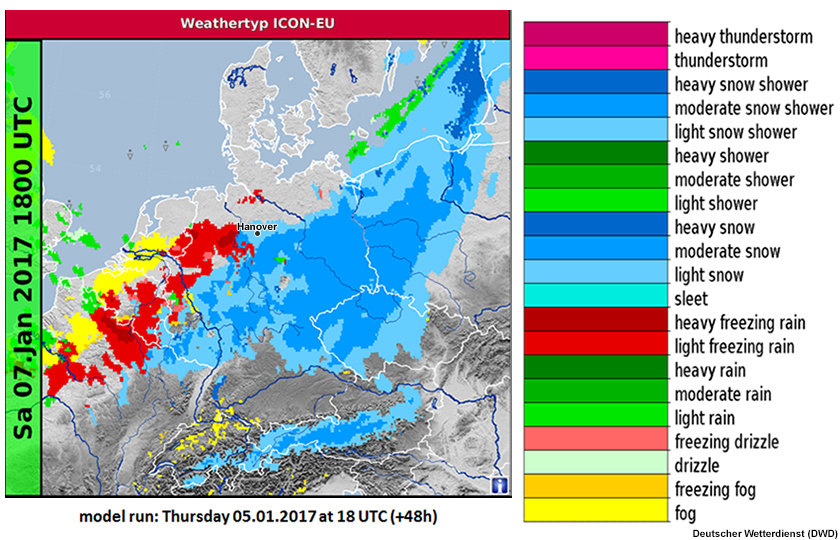
ICON-EU global model 48-hour deterministic forecast of precipitation type initialized 18 UTC on January 5, 2017.
Based on the deterministic forecast guidance for Hanover, you have concluded the following:
- Precipitation could last a little longer than forecast by yesterday’s Day 3 outlook. Today’s forecast guidance suggests that snowfall will begin between the morning and early afternoon (06-12 UTC) on January 7, and end between the evening and overnight (18-00 UTC). Freezing rain will begin between the early afternoon and evening (12-18 UTC) on January 7, and end between the overnight and early morning (00-06 UTC) on January 8.
- The range in total precipitation is similar to yesterday's Day 3 outlook. The model guidance suggests ~0-2 mm for both snow (water equivalent) and freezing rain. During the most critical period of the event (12-18 UTC), total precipitation is ~0-2 mm.
- The deterministic ICON regional model suggests light snow showers for Hanover during the most critical period of the event. However, the possibility of freezing rain cannot be ruled out.
You are curious if the ensemble members suggest any potential for freezing rain and snow in Hanover. Let us take a look at the probabilistic guidance available below.
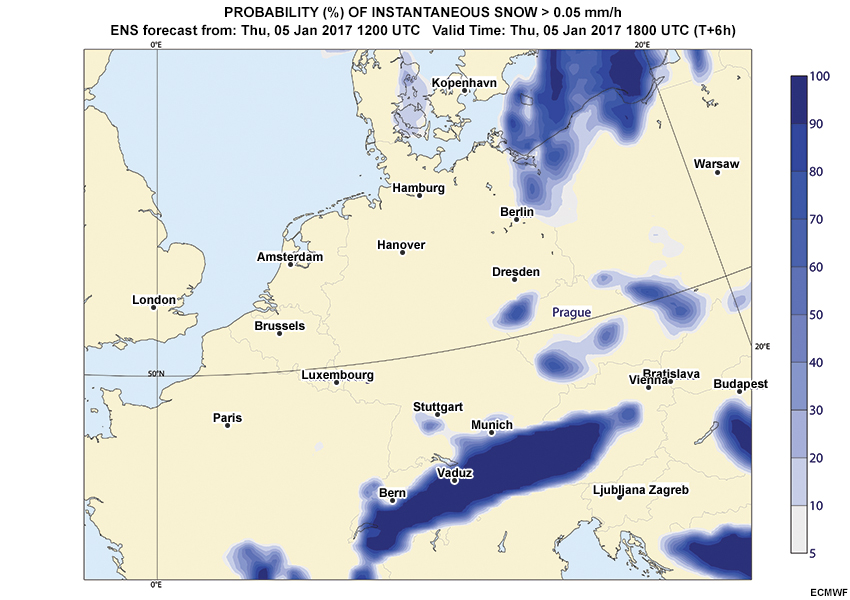
Probability >.05 mm Instantaneous Snow
Probability >.05 mm Instantaneous Freezing Rain

Total Precipitation
Temperature
ENS Most Likely Precip. Type
Use the guidance above to answer the following questions (Questions 1-8) within the tabs. You must answer Question 1 to be able to proceed through the subsequent questions (Questions 2-8).
Question 1
Question 1 of 8
Which of the following EPS products would you use to assess precipitation timing for a specific point location in Germany?
The correct answer is c).
Box and Whisker EPSgrams are point-based products that allow you to quickly assess the variation in potential precipitation timing and amounts. The Probability of Exceedance and Most Likely Precipitation Type forecast products allow you to assess the forecast from a regional perspective. The Probability of Exceedance can help you estimate a general range of likely outcomes by viewing a series of maps with increasing precipitation thresholds. The Most Likely Precipitation Type shows the probability of precipitation falling by precipitation type; it does not provide useful information to help determine precipitation timing or amounts.
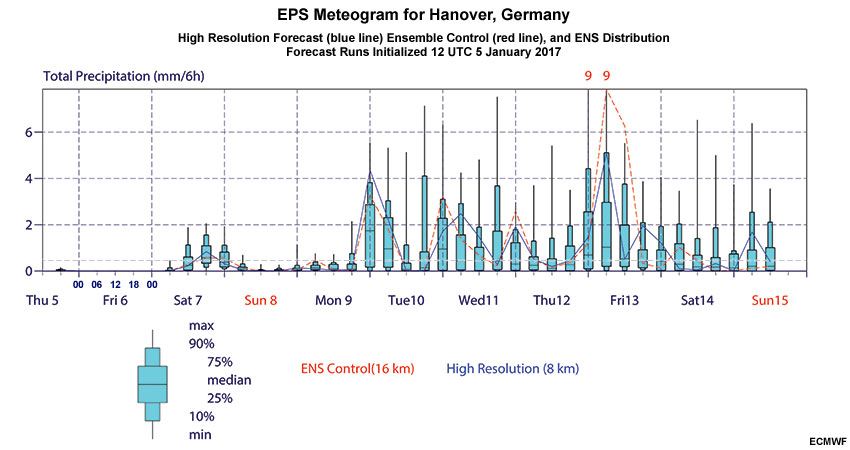
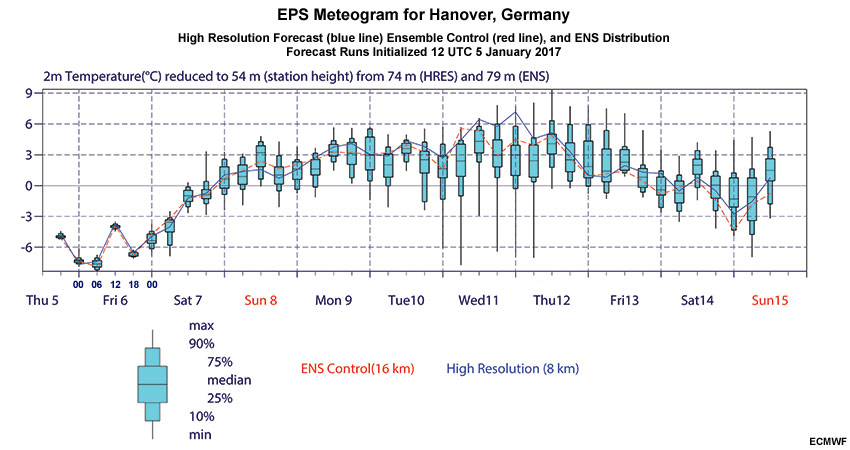
The total precipitation box and whisker EPSgram displays precipitation accumulation over the previous 6 hours - this is because there is no box and whisker plotted at the initialization time, and 6 hours must elapse for it to accumulate.
Please proceed to the next question tab.
Question 2
Question 2 of 8
Based on the EPSgram, determine the most likely precipitation start time (median values =>0.5 mm) and end time (median values < 0.5 mm) in Hanover. The first horizontal dashed line on the y-axis of the EPSgram represents 0.5 mm.
The correct answers are highlighted above.
The ensemble suggests a precipitation period consistent with yesterday’s deterministic forecast. Precipitation in Hanover is most likely to begin between the morning and early afternoon (06-12 UTC) on January 7, and end between the evening and overnight (18-00 UTC). The precipitation will be the heaviest between 12-18 UTC on January 7, where the median is the greatest within the forecast precipitation period.
Although the median value often represents the most likely outcome, we should not assume that it necessarily represents the most likely precipitation amount because we do not know if the distribution of members is normal within that time period. To truly judge whether the median is a good estimation of the most likely outcome you would need to examine a plot that shows all members of the distribution, such as a plume diagram, PDF/CDF or a spaghetti chart. For more information, see the Median and Mode section in COMET’s Introduction to EPS Theory lesson.
Please proceed to the next question tab.
Question 3
Question 3 of 8
Based on the EPSgram, what is the range in total precipitation (mm) that the ensemble is predicting for Hanover during the precipitation event period?
The correct answer is d).
The EPSgram cannot be used to determine the range in total event precipitation because you cannot sum the individual statistical quantities from smaller time steps, such as median precipitation over 6-hour periods, to deduce the median precipitation over 24 hours. This is because individual ensemble members are not summed for 24 hours, and the statistics are not performed upon all member totals.
Please proceed to the next question tab.
Question 4
Question 4 of 8
Based on the EPSgram, determine the maximum, minimum, and median precipitation value (mm) during the most critical period of the event, between 12-18 UTC on January 7 in Hanover.
The correct answers are highlighted above.
During the most critical period of the event, the ensemble predicts the maximum precipitation value to be about 2 mm and the most likely precipitation amount to be about 0.5 mm. However, as previously stated, if there is member clustering it is good practice to study plume diagrams or other EPS products that show individual members.
Please proceed to the next question tab.
Question 5
Question 5 of 8
Based on the Most Likely Precipitation Type graphic, select the maximum probability of each precipitation type for the following times in Hanover during the precipitation event period.
06 UTC January 7
The correct answers are highlighted above.
According to the Most Likely Precipitation Type graphic, probabilities increase to a 50-70% of snow in Hanover at 12 UTC on January 7, and then decrease to less than 50% at 18 UTC. Also, there is less than a 50% chance of freezing rain in Hanover throughout the precipitation event period. Let us look into the precipitation type probabilities for snow and freezing rain in more detail.
Please proceed to the next question tab.
Question 6
Question 6 of 8
During the precipitation event period, the probabilities of exceeding 0.05 mm of instantaneous snow and instantaneous freezing rain (both in water equivalent) in Hanover fall in which probability bin? Note: Bins from products have been enlarged to enable probability assessment.
Snow
The correct answers are highlighted above.
In Hanover, the greatest potential for snow to exceed 0.05 mm is 40-60% at 12 UTC on January 7, and it decreases to 20-40% at 18 UTC on January 7. At 18 UTC, there is also some potential for freezing rain to exceed 0.05 mm, a 5-20% chance.
Please proceed to the next question tab.
Question 7
Question 7 of 8
What is the probability that the 2m surface temperature will be below 0˚C at each of the following times in Hanover?
The correct answers are highlighted above. Note that 75% and 90% are acceptable answers for the probability of below freezing 2m surface temperatures at 18 UTC on January 7.
The EPS shows 100% probability that 2m surface temperatures will be below freezing during the day leading up to the precipitation event. The 2m surface temperatures will be cold enough to allow snow accumulation initially. However, if air temperatures do not stay below zero during the event and a warm layer is present aloft, the precipitation type may transition.
The chances of below freezing 2m surface temperatures change significantly during the precipitation event, between 18 UTC on January 7 (75% or 90% chance) and 00 UTC on January 8 (25% chance). As the forecast period progresses, the anticyclonic branch of a warm conveyor belt coming off the Baltic Sea presents a chance for temperatures to rise above 0˚C at the surface and aloft in northwest Germany.
Let us keep in mind the potential for mixed precipitation based on the warm conveyor belt intrusion, the potential in the probabilistic guidance, and the low probability of below freezing 2m surface temperatures towards the end of the precipitation event.
Please proceed to the next question tab.
Question 8
Question 8 of 8
Based on the Day 3 and Day 2 forecast guidance, what are some of the major changes you have noticed in the forecast? Write your answer in the text field below, remembering to focus on spatial, temporal, and magnitude consistency.
Compared with the Day 3 forecast guidance, the Day 2 deterministic guidance is showing a slightly longer precipitation period and is overall consistent in the forecast precipitation range (~0-4 mm). There seems to be a potential for freezing rain and snow in the city based on the spatial variability in the precipitation type guidance and its proximity to the city. Also, we see similar precipitation ranges for snow and freezing rain.
The Day 2 probabilistic guidance shows overall consistency with the deterministic forecast in regards to the precipitation onset (06-12 UTC on January 7) and precipitation range (in liquid equivalent) between 12-18 UTC on January 7. However, it shows an earlier ending period of 18-00 UTC on January 8. Based on the Most Likely Precipitation Type guidance, we see a greater probability for snow (50-70%) than for freezing rain (less than 50%). The greater probabilities of below freezing 2m surface temperatures support initial snow accumulations on the ground in Hanover.
At this point, models are suggesting a primarily snow-producing weather event, starting early on January 7 and ending overnight with totals of a few millimeters (liquid equivalent). We will need to monitor the chance of freezing rain more closely with forecast soundings and regional forecast products, as only a millimeter or two can create significant impacts.
Day 1 Forecast
IR Satellite
IR satellite loop from 00-12 UTC on January 6, 2017.
Surface Observations
Surface observations over Europe loop from 00-12 UTC January 6, 2017.
Surface Analysis
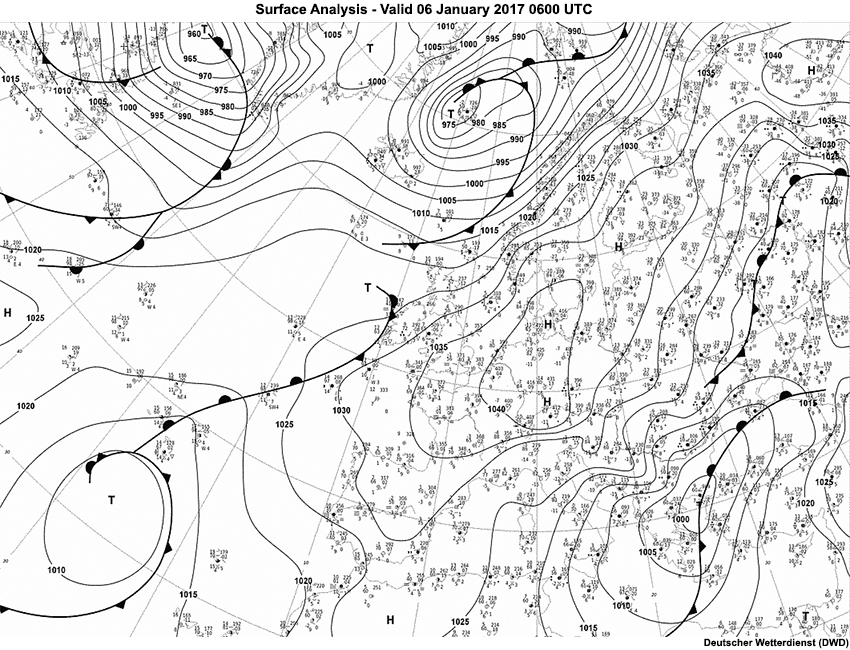
Deutscher Wetterdienst (DWD) analyis valid at 06 UTC on January 6, 2017.
It is 18 UTC on Friday, January 6. You are back on shift, beginning to monitor the weather situation in Hanover. Winds became light and variable as the cold airmass modified and the previous system exited the region. Winds are now turning around to the south, bringing slightly warmer temperatures nearing -5°C ahead of the next system, which moved slowly to the southwest with a cold front pushing eastward through the UK and towards the forecast area.
Let us take a look at the probabilistic guidance to see if there have been any changes in the potential for freezing rain and snow in Hanover.
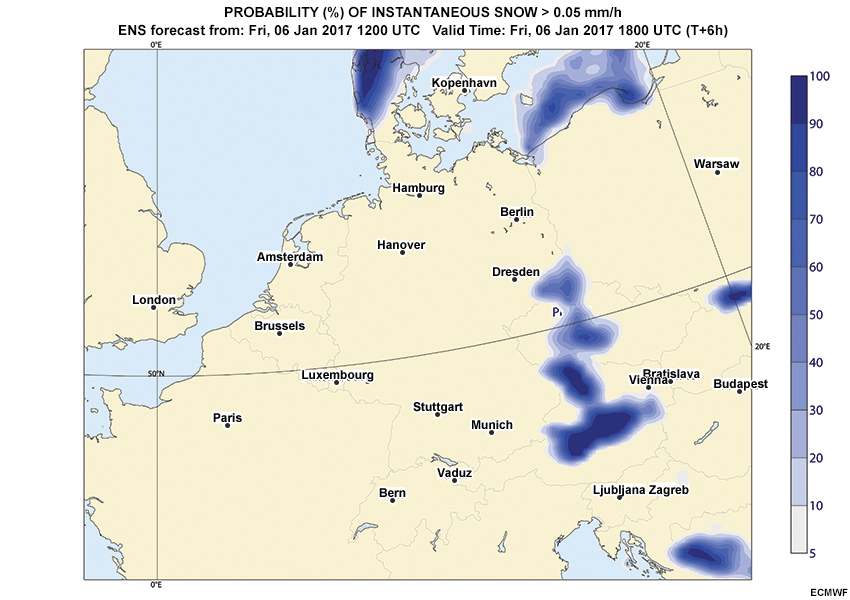
Probability of Exceeding 0.05 mm Instantaneous Snow
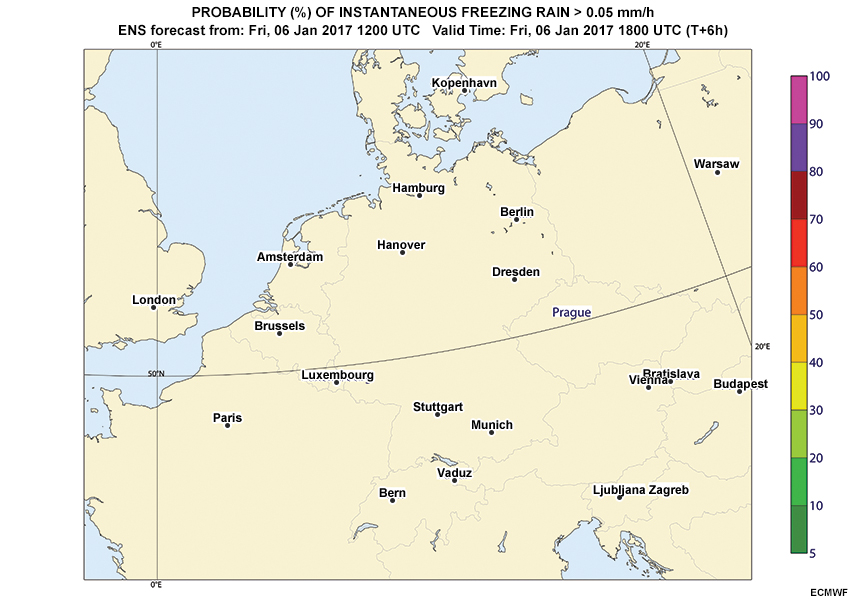
Probability of Exceeding 0.05 mm Instantaneous Freezing Rain
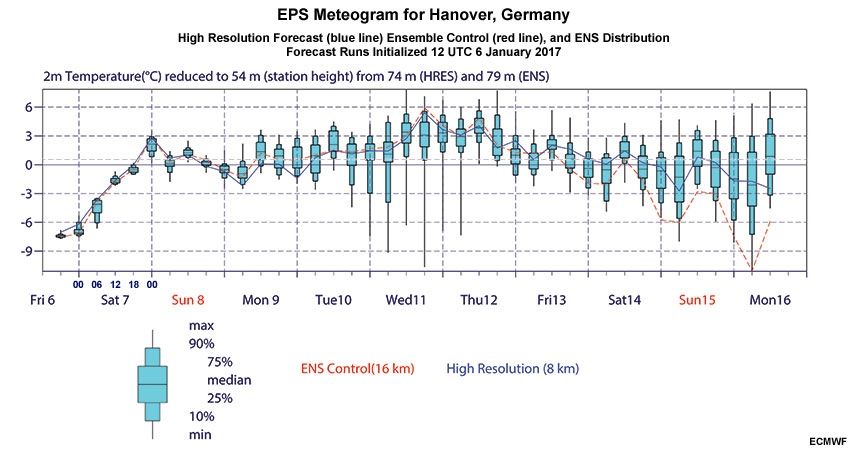
EPSGram Hanover
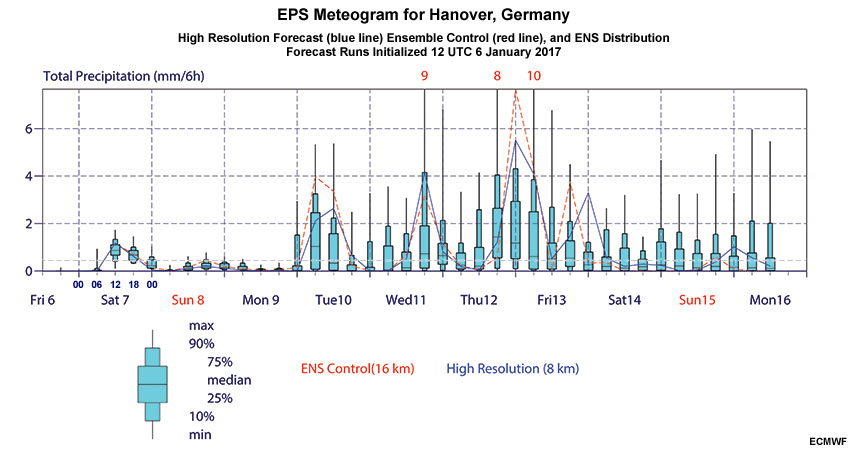
EPSGram Hanover
ENS Most Likely Precip. Type
Question 1
Question 1 of 6
Based on the EPSgram, determine the most likely precipitation start time (median values =>0.5 mm) and end time (median values < 0.5 mm) in Hanover. The first horizontal dashed line on the y-axis of the EPSgram represents 0.5 mm.
The correct answers are highlighted above.
The ensemble suggests a precipitation period consistent with the Day 2 outlook, likely beginning between the morning and early afternoon (06-12 UTC) on January 7 and ending between the evening and overnight (18-00 UTC).
Please proceed to the next question tab.
Question 2
Question 2 of 6
Based on the Most Likely Precipitation Type map, select the maximum probability of each precipitation type in Hanover for the following times during the precipitation event period.
06 UTC January 7
The correct answers are highlighted above. Note that "50 to 70%" and "greater than 70%" are acceptable answers for the maximum probability of freezing rain at 18 UTC on January 7.
According to the Most Likely Precipitation Type graphic, there is greater than a 70% chance of snow leading up to the most critical period of the event. Then, the probabilities of snow drop to less than 50% starting at 18 UTC on January 7. Additionally, there is between a 50% and 70% (or even greater than 70%) chance of freezing rain at 18 UTC!
The Day 1 forecast shows a dramatic shift in precipitation type compared to the Day 2 forecast from a mostly snow to a snow and freezing rain event, revealing a much greater potential for impacts relating to ice. Let us take a closer look at the probabilities of each precipitation type as well as the forecast temperatures for Hanover to determine if there is potential for longer periods of either or both precipitation types.
Please proceed to the next question tab.
Question 3
Question 3 of 6
During the precipitation event period, the probabilities of exceeding 0.05 mm of instantaneous snow and instantaneous freezing rain (both in water equivalent) in Hanover fall in which probability bin? Note: Bins from products have been enlarged to enable probability assessment.
Snow
The correct answers are highlighted above.
In Hanover, the probabilities for snowfall have increased at 06 UTC and 12 UTC on January 7 compared to the Day 2 forecast. The greatest potential for exceeding 0.05 mm of snow is 80-100% at 12 UTC, a higher probability than the Day 2 forecast of 40-60%. Snow probabilities decrease to less than 5% starting on 18 UTC on January 8.
However, there is a significant chance for freezing rain, 60-80%, at 18 UTC on January 7, a significant increase from the Day 2 forecast of 5-20%!
Please proceed to the next question tab.
Question 4
Question 4 of 6
What is the probability that the 2m surface temperature will be below 0˚C at each of the following times in Hanover?
The correct answers are highlighted above.
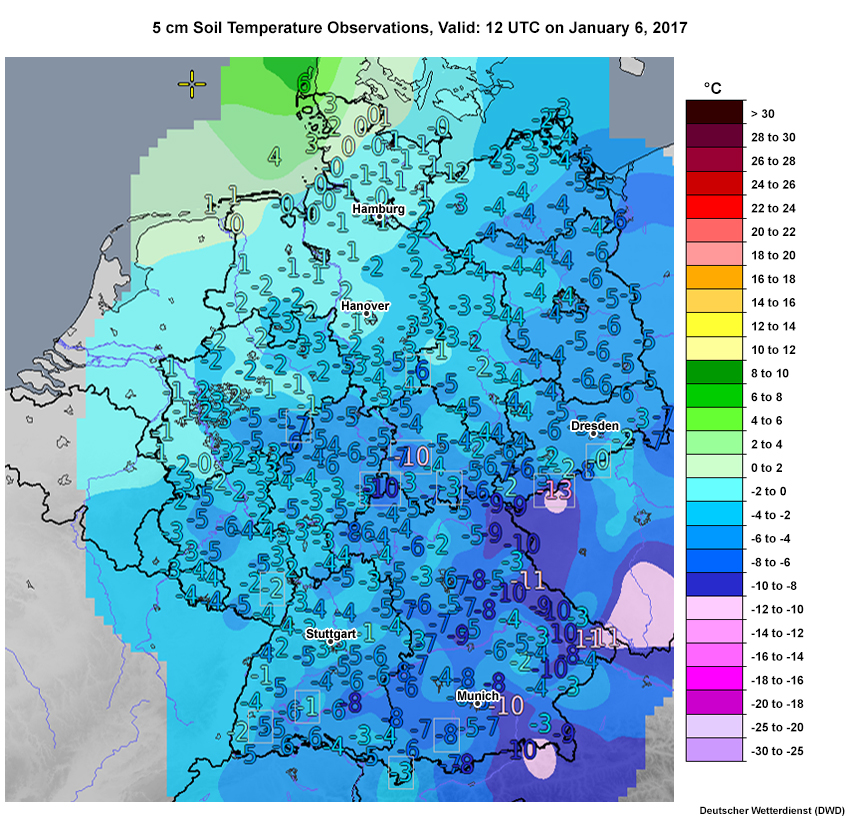
Based on the EPSGram for Hanover, all ensemble members show that 2m surface temperatures will be below freezing during the day leading up to the precipitation event. Soil temperatures throughout the region are below freezing as well, which will allow for snow accumulation initially.
Similar to the Day 2 forecast, the chances of 2m surface temperatures being below freezing change dramatically between 18 UTC on January 7 (90% chance) and 00 UTC on January 8 (0% chance). The probabilistic guidance does suggest a high potential for freezing rain around 18 UTC, coinciding with expected warming as the surface front approaches.
Please proceed to the next question tab.
Question 5
Question 5 of 6
Based on the EPSgram, determine the median and maximum precipitation values (mm) expected between 12-18 UTC on January 7, when freezing rain is the likeliest precipitation type?
The correct answers are highlighted above.
The median precipitation is about 1 mm, and the maximum precipitation is about 1.5 mm. While this would not translate to a large amount of snow, it represents a significant hazard to transportation and public safety if it develops as black ice as expected.
Please proceed to the next question tab.
Question 6
Question 6 of 6
Based on the probabilistic guidance, what are the differences between the Day 2 and Day 1 forecast? Write your answer in the text field below, remembering to focus on spatial, temporal, and magnitude consistency.
The Day 1 probabilistic guidance shows overall consistency with the total precipitation (water equivalent) timing and amounts. Also, the precipitation types expected have shifted - snow has become more likely between 06-12 UTC on January 7, and the likelihood of freezing rain increased dramatically to greater than 70% at 18 UTC. The probability of below-freezing 2m surface temperatures dropped to 0% at the end of the precipitation event, supporting the transition from snow to freezing rain as the front approaches.
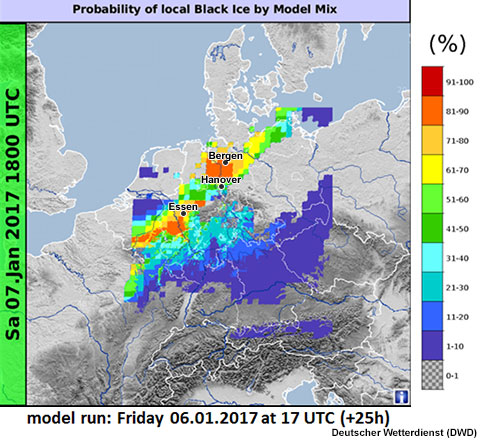
Given the shift in forecast guidance from a mostly snow event to an increased likelihood of freezing rain, you decide to take a look at the high-resolution regional forecast model for additional guidance. Available to you are forecast soundings for Bergen and Essen, cities that lie along the incoming surface front and band of expected mixed precipitation. Also, you have the probability of local black ice by the Model Mix, an optimized statistical output of several global models and regional ensembles. Both of these products are valid during the most critical period of the event, 18 UTC on January 7.
Question 1 of 3
Based on the Model Mix guidance, what is the maximum probability of black ice along the incoming front over northern Germany? Choose the best answer.
The correct answer is b).
The maximum probability of black ice according to the map is 81-90% near Hanover and Bergen, and in other pockets southwestward along the frontal zone. A large swath shows probabilities greater than 60%, similar to what the previous probability of instantaneous freezing rain and most likely precipitation type maps suggested.
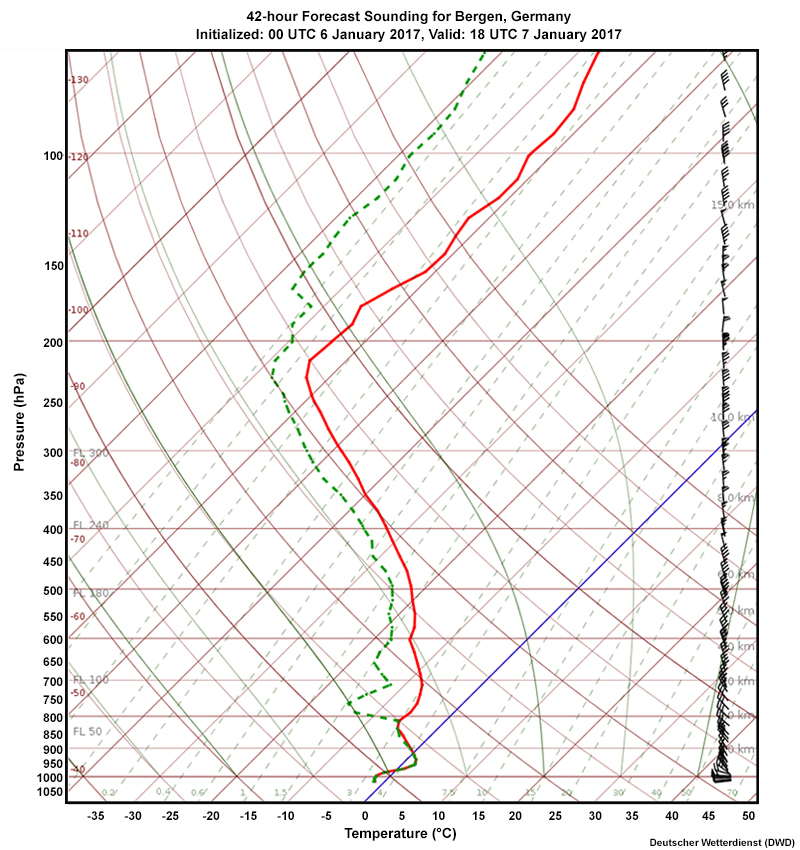
ICON-EU global model 42-hour forecast sounding for Bergen, Germany, initialized 00 UTC on January 6, valid 18 UTC on January 7, 2017.
Question 2 of 3
Based on the forecast sounding for Bergen, which precipitation type is expected? Choose the best answer.
The correct answer is b).
The forecast sounding for Bergen shows cloud/saturation predicted from the surface through about 800 hPa. A warm nose and subfreezing layer are present near about 950 hPa and at the surface, respectively.
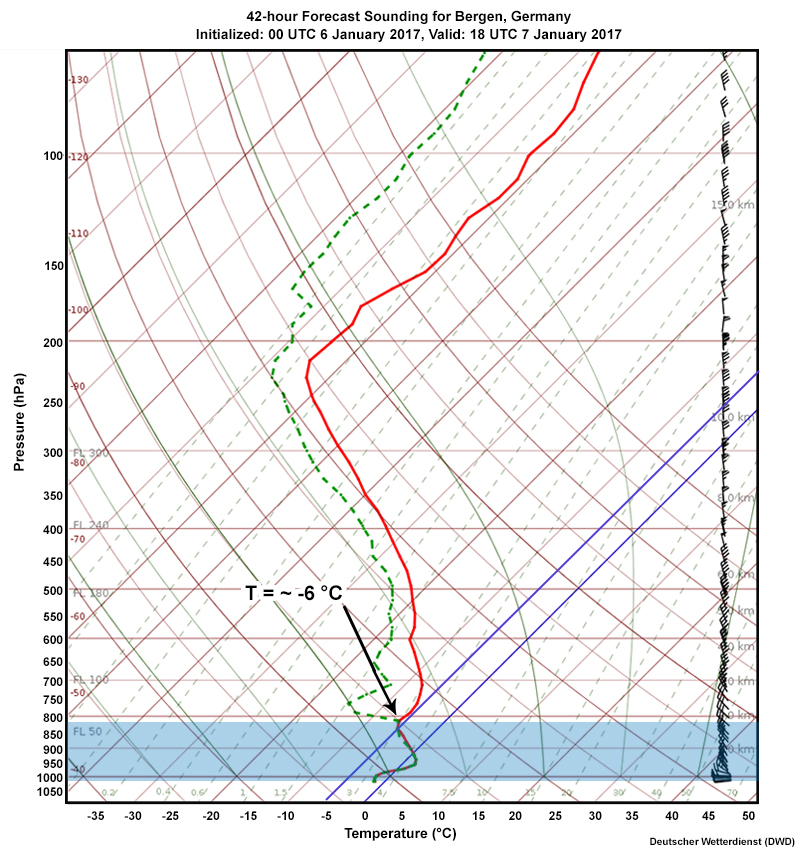
Before we examine the layer depths as one would perform in a standard top-down diagnosis of freezing rain, we need to first determine whether the forecast cloud would contain any ice. With a cloud-top temperature of approximately -6°C, the presence of ice unlikely (<30% probability), and we can assume that it is supercooled liquid.
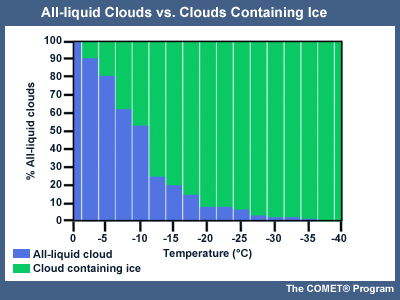
The percentage of all-liquid clouds and clouds containing ice based on cloud top temperature (Celsius).
Thus, any precipitation falling in this situation begins as supercooled liquid, slightly warms and enters a very shallow, only slightly colder than 0°C subfreezing layer. This is not deep enough nor cold enough for the droplets to freeze into pellets. This scenario typically manifests as low, shallow stratus clouds with small drop sizes, and freezing drizzle is observed.
Let’s look at the forecast sounding for Essen to see if the same precipitation type and process are expected.
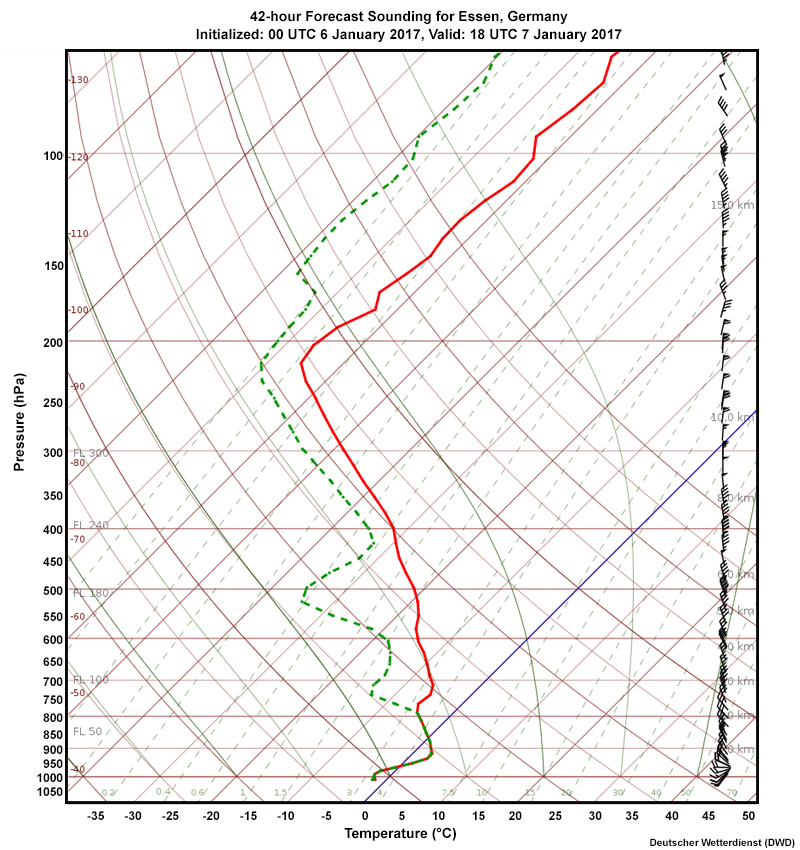
ICON-EU global model 42-hour forecast sounding for Essen, Germany, initialized 00 UTC on January 6, valid 18 UTC on January 7, 2017.
Question 3 of 3
Based on the forecast sounding for Essen, which precipitation type is expected? Choose the best answer.
The correct answer is b).
We see a very similar situation predicted for Essen as we did for Bergen - a cloud top temperature around -6°C, indicating ice is unlikely to be present and supercooled drops remaining that way until they freeze on contact with the ground. These soundings both support conditions for black ice development.
It is apparent that there is significant potential for a snow and freezing rain event in the Hanover area. Any black ice will cause significant travel delays and accidents. Your colleagues issue weather warnings and statements regarding the likely freezing drizzle and expected black ice. Your supervisor requests that you next provide additional decision-support services and manage the phone lines.
Day 1 Forecast » Communicate to End-User
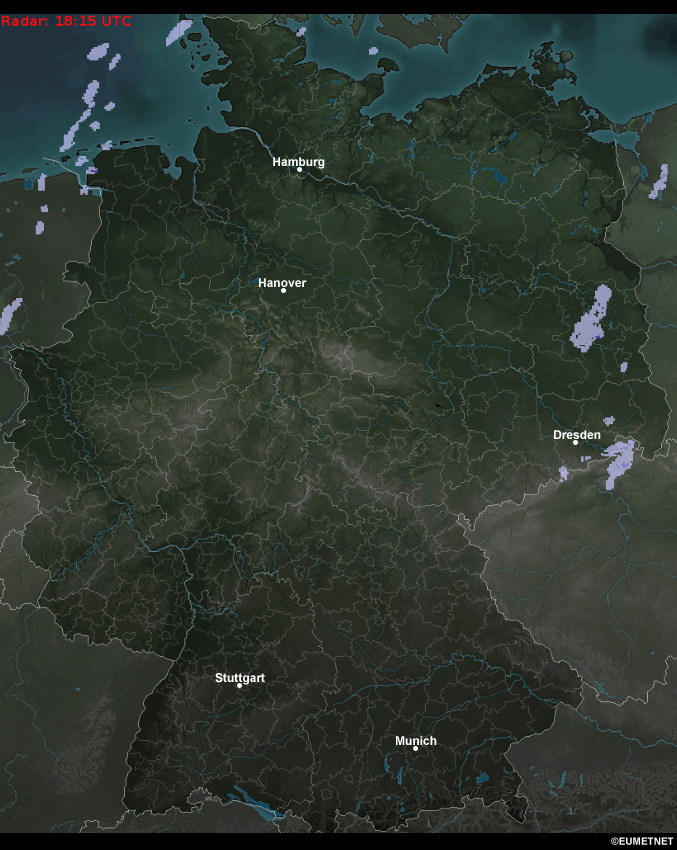
It is now 20 UTC (7pm German time) Friday, January 6, and you are working at the decision-support desk. Very light precipitation is just starting to move onshore from the northwest as the system approaches, as shown in the first tab radar. Remaining tabs show probability of exceedance and EPSgrams from earlier for reference. Use these maps to answer the questions from a local Department of Transportation (DOT) manager below.
Radar Reflectivity Composite
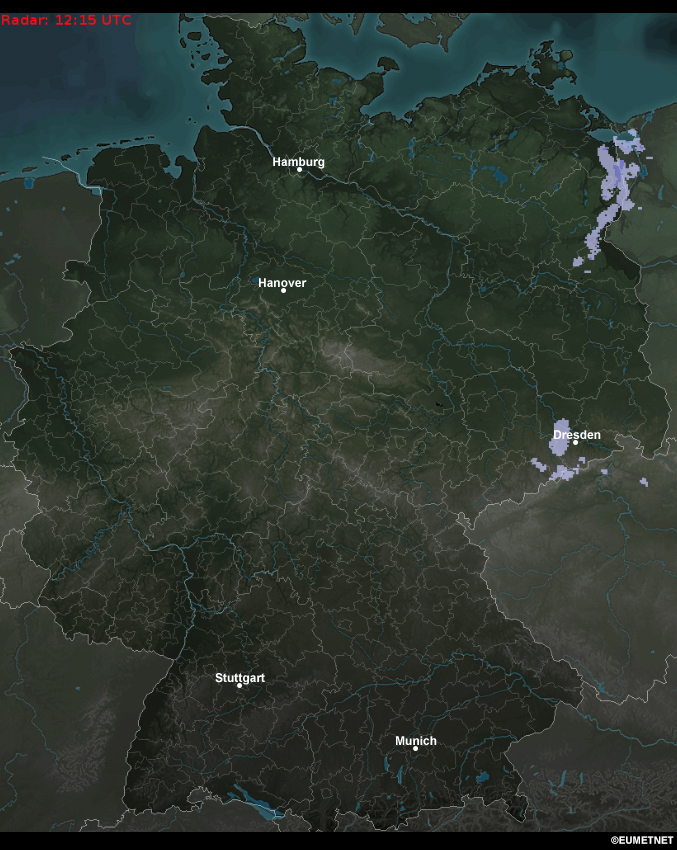
Radar reflectivity composite loop from 1215 UTC to 2015 UTC on January 6, 2017.
Probability of Exceeding 0.05 mm Instantaneous Snow
Probability of Exceeding 0.05 Instantaneous Freezing Rain
EPSGram Hanover > Total Precipitation
EPSGram Hanover > Wind Speed
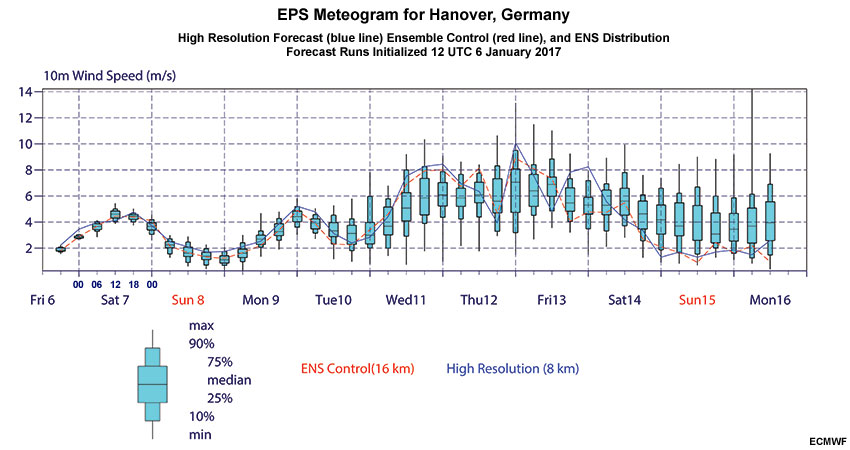
EPSGram Hanover > Temperature
Question 1 of 3
A DOT manager in Hanover calls your office and says “I just started my shift and heard about the ice potential. We’ve been applying brine treatments to the most heavily-used roads, but I think we should treat some of the secondary roads. I want to finish the treatment before the snow starts - when is the earliest possible time that precipitation could begin?”
The correct answer is c).
Choice A gives a single time that precipitation will begin, and uses UTC time, which is likely unfamiliar to those outside of the field.
Choice B gives an estimate of the earliest possible precipitation alongside a more likely situation. This choice uses plain language and is easy to understand.
Choice C contains the same information as choice B, but also adds in knowledge gained from recent observations to add value to the situation. The statements use plain language and are easy to understand.
Choice D mentions multiple pieces of evidence, but in an overly technical way through naming the variables and types of maps.
Question 2 of 3
The manager then asks you a follow-up question: “When will the black ice stop building up, or I guess maybe the right question is when will it melt? I heard it was going to warm up on Saturday night - will that melt it?” At this point, you want to look at a couple more maps to support your thoughts about when the black ice will cease development and how long it might remain on the ground without treatment. What should you tell the manager?
The correct answer is d.
Choice A puts the manager on hold for a specified amount of time, which may put them at ease and help them manage their time. However, the use of technical map types and variables is confusing to the layperson.
Choice B asks to call the manager back, which allows them to go about their business while they wait. However, the language regarding map type and variables is overly technical and potentially confusing.
Choice C puts the manager on hold for an unspecified amount of time and is very vague about the reason for doing so, leaving it too simply at “checking information”.
Choice D asks to call the manager back, allowing them to use their time as they see fit while they wait, and uses plain language to explain what additional information will be examined and why, which will give the caller more confidence in you.
Question 3 of 3
You call the manager back and begin with “Hello again. Thanks for letting me look at that extra information. I’ve examined the local ground temperature information and can tell you a bit more”. What is the best way to state the combined picture that the models and ground temperature observations create?
The correct answer is a).
Choice A uses plain language, local times, and cites a most likely temperature as well as the small possibility of a cooler one. It explains what would happen in each temperature scenario, and then presents an explanation of the most critical factors affecting melting.
Choice B uses plain but vague language, and does not provide a clear representation of the likelihood of melting nor the values of temperature.
Choice C provides useful explanations and likelihoods, but uses technical terminology such as “condensation”, and “median” instead of stating “most likely”, and cites times in UTC that render it more confusing than choice A.
The DOT manager thanks you for the information, and you return to monitoring observations until the next call. You were able to synthesize the probabilistic guidance and observations, and confidently communicate the winter weather threat with information. You were able to provide the DOT manager with useful information on event timing and the forecast challenges regarding when the black ice may begin to melt. The DOT manager decided to send out resources across the city and was able to treat many roads in advance of the ice storm. This enabled them to efficiently maintain safer road conditions.
Summary
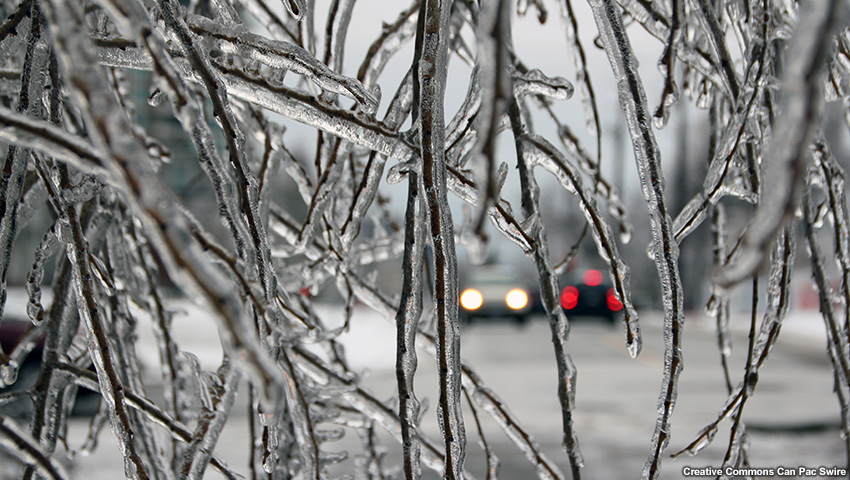
Freezing drizzle resulted in many traffic accidents and injuries during the January 7-8 weekend in northern and western Germany. Firefighters responded to hundreds of weather-related emergency calls during the event in Hamburg. In Hanover, city authorities closed public transportation and advised folks to stay indoors.
Radar reflectivity composite loop from 1815 UTC on January 6 to 1815 UTC on January 8, 2017.
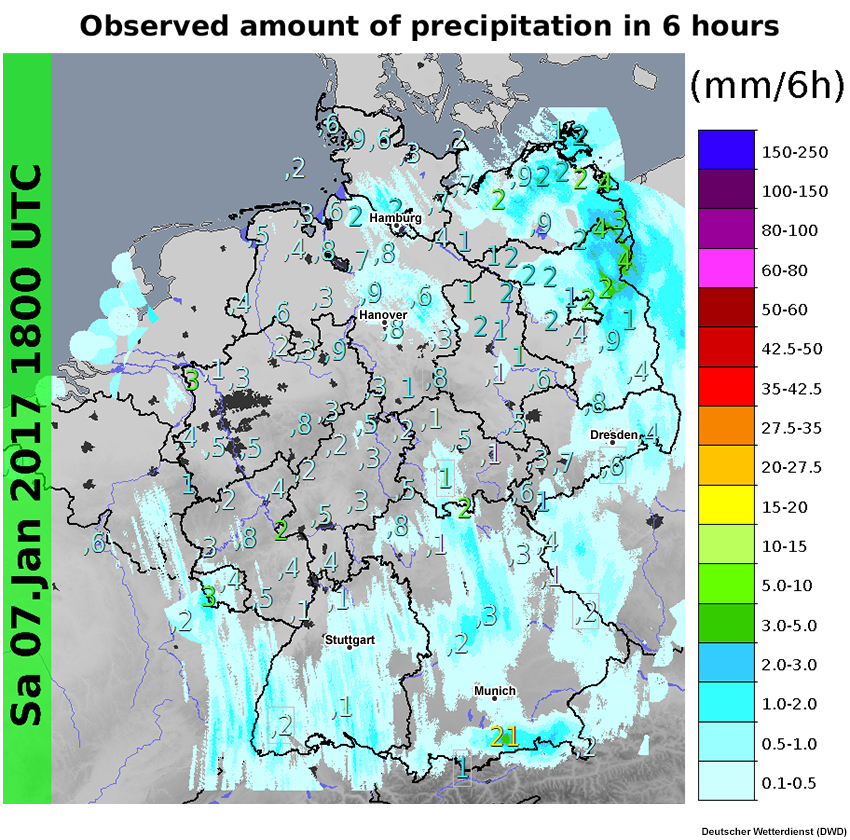
Two separate bands of precipitation moved across Germany during the weekend. A light snow band travelled from north to south, and eventually spread across eastern Germany. Another heavier band of precipitation entered into northwest Germany from the Netherlands and travelled to the south.
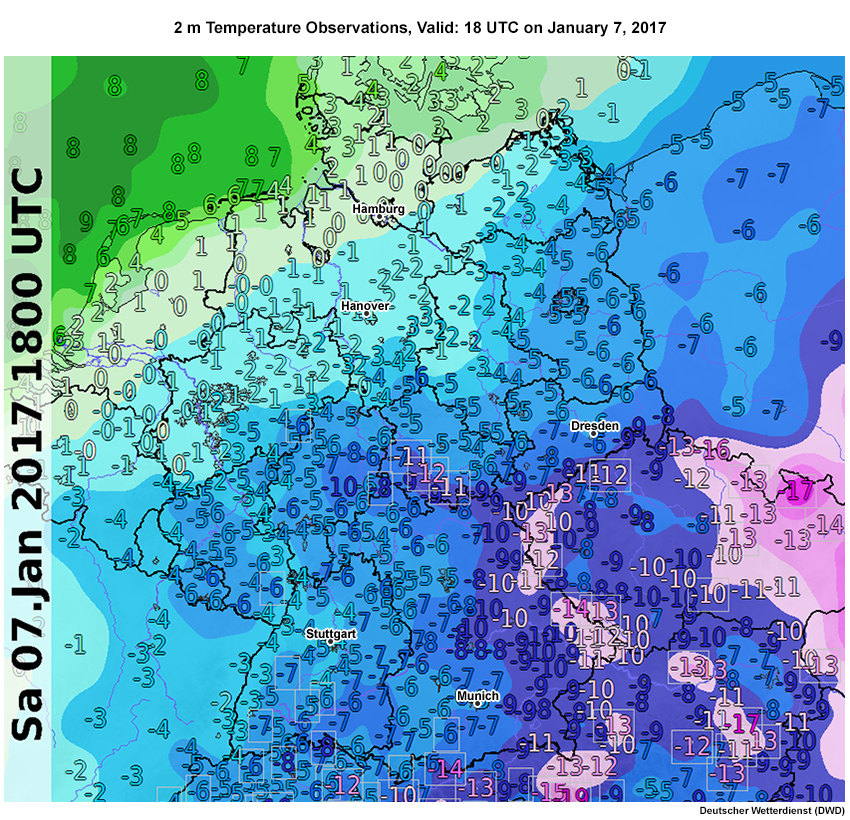
During the most critical period of the event, freezing single digit surface temperatures spread across northern portions of Germany, reaching -10°C further south and east. Total precipitation accumulations were greater in far northeast Germany.
Ensemble prediction systems (EPS) provide an opportunity for forecasters to gain local and regional perspectives of a weather event. In this lesson, you selected the most useful EPS forecast products to determine the most likely precipitation amount, timing, and type for a winter weather event in Germany. Additionally, you analyzed the EPS forecast products at various temporal (3-day lead time to nowcasting) and spatial scales (regionally and locally). Below is a quick review of the value of each EPS forecast product to a user:
- Probability of Exceedance: Provides a range of likely forecast outcomes, and helps users determine the amount of time a threshold may be exceeded.
- Box and Whisker EPSgrams: Provides an assessment of probabilities and percentiles of a forecast variable at a specific location.
For more information about EPS forecast products, see COMET’s EPS Products Reference Guide.
Forecasters can relay EPS-based information to decision-makers that can help them make public safety decisions. Understanding the needs of your user is critical to providing useful forecast uncertainty information. At the end of this lesson, you practiced communicating probabilistic forecast and potential impacts information to local end users. For more information on best practices in communicating relevant forecast information to end users, see COMET’s Communicating Forecast Uncertainty lesson.
You have reached the end of the lesson. Please complete the quiz and share your feedback with us via the user survey.
Contributors
COMET Sponsors
MetEd and the COMET® Program are a part of the University Corporation for Atmospheric Research's (UCAR's) Community Programs (UCP) and are sponsored by
- NOAA's National Weather Service (NWS)
with additional funding by: - Bureau of Meteorology of Australia (BoM)
- Bureau of Reclamation, United States Department of the Interior
- European Organisation for the Exploitation of Meteorological Satellites (EUMETSAT)
- Meteorological Service of Canada (MSC)
- NOAA National Environmental Satellite, Data and Information Service (NESDIS)
- NOAA's National Geodetic Survey (NGS)
- National Science Foundation (NSF)
- Naval Meteorology and Oceanography Command (NMOC)
- U.S. Army Corps of Engineers (USACE)
To learn more about us, please visit the COMET website.
Project Contributors
Project Lead
- Vanessa Vincente - UCAR/COMET
Instructional Design
- Andrea Smith - UCAR/COMET
Science Advisors
- Dr. Wilfried Jacobs - Deutscher Wetterdienst (DWD)
- Lars Kirchhuebel - Deutscher Wetterdienst (DWD)
- Francis Wu - Meteorological Service of Canada (MSC)
- Jason Knight - Meteorological Service of Canada (MSC)
- Vanessa Vincente - UCAR/COMET
- Andrea Smith - UCAR/COMET
Program Oversight
- Andrea Smith - UCAR/COMET
Graphics/Animations
- Steve Deyo - UCAR/COMET
Multimedia Authoring/Interface Design
- Gary Pacheco - UCAR/COMET
COMET Staff, March 2019
Director's Office
- Dr. Elizabeth Mulvihill Page, Director
- Tim Alberta, Assistant Director Operations and IT
- Paul Kucera, Assistant Director International Programs
Business Administration
- Lorrie Alberta, Administrator
- Auliya McCauley-Hartner, Administrative Assistant
- Tara Torres, Program Coordinator
IT Services
- Bob Bubon, Systems Administrator
- Joshua Hepp, Student Assistant
- Joey Rener, Software Engineer
- Malte Winkler, Software Engineer
Instructional Services
- Dr. Alan Bol, Instructional Designer/Scientist
- Tony Mancus, Instructional Designer
- Sarah Ross-Lazarov, Instructional Designer
- Tsvetomir Ross-Lazarov, Instructional Designer
International Programs
- David Russi, Translations Coordinator
- Martin Steinson, Project Manager
Production and Media Services
- Steve Deyo, Graphic and 3D Designer
- Dolores Kiessling, Software Engineer
- Gary Pacheco, Web Designer and Developer
Science Group
- Dr. William Bua, Meteorologist
- Patrick Dills, Meteorologist
- Bryan Guarente, Instructional Designer/Meteorologist
- Matthew Kelsch, Hydrometeorologist
- Andrea Smith, Meteorologist
- Amy Stevermer, Meteorologist
- Vanessa Vincente, Meteorologist