The Problems » Different Interpolation Methods
Interpolation of high-resolution source terrain and shoreline data to the analysis and downscaling grids can use different methods. We’ll briefly examine two common methods and see how using different methods on the same source data results in different terrain grids.
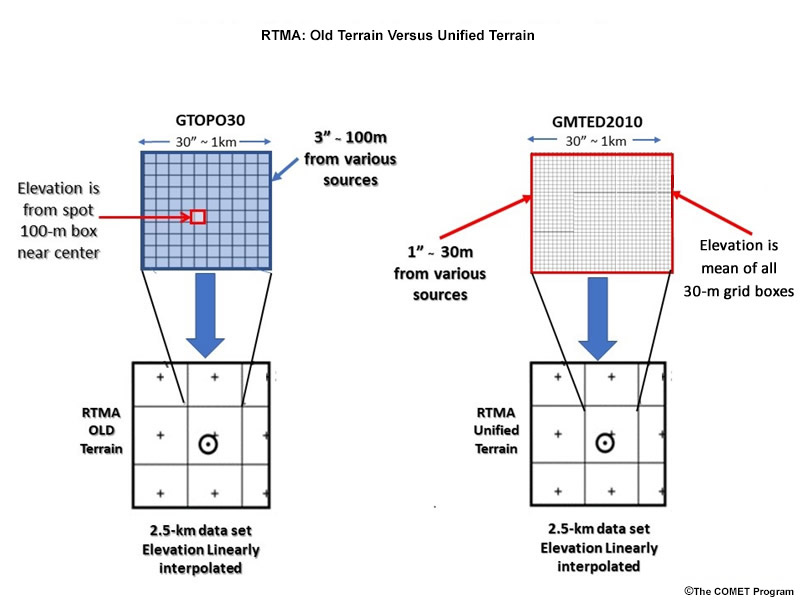
The graphic below shows the method used to create the previous version of 2.5-km terrain in the RTMA/URMA on the left, while the method used to create the Unified Terrain is on the right. The 100-m resolution source data used for GTOPO30 were updated for the GMTED2010, and made available at 30-m resolution.
- In the first step (top row), source data are aggregated to 1-km grid boxes.
- The second step (top row) is to choose the terrain height of the grid box. In the older version, the terrain height of a 100-m grid box near the middle of the larger grid box was chosen, while the mean value of all 30-m grid boxes was used for Unified Terrain.
- In the third step (bottom row), the 1-km data are interpolated using bilinear interpolation (a form of grid box averaging). Other methods include nearest neighbor (uses value from the nearest point) and polynomial interpolation. While not shown in the graphic, different interpolation methods will yield different results.
Left: Bilinear interpolation method used to create 2.5-km terrain. Right: Nearest neighbor method used to create 2.5-km terrain. Both start from a common 100-meter terrain height data set.
Question
Terrain data are used for plotting forecast guidance and creating a 2D analysis. Which of the following would create differences between the terrain heights for both functions? Choose all that apply.
Terrain height differences come from using different source terrains or assigning terrain height to a grid box using either different parts of the grid box or different aggregated grid boxes. Interpolating and aggregating source data does not by itself generate terrain differences.