Introduction
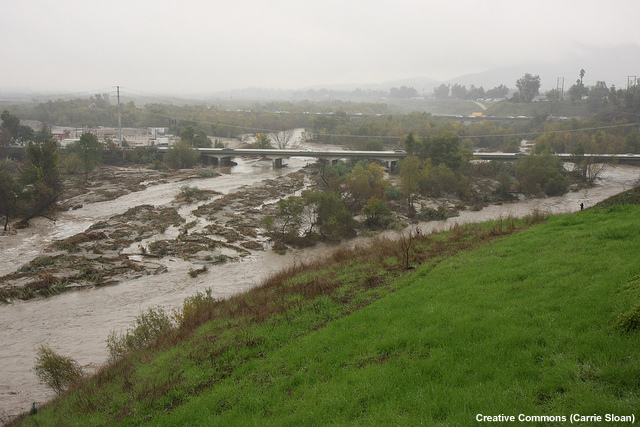
The West Coast of North America is subjected to occasional extreme precipitation events, especially in the cool season. The mountainous coastline and the abundance of maritime moisture both play an important role in the precipitation climatology here and in other parts of the world.
![1927 flood: Photo of Thousand Food channel when impounded flood waters broke through to the Pacific Ocean. The Coast Blvd. & P.E. [Pacific Electric] Railroad suffered extreme damage as shown.](media/graphics/1927_flood_damage.jpg)
Question
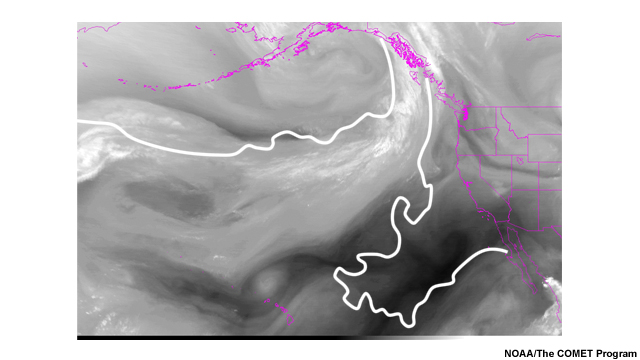
Using the slider, compare the longwave infrared and water vapor satellite images below.
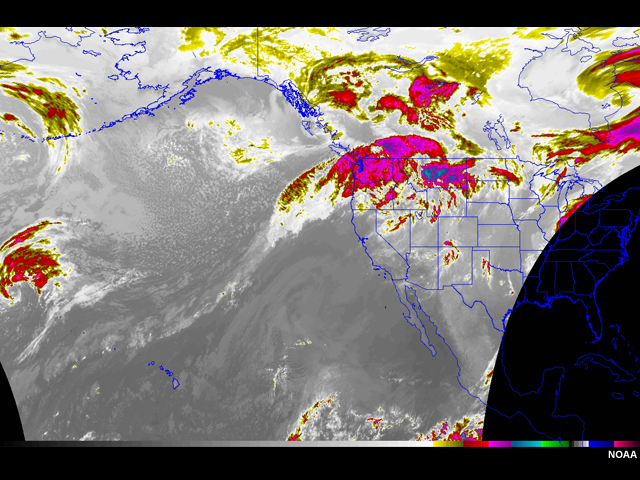
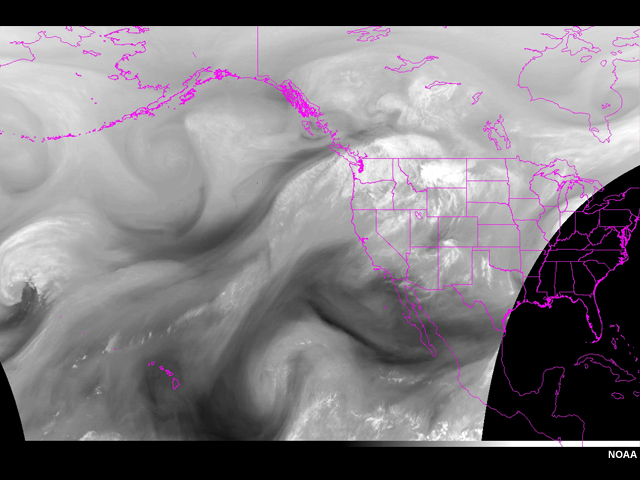
Where do the above images suggest the extreme precipitation event is along the coast of North America? Outline the area of concern below with the pen tool.
| Tool: | Tool Size: | Color: |
|---|---|---|
|
|
Feedback: From just the satellite images, you likely guessed there is potential for heavy precipitation in southern British Columbia, Washington, Oregon, and possibly northern California. The biggest problem is forecasting the magnitude of the precipitation and which sub–region or drainage basins within that region will be most impacted.
Question
Using the images, can you determine if this is going to be a heavy precipitation event? (Choose the best answer.)
The correct answer is b.
Feedback: No, at least not with much certainty. While the IR imagery gives important information about the clouds, it gives little indication of water vapor content. Water vapor imagery (6.7 – 6.8 µm channel) on the other hand does. The water vapor image does show a good fetch of moisture and enhanced clouds entering into southwest Canada and the Pacific Northwest of the United States. Yet, it does not help us determine an amount of possible precipitation because it only covers a small portion of the troposphere. It does not show the rich source of low–level moisture that can contribute greatly to the total available moisture. It also does not give much spatial detail on the drainage basin scale.
Introduction »Integrated Water Vapor
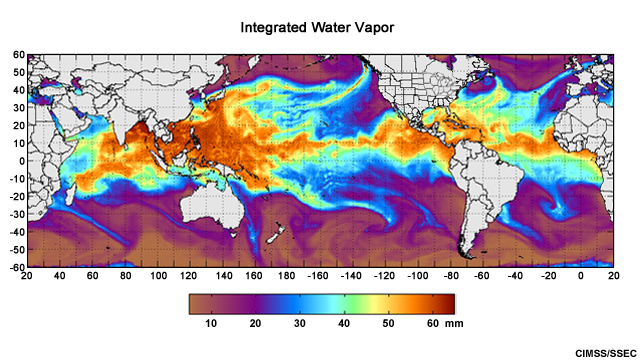
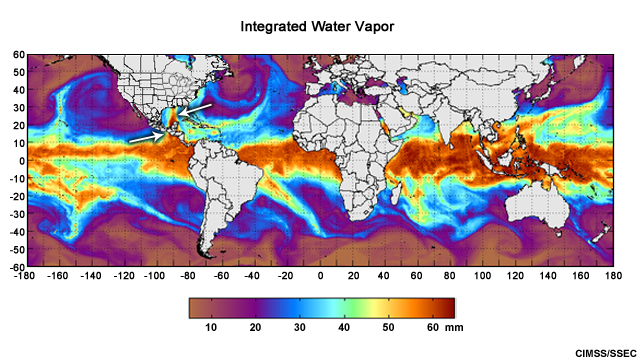
Imagine a satellite product that could depict water vapor integrated through the depth of the atmosphere. Such a product exists: Integrated Water Vapor (IWV).
Question
Can you define an area of probable heavy precipitation on IWV imagery more precisely than on the WV imagery? (Choose the best answer.)

The correct answer is a.
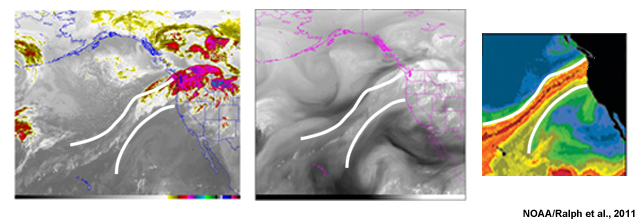
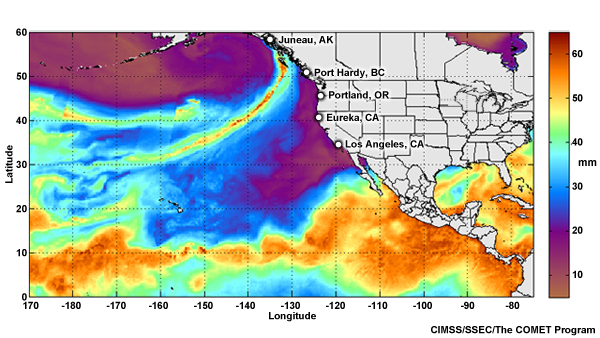
Feedback: Yes. On the IWV, a ribbon of high values stretches from the tropical Pacific to the West Coast of North America. You might now limit the possible heavy precipitation area because of the increased spatial detail and the magnitude of the IWV.
To see real–time IWV imagery and animations visit: http://tropic.ssec.wisc.edu/real–time/mimic–tpw/global/main.html
As shown in the above question, IWV is a better choice than the water vapor imagery for showing the total available water vapor. Global views of IWV are most accurately obtained from microwave instruments on polar–orbiting satellites. Global coverage is obtained by compositing several satellite passes into one image.
Due to microwave retrieval issues over land, IWV is only retrieved over open oceans. For more detail about how this product is retrieved see the COMET module Microwave Remote Sensing: Clouds, Precipitation, & Water Vapor.
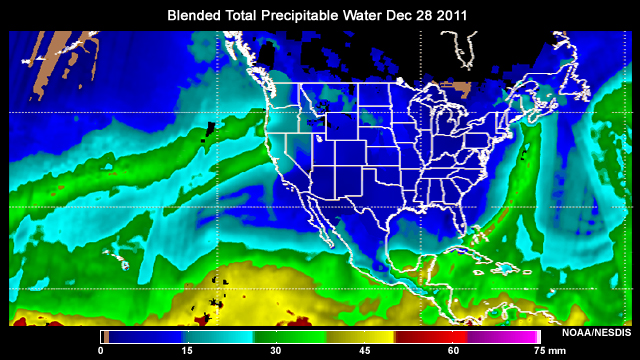
Total Precipitable Water (TPW) is another satellite–based product that provides similar information to IWV (described by Kidder and Jones (2007). Data from surface–based GPS or geostationary IR sounders are often plotted on these images to provide IWV/TPW over land areas.
To see real–time TPW imagery and animations, go to http://www.ospo.noaa.gov/Products/bTPW/index.html
This narrow region of poleward transport of moisture (high IWV/TPW) from the tropics is defined as an Atmospheric River (AR), as described by the NOAA Earth System Research Laboratory (http://www.esrl.noaa.gov/psd/atmrivers/).
The term Atmospheric River was first published in a three–year ECMWF study (Zhu and Newell 1998). That study concluded that 95% of the global meridional flux of water vapor occurs in narrow plumes that account for less than 10% of the Earth's circumference (only 4000 km). ARs also contributed to 46 out of 48 high–flow events over twelve years in four Coastal U.S. Pacific Northwest basins (Neiman et al., 2008). Ralph et al., 2006 showed that all floods on California's Russian River (in a seven–year period) were associated with ARs. A few strong ARs supplied moisture for 30–50% of the precipitation for the West Coast of the United States.
Moisture Component
Question
View the IWV animation again.
Now, using the pen tool, outline all of the areas below that appear to be ARs.
| Tool: | Tool Size: | Color: |
|---|---|---|
|
|
Feedback:

As defined by Ralph et al. (2004) and Ralph et al. (2005), ARs studied in the cool season along the United States' West Coast have values of IWV greater than 20 millimeters and are typically 400–600 kilometers wide, and more than 2000 km long. So the areas outlined in the above graphic appear to meet these IWV criteria and thus constitute ARs.
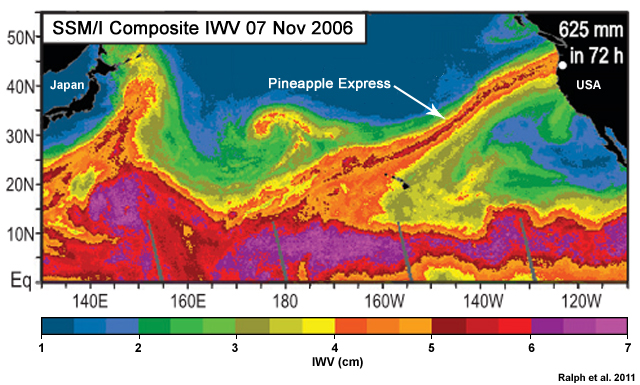
ARs are often associated with other phenomena you may know. A "Pineapple Express" is an AR that affects the West Coast of North America originating from around Hawaii.
Moisture plumes and high theta–e tongues are usually associated with ARs, but not all plumes and tongues are considered ARs. A warm conveyor belt of an extratropical cyclone is a broader structure often containing the narrower AR.
Question
The typical moisture threshold (defined by Ralph et al. 2004) for an AR is an IWV value of greater than or equal to 20 mm. Do you think this IWV value for significant moisture would apply everywhere? (Choose the best answer.)
The correct answer is b.
Feedback: The 20 mm threshold is a good place to start, but expect it to vary climatologically.
Question
What factors might cause variations in the 20 mm IWV threshold? (Choose all that apply.)
The correct answers are a, d.
Feedback: The highest IWV values are in the maritime, tropical regions.
Therefore, proximity to warm sea surface temperatures increases the potential magnitude of IWV. This also has a seasonal component. The 20 mm IWV threshold was determined from the U.S. West Coast in the cool season. However in some areas, this may not be a particularly unusual value and forecasters should consider a higher IWV threshold. Seasonal variation is related not only to changes in sea surface temperature, but also to transport of tropical moisture poleward via atmospheric disturbances. Many ARs are associated with extra–tropical cyclones thus making the cool season typically more prone to these events.
Regardless of season or location, the satellite IWV and TPW products are among the most important tools for detection and assessment of ARs.
Moisture Component »Anomalous Moisture
Question
How can we determine if the amount of moisture indicated by IWV or TPW is an anomalous amount? (Choose all that apply.)
The correct answers are a, d, e.
Feedback: The IWV and TPW products we've looked at show us the magnitude of the moisture, but not directly whether this is unusual. There are several ways to determine if the AR contains an anomalous amount of moisture. We will briefly discuss:
- TPW anomaly product
- Precipitable water anomalies from atmospheric soundings
- NWP–derived precipitable water anomalies
Method 1: TPW Anomaly Product
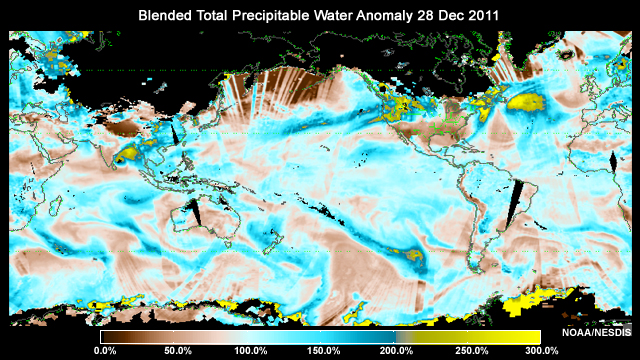
The Percentage of TPW normal, or TPW anomaly (found here: http://www.ospo.noaa.gov/Products/bTPW/TPW_Animation.html?product=GLOBAL_PCT), shows the percentage departure from the climatology. The normal value is based on a weekly climatology of total precipitable water from NASA's Water Vapor Project (NVAP) covering 1988–1999.
Note that the TPW anomaly product is valid for short time durations and it's only based on 12 years of data. This can result in some misleading data due to one major event skewing the 12–year weekly average.
Method 2: PW Anomalies from Atmospheric Soundings
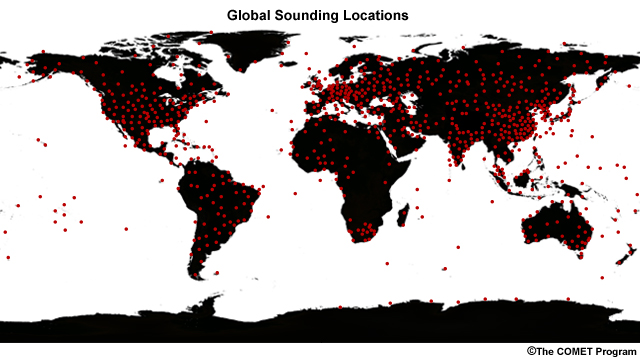
Precipitable water (PW) can be derived from atmospheric soundings.
PW climatological means and extremes have been calculated from long–standing sounding locations in the U.S. Although sounding–based PW is point–based, the climatologies can help assess the moisture anomaly.
The 30–yr precipitable water climatologies for upper–air stations in the United States can be found here: http://www.spc.noaa.gov/exper/soundingclimo/
Method 3: NWP–derived Precipitable Water Anomalies
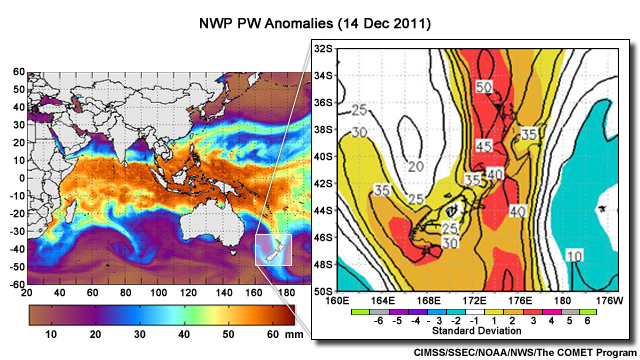
Numerical Weather Prediction (NWP) models also produce precipitable water and precipitable water anomaly information. The anomaly information can be used in comparison with the TPW or IWV values to assess if a significant anomaly exists.
Here we see an AR impacting New Zealand and the NWP–generated PW anomaly shows positive anomalies of positive 3–4 standard deviations.
Question
What else is needed aside from anomalous moisture to define a plume as an AR? (Choose all that apply.)
The correct answer is d.
Feedback: Remember, terrestrial rivers flow. Without that flow, it would just be a long narrow lake. Atmospheric rivers have flow of water vapor. That flow can be estimated with satellite animations, or quantified with moisture transport products. It is the combination of BOTH high moisture AND moisture transport that defines an AR and increases that possibility of a major precipitation event.
The definition of an AR does not require orographic forcing or landfall. ARs can exist without making landfall and thus have little direct societal impact. Deep cloud development, while sometimes associated with ARs, is not necessary to define them.
Transport Component
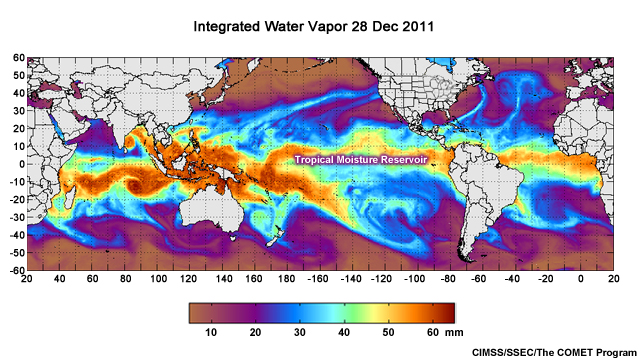
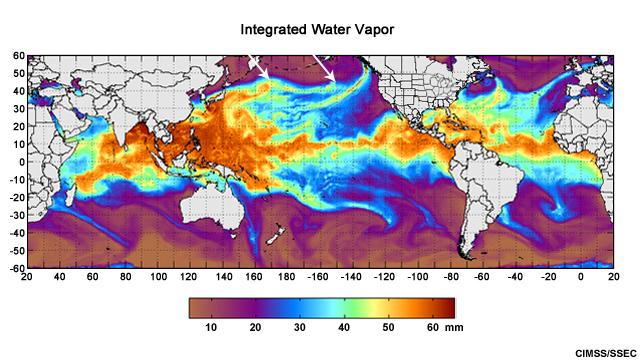
ARs often have a maritime tropical reservoir where they originate. But other ARs obtain their anomalous moisture content locally through moisture convergence in the marine boundary layer and the latent heat flux from the underlying sea surface. ARs may also obtain moisture through a combination of local moisture and transport from the tropics. From this IWV image, these source areas tend to be tropical.
ARs transport that moisture out of the tropics and marine boundary layer into the mid–latitudes. Note though that ARs do not always take a direct route from the tropics meridionally into a coastal area. In some cases, they meander across an ocean basin.
Regardless of the path it takes, forecasters need to know how much and how quickly the moisture is being transported into their area of concern.
Question
If you were designing a moisture transport product, which of the following variables is/are sufficient? (Choose all that apply.)
The correct answers are b, f.
Feedback: Moisture transport products should include deep–layer moisture and winds to account for the transport. There are some NWP products that can be used to show the transport of moisture, such as moisture transport vectors and moisture advection values.
Neiman et al. (2008) defined 1000–300mb Integrated Vapor Transport (IVT; kg m–1 s–1) and found that IVT values exceeding 300 kg m–1 s–1 were noteworthy. This threshold value likely varies with season and location.
For a major precipitation event, the moisture transport of an AR is important for resupplying moisture.
Excessive Precipitation
We have now seen that forecasting ARs requires forecasting the magnitude and the flow of atmospheric water vapor. Yet, among the most important impacts of ARs is precipitation.

Question
Aside from anomalous moisture and moisture transport, what determines if an AR will cause a heavy precipitation event? (Choose all that apply.)
The correct answers are a, c, d, f.
Feedback:

Atmospheric lift plays an important role in converting AR moisture into precipitation. A major source of atmospheric lift is through orographic forcing. In the absence of significant orography, frontal boundaries (including outflow boundaries), instability, isentropic ascent, and upper–level disturbances can also contribute atmospheric lift. If there is no lifting mechanism, then the AR may not produce significant precipitation. Soil moisture and location of the rain–snow line are not directly related to the amount or cause of precipitation, but they can be important considerations in flood forecasting.
Excessive Precipitation » Duration of Precipitation
Question
To determine the duration of precipitation, which one of the following is most important for you consider?
The correct answer is d.
Feedback: The axis of an AR may propagate quickly through a particular area in a matter of hours or it may take many days. When an AR is propagating a large area of moderate accumulation is likely, yet when an AR is quasi–stationary, it is more likely to produce localized extreme accumulation. Answers a and b help determine the intensity of the precipitation, not its duration. Although c is a characteristic of an AR, it is independent of the duration.
AR propagation is closely tied to the atmospheric pattern and its evolution. Recall that ARs are often located immediately on the warm side of the jet, typically in the pre–frontal warm sector or warm conveyor belt of an extra–tropical cyclone. Therefore, the evolution of the mean jet and cyclogenesis within the pattern are good indicators of AR development and evolution.
When forecasting for short time scales, the satellite–derived products are critical for forecasting IWV magnitude, moisture transport, and propagation. Using precipitable water and moisture transport animations from NWP output can be useful when forecasting for medium– to long–range impacts.
Exercises
Exercises » Exercise 1
The following exercise, based on a real AR case, will show you the advantages of newer microwave satellite products for forecasting ARs and their impacts.
Examine the following hourly water vapor loop below ending at 1200 UTC, 20 Sep 2011.
Now, using the pen tool, outline the area below where you believe an AR will be impacting land areas.
| Tool: | Tool Size: | Color: |
|---|---|---|
|
|
Next, examine the integrated water vapor loop below.
Compare features with the WV image above. Then, using the pen tool, outline the area where you believe an AR will be impacting land areas.
| Tool: | Tool Size: | Color: |
|---|---|---|
|
|
Feedback: This landfalling AR impacted mainly portions of Canada's Central British Columbia coast and Alaska's panhandle.
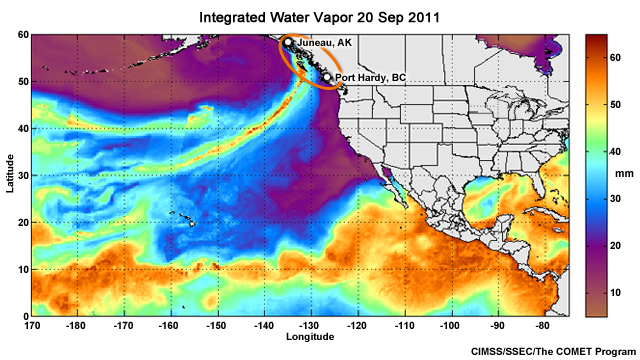
The WV imagery is often good at indicating the general area where an AR may be present, and that is true on 20 Sep 2011 in southwestern Canada. But it typically will lead you to highlight a broader area of impact than the more complete representation of atmospheric moisture from the IWV imagery. Thus, your outline from the WV exercise was probably larger than the outline you made using the IWV. However, the size of the area you indicated with the IWV imagery was likely influenced by the threshold of IWV that you chose.
If you chose a threshold of 20 mm, as suggested earlier, then you probably drew a broader area than if you chose a threshold of 40 or 50 mm.
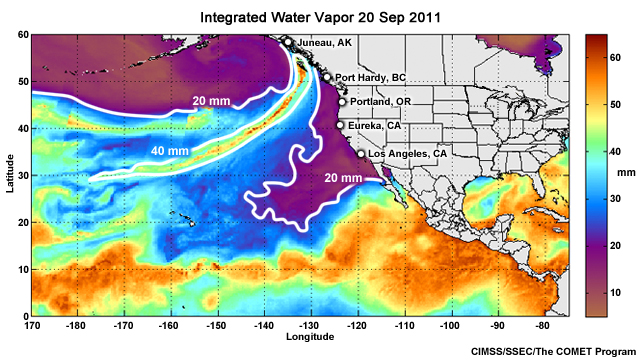
Choosing a threshold of 20 mm is not incorrect, yet in this case, because the IWV magnitude was so great, the higher thresholds would help provide a narrower focus for the greatest impacts. The AR in reality is a continuous river from the Asian side of the tropical Pacific, but that is very hard to tell from the WV imagery alone. IWV helps you focus in on the area of greatest precipitable water.
Within the AR there may be areas of very high IWV values, or IWV surges, that represent an enhanced area of the AR. These pulses or surges are often linked to short–wave troughs and associated frontal waves moving through the base of the large–scale trough/cyclone.
Exercises » Exercise 1 » Next IWV Pulse
Question 1
At what coordinates is the leading edge of another high IWV pulse that may impact the coastline? (Choose the best answer.)
The correct answer is a.
Feedback: If we concentrate on IWV values greater than 40 mm, there is another pulse at 45°N and 150°W, and still another that may be developing around 170°E and 45°N. When animated (not shown), the AR near 150°W appears to be moving toward the coast.
Question 2
Where will this moisture likely make landfall in the next 24 hours? (Choose the best answer.)
The correct answer is b.
Feedback: The IWV animations hint that the next surge in the AR may impact the Southwestern Canadian Coast, including Port Hardy, as well. But keep in mind that we are within about 24 hours of a potential landfall. For longer lead times, the IWV imagery will be most useful when used in combination with forecast data from NWP.
Question 3
Is this a strong, or a weak event? (Choose the best answer.)
The correct answers are a, c.
Feedback: If you chose a, you likely inferred that there is strong moisture transport. In addition, you may be familiar with the climate and therefore know that the IWV values are anomalously high.
If you answered c, you likely wanted to see a moisture transport product. You may have also want to check the magnitude against the average precipitable water values.
The values of IVT for this case were between 1000 and 1500 kg m–1 s–1. These are very high values for IVT. IWV easily exceeded 30 mm, also a high value for this location and time of year.
Exercises » Exercise 1 » NWP Products
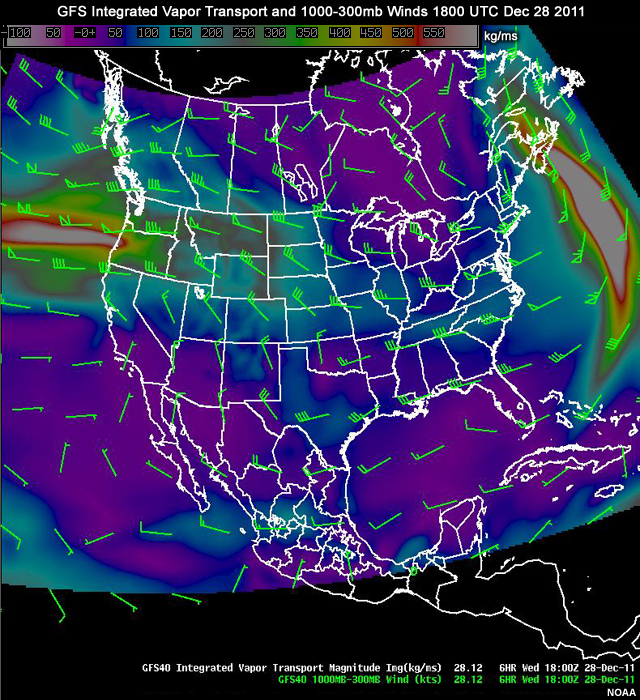
Let's look at some NWP products that can be used with the satellite data in the medium– and long–range forecast. There are a number of NWP products that might be considered with satellite data to forecast the AR evolution such as the location of the upper jet or an extratropical cyclone. The two GFS products that we will present here are the precipitable water and the IVT. Examine these two products from the current time (12z 20 Sep) through 18z 23 Sep 2011.
Given that we have established the very anomalous values of moisture and moisture transport, take note of areas with > 40 mm of precipitable water and > 1000 kg m–1 s–1 of IVT.
Question
From the forecast animation, do you think the AR pulse seen at 40°N, 150°W at 1200 UTC 20 Sep will reach the coast near Vancouver Island as the IWV animation hints? (Choose the best answer.)
The correct answer is a.
Feedback: The next surge in the AR merges with the main axis and impacts the coast around Vancouver Island on 21 Sep 2011. The forecasts that you looked at on GFS PW show this evolution.
Question
Review the IVT and NWP PW loops again.
Using the NWP PW and IVT, will the developing AR pulse at 170°E longitude (visible on graphic) continue in the trans–Pacific AR, and if so, will it impact the coast? (Choose the best answer.)
The correct answer is c.
Feedback: The AR pulse near 170°E on 20 Sep 2011 is forecast to cross the Pacific and result in a continued strong AR with precipitable water values > 40 mm and IVT values > 1300 kg m–1 s–1. Forecasted landfall is near Vancouver Island on 23 Sep 2011.
On the IWV animation through September 23, the AR pulse did cross the Pacific and impact Vancouver Island, BC.
An extended period of AR activity impacted the southwestern part of the Canadian province of British Columbia on 20–24 September 2011. Three distinct moisture surges impacted the same general area because the AR axis moved very little (slight southward shift).
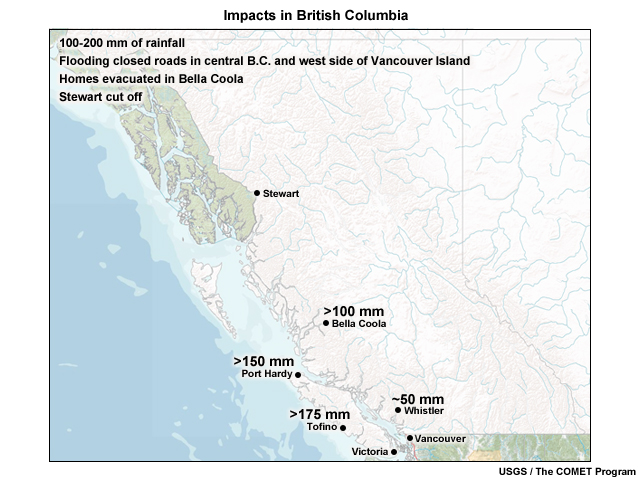
Nearly 200 mm of precipitation fell in some areas, with over 100 mm in a single day along the western coast of Vancouver Island and along the mainland coast just north of Vancouver Island. Flooding closed off many roads and forced evacuations in Stewart and Bella Coola, BC Canada. Even inland, Whistler, BC, received 50 mm of rainfall. The AR was diagnosed with IWV animations, and when combined with NWP information, one could readily anticipate a long–duration precipitation event.
Exercises » Exercise 2
The following exercise, based on a real AR case, will show you the advantages of newer microwave satellite products for forecasting ARs and their impacts.
Are there any areas where an AR may impact North America? View the loop below.
Now use the drawing tool to outline these areas of possible AR impact on North America.
| Tool: | Tool Size: | Color: |
|---|---|---|
|
|
Feedback:
This is the IWV animation through 0000 UTC 02 May.
Exercises » Exercise 2 » Precipitation Forecast
Question 1
What other information may be useful for precipitation forecasting at this time? (Choose all that apply.)
The correct answers are a, b, c, d.
Feedback: All of these can be correct answers if you don't already know that the area is relatively flat. Orographic forcing is not strong, unlike the western coast of North America, since the terrain of the U.S. Gulf Coast is rather flat. Inland penetration of the AR will assist with delineating areas at risk for intense precipitation rates. Synoptic weather patterns will aid in forecasting the general AR movement and evolution. Moisture transport could resupply the AR which is useful information for forecasting total precipitation.
Moore et al., 2012 performed an excellent synoptic analysis of this event. Here is the 250 mb geopotential heights and isotachs for 0000 UTC 01 May and 1200 UTC 02 May.
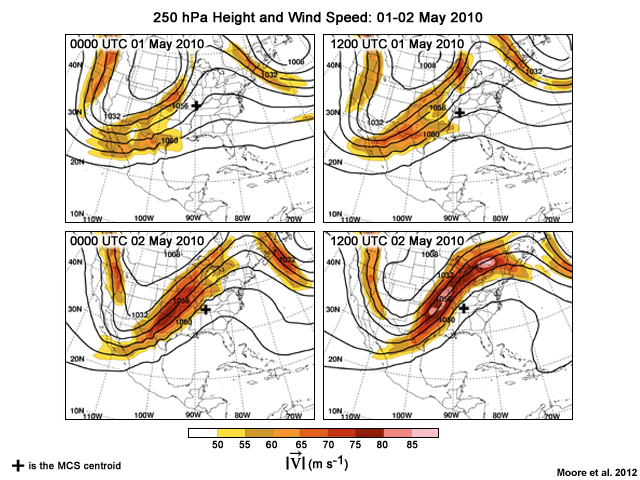
These indicate a strengthening quasi–stationary trough over western North America. This suggests that the position of the AR is not likely to shift rapidly. The + indicates the position of the Mesoscale Convective System (MCS) centroid at the time of the chart.
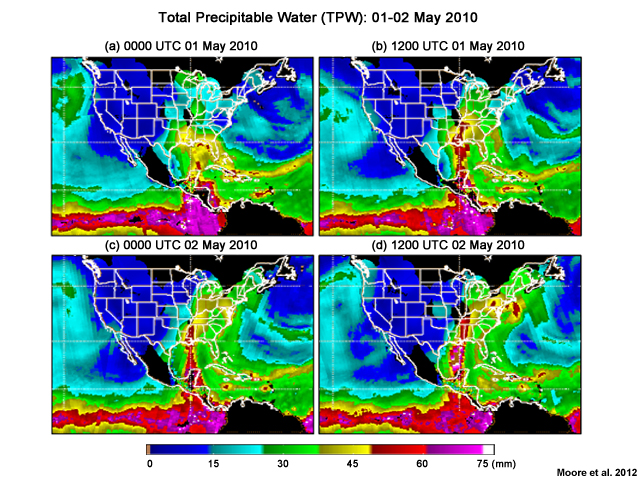
To analyze the AR's inland penetration, one needs precipitable water over land. The TPW product provides this via GPS and GOES IR Sounder data. We can see the AR strengthens between 0000 UTC 01 May and 1200 UTC 02 May. Also > 20 mm TPW reaches all the way to the Great Lakes. In this case, a larger threshold may be warranted. If we use TPW > 40 mm, we see an impressive inland penetration of at least 950 km, to the lower Ohio River valley.
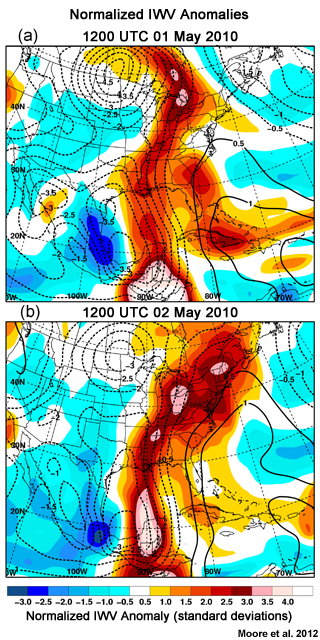
The anomalous nature of the TPW is shown in this product of the IWV anomaly for 1200UTC 02 May 2010. IWV values of near 3 standard deviations extend from the Gulf of Mexico all the way to the Great Lakes region. These values suggest the potential for intense rainfall rates.
The IVT images from these times show very strong transport of moisture from the U.S. Gulf Coast all the way to the U.S.–Canadian border in the Great Lakes region. In fact IVT > 1000 kg m–1 s–1 extends at least 950 km inland, similar to the TPW > 40 mm.

Question 2
Where would heavy precipitation most likely occur with respect to this AR? (Choose the best answer.)
The correct answer is c.
Feedback: The best answer is c, because we need a lifting mechanism along the path of the AR to convert moisture into precipitation. The most intense precipitation won't necessarily cover the entire length of the AR or happen at the northern extent if there is a stronger lifting mechanism somewhere else along the AR. Soil moisture is important for assessing the flood threat, but not for determining where the most intense rainfall will occur.
Remember that the AR represents a narrow region of anomalous moisture and moisture transport but this does not guarantee excessive precipitation. Some physical process within the atmosphere is required to help convert the moisture into precipitation.
Exercises » Exercise 2 » Atmospheric Lift
Question
Ruling out orography, what processes may help convert the moisture into rainfall? (Choose all that apply.)
The correct answers are a, b, c, d.
Feedback: All of these are possible answers. But the frictional convergence at the coast is probably the least likely to have a major impact in this case. It was instability combined with thunderstorm–generated outflows which resulted in quasi–stationary mesoscale convective systems (MCSs) in the axis of the AR.
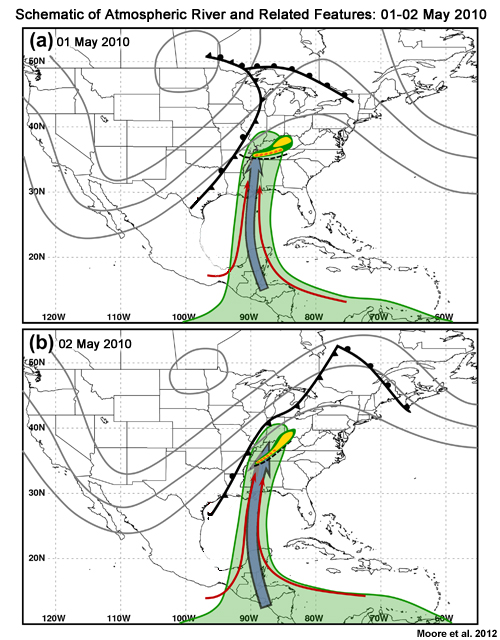
Moore et al. (2012) developed a schematic of the AR and the features that resulted in excessive AR rainfall. In these two schematics for 01 May and 02 May 2010, the gray contours are the 250 mb heights, the bold black show the standard surface front depictions, the red arrows show the 850 mb streamlines, the light green shading depicts IWV values >45 mm, the black dashed lines show the position of the convectively–generated outflow boundary, and the dark green, yellow, and orange shading indicate the 20, 35, and 50 dBZ radar echoes respectively. The thick blue arrow shows the axis of the AR.
Exercises » Exercise 2 » Resulting Precipitation
Two distinct periods of excessive rainfall resulted from two different MCSs: one that began about 0600 UTC 01 May and lasted about 18 hours, and the second that formed about 0900 UTC 02 May and continued for about 15 hours.
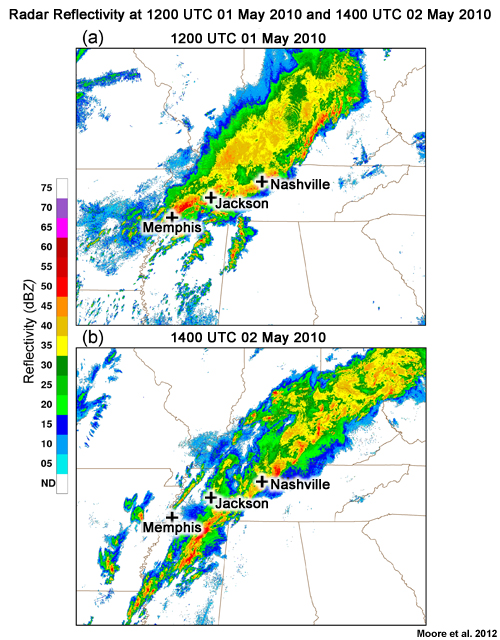
The two MCSs each produced excessive rainfall but had slightly different outflow boundary orientations. Some localities were within the most intense part of both MCSs and received 200–400 mm of rainfall during the period.
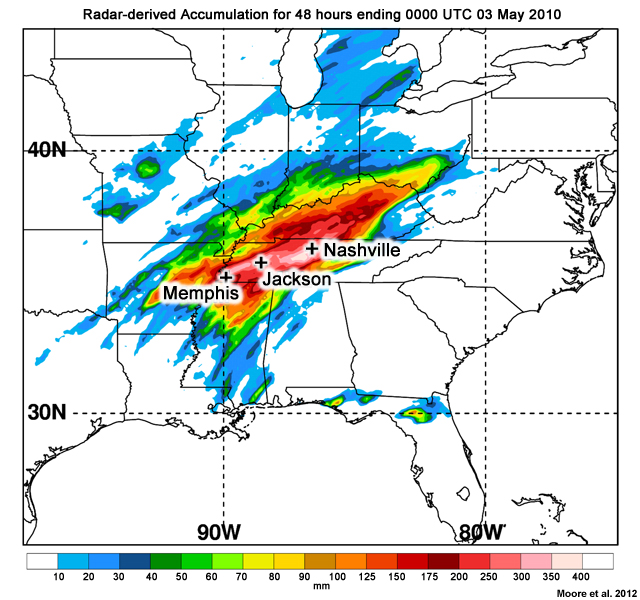
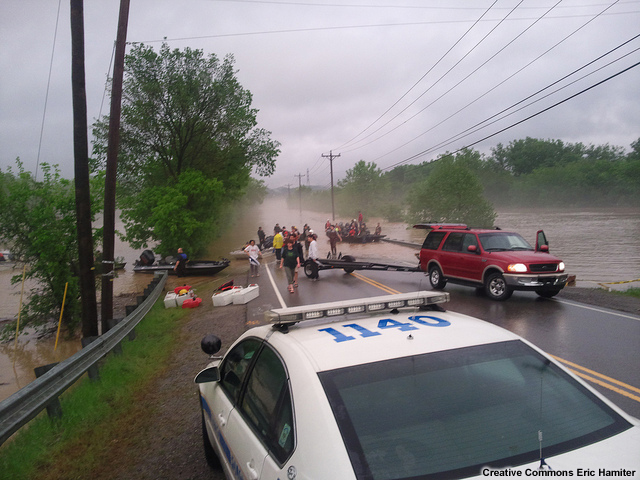
Major flooding occurred throughout much of the western and central parts of the U.S. states of Tennessee and Kentucky. Nashville, Tennessee was devastated by flash flooding during the intense rainfall and then historic river flooding along the Cumberland River.
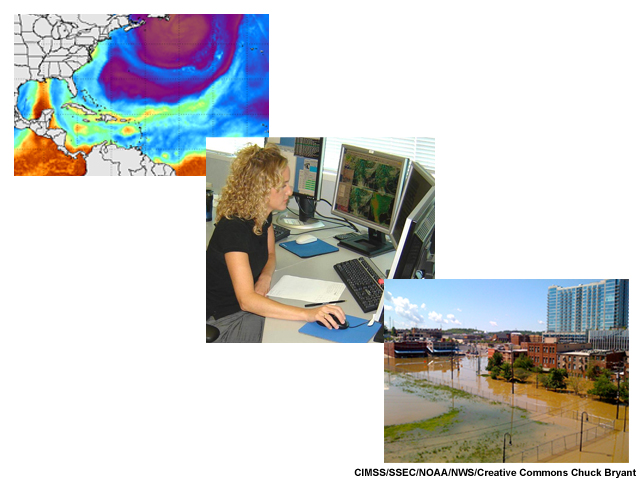
Once again, satellite–derived information provided excellent diagnosis, and when combined with NWP forecasts and mesoscale analyses, the satellite information is an important part of vital short– and medium–range forecasts.
Summary
Atmospheric Rivers (ARs) are an important phenomenon for transporting moisture from the tropics poleward. They cause the majority of moisture transport out of the tropics globally. ARs are defined by anomalous moisture and strong moisture transport. ARs are concentrated into long narrow corridors, typically 400–600 km wide and more than 2000 km long.
Satellite–based integrated water vapor (IWV) and total precipitable water (TPW) products are very useful for diagnosing an AR. When used with NWP guidance, the satellite tools can help the forecaster provide detail about magnitude, timing, and location of AR impacts.
ARs move, or stall, in response to the overall weather systems, and are typically located ahead of mid–latitude troughs. When precipitation is enhanced by a strong lifting mechanism, ARs can produce excessive precipitation. Accounting for AR magnitude, evolution, and propagation is integral to high–end precipitation forecasts. Satellite tools are indispensible for short–range assessment and forecasting of ARs.
References & Resources
References
- Kidder, Stanley Q., Andrew S. Jones, 2007: A blended satellite total precipitable water product for operational forecasting. J. Atmos. Oceanic Technol., 24, 74–81.
- Moore, Benjamin J., Paul J. Neiman, F. Martin Ralph, Faye E. Barthold, 2012: Physical Processes Associated with Heavy Flooding Rainfall in Nashville, Tennessee, and Vicinity during 1–2 May 2010: The Role of an Atmospheric River and Mesoscale Convective Systems*. Mon. Wea. Rev., 140, 358–378.
- Neiman, P. J., F. M. Ralph, G. A. Wick, J. Lundquist, and M. D. Dettinger, 2008: Meteorological characteristics and overland precipitation impacts of atmospheric rivers affecting the West Coast of North America based on eight years of SSM/I satellite observations. J. Hydrometeor., 9, 22–47
- Ralph, F. Martin, Paul J. Neiman, Gary A. Wick, 2004: Satellite and CALJET Aircraft Observations of Atmospheric Rivers over the Eastern North Pacific Ocean during the Winter of 1997/98. Mon. Wea. Rev., 132, 1721–1745.
- Ralph, F. Martin, Paul J. Neiman, Richard Rotunno, 2005: Dropsonde Observations in Low–Level Jets over the Northeastern Pacific Ocean from CALJET–1998 and PACJET–2001: Mean Vertical–Profile and Atmospheric–River Characteristics. Mon. Wea. Rev., 133, 889–910.
- Ralph, F. M., P. J. Neiman, G. A. Wick, S. I. Gutman, M. D. Dettinger, D. R. Cayan, and A. B. White, 2006: Flooding on California's Russian River: Role of atmospheric rivers. Geophys. Res. Lett., 33, L13801.
- Ralph, F. Martin, Paul J. Neiman, George N. Kiladis, Klaus Weickmann, David W. Reynolds, 2011: A Multiscale Observational Case Study of a Pacific Atmospheric River Exhibiting Tropical–Extratropical Connections and a Mesoscale Frontal Wave. Mon. Wea. Rev., 139, 1169–1189.
- Zhu, Y., and R. E. Newell, 1998: A proposed algorithm for moisture fluxes from atmospheric rivers. Mon. Wea. Rev, 126, 725–735.
Resources
- To see real–time Integrated Water Vapor imagery and animations visit: http://tropic.ssec.wisc.edu/real–time/mimic–tpw/global/main.html
- To see real–time TPW imagery and animations, go to http://www.ospo.noaa.gov/Products/bTPW/index.html
- NOAA Earth System Research Laboratory: http://www.esrl.noaa.gov/psd/atmrivers/
- The Percentage of TPW normal, or TPW anomaly: http://www.ospo.noaa.gov/Products/bTPW/TPW_Animation.html?product=GLOBAL_PCT
- The 30–yr precipitable water climatologies for upper–air stations in the United States can be found here: http://www.spc.noaa.gov/exper/soundingclimo/
Contributors
COMET Sponsors
Special thanks go to Phil Chadwick (retired MSC forecaster) for his knowledge and vision to make this series a reality. Without his talents, artistic style, and passion for this subject, this series would not have come to fruition. Phil, your forecasting skills from just water vapour imagery are legendary, and your calm demeanor and desire to teach others has touched forecasters more than you know. Thank you for being the catalyst for this movement.
MetEd and the COMET® Program are a part of the University Corporation for Atmospheric Research's (UCAR's) Community Programs (UCP) and are sponsored by NOAA's National Weather Service (NWS), with additional funding by:
- Bureau of Meteorology of Australia (BoM)
- Bureau of Reclamation, United States Department of the Interior
- European Organisation for the Exploitation of Meteorological Satellites (EUMETSAT)
- Meteorological Service of Canada (MSC)
- NOAA's National Environmental Satellite, Data and Information Service (NESDIS)
- NOAA's National Geodetic Survey (NGS)
- Naval Meteorology and Oceanography Command (NMOC)
- U.S. Army Corps of Engineers (USACE)
To learn more about us, please visit the COMET website.
Project Contributors
Senior Project Manager
- Dr. Greg Byrd — UCAR/COMET
Project Lead
- Matthew Kelsch — UCAR/COMET
Instructional Design
- Bryan Guarente — UCAR/COMET
Principal Science Advisors
- Dr. Benjamin Moore — Cooperative Institute for Research in Environmental Sciences, University of Colorado
- Paul Neiman — NOAA Earth Systen Research Laboratory
- Dr. Marty Ralph — NOAA Earth System Research Laboratory
Graphics/Interface Design
- Steve Deyo — UCAR/COMET
Multimedia Authoring
- Bryan Guarente — UCAR/COMET
COMET Staff, Winter 2012
Director
- Dr. Timothy Spangler
Administration
- Elizabeth Lessard, Administration and Business Manager
- Lorrie Alberta
- Michelle Harrison
- Hildy Kane
Hardware/Software Support and Programming
- Tim Alberta, Group Manager
- Bob Bubon
- Ken Kim
- Mark Mulholland
- Victor Taberski, Student Assistant
- Chris Webber, Student Assistant
- Malte Winkler
Instructional Designers
- Dr. Patrick Parrish, Senior Project Manager
- Dr. Alan Bol
- Maria Frostic
- Lon Goldstein
- Bryan Guarente
- Dr. Vickie Johnson
- Tsvetomir Ross-Lazarov
- Marianne Weingroff
Media Production Group
- Bruce Muller, Group Manager
- Steve Deyo
- Dan Riter
- Carl Whitehurst
Meteorologists/Scientists
- Dr. Greg Byrd, Senior Project Manager
- Wendy Schreiber-Abshire, Senior Project Manager
- Dr. William Bua
- Patrick Dills
- Matthew Kelsch
- Dolores Kiessling
- Dr. Cody Kirkpatrick
- Dr. Arlene Laing
- Dave Linder
- Dr. Elizabeth Mulvihill Page
- Amy Stevermer
Spanish Translations
- David Russi
NOAA/National Weather Service - Forecast Decision Training Branch
- Anthony Mostek, Branch Chief
- Dr. Richard Koehler, Hydrology Training Lead
- Brian Motta, IFPS Training
- Dr. Robert Rozumalski, SOO Science and Training Resource (SOO/STRC) Coordinator
- Ross Van Til, Meteorologist
- Shannon White, AWIPS Training
Meteorological Service of Canada Visiting Meteorologists
- Phil Chadwick
- James Cummine
- Brad Snyder