Media Gallery
Media elements used in this module are protected by a variety of copyright licenses. Please use the "copyright terms" link associated with each item below for more information.
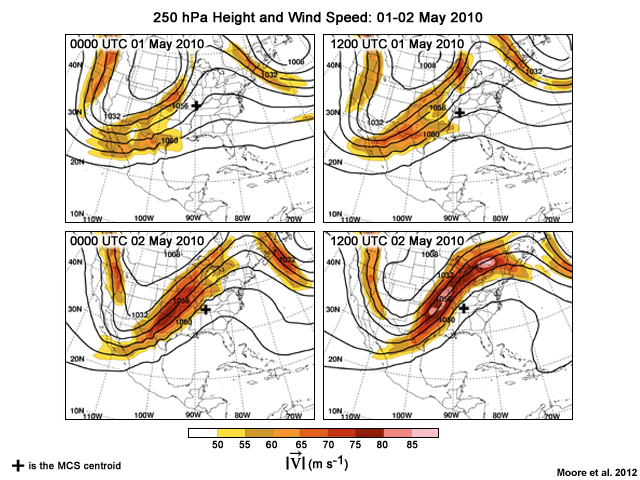
Description:
Four panels of 250 mb heights from 0000 UTC 01 May through 1200 UTC 02 May 2010, centered on Tennessee.
File Name:
01May10_250.jpg
Credits:
Moore et al. 2012
Copyright Terms:
COMET Standard Terms of Use

Description:
GFS-generated four-panel 1000-300 hPa Integrated Vapor Transport (IVT) for 0000 UTC 01 May 2010 through 1200 UTC 02 May 2010. The "+" is the location of the MCS centroid.
File Name:
01May10_IVT.jpg
Credits:
Moore et al. 2012
Copyright Terms:
COMET Standard Terms of Use
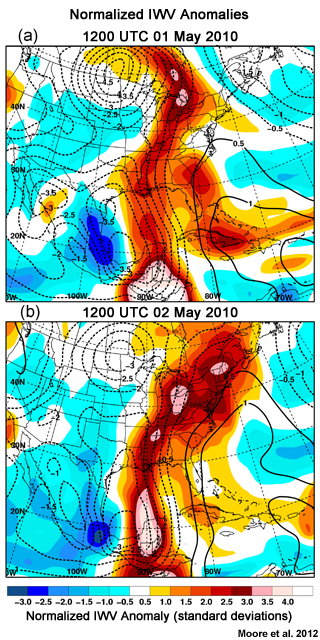
Description:
Normalized IWV anomaly at 1200 UTC 01 May 2010 and 1200 UTC 02 May 2010. The anomaly standard deviation is displayed as a color image. 850 hPa height anomalies are shown every 0.5 standard deviation in the contours (dashed lines are negative standard deviations)
File Name:
01May10_IWVanom.jpg
Credits:
Moore et al. 2012
Copyright Terms:
COMET Standard Terms of Use
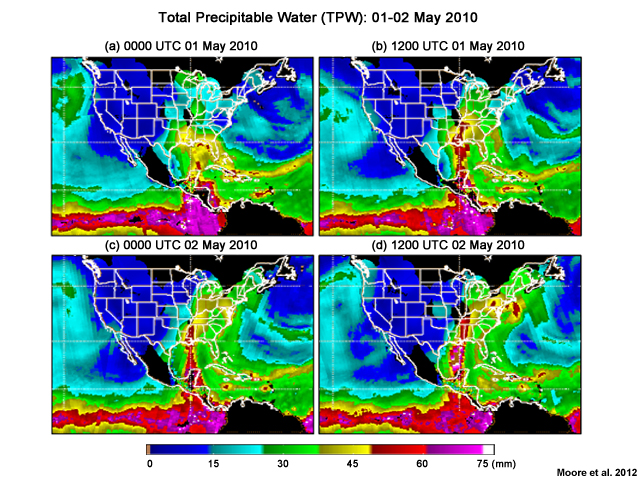
Description:
Four panels of Integrated Water Vapor (IWV) from 0000 UTC 01 May through 0000 UTC 03 May 2010, centered on Tennessee.
File Name:
01May10_IWVpanel.jpg
Credits:
Moore et al. 2012
Copyright Terms:
COMET Standard Terms of Use
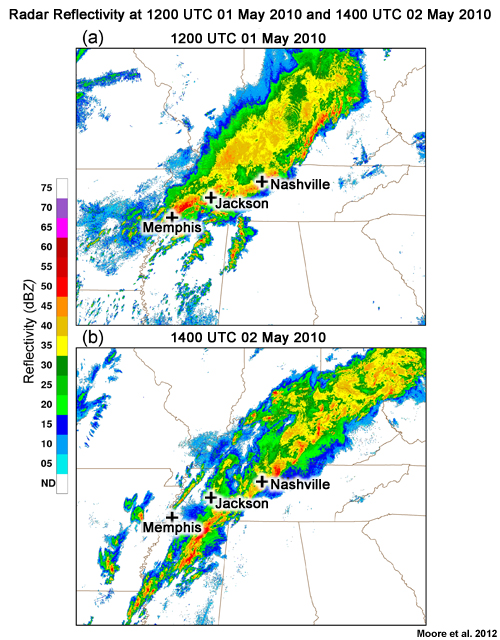
Description:
Radar reflectivity images across western Tennessee and vicinity at 1200 UTC 01 May 2010 and 1400 UTC 02 May 2010. Locations of Memphis, Jackson, and Nashville are denoted.
File Name:
01May10_radar.jpg
Credits:
Moore et al. 2012
Copyright Terms:
COMET Standard Terms of Use
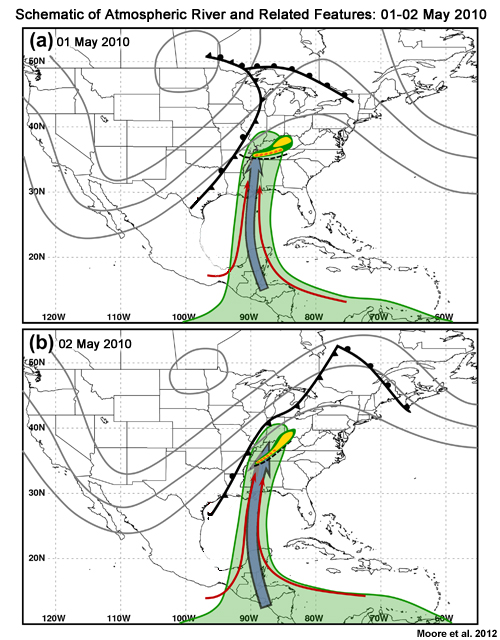
Description:
Schematic of the main features, including the AR, that lead to the Nashville flooding rains of 01-02 May 2010. The AR is shown as the blue arrow, the red arrows are the 850 hPa streamlines, the gray contours are the 250 hPa heights,the greens shading is the area with IWV > 45 mm. The dashed black line is the position of the convective outflow and the dark green, yellow, and orange represent radar reflectivity thresholds of 20, 35, and 50 dBZ respectively.
File Name:
02May10_AR_schematic.jpg
Credits:
Moore et al. 2012
Copyright Terms:
COMET Standard Terms of Use
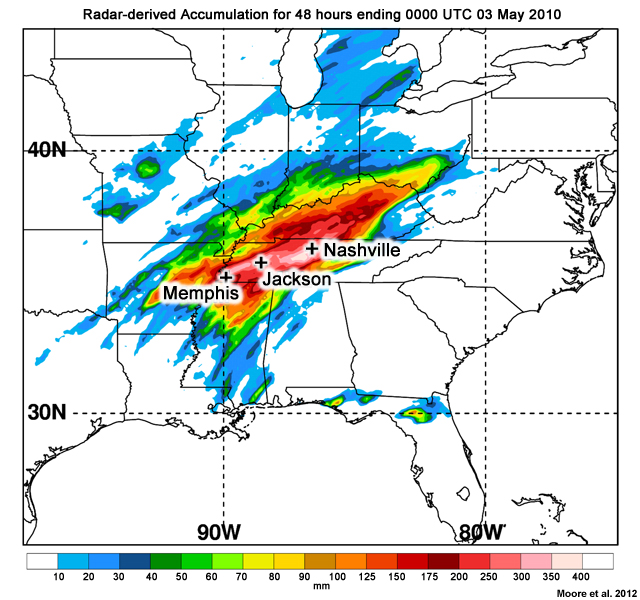
Description:
Radar accumulation from 0000 UTC 01 May 2010 through 0000 UTC 03 May 2010. Locations of Memphis, Jackson, and Nashville in Tennessee are denoted.
File Name:
02May10_radaracc.jpg
Credits:
Moore et al. 2012
Copyright Terms:
COMET Standard Terms of Use
![1927 flood: Photo of Thousand Foot channel when impounded flood waters broke through to the Pacific Ocean. The Coast Blvd. & P.E. [Pacific Electric] Railroad suffered extreme damage as shown.](media/graphics/1927_flood_damage.jpg)
Description:
1927 flood: Photo of Thousand Foot channel when impounded flood waters broke through to the Pacific Ocean. The Coast Blvd. & P.E. [Pacific Electric] Railroad suffered extreme damage as shown.
File Name:
1927_flood_damage.jpg
Credits:
Creative Commons Orange County Archives
Copyright Terms:
COMET Standard Terms of Use
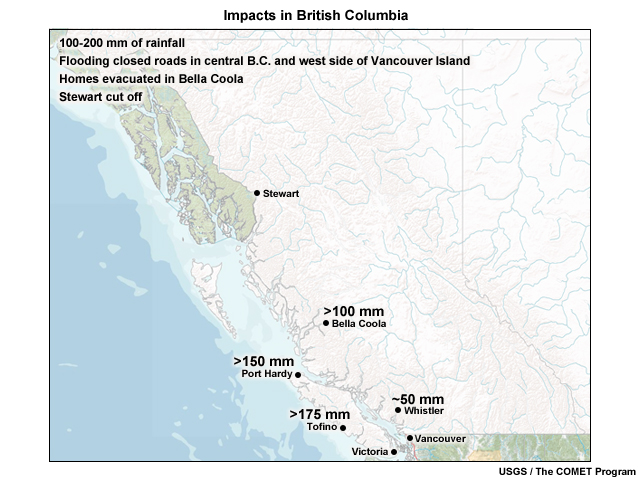
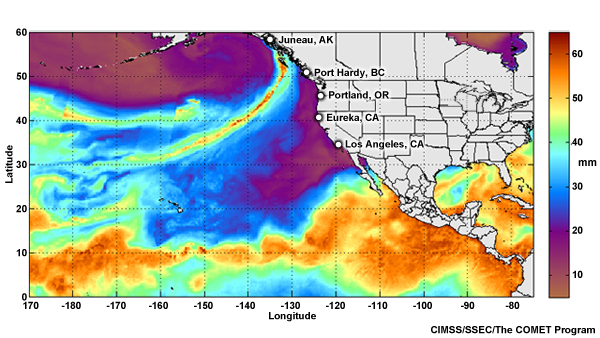
Description:
Precipitation totals and other impacts noted on a map of British Columbia for the September 20, 2011 case.
File Name:
AR_20Sep_2011_BC_impacts.jpg
Credits:
USGS / The COMET Program
Copyright Terms:
COMET Standard Terms of Use
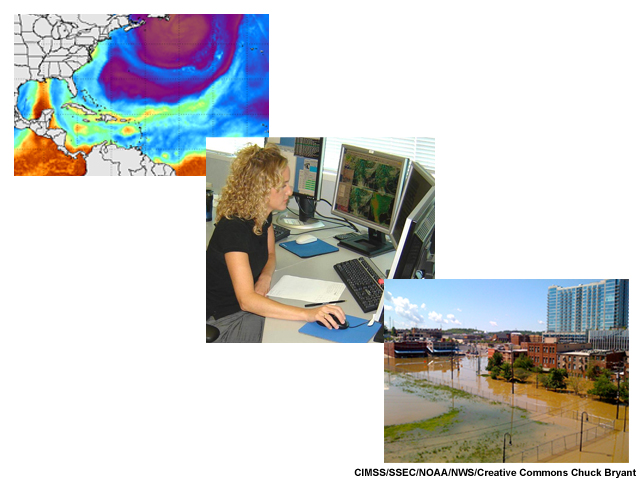
Description:
Three-panel mosaic: AR on integrated water vapor imagery, forecaster at desk, and impacts of flood in a major city.
File Name:
AR_3_panel_data_to_impact.jpg
Credits:
CIMSS/SSEC; NOAA/NWS; Creative Commons Chuck Bryant
Copyright Terms:
Creative Commons Attribution-Noncommercial-Share Alike 2.0 Generic
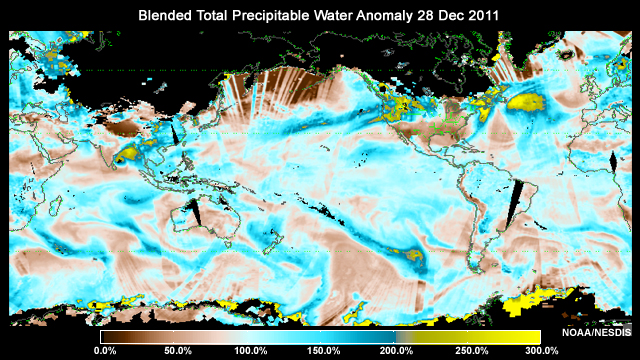
Description:
Percent of normal blended Total Precipitable Water product for December 28, 2011.
File Name:
AR_Dec28_12_PCT_Global.jpg
Credits:
NOAA/NESDIS
Copyright Terms:
COMET Standard Terms of Use
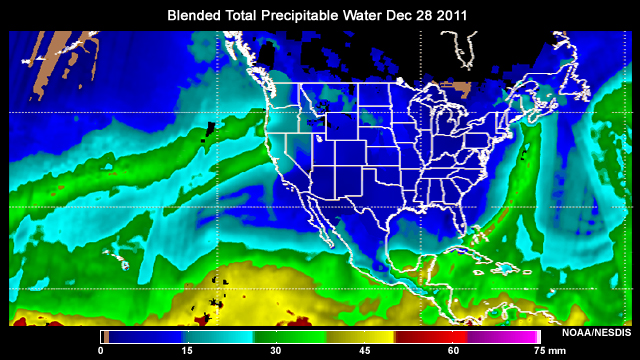
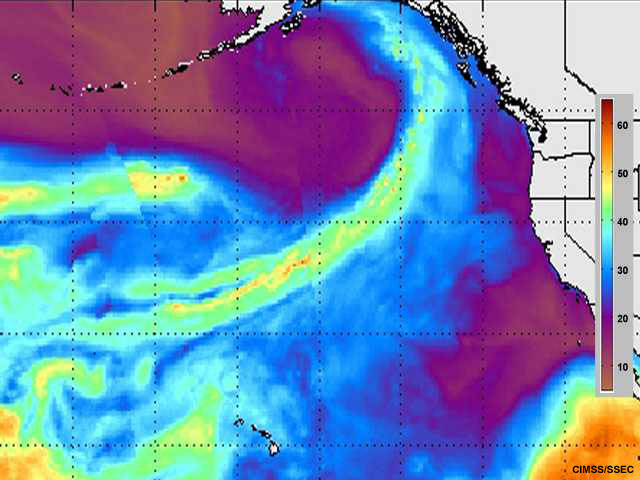
Description:
Total Precipitable Water (TPW) supernational map for December 28, 2011. Two moderate atmospheric rivers are found on this image that are impacting land. There is a meridionally oriented AR going into Nova Scotia and an AR going into Oregon at a 45 degree angle from the southwest. Both ARs have values approaching 40mm.
File Name:
AR_Dec28_12_TPW_Supernational.jpg
Credits:
NOAA/NESDIS
Copyright Terms:
COMET Standard Terms of Use
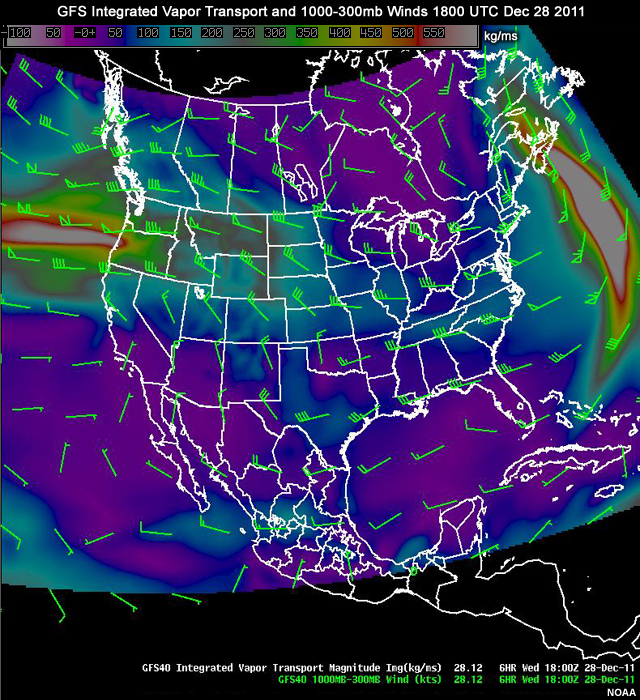
Description:
GFS Integrated Water Vapor Transport and 1000-300mb wind barbs for December 28, 2011. There are two areas of very high IVT: west to east off the coast of Oregon, and going south to north into Nova Scotia.
File Name:
AR_Dec28_2011_IVT.jpg
Credits:
NOAA
Copyright Terms:
COMET Standard Terms of Use
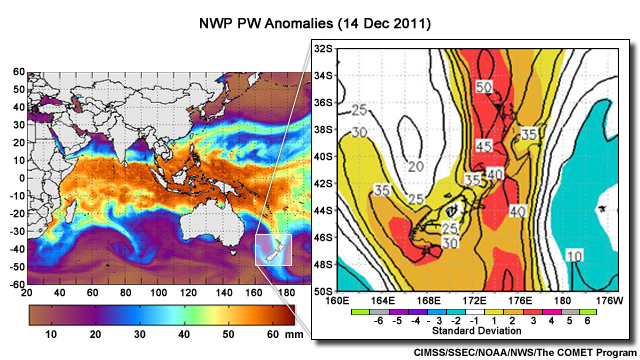
Description:
Numerical Weather Prediction precipitable water anomalies over New Zealand for December 14, 2011. The PW anomalies image is exploded from the global integrated water vapor image at the same time.
File Name:
AR_Global_inset_PW_Anomaly.jpg
Credits:
CIMSS/SSEC/NOAA/NWS/The COMET Program
Copyright Terms:
COMET Standard Terms of Use

Description:
Global Integrated Water Vapor (IWV) animation (hourly) for December 26 through December 28, 2011 centered over the Pacific Ocean.
File Name:
AR_Global_IWV_Dec_28_2011_0001.htm
Credits:
CIMSS/SSEC
Copyright Terms:
COMET Standard Terms of Use

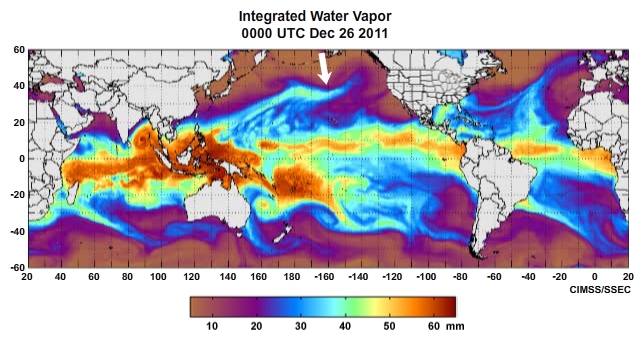
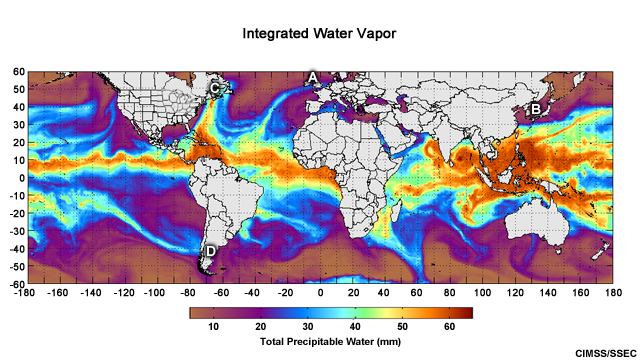
Description:
Global integrated water vapor image indicating all the atmospheric rivers present on December 28, 2011.
File Name:
AR_Global_IWV_Dec_28_2011_feedback.jpg
Credits:
CIMSS/SSEC/The COMET Program
Copyright Terms:
COMET Standard Terms of Use
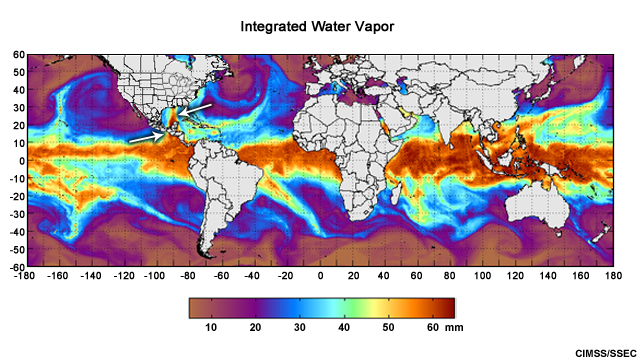
Description:
Global integrated water vapor from December 28, 2011 with arrows pointing out the long AR path over the Pacific Ocean originating from 20 N, 160 E and the meridional AR in the middle of the Atlantic Ocean.
File Name:
AR_Global_IWV_Dec_28_2011_long_v_merid_0001.htm
Credits:
CIMSS/SSEC
Copyright Terms:
COMET Standard Terms of Use
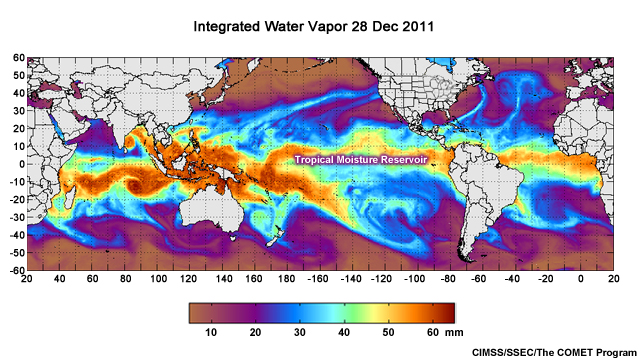
Description:
Global integrated water vapor image from December 28, 2011. Highlighted across the tropics is the "Tropical Moisture Reservoir".
File Name:
AR_Global_IWV_Dec_28_2011_reservoir.jpg
Credits:
CIMSS/SSEC/The COMET Program
Copyright Terms:
COMET Standard Terms of Use
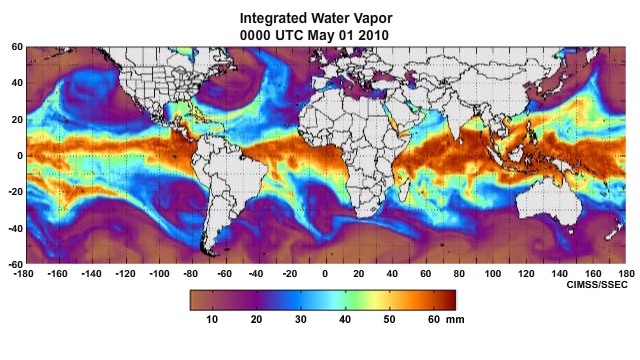
Description:
Integrated Water Vapor image
File Name:
AR_Global_IWV_May01_2010_annotated.jpg
Credits:
CIMSS/SSEC
Copyright Terms:
COMET Standard Terms of Use
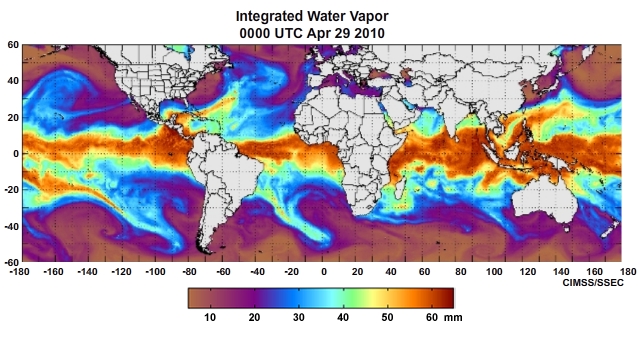
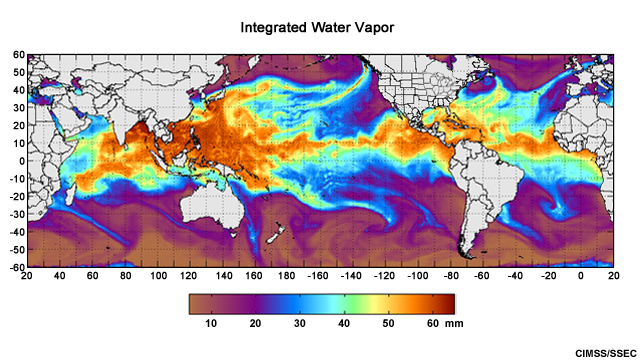
Description:
Global Integrated Water Vapor (IWV) animation (hourly) for April 29 through May 1, 2010 centered over the Pacific Ocean.
File Name:
AR_Global_IWV_May01_2010_drawing_0001.htm
Credits:
CIMSS/SSEC
Copyright Terms:
COMET Standard Terms of Use
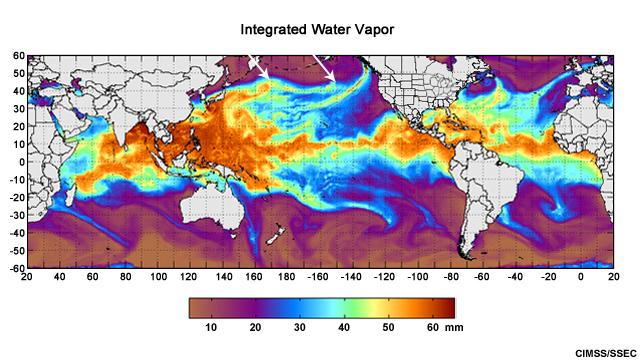
Description:
Integrated Vapor Transport (IVT) animation (hourly) for May 1 through May 2, 2010 centered over the Pacific Ocean.
File Name:
AR_Global_IWV_May01_2010_drawing_feedback_0001.htm
Credits:
CIMSS/SSEC
Copyright Terms:
COMET Standard Terms of Use
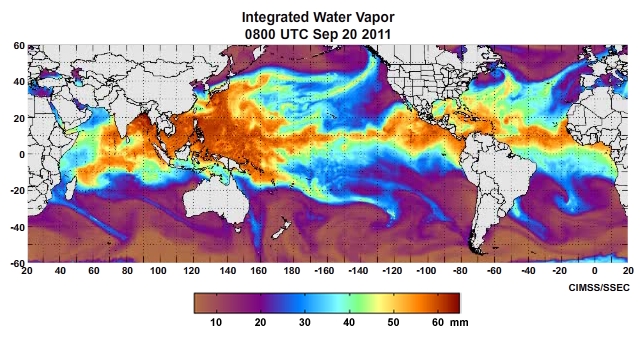
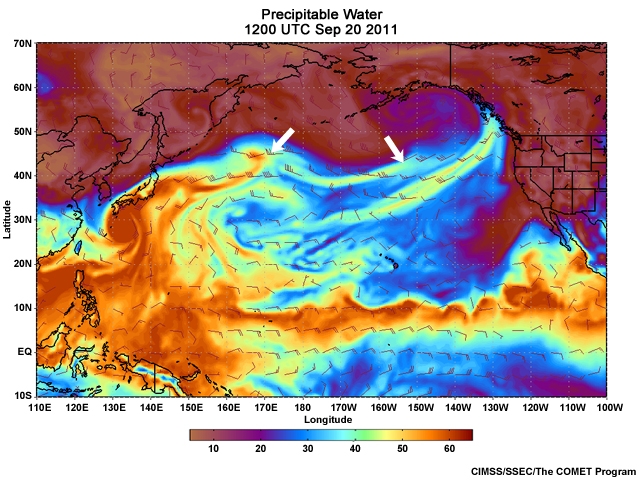
Description:
IWV image for question
File Name:
AR_Global_IWV_Sep20_2011_12z.jpg
Credits:
CIMSS/SSEC
Copyright Terms:
COMET Standard Terms of Use
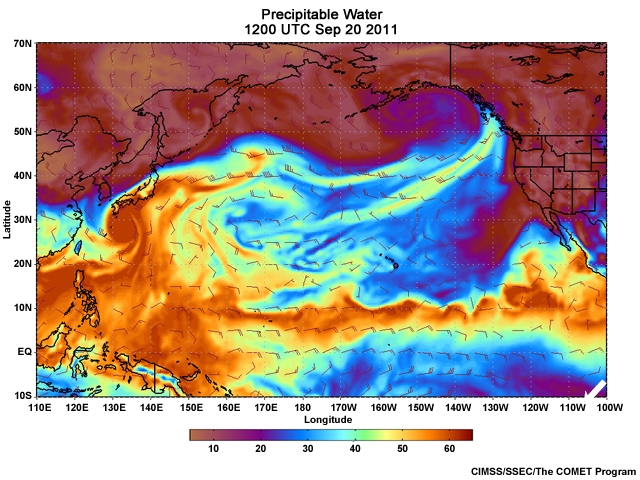
Description:
IWV with arrows showing possible next surge AR surge.
File Name:
AR_Global_IWV_Sep20_2011_12z_next_surge.jpg
Credits:
CIMSS/SSEC
Copyright Terms:
COMET Standard Terms of Use
Description:
Global integrated water vapor from December 28, 2011 with arrows pointing out the long AR path over the Pacific Ocean originating from 20 N, 160 E and the meridional AR in the middle of the Atlantic Ocean.
File Name:
AR_Global_IWV_Sep21_2011_loop_0001.htm
Credits:
CIMSS/SSEC
Copyright Terms:
COMET Standard Terms of Use
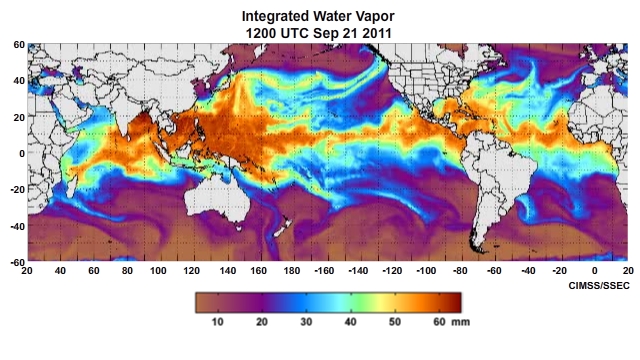
Description:
Global Integrated Water Vapor (IWV) animation (hourly) for September 21 through September 23, 2011 centered over the Pacific Ocean.
File Name:
AR_Global_IWV_Sep23_2011_loop_0001.htm
Credits:
CIMSS/SSEC
Copyright Terms:
COMET Standard Terms of Use
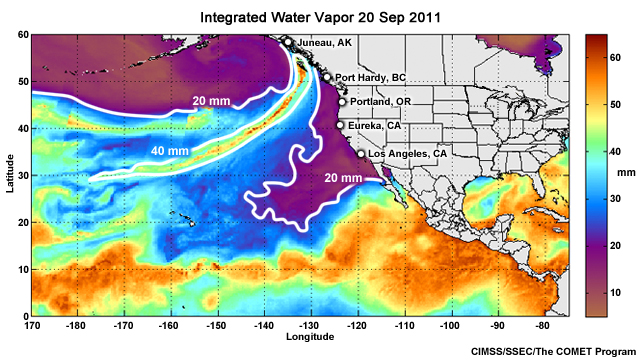
Description:
Integrated Water Vapour with locations that could be affected by an AR.
File Name:
AR_IWV_Sep20_2011_locations.jpg
Credits:
CIMSS/SSEC/The COMET Program
Copyright Terms:
COMET Standard Terms of Use
Description:
Integrated Water Vapor image
File Name:
AR_Nov4_2010_Global_quiz_labels.jpg
Credits:
CIMSS/SSEC
Copyright Terms:
COMET Standard Terms of Use
Description:
Integrated Water Vapor image
File Name:
AR_Nov4_2010_NorAtl_quiz.jpg
Credits:
CIMSS/SSEC
Copyright Terms:
COMET Standard Terms of Use

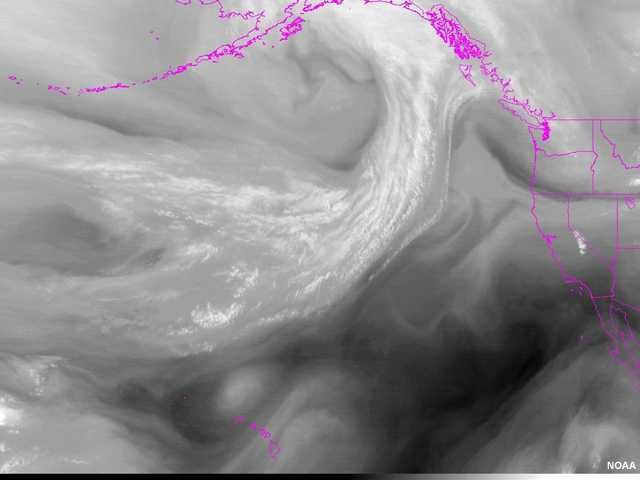
Description:
An atmospheric river case from November 7, 2006 as seen on an SSM/I Composite of integrated water vapor. A long filament of tropical moisture extends from 15N, 175W (west of Hawaii) northeast to 45N, 125W (Washington/Oregon coast). Values within the atmospheric river are upwards of 4 to 5.5 centimeters. In the tropics, values extend upwards toward 7cm, while in the north Pacific Ocean, the values are typically around 1cm or less. As the atmospheric river extends northeastward the width shrinks. Image has no scale to determine actual width.
File Name:
AR_Nov7_2006_IWV_without_labels.jpg
Credits:
Ralph et al. 2011
Copyright Terms:
COMET Standard Terms of Use
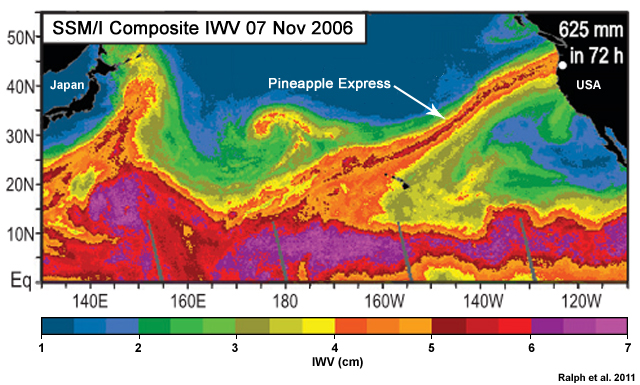
Description:
An atmospheric river case from November 7, 2006 as seen on an SSM/I Composite of integrated water vapor. A long filament of tropical moisture extends from 15N, 175W (west of Hawaii) northeast to 45N, 125W (Washington/Oregon coast). Values within the atmospheric river are upwards of 40 to 55 millimeters. In the tropics, values reach toward 70 mm, while in the north Pacific Ocean, the values are typically around 10 mm or less. As the atmospheric river extends northeastward the width shrinks. Image has no scale to determine actual width. The atmospheric river is labeled as a "Pineapple Express".
File Name:
AR_Nov7_2006_pineapple_express.jpg
Credits:
Ralph et al. 2011
Copyright Terms:
COMET Standard Terms of Use
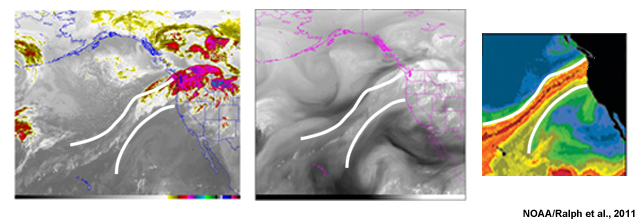
Description:
A horizontal three-panel image of the infrared satellite imagery, water vapor satellite imagery, and total precipitable water over the Pacific Ocean for the same time on Nov 7, 2006. Outlined on each image is the 20mm precipitable water threshold from the TPW image.
File Name:
AR_Nov7_2006_WV_IR_IWV.jpg
Credits:
NOAA/Ralph et al., 2011
Copyright Terms:
COMET Standard Terms of Use
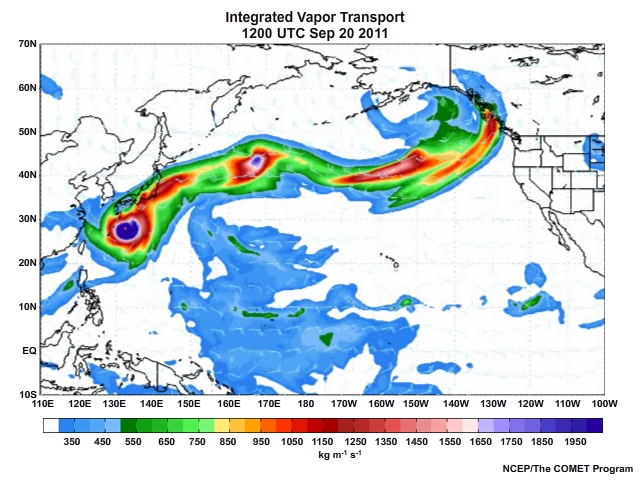
Description:
Integrated Vapor Transport (IVT) animation (every 3 hours) for September 20 through September 23, 2011 centered over the Pacific Ocean.
File Name:
AR_Pacific_IVT_Sep23_2011_loop_0001.htm
Credits:
NCEP/The COMET Program
Copyright Terms:
COMET Standard Terms of Use
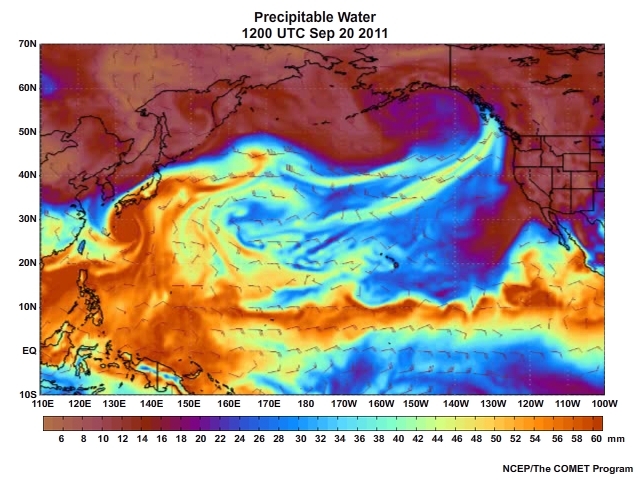
Description:
Precipitable Water (PW) animation (every 3 hours) for September 20 through September 23, 2011 centered over the Pacific Ocean.
File Name:
AR_Pacific_PW_Sep23_2011_loop_0001.htm
Credits:
NCEP/The COMET Program
Copyright Terms:
COMET Standard Terms of Use
Description:
Precipitable Water (PW) animation (every 3 hours) for September 20 through September 23, 2011 centered over the Pacific Ocean.
File Name:
AR_Pacific_PW_Sep23_2011_loop_annotated_0001.htm
Credits:
NCEP/The COMET Program
Copyright Terms:
COMET Standard Terms of Use
Description:
Precipitable Water (PW) animation (every 3 hours) for September 20 through September 23, 2011 centered over the Pacific Ocean.
File Name:
AR_Pacific_PW_Sep23_2011_loop_annotated2_0001.htm
Credits:
NCEP/The COMET Program
Copyright Terms:
COMET Standard Terms of Use
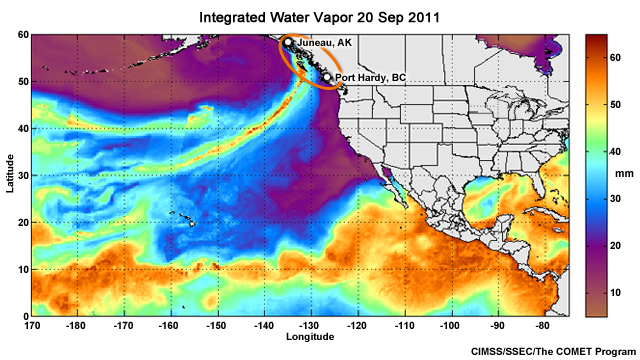
Description:
Integrated Water vapor, 20 Sep. 2011, with 20 and 40 mm threshold areas outlined.
File Name:
AR_Sep20_2011_20_v_40mm.jpg
Credits:
CIMSS/SSEC/The COMET Program
Copyright Terms:
COMET Standard Terms of Use
Description:
IWV, 20 Sep. 2011, with area impacted by AR highlighted.
File Name:
AR_Sep20_2011_AR_forecast_impacts.jpg
Credits:
CIMSS/SSEC/The COMET Program
Copyright Terms:
COMET Standard Terms of Use
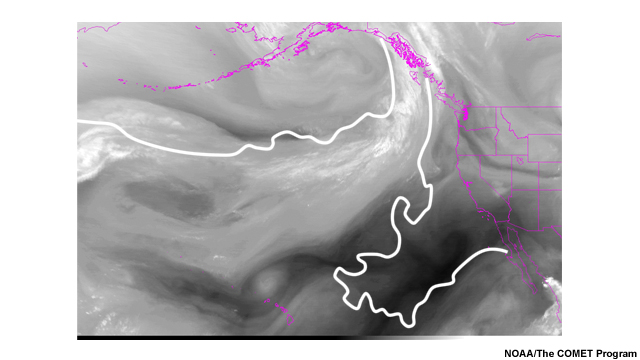
Description:
Outline of IWV values > 40 mm on the corresponding WV image.
File Name:
AR_Sep20_2011_WV_AR_outline.jpg
Credits:
NOAA/The COMET Program
Copyright Terms:
COMET Standard Terms of Use
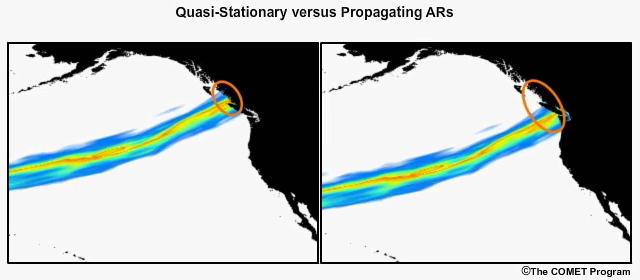
Description:
Animation of the precipitation differences from a quasi-stationary AR and a propagating AR. Both ARs have significant flow, but the quasi-stationary AR places more precipitation in the same location increasing the precipitation totals and likely the damages.
File Name:
AR_stationary_versus_propagating.mp4
Credits:
�The COMET Program
Copyright Terms:
COMET Standard Terms of Use
Description:
Comparison interaction IVW imagery
File Name:
AR_WV_IWV_comparison_Sep_20_2011_IWV_0001.htm
Credits:
CIMSS/SSEC
Copyright Terms:
COMET Standard Terms of Use
Description:
Comparison interaction VW imagery
File Name:
AR_WV_IWV_comparison_Sep_20_2011_WV_0001.htm
Credits:
NOAA
Copyright Terms:
COMET Standard Terms of Use
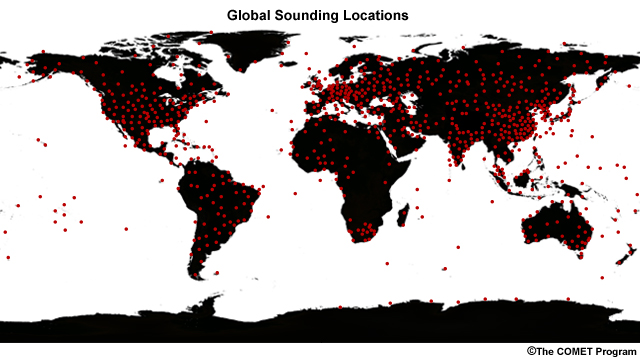
Description:
Global view of all the WMO-certified sounding locations.
File Name:
Global_Sounding_Locations.jpg
Credits:
�The COMET Program
Copyright Terms:
COMET Standard Terms of Use

Description:
Four different forms of atmospheric lift: isentropic, frontal, orographic, and instability.
File Name:
lifting_mechanisms.jpg
Credits:
�The COMET Program
Copyright Terms:
COMET Standard Terms of Use
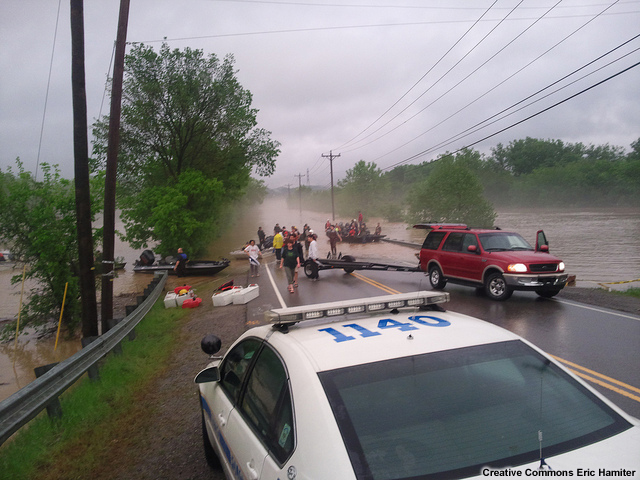
Description:
Nashville, TN flood, May 2010.
File Name:
nashville_flooding_may_2_2010.jpg
Credits:
Creative Commons Eric Hamiter
Copyright Terms:
Creative Commons Attribution-ShareAlike 2.0
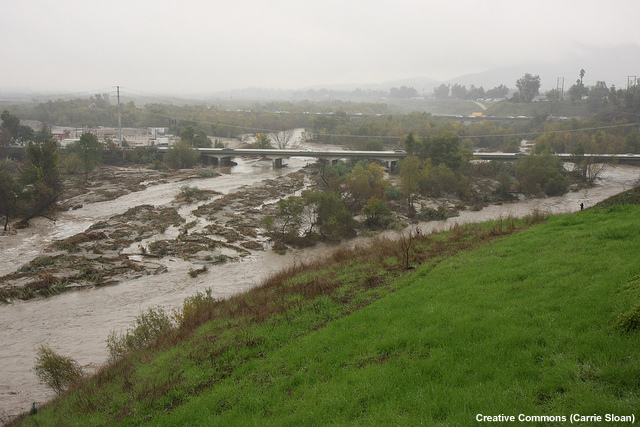
Description:
A rain swollen Santa Ana River on December 22, 2010.
File Name:
rain_swollen_santa_ana_river.jpg
Credits:
Creative Commons (Carrie Sloan)
Copyright Terms:
Creative Commons Attribution-Noncommercial-Share Alike 2.0 Generic

Description:
Man walking under an awning while rain pours off of it. Woman also propped against building waiting.
File Name:
walking_in_rain.jpg
Credits:
Creative Commons d.a.n.n.y.c busy
Copyright Terms:
Creative Commons Attribution 2.0 Generic