Introduction
The West Coast of North America is subjected to occasional extreme precipitation events, especially in the cool season. The mountainous coastline and the abundance of maritime moisture both play an important role in the precipitation climatology here and in other parts of the world.
![1927 flood: Photo of Thousand Food channel when impounded flood waters broke through to the Pacific Ocean. The Coast Blvd. & P.E. [Pacific Electric] Railroad suffered extreme damage as shown.](media/graphics/1927_flood_damage.jpg)
Question
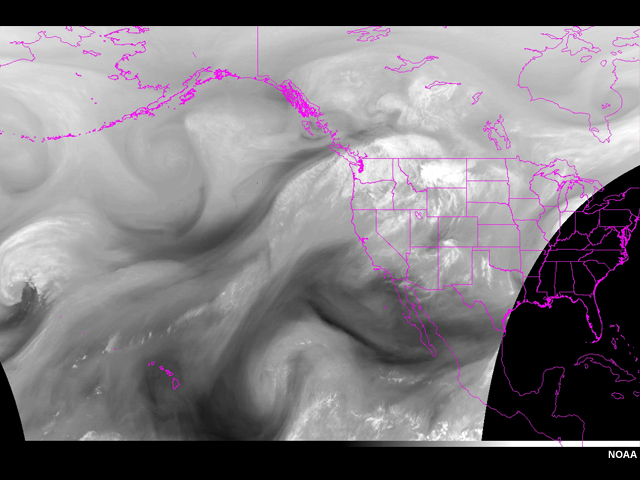
Using the slider, compare the longwave infrared and water vapor satellite images below.
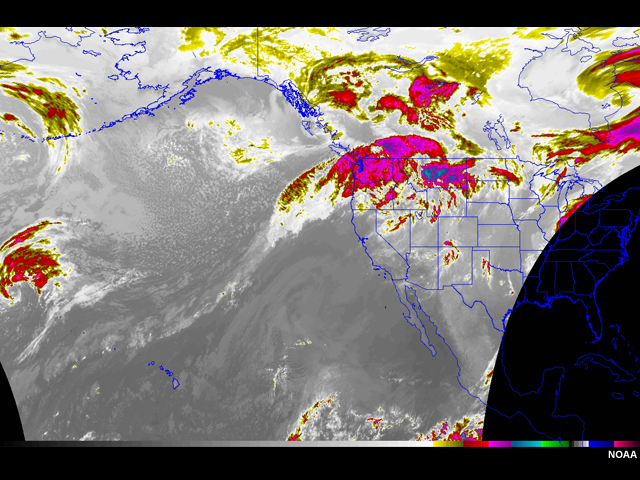
Where do the above images suggest the extreme precipitation event is along the coast of North America? Outline the area of concern below with the pen tool.
| Tool: | Tool Size: | Color: |
|---|---|---|
| |
Feedback: From just the satellite images, you likely guessed there is potential for heavy precipitation in southern British Columbia, Washington, Oregon, and possibly northern California. The biggest problem is forecasting the magnitude of the precipitation and which sub–region or drainage basins within that region will be most impacted.
Question
Using the images, can you determine if this is going to be a heavy precipitation event? (Choose the best answer.)
The correct answer is b.
Feedback: No, at least not with much certainty. While the IR imagery gives important information about the clouds, it gives little indication of water vapor content. Water vapor imagery (6.7 – 6.8 µm channel) on the other hand does. The water vapor image does show a good fetch of moisture and enhanced clouds entering into southwest Canada and the Pacific Northwest of the United States. Yet, it does not help us determine an amount of possible precipitation because it only covers a small portion of the troposphere. It does not show the rich source of low–level moisture that can contribute greatly to the total available moisture. It also does not give much spatial detail on the drainage basin scale.