Module Overview
Introduction

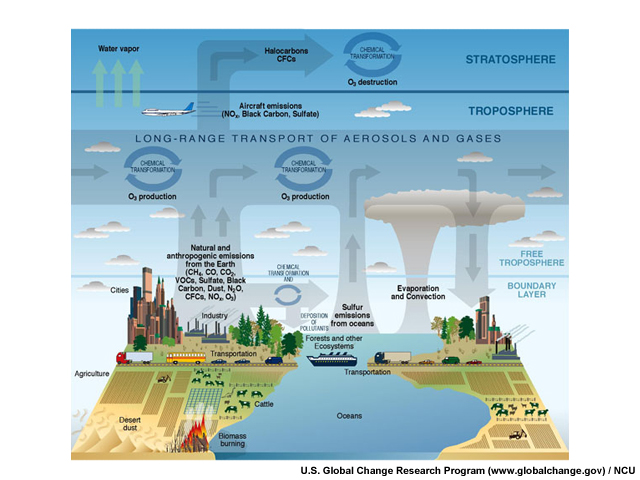
Satellite-based remote sensing supports a number of applications related to atmospheric composition.
Monitoring stratospheric ozone
The best-known application with the longest established contribution from satellites is stratospheric ozone monitoring. This continues to be important as we monitor the anticipated recovery of the ozone layer.
Tracking long-range pollution transport
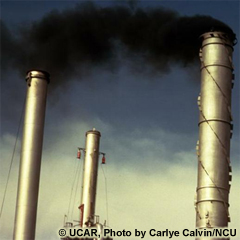
In addition, tracking long-range pollution transport is an application ideally suited to satellites, which can potentially provide global coverage on a daily basis.
Monitoring air quality
With recent advances in space-based instrumentation and retrieval techniques, satellite data now support air quality monitoring both at global and regional scales.
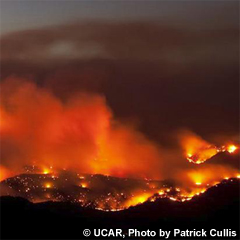
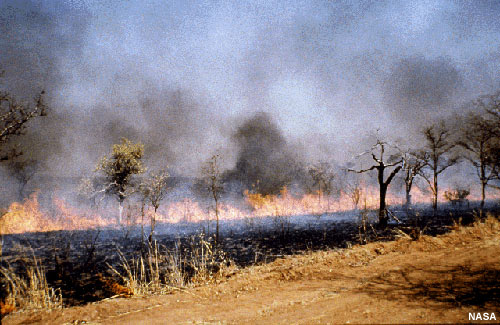
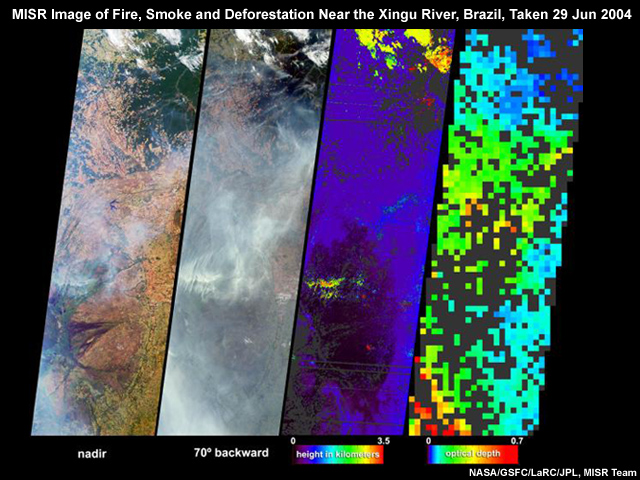
Monitoring biomass burning
Monitoring volcanic eruptions
Monitoring wildfire emissions
Satellites also make important contributions to monitoring biomass burning, fire emissions, and volcanic eruptions.
Monitoring wildfire emissions
Satellites also make important contributions to monitoring biomass burning, fire emissions, and volcanic eruptions.


With the increasing urgency to observe and understand climate change, monitoring greenhouse gases to help estimate surface fluxes is an emerging field.
Improved knowledge about the role of aerosols in climate change is also a pressing area of scientific research to which satellite data can contribute.
This module focuses on the uses of satellite observations for monitoring and forecasting atmospheric composition. We will also summarize the development of related operational applications and services. Although not discussed here, note that surface and ground-based remote sensing networks provide an important component of the observing system, and many detailed research activities underpin the development of longer term operational services.
Objectives and Audience
The module is intended for a broad audience with a basic knowledge of atmospheric science or the geosciences, including those who:
- Use atmospheric composition satellite products
- Want to learn how satellite data are used to describe and study stratospheric ozone, natural and anthropogenic pollution, and climate change, and
- Want an introduction to the European and U.S. agencies responsible for the satellite missions
After completing this module, learners will be able to:
- Describe the main application areas related to atmospheric composition
- Describe the role of satellite-based remote sensing in monitoring and forecasting atmospheric composition
- Describe the main observation techniques available
- Describe the EUMETSAT, NOAA, and NASA missions relevant to atmospheric composition, and
- Describe the services to which these data contribute

Dr. Rosemary Munro, Atmospheric Composition Mission Scientist, EUMETSAT
Rosemary Munro is the Atmospheric Composition Mission Scientist at EUMETSAT. She provides support for developing new satellite instruments, analyzes on-ground instrument calibration data prior to launch, helps maintain the high quality of data provided by in-orbit satellites, works with the scientific community and data users outside EUMETSAT, and represents EUMETSAT on external bodies such as Mission Advisory Groups and WMO Expert Teams.
Overview of Satellite Applications
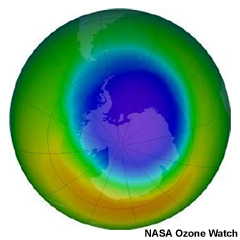
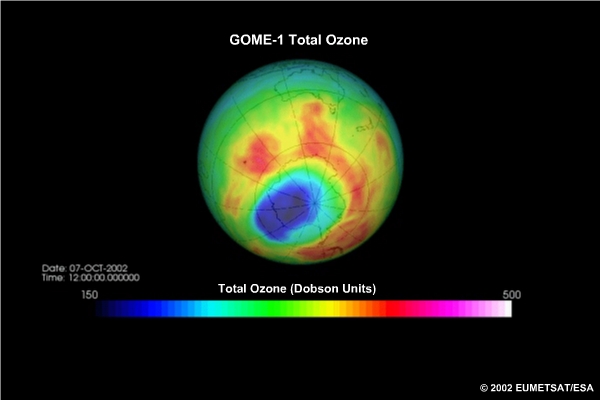
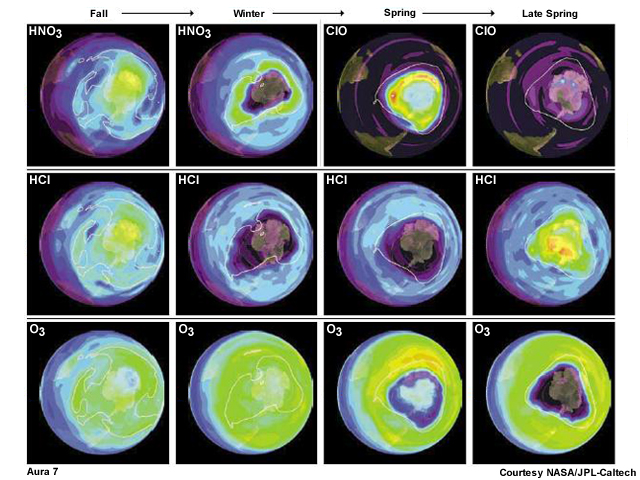
Stratospheric Ozone Monitoring & Ozone Depletion
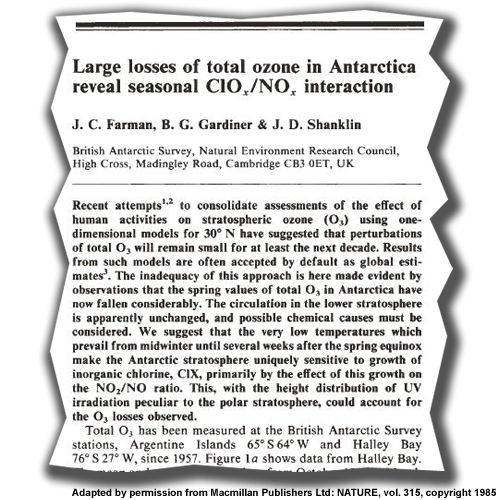
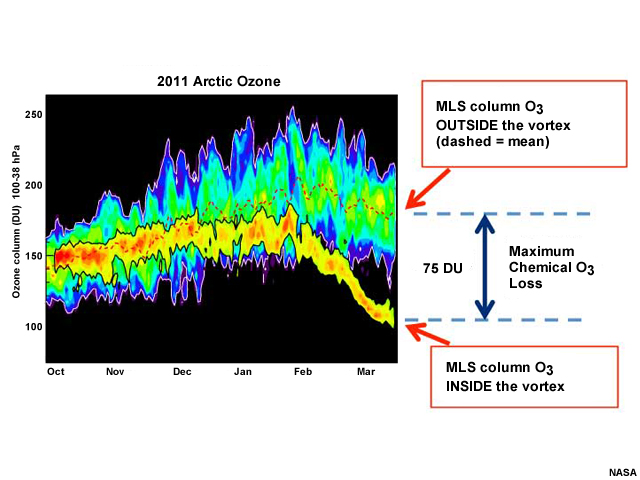
Stratospheric ozone has been monitored from space since the 1970's when the ozone hole over the South Pole was first observed by ground-based systems. However, it wasn't until a few years later that the low values were recognized to be something more than instrument error. Stratospheric ozone depletion is driven by ozone-depleting substances (called ODS's) released into the atmosphere by mankind.
The 1989 Montreal Protocol limits the production and release of ozone depleting substances into the Earth's atmosphere. These substances typically have a very long life-time in the stratosphere, so the full recovery of the ozone layer is not expected until the second half of this century.
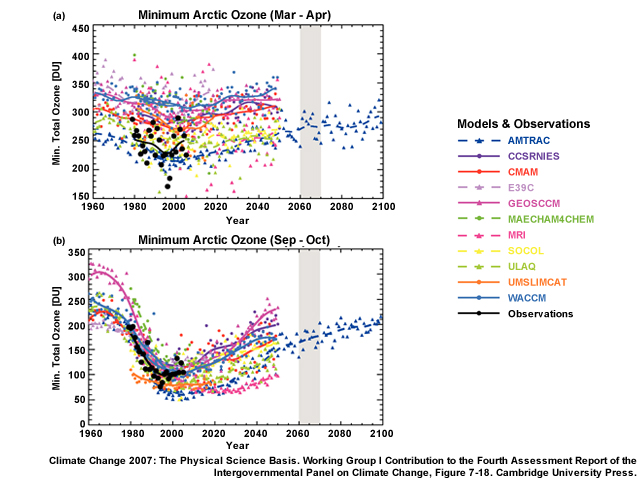
Climate variability drives changes in atmospheric circulation and temperature, which influence the rate of reactions that control ozone production and loss and could alter stratospheric ozone recovery. Model predictions of future ozone including climate change effects do not yet give a fully consistent picture. Continued monitoring of the stratospheric ozone layer therefore remains essential.
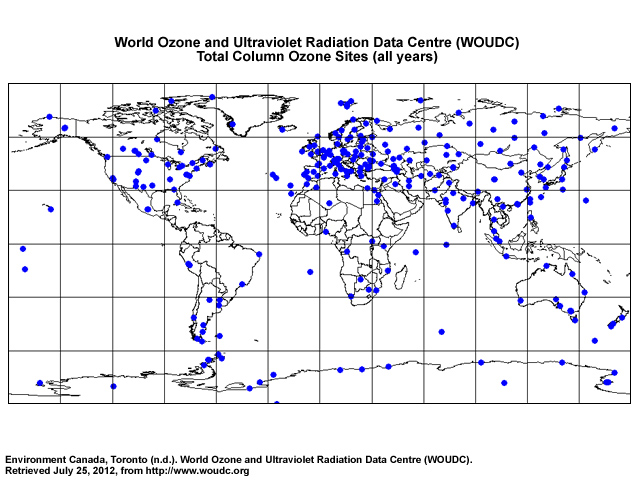
In contrast to ground-based measurements, which are sparsely distributed (particularly in the Southern Hemisphere), satellite data provide a global picture of the state of the ozone layer and its temporal evolution.
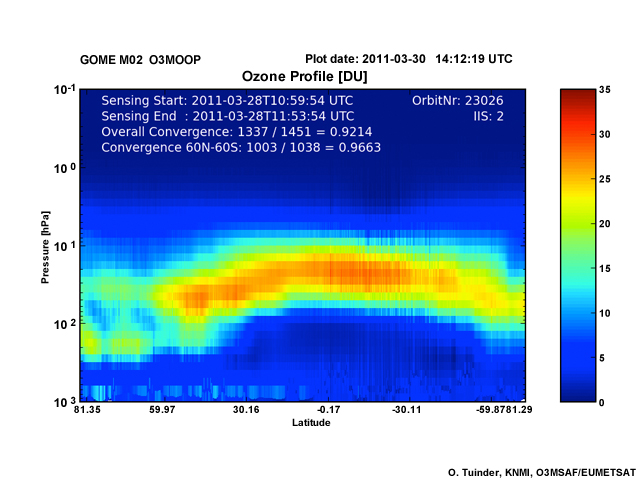
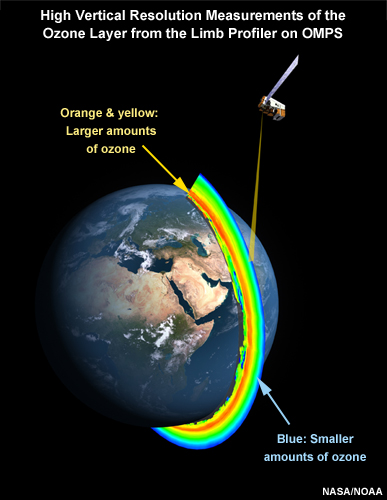
Measurements of the vertical ozone distribution have historically been made using the UV/Visible part of the spectrum in nadir viewing geometry, but limb and occultation measurements provide an important contribution. Limb measurements made in the infrared (where the atmosphere is viewed against the cold background of space) have also contributed to the knowledge of ozone and ozone chemistry, as have measurements made in the millimetre and microwave spectral region. These measurement techniques will be discussed in more detail in a later section.
Nadir, Limb, Occultation
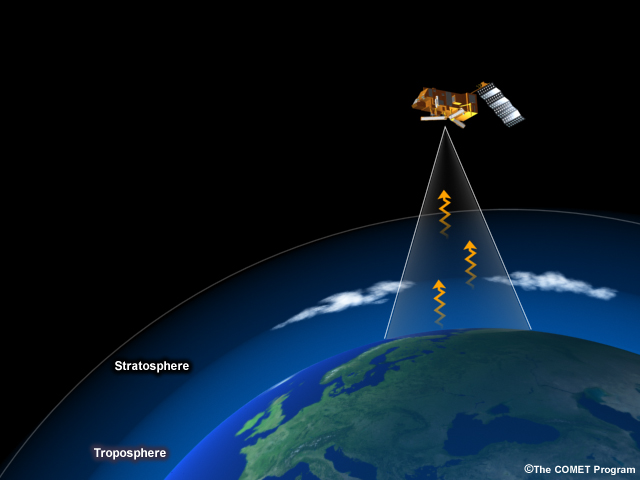
Nadir-viewing measurements can provide good spatial coverage at potentially high spatial resolution, although it may be necessary to trade coverage for spatial resolution depending on the instrument design. However, the vertical resolution of measurements made in nadir-viewing geometry is typically limited.
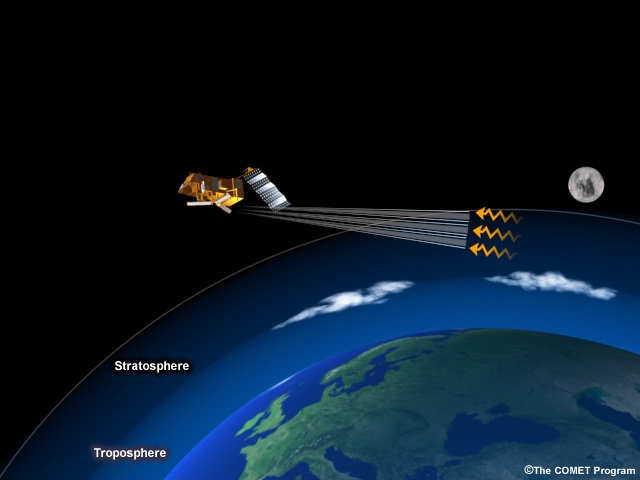
Limb measurements provide improved information on the vertical profile but their penetration into the troposphere can be limited by clouds, and in some spectral regions water vapour, in the field of view.
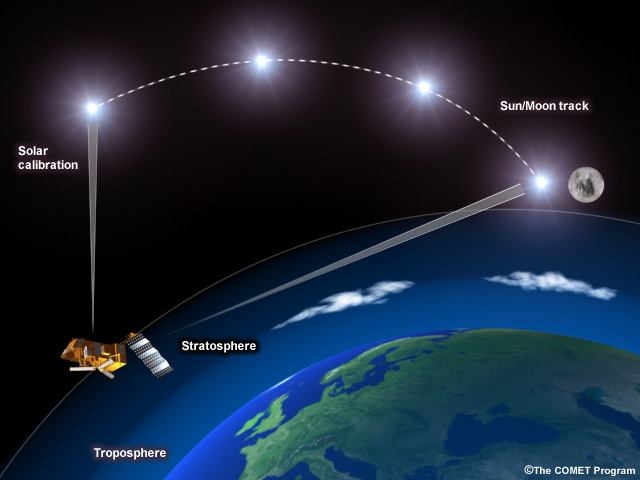
The advantage of occultation measurements is that they are inherently self-calibrating, looking directly at either the Sun or stars, both with and without the atmosphere in the field of view. They can therefore provide very accurate data. Their disadvantage is that measurements are relatively sparse but they none-the-less provide very useful anchor points for long-term data sets.
Satellite Missions for Monitoring Ozone
Satellite Missions for Monitoring Ozone
Explore this table for information about past, current, and planned satellite missions. Primary measured species are in bold type.
| Instrument | Platform | Status | Species/Parameter | Viewing Geometry | Resources |
|---|---|---|---|---|---|
| TOMS | Nimbus-7, Meteor-3, Earthprobe | Historic | O3 | Nadir | Link |
| MIPAS | Envisat | Historic | O3, CH4, N2O, NO2, HNO3, SO2, Aerosol and CFC's | Limb | Link 1 Link 2 |
| GOMOS | Envisat | Historic | O3, NO2, NO3, Aerosol | Occultation | Link |
| SCIAMACHY | Envisat | Historic | O3, NO2, BrO, SO2, HCHO, CHOCHO, OClO, UV, Aerosol, CH4, CO2 | Nadir & Limb | Link |
| SBUV/2 | NOAA-9, -11, -14, -16, -17, -18 | Current | O3 | Nadir | Link |
| SMR | Odin | Current | O3, ClO, NO2, HNO3, CO | Limb | Link |
| OSIRIS | Odin | Current | O3, NO2, BrO, Aerosol | Limb | Link |
| AIRS | Aqua | Current | O3, SO2, CO, CH4, CO2, Aerosol | Nadir | Link |
| ACE-FTS | SCISAT-1 | Current | O3, CH4, N2O, NO2, NO, HNO3, HCl, HF, CO, CFC-11, CFC-12, N2O5, ClONO2, Aerosol . | Occultation |
http://www.ace.uwaterloo.ca/instruments_acefts.html |
| MAESTRO | SCISAT-1 | Current | O3, NO2, OClO, BrO, Aerosol | Occultation & Limb |
http://www.ace.uwaterloo.ca/instruments_maestro.html |
| HiRDLS | Aura | Current | O3, HNO3, CFC-11, CFC-12, NO2, N2O5, Aerosol | Limb |
http://www.eos.ucar.edu/hirdls/ |
| MLS | Aura | Current | BrO, CH3Cl, CH3CN, ClO, CO, HCl, HCN, HNO3, HO2, HOCl, N2O, O3, OH, SO2 | Limb | Link |
| OMI | Aura | Current | O3, NO2, BrO, SO2, HCHO, OClO, UV, Aerosol | Nadir |
http://aura.gsfc.nasa.gov/instruments/omi.html http://www.knmi.nl/omi/research/news/newsWrap.php?language=only_en&timeFrame=latest&choise=page&path=research |
| TES | Aura | Current | CH4, CO, CO2, HNO3, NH3, O3 | Nadir | Link |
| GOME-2 | Metop-A, B, C | Current | O3, NO2, BrO, SO2, HCHO, CHOCHO, OClO, UV, Aerosol | Nadir |
http://www.eumetsat.int/Home/Main/Satellites/Metop/Instruments/SP_2010053161447506 |
| IASI | Metop-A, B, C | Current | CO, CH4, O3, HNO3, NH3, SO2, C2H4, CH3OH, HCOOH, PAN, CO2, Aerosol | Nadir |
http://www.eumetsat.int/Home/Main/Satellites/Metop/Instruments/SP_2010053151047495 http://smsc.cnes.fr/IASI/ |
| SMILES | ISS/JEM | Current | O3,
HCl, ClO, HNO3,
CH3CN, HOCl, HO2, BrO |
Limb | Link |
| OMPS | Suomi NPP, JPSS-1, JPSS-2 | Current | O3, NO2, BrO, SO2, HCHO, UV, Aerosol | Nadir & Limb |
http://npp.gsfc.nasa.gov/omps.html |
| CrIS | Suomi NPP, JPSS-1, JPSS-2 | Current | CO, CH4, O3, SO2, CO2, Aerosol | Nadir |
http://npp.gsfc.nasa.gov/cris.html |
| SAGE-III | SAGE-III | Future | O3, NO2, NO3, OClO, Aerosol | Occultation | Link |
| Sentinel-5 Precursor | Sentinel-5 Precursor | Future | O3, NO2, BrO, SO2, HCHO, CHOCHO, OClO, UV, Aerosol, CH4 | Nadir | Link |
| GEMS | GeoKOMPSAT-2B | Future | O3, NO2, SO2, HCHO, UV, Aerosol | Nadir | Link |
| Sentinel-4 | MTG-S A & B | Future | O3, NO2, BrO, SO2, HCHO, CHOCHO, UV, Aerosol, CH4, CO | Nadir |
http://www.esa.int/esaLP/SEM3ZT4KXMF_LPgmes_0.html |
| Sentinel-5 | EPS-SG | Future | O3, NO2, BrO, SO2, HCHO, CHOCHO, OClO, UV, Aerosol, CH4, CO2 | Nadir | Link |
| GEO-CAPE | GEO-CAPE | Future* | O3, NO2, BrO, SO2, HCHO, OClO, UV, CO, Aerosol | Nadir | Link |
| GACM | GACM | Future* | O3, CO, NO2, CH2O, SO2, N2O, HNO3, ClO, Aerosol | Nadir & Limb |
http://decadal.gsfc.nasa.gov/gacm.html |
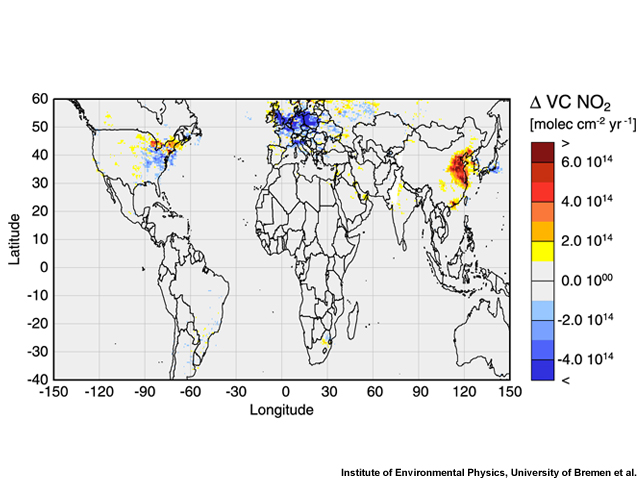
Long-Range Transport of Pollution
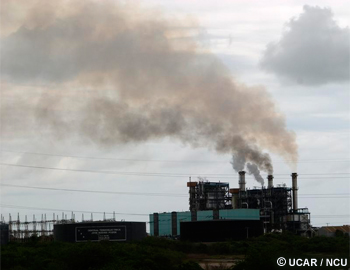
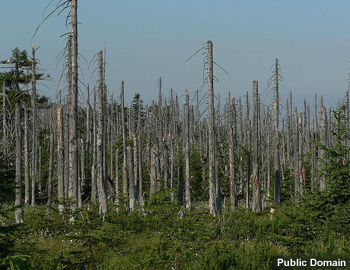
The discovery of acid rain and its detrimental effects in the 1970s and the resulting public concern triggered the first regional environmental convention, the 1979 Convention on Long-Range Transboundary Air Pollution (CLRTAP). The CLRTAP established a broad framework for cooperative action to reduce and prevent air pollution, including long-range transboundary air pollution.
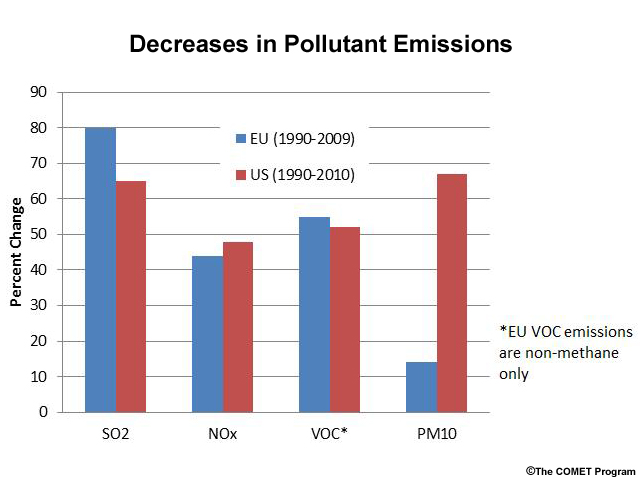
The Convention and 8 Protocols set strict pollution reduction targets to protect human and environmental health. The Protocols target pollutants such as sulphur, nitrogen oxides, persistent organic pollutants, volatile organic compounds, ammonia, and toxic heavy metals, and have contributed to significantly reducing pollutant levels in the European Union and U.S.
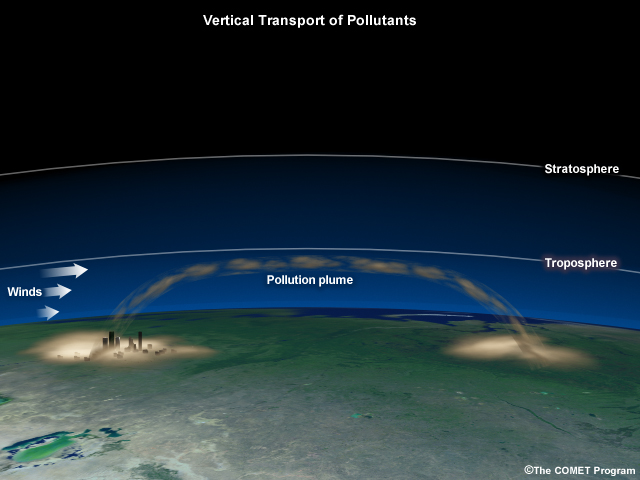
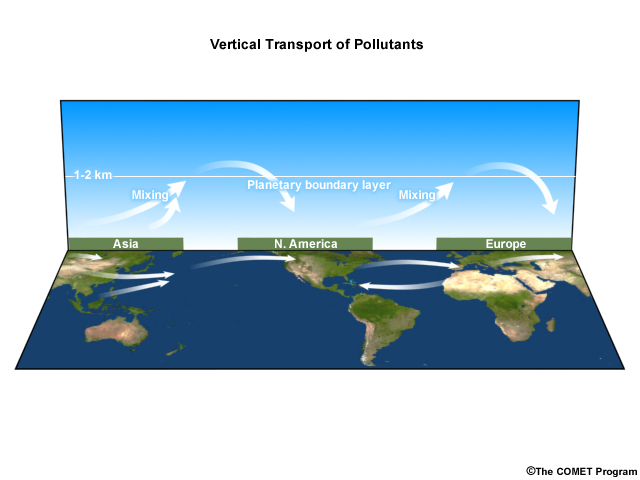
Long-range pollution transport occurs when pollutants are lifted from source regions near the surface into the free troposphere where they can be carried large distances. Because wind speeds generally increase with height, particularly in the vicinity of the polar and subtropical jet streams, pollutants usually rise rapidly to higher altitudes. When dynamical processes return the pollutants to the boundary layer, they impact the local air quality. Given that many countries have strict limits on local air pollution, it is important to understand and quantify the relative contributions of locally and remotely generated air pollution.
Satellite data measurements and other advances in air pollution monitoring methods have shown that transoceanic transport of pollutants does occur. Many types of pollutants have been observed to travel over great distances, including primary pollutants such as:
- Particulate matter from diesel engines, deserts, and agricultural dust
- Nitrogen oxides from petrol engines, and
- Volatile organic compounds
This is also true for secondary pollutants (those formed by chemical reactions in the atmosphere, not direct emissions) such as ozone and sulphuric acid. The continental U.S. can be affected by pollution from Asia; Europe can be affected by pollution from the Eastern U.S.; eastern European pollution can affect Asia, etc.
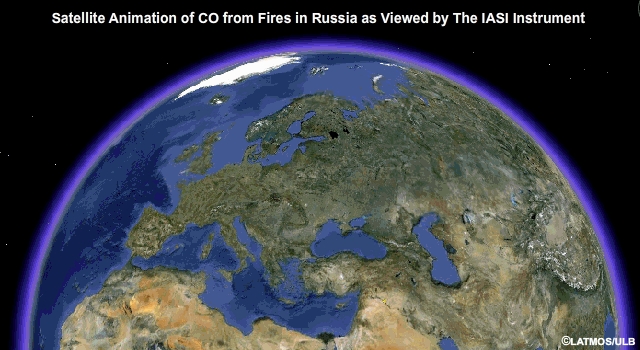
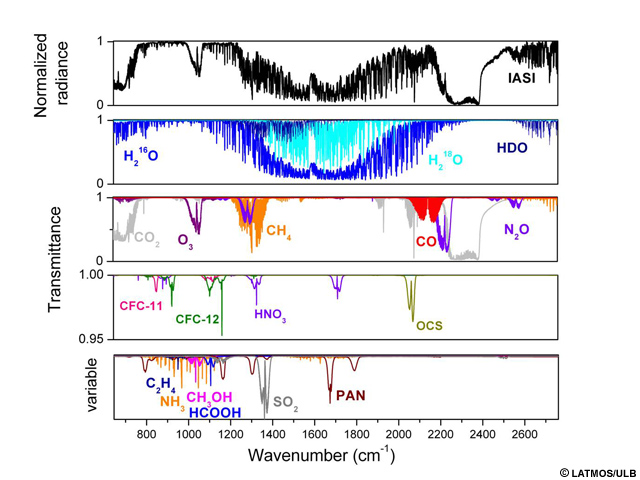
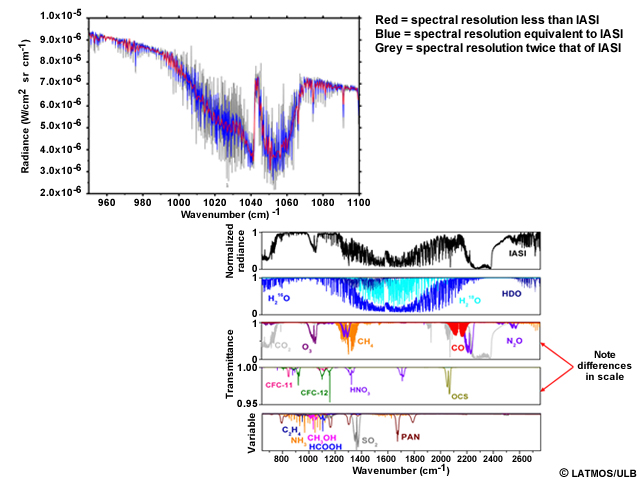
IASI
MOPITT
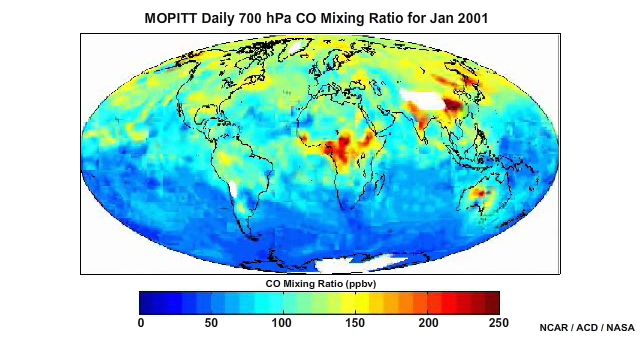
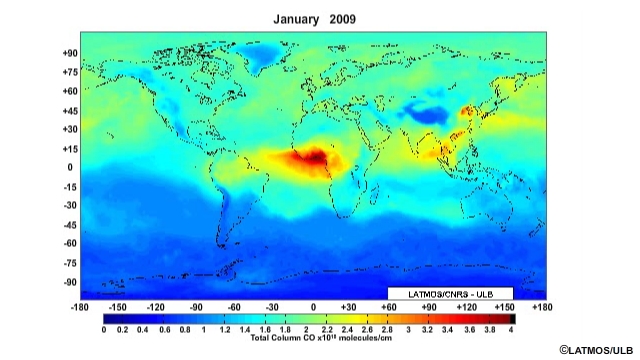
Satellite measurements can provide daily global coverage of a number of species, so they are ideal for tracking the transport of large pollution plumes and any transformation the plume may undergo.
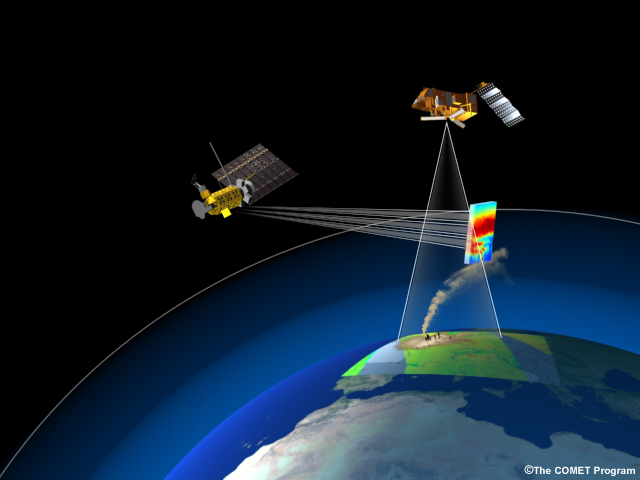
For a satellite observing system to provide the best possible description of a pollution plume, its measurements should be characterized by the following:
- Nadir observations with global coverage at a relatively high horizontal resolution, daily repeat coverage or better, and sensitivity to the planetary boundary layer, and
- Limb observations with high vertical resolution (which can potentially measure an increased number of chemical species)
Combining measurements and models via data assimilation is another important technique that enables an interpretation of the plume evolution, also taking dynamical effects into account.
Satellite Missions for Monitoring Long-Range Pollution Transport
Satellite Missions for Monitoring Long-Range Pollution Transport
Explore this table for information about past, current, and planned satellite missions. Primary measured species are in bold type.
| Instrument | Platform | Status | Species/Parameter | Viewing Geometry | Resources |
|---|---|---|---|---|---|
| AATSR | Envisat | Historic | Aerosol | Nadir | Link |
| MERIS | Envisat | Historic | Aerosol | Nadir | Link |
| MIPAS | Envisat | Historic | O3, CH4, N2O, NO2, HNO3, SO2, Aerosol and CFC's | Limb | Link 1 Link 2 |
| SCIAMACHY | Envisat | Historic | O3, NO2, BrO, SO2, HCHO, CHOCHO, OClO, UV, Aerosol, CH4, CO2 | Nadir & Limb | Link |
| MISR | Terra | Current | Aerosol | Nadir | Link |
| MOPITT | Terra | Current | CO | Nadir | http://www.acd.ucar.edu/mopitt/ |
| Sounder | GOES-12 - 15 | Current | Aerosol | Nadir | Link |
| AIRS | Aqua | Current | O3, SO2, CO, CH4, CO2, Aerosol | Nadir | Link |
| ACE-FTS | SCISAT-1 | Current | O3, CH4, N2O, NO2, NO, HNO3, HCl, HF, CO, CFC-11, CFC-12, N2O5, ClONO2, Aerosol . | Occultation | http://www.ace.uwaterloo.ca/instruments_acefts.html |
| MAESTRO | SCISAT-1 | Current | O3, NO2, OClO, BrO, Aerosol | Occultation & Limb | http://www.ace.uwaterloo.ca/instruments_maestro.html |
| HiRDLS | Aura | Current | O3, HNO3, CFC-11, CFC-12, NO2, N2O5, Aerosol | Limb | http://www.eos.ucar.edu/hirdls/ |
| MLS | Aura | Current | BrO, CH3Cl, CH3CN, ClO, CO, HCl, HCN, HNO3, HO2, HOCl, N2O, O3, OH, SO2 | Limb | Link |
| OMI | Aura | Current | O3, NO2, BrO, SO2, HCHO, OClO, UV, Aerosol | Nadir | http://aura.gsfc.nasa.gov/instruments/omi.html http://www.knmi.nl/omi/research/news/newsWrap.php?language=only_en&timeFrame=latest&choise=page&path=research |
| TES | Aura | Current | CH4, CO, CO2, HNO3, NH3, O3 | Nadir | Link |
| GOME-2 | Metop-A, B, C | Current | O3, NO2, BrO, SO2, HCHO, CHOCHO, OClO, UV, Aerosol | Nadir | http://www.eumetsat.int/Home/Main/Satellites/Metop/Instruments/SP_2010053161447506 |
| IASI | Metop-A, B, C | Current | CO, CH4, O3, HNO3, NH3, SO2, C2H4, CH3OH, HCOOH, PAN, CO2, Aerosol | Nadir |
http://www.eumetsat.int/Home/Main/Satellites/Metop/Instruments/SP_2010053151047495 http://smsc.cnes.fr/IASI/ |
| SMILES | ISS/JEM | Current | O3, HCl, ClO,
HNO3, CH3CN, HOCl, HO2, BrO |
Limb | Link |
| OMPS | Suomi NPP, JPSS-1, JPSS-2 | Current | O3, NO2, BrO, SO2, HCHO, UV, Aerosol | Nadir & Limb | http://npp.gsfc.nasa.gov/omps.html |
| CrIS | Suomi NPP, JPSS-1, JPSS-2 | Current | CO, CH4, O3, SO2, CO2, Aerosol | Nadir | http://npp.gsfc.nasa.gov/cris.html |
| MODIS | Aqua, Terra | Current | Aerosol | Nadir | Link |
| CALIOP | CALIPSO | Current | Aerosol | Nadir | Link |
| POLDER | PARASOL | Current | Aerosol | Nadir | Link |
| AVHRR/3 | NOAA-15 to 19, Metop-A, -B, -C | Current | Aerosol | Nadir | http://noaasis.noaa.gov/NOAASIS/ml/avhrr.html |
| OCM | OCEANSAT-2, -3, -3A | Current | Aerosol | Nadir | http://www.isro.org/satellites/oceansat-2.aspx |
| VIIRS | Suomi NPP, JPSS-1, JPSS-2 | Current | Aerosol | Nadir | http://npp.gsfc.nasa.gov/viirs.html |
| SAGE-III | SAGE-III | Future | O3, NO2, NO3, OClO, Aerosol | Occultation | Link |
| Sentinel-5 Precursor | Sentinel-5 Precursor | Future | O3, NO2, BrO, SO2, HCHO, CHOCHO, OClO, UV, Aerosol, CH4 | Nadir | Link |
| Sentinel-5 | EPS-SG | Future | O3, NO2, BrO, SO2, HCHO, CHOCHO, OClO, UV, Aerosol, CH4, CO2 | Nadir | Link |
| OLCI | Sentinel-3 A, B, C | Future | Aerosol | Nadir | http://www.esa.int/esaLP/SEMTST4KXMF_LPgmes_0.html |
| SLSTR | Sentinel-3 A, B, C | Future | Aerosol | Nadir | http://www.esa.int/esaLP/SEMTST4KXMF_LPgmes_0.html |
| ALADIN | ADM-Aeolus | Future | Aerosol | Nadir | http://www.esa.int/esaLP/ESAES62VMOC_LPadmaeolus_0.html |
| ABI | GOES-R, GOES-S | Future | Aerosol | Nadir | Link |
| ATLID | EarthCARE | Future | Aerosol | Nadir | http://www.esa.int/esaLP/ASESMYNW9SC_LPearthcare_0.html |
| MSI | EarthCARE | Future | Aerosol | Nadir | http://www.esa.int/esaLP/ASESMYNW9SC_LPearthcare_0.html |
| FCI | MTG-I 1, 2, 3, 4 | Future | Aerosol | Nadir | http://www.eumetsat.int/Home/Main/Satellites/MeteosatThirdGeneration/Instruments/index.htm |
| PCWMP | PCW-1, -2 | Future | Aerosol | Nadir | Link |
| GACM | GACM | Future* | O3, CO, NO2, CH2O, SO2, N2O, HNO3, ClO, Aerosol | Nadir & Limb | http://decadal.gsfc.nasa.gov/gacm.html |
Biomass Burning
Additional Resources:
Multispectral Satellite Applications: Monitoring the Wildland Fire
Cycle, 2nd Edition
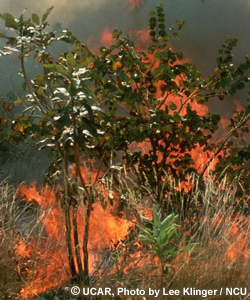
Biomass burning refers to the burning of organic matter, of which around 90% may be attributed to human activity. Biomass burning releases a complex mixture of particles and gases into the atmosphere depending on the material being burnt. These can include carbon dioxide, water vapour, carbon monoxide, hydrocarbons, nitrogen oxides, and many other compounds.
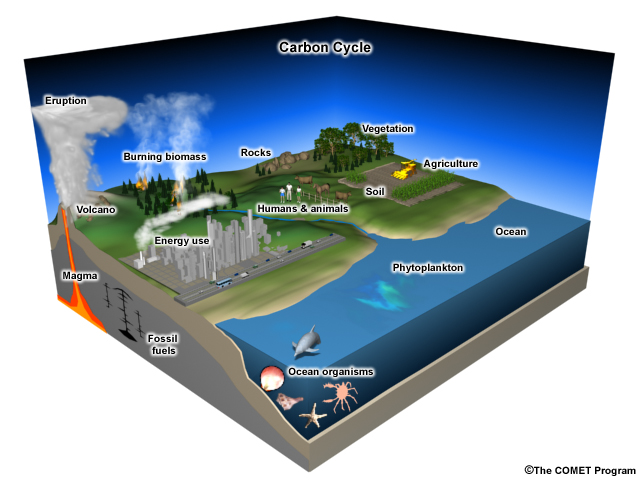
In addition, biomass burning plays an important role in the global carbon cycle by releasing significant amounts of greenhouse gases and aerosols into the atmosphere. Furthermore, wildfires require active management to limit loss of life and damage to property.
Because pollutants generated from biomass burning can be transported long distances, these events can affect not only the local air quality, but also regions far from the fire.
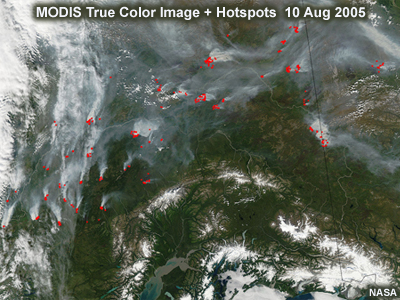
It is therefore essential to monitor biomass burning and wildfires to assess impacts on both local and regional air quality, as well as contributions to the global carbon cycle and climate change. Whilst not directly related to atmospheric composition, detecting and monitoring wildfire location and development is also important for hazard management.
MSG Met-8, Vis + NIR
GOES SWIR
Because of the transient nature of fires and the variable spatial distribution, remote sensing from space is the ideal method for monitoring biomass burning and fires. Space-based measurements can provide a global perspective on the location and extent of fires and can also monitor the gases and particles emitted and their transformation within the plume. Geostationary measurements have the added advantage that they can be used to monitor the diurnal cycle of fire activity. They do not, however, provide full global coverage and so should be used in conjunction with data from polar orbiting satellites for regions not in the geostationary field of view. For more information on wildfire detection and related applications based on multi-spectral satellite imagery, see the module:
Multispectral Satellite Applications: Monitoring the Wildland Fire Cycle, 2nd Edition
When considering the chemical composition of the wildfire plume, current geostationary instruments can provide some information on ozone (a partial column) and can detect smoke and aerosols. However, extensive measurements of the chemical composition of biomass burning plumes can only be made by the hyperspectral instruments currently flying on polar-orbiting platforms.
Satellite Missions Monitoring Biomass Burning
Satellite Missions Monitoring Biomass Burning
Explore this table for information about past, current, and planned satellite missions. Primary measured species are in bold type.
| Instrument | Platform | Status | Species/Parameter | Viewing Geometry | Resources |
|---|---|---|---|---|---|
| AATSR | Envisat | Historic | Aerosol | Nadir | Link |
| MERIS | Envisat | Historic | Aerosol | Nadir | Link |
| MIPAS | Envisat | Historic | O3, CH4, N2O, NO2, HNO3, SO2, Aerosol and CFC's | Limb | Link 1 Link 2 |
| SCIAMACHY | Envisat | Historic | O3, NO2, BrO, SO2, HCHO, CHOCHO, OClO, UV, Aerosol, CH4, CO2 | Nadir & Limb | Link |
| MISR | Terra | Current | Aerosol | Nadir | Link |
| MOPITT | Terra | Current | CO | Nadir | http://www.acd.ucar.edu/mopitt/ |
| Sounder | GOES-12 - 15 | Current | Aerosol | Nadir | Link |
| AIRS | Aqua | Current | O3, SO2, CO, CH4, CO2, Aerosol | Nadir | Link |
| MLS | Aura | Current | BrO, CH3Cl, CH3CN, ClO, CO, HCl, HCN, HNO3, HO2, HOCl, N2O, O3, OH, SO2 | Limb | Link |
| OMI | Aura | Current | O3, NO2, BrO, SO2, HCHO, OClO, UV, Aerosol | Nadir | http://aura.gsfc.nasa.gov/instruments/omi.html http://www.knmi.nl/omi/research/news/newsWrap.php?language=only_en&timeFrame=latest&choise=page&path=research |
| TES | Aura | Current | CH4, CO, CO2, HNO3, NH3, O3 | Nadir | Link |
| GOME-2 | Metop-A, B, C | Current | O3, NO2, BrO, SO2, HCHO, CHOCHO, OClO, UV, Aerosol | Nadir | http://www.eumetsat.int/Home/Main/Satellites/Metop/Instruments/SP_2010053161447506 |
| IASI | Metop-A, B, C | Current | CO, CH4, O3, HNO3, NH3, SO2, C2H4, CH3OH, HCOOH, PAN, CO2, Aerosol | Nadir |
http://www.eumetsat.int/Home/Main/Satellites/Metop/Instruments/SP_2010053151047495 http://smsc.cnes.fr/IASI/ |
| SMILES | ISS/JEM | Current | O3, HCl, ClO,
HNO3, CH3CN, HOCl, HO2, BrO |
Limb | Link |
| OMPS | Suomi NPP, JPSS-1, JPSS-2 | Current | O3, NO2, BrO, SO2, HCHO, UV, Aerosol | Nadir & Limb | http://npp.gsfc.nasa.gov/omps.html |
| CrIS | Suomi NPP, JPSS-1, JPSS-2 | Current | CO, CH4, O3, SO2, CO2, Aerosol | Nadir | http://npp.gsfc.nasa.gov/cris.html |
| MODIS | Aqua, Terra | Current | Aerosol | Nadir | Link |
| CALIOP | CALIPSO | Current | Aerosol | Nadir | Link |
| POLDER | PARASOL | Current | Aerosol | Nadir | Link |
| AVHRR/3 | NOAA-15 to 19, Metop-A, -B, -C | Current | Aerosol | Nadir | http://noaasis.noaa.gov/NOAASIS/ml/avhrr.html |
| OCM | OCEANSAT-2, -3, -3A | Current | Aerosol | Nadir | http://www.isro.org/satellites/oceansat-2.aspx |
| VIIRS | Suomi NPP, JPSS-1, JPSS-2 | Current | Aerosol | Nadir | http://npp.gsfc.nasa.gov/viirs.html |
| Sentinel-5 Precursor | Sentinel-5 Precursor | Future | O3, NO2, BrO, SO2, HCHO, CHOCHO, OClO, UV, Aerosol, CH4 | Nadir | Link |
| Sentinel-5 | EPS-SG | Future | O3, NO2, BrO, SO2, HCHO, CHOCHO, OClO, UV, Aerosol, CH4, CO2 | Nadir | Link |
| OLCI | Sentinel-3 A, B, C | Future | Aerosol | Nadir | http://www.esa.int/esaLP/SEMTST4KXMF_LPgmes_0.html |
| SLSTR | Sentinel-3 A, B, C | Future | Aerosol | Nadir | http://www.esa.int/esaLP/SEMTST4KXMF_LPgmes_0.html |
| ALADIN | ADM-Aeolus | Future | Aerosol | Nadir | http://www.esa.int/esaLP/ESAES62VMOC_LPadmaeolus_0.html |
| ABI | GOES-R, GOES-S | Future | Aerosol | Nadir | Link |
| ATLID | EarthCARE | Future | Aerosol | Nadir | http://www.esa.int/esaLP/ASESMYNW9SC_LPearthcare_0.html |
| MSI | EarthCARE | Future | Aerosol | Nadir | http://www.esa.int/esaLP/ASESMYNW9SC_LPearthcare_0.html |
| FCI | MTG-I 1, 2, 3, 4 | Future | Aerosol | Nadir | http://www.eumetsat.int/Home/Main/Satellites/MeteosatThirdGeneration/Instruments/index.htm |
| PCWMP | PCW-1, -2 | Future | Aerosol | Nadir | Link |
| GEMS | GeoKOMPSAT-2B | Future | O3, NO2, SO2, HCHO, UV, Aerosol | Nadir | Link |
| Sentinel-4 | MTG-S A & B | Future | O3, NO2, BrO, SO2, HCHO, CHOCHO, UV, CH4, CO, Aerosol | Nadir | http://www.esa.int/esaLP/SEM3ZT4KXMF_LPgmes_0.html |
| GACM | GACM | Future* | O3, CO, NO2, CH2O, SO2, N2O, HNO3, ClO, Aerosol | Nadir & Limb | http://decadal.gsfc.nasa.gov/gacm.html |
| GEO-CAPE | GEO-CAPE | Future* | O3, NO2, BrO, SO2, HCHO, OClO, UV, CO, Aerosol | Nadir | Link |
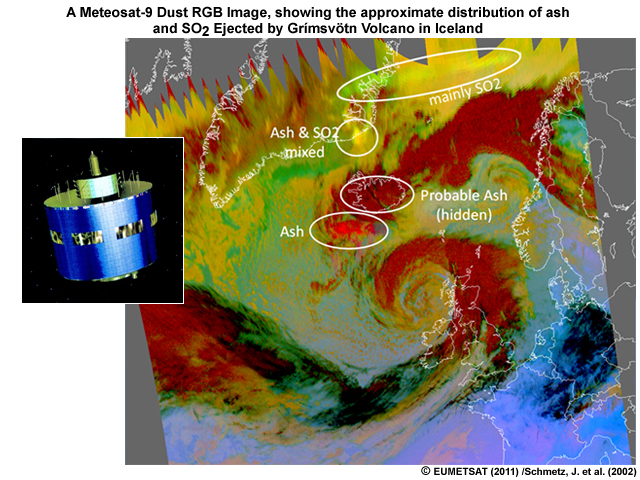
Volcanic Emissions
Additional Resources:
Volcanic
Ash: Observation Tools and Dispersion Models
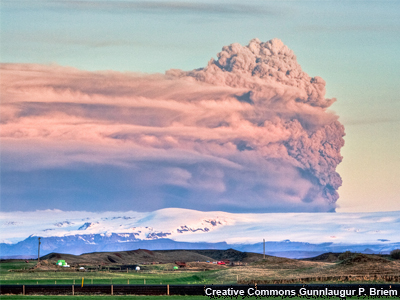
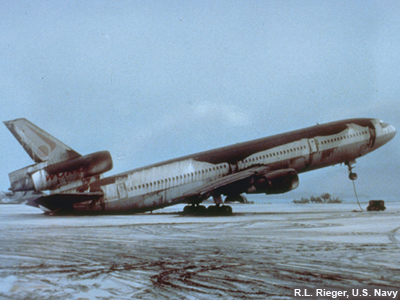
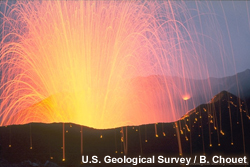
Volcanic eruptions can potentially cause significant damage and impact public health in the region immediate to the volcano, and regional and long-range transport of volcanic plumes can also significantly disrupt air traffic.
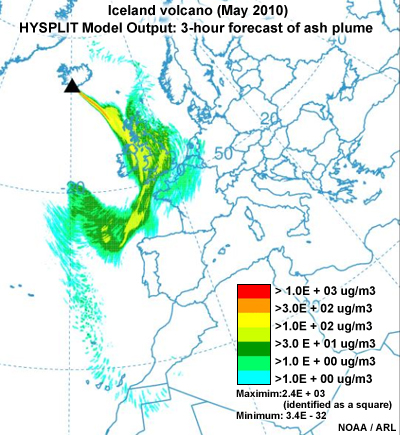
Traditionally, aviation control during volcanic events has been based on estimates of local emissions at the volcano and the injection height, coupled with the use of dispersion models, which forecast the expected trajectory of the plume. Airspace closure has been based on the presence of volcanic ash with a zero tolerance policy. Satellite imagery has primarily been used to verify the information provided by dispersion models. For more information on these methods, please see the module Volcanic Ash: Observation Tools and Dispersion Models and other modules on this topic in MetEd.
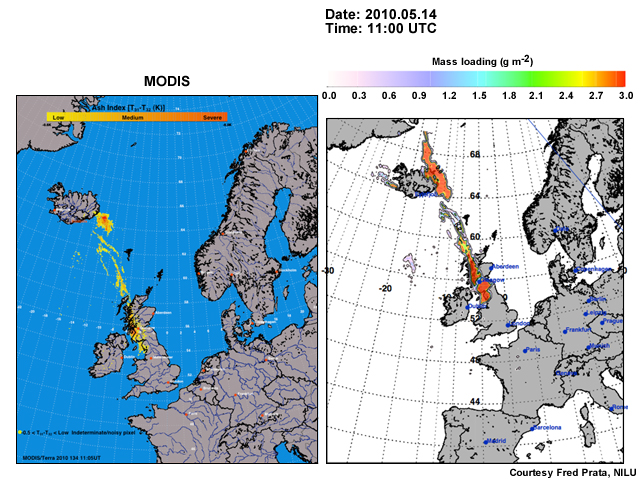
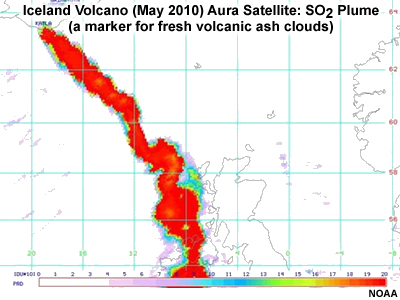
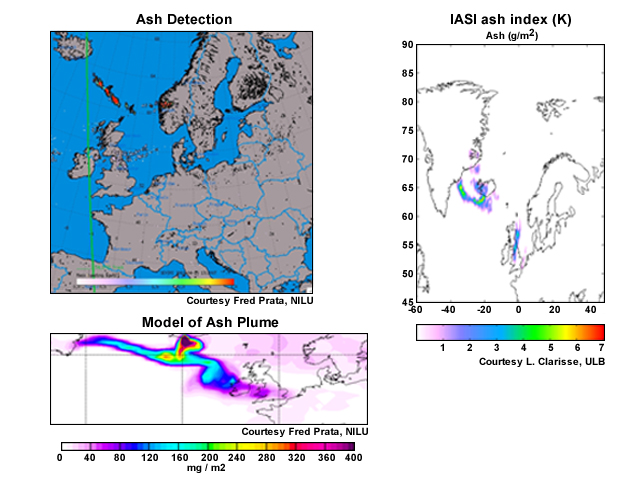
However, during the Eyjafjallajökul eruption in 2010, the aviation industry in Europe set a maximum volcanic ash loading of 2000 μg /m3 (later raised to 4000 μg /m3) through which it is deemed safe to fly. There is, therefore, interest in establishing methods for determining both presence of ash and ash mass loading in the atmosphere, in addition to providing information on the plume height.
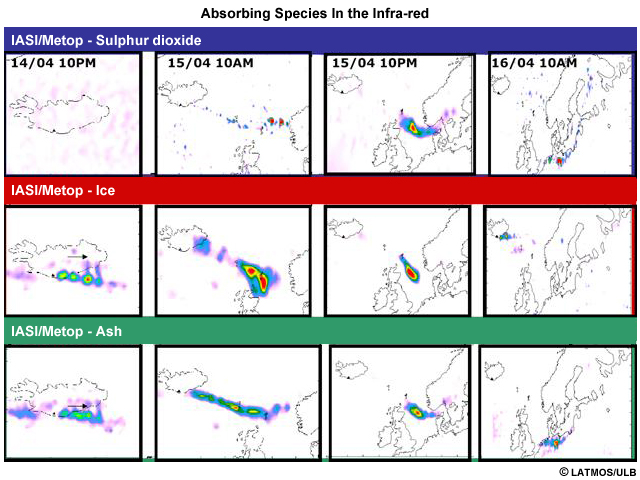
Knowledge of sulphur dioxide (SO2) concentrations in volcanic plumes is also of interest because it reacts with water vapour in the atmosphere to form sulphuric acid, which is corrosive and can also damage aircraft. Because of the regional and highly time-varying nature of a volcanic ash plume, geostationary observations are preferred, if available. They can, however, be complemented by data from polar-orbiting satellites.
Satellite Missions Monitoring Volcanic Ash and SO2
Satellite Missions Monitoring Volcanic Ash and SO2
Explore this table for information about past, current, and planned satellite missions. Primary measured species are in bold type.
| Instrument | Platform | Status | Species/Parameter | Viewing Geometry | Resources |
|---|---|---|---|---|---|
| AATSR | Envisat | Historic | Aerosol | Nadir | Link |
| MERIS | Envisat | Historic | Aerosol | Nadir | Link |
| MIPAS | Envisat | Historic | O3, CH4, N2O, NO2, HNO3, SO2, Aerosol and CFC's | Limb | Link 1 Link 2 |
| SCIAMACHY | Envisat | Historic | O3, NO2, BrO, SO2, HCHO, CHOCHO, OClO, UV, Aerosol, CH4, CO2 | Nadir & Limb | Link |
| MISR | Terra | Current | Aerosol | Nadir | Link |
| MOPITT | Terra | Current | CO | Nadir | http://www.acd.ucar.edu/mopitt/ |
| Sounder | GOES-12 - 15 | Current | Aerosol | Nadir | Link |
| AIRS | Aqua | Current |
O3, SO2, CO, CH4, CO2, Aerosol |
Nadir | Link |
| MLS | Aura | Current | BrO, CH3Cl, CH3CN, ClO, CO, HCl, HCN, HNO3, HO2, HOCl, N2O, O3, OH, SO2 | Limb | Link |
| OMI | Aura | Current | O3, NO2, BrO, SO2, HCHO, OClO, UV, Aerosol | Nadir | http://aura.gsfc.nasa.gov/instruments/omi.html http://www.knmi.nl/omi/research/news/newsWrap.php?language=only_en&timeFrame=latest&choise=page&path=research |
| TES | Aura | Current | CH4, CO, CO2, HNO3, NH3, O3 | Nadir | Link |
| GOME-2 | Metop-A, B, C | Current | O3, NO2, BrO, SO2, HCHO, CHOCHO, OClO, UV, Aerosol | Nadir | http://www.eumetsat.int/Home/Main/Satellites/Metop/Instruments/SP_2010053161447506 |
| IASI | Metop-A, B, C | Current | CO, CH4, O3, HNO3, NH3, SO2, C2H4, CH3OH, HCOOH, PAN, CO2, Aerosol | Nadir |
http://www.eumetsat.int/Home/Main/Satellites/Metop/Instruments/SP_2010053151047495 http://smsc.cnes.fr/IASI/ |
| SMILES | ISS/JEM | Current | O3, HCl, ClO, HNO3, CH3CN, HOCl, HO2, BrO |
Limb | Link |
| OMPS | Suomi NPP, JPSS-1, JPSS-2 | Current | O3, NO2, BrO, SO2, HCHO, UV, Aerosol | Nadir & Limb | http://npp.gsfc.nasa.gov/omps.html |
| CrIS | Suomi NPP, JPSS-1, JPSS-2 | Current | CO, CH4, O3, SO2, CO2, Aerosol | Nadir | http://npp.gsfc.nasa.gov/cris.html |
| MODIS | Aqua, Terra | Current | Aerosol | Nadir | Link |
| CALIOP | CALIPSO | Current | Aerosol | Nadir | Link |
| POLDER | PARASOL | Current | Aerosol | Nadir | Link |
| AVHRR/3 | NOAA-15 to 19, Metop-A, -B, -C | Current | Aerosol | Nadir | http://noaasis.noaa.gov/NOAASIS/ml/avhrr.html |
| OCM | OCEANSAT-2, -3, -3A | Current | Aerosol | Nadir | http://www.isro.org/satellites/oceansat-2.aspx |
| VIIRS | Suomi NPP, JPSS-1, JPSS-2 | Current | Aerosol | Nadir | http://npp.gsfc.nasa.gov/viirs.html |
| Sentinel-5 Precursor | Sentinel-5 Precursor | Future | O3, NO2, BrO, SO2, HCHO, CHOCHO, OClO, UV, Aerosol, CH4 | Nadir | Link |
| Sentinel-5 | EPS-SG | Future | O3, NO2, BrO, SO2, HCHO, CHOCHO, OClO, UV, Aerosol, CH4, CO2 | Nadir | Link |
| OLCI | Sentinel-3 A, B, C | Future | Aerosol | Nadir | http://www.esa.int/esaLP/SEMTST4KXMF_LPgmes_0.html |
| SLSTR | Sentinel-3 A, B, C | Future | Aerosol | Nadir | http://www.esa.int/esaLP/SEMTST4KXMF_LPgmes_0.html |
| ALADIN | ADM-Aeolus | Future | Aerosol | Nadir | http://www.esa.int/esaLP/ESAES62VMOC_LPadmaeolus_0.html |
| ABI | GOES-R, GOES-S | Future | Aerosol | Nadir | Link |
| ATLID | EarthCARE | Future | Aerosol | Nadir | http://www.esa.int/esaLP/ASESMYNW9SC_LPearthcare_0.html |
| MSI | EarthCARE | Future | Aerosol | Nadir | http://www.esa.int/esaLP/ASESMYNW9SC_LPearthcare_0.html |
| FCI | MTG-I 1, 2, 3, 4 | Future | Aerosol | Nadir | http://www.eumetsat.int/Home/Main/Satellites/MeteosatThirdGeneration/Instruments/index.htm |
| PCWMP | PCW-1, -2 | Future | Aerosol | Nadir | Link |
| GEMS | GeoKOMPSAT-2B | Future | O3, NO2, SO2, HCHO, UV, Aerosol | Nadir | Link |
| Sentinel-4 | MTG-S A & B | Future | O3, NO2, BrO, SO2, HCHO, CHOCHO, UV, CH4, CO, Aerosol | Nadir | http://www.esa.int/esaLP/SEM3ZT4KXMF_LPgmes_0.html |
| GACM | GACM | Future* | O3, CO, NO2, CH2O, SO2, N2O, HNO3, ClO, Aerosol | Nadir & Limb | http://decadal.gsfc.nasa.gov/gacm.html |
| GEO-CAPE | GEO-CAPE | Future* | O3, NO2, BrO, SO2, HCHO, OClO, UV, CO, Aerosol | Nadir | Link |
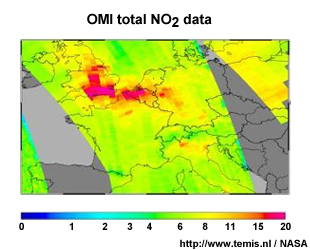
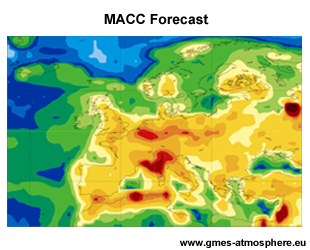
Air Quality Monitoring & Forecasting
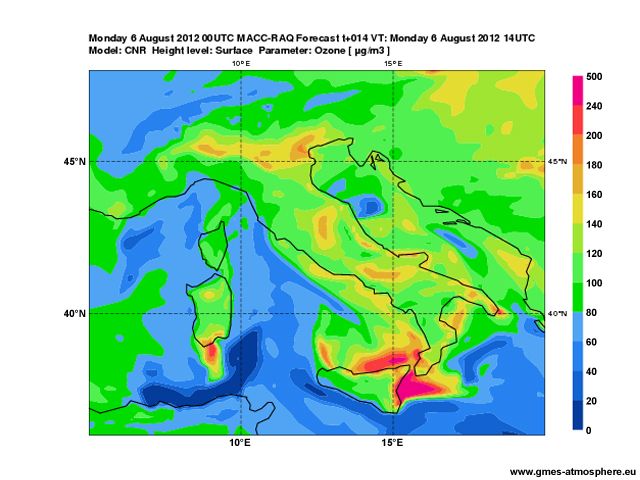
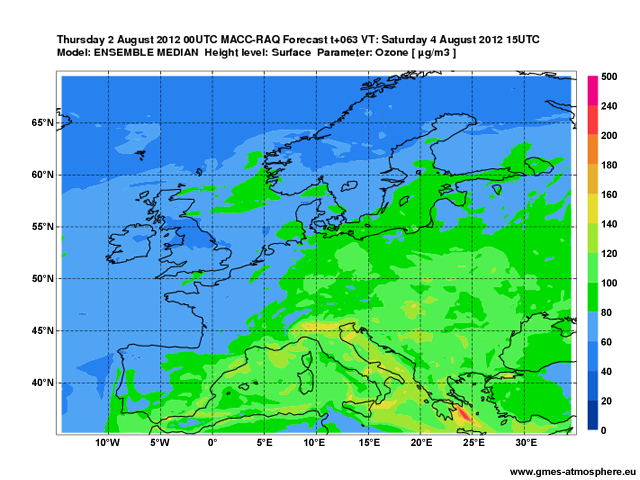
MACC Regional Fcst.
U.S. Regional Fcst.
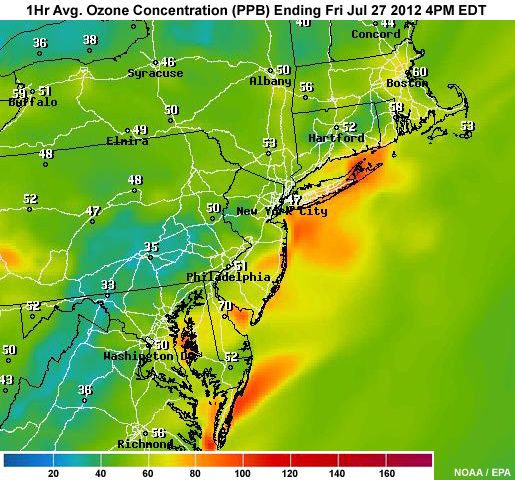
Increasingly, satellite data are contributing to regional air quality monitoring and forecasting, which historically have been carried out using in-situ measurements and local and regional-scale chemistry transport models. However, advances in satellite instrumentation and retrieval techniques have established the use of satellite data measurements to support regional air quality forecasting.
Regional and local air quality monitoring and forecasting are primarily associated with processes occurring in the planetary boundary layer, although uplift and long-range transport also play a role. Therefore, space-based air quality measurements should discriminate the lowest levels from the atmosphere above using knowledge of the tropospheric vertical structure and have a ground footprint small enough to resolve cities and other pollution hot spots. These are challenging prerequisites for space-based observations for a number of reasons:
- To sense the lowest layers of the atmosphere, it is necessary to look through the complete atmosphere to “see” the surface. However, information on the vertical structure in the troposphere is typically limited to one or at most two pieces of information.
- Reducing the ground pixel size decreases the number of photons arriving at the space craft and makes it more challenging to design instruments with the required signal to noise and performance needed to extract the small signals from atmospheric trace gases.
- The troposphere is often obscured by cloud which effectively blocks the view of the troposphere and surface from space. Smaller ground pixels provide an increased number of cloud-free pixels and therefore improve the information content.
- The surface characteristics must generally be well-known as it also provides the background to the atmospheric measurements.
Other Information Sources
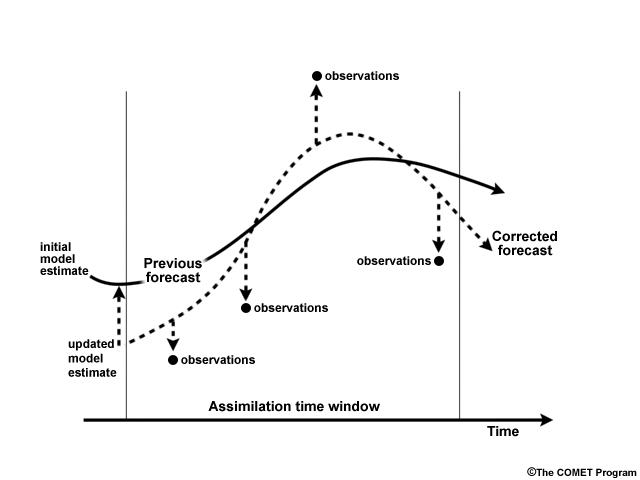
Even our most sophisticated satellite data products have limitations when addressing regional and local air quality issues. As a result, it is essential to combine satellite data with in-situ and model data. Assimilation of satellite-based trace gas measurements into global models is now becoming possible because of advances in computer hardware, allowing coupling of computationally expensive chemical models to numerical weather prediction assimilation systems. Improvements in our understanding of the processes governing these species and advances in data assimilation techniques both play a role.
The global assimilated fields can be used to provide boundary conditions for regional-scale models, but assimilation at regional scales is challenging and still under development. The assimilation of satellite data into operational regional air quality forecasts is expected to become an operational activity in the near future.
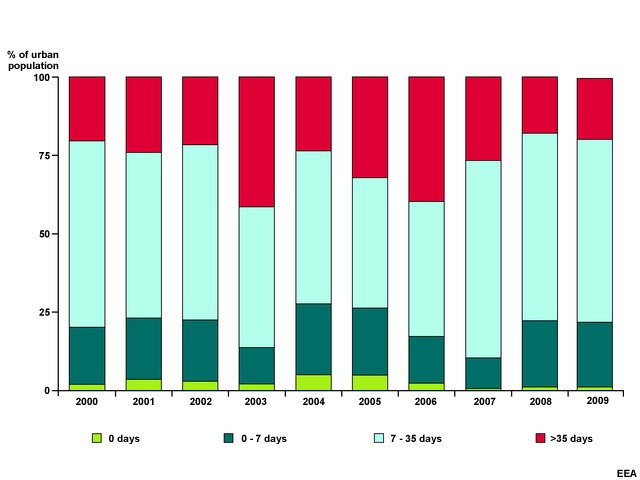
Percentage of urban populations in areas with PM10 concentration exceeding daily limit value
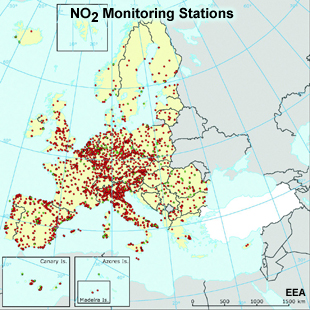
At the local scale (street canyon, etc.), in-situ data are still critically important because it is not possible to resolve processes that can take place on scales on 100s of metres or less with the spatial resolution of currently available satellite data. In-situ measurements are also required to satisfy regulatory monitoring requirements such as the Air Quality Directives put in place by the European Commission or National Ambient Air Quality Standards set by the U.S. Environmental Protection Agency.
Satellite data provide important information on pollution sources in cases of regulatory exceedances, either directly or through global and regional data assimilation. Such exceedances can have legal consequences, and knowledge of whether or not the pollution is local or distant in origin is important.
Satellite Missions Monitoring Air Quality
Satellite Missions Monitoring Air Quality
Explore this table for information about past, current, and planned satellite missions. Primary measured species are in bold type.
| Instrument | Platform | Status | Species/Parameter | Viewing Geometry | Resources |
|---|---|---|---|---|---|
| AATSR | Envisat | Historic | Aerosol | Nadir | Link |
| MERIS | Envisat | Historic | Aerosol | Nadir | Link |
| SCIAMACHY | Envisat | Historic | O3, NO2, BrO, SO2, HCHO, CHOCHO, OClO, UV, Aerosol, CH4, CO2 | Nadir & Limb | Link |
| MISR | Terra | Current | Aerosol | Nadir | Link |
| MOPITT | Terra | Current | CO | Nadir | http://www.acd.ucar.edu/mopitt/ |
| Sounder | GOES-12 - 15 | Current | Aerosol | Nadir | Link |
| AIRS | Aqua | Current | O3, SO2, CO, CH4, CO2, Aerosol | Nadir | Link |
| OMI | Aura | Current | O3, NO2, BrO, SO2, HCHO, OClO, UV, Aerosol | Nadir | http://aura.gsfc.nasa.gov/instruments/omi.html http://www.knmi.nl/omi/research/news/newsWrap.php?language=only_en&timeFrame=latest&choise=page&path=research |
| TES | Aura | Current | CH4, CO, CO2, HNO3, NH3, O3 | Nadir | Link |
| GOME-2 | Metop-A, B, C | Current | O3, NO2, BrO, SO2, HCHO, CHOCHO, OClO, UV, Aerosol | Nadir | http://www.eumetsat.int/Home/Main/Satellites/Metop/Instruments/SP_2010053161447506 |
| IASI | Metop-A, B, C | Current | CO, CH4, O3, HNO3, NH3, SO2, C2H4, CH3OH, HCOOH, PAN, CO2, Aerosol | Nadir |
http://www.eumetsat.int/Home/Main/Satellites/Metop/Instruments/SP_2010053151047495 http://smsc.cnes.fr/IASI/ |
| OMPS | Suomi NPP, JPSS-1, JPSS-2 | Current | O3, NO2, BrO, SO2, HCHO, UV, Aerosol | Nadir & Limb | http://npp.gsfc.nasa.gov/omps.html |
| CrIS | Suomi NPP, JPSS-1, JPSS-2 | Current | CO, CH4, O3, SO2, CO2, Aerosol | Nadir | http://npp.gsfc.nasa.gov/cris.html |
| MODIS | Aqua, Terra | Current | Aerosol | Nadir | Link |
| CALIOP | CALIPSO | Current | Aerosol | Nadir | Link |
| POLDER | PARASOL | Current | Aerosol | Nadir | Link |
| AVHRR/3 | NOAA-15 to 19, Metop-A, -B, -C | Current | Aerosol | Nadir | http://noaasis.noaa.gov/NOAASIS/ml/avhrr.html |
| OCM | OCEANSAT-2, -3, -3A | Current | Aerosol | Nadir | http://www.isro.org/satellites/oceansat-2.aspx |
| VIIRS | Suomi NPP, JPSS-1, JPSS-2 | Current | Aerosol | Nadir | http://npp.gsfc.nasa.gov/viirs.html |
| Sentinel-5 Precursor | Sentinel-5 Precursor | Future | O3, NO2, BrO, SO2, HCHO, CHOCHO, OClO, UV, Aerosol, CH4 | Nadir | Link |
| Sentinel-5 | EPS-SG | Future | O3, NO2, BrO, SO2, HCHO, CHOCHO, OClO, UV, Aerosol, CH4, CO2 | Nadir | Link |
| OLCI | Sentinel-3 A, B, C | Future | Aerosol | Nadir | http://www.esa.int/esaLP/SEMTST4KXMF_LPgmes_0.html |
| SLSTR | Sentinel-3 A, B, C | Future | Aerosol | Nadir | http://www.esa.int/esaLP/SEMTST4KXMF_LPgmes_0.html |
| ALADIN | ADM-Aeolus | Future | Aerosol | Nadir | http://www.esa.int/esaLP/ESAES62VMOC_LPadmaeolus_0.html |
| ABI | GOES-R, GOES-S | Future | Aerosol | Nadir | Link |
| ATLID | EarthCARE | Future | Aerosol | Nadir | http://www.esa.int/esaLP/ASESMYNW9SC_LPearthcare_0.html |
| MSI | EarthCARE | Future | Aerosol | Nadir | http://www.esa.int/esaLP/ASESMYNW9SC_LPearthcare_0.html |
| FCI | MTG-I 1, 2, 3, 4 | Future | Aerosol | Nadir | http://www.eumetsat.int/Home/Main/Satellites/MeteosatThirdGeneration/Instruments/index.htm |
| GEMS | GeoKOMPSAT-2B | Future | O3, NO2, SO2, HCHO, UV, Aerosol | Nadir | Link |
| Sentinel-4 | MTG-S A & B | Future | O3, NO2, BrO, SO2, HCHO, CHOCHO, UV, Aerosol, CH4, CO | Nadir | http://www.eumetsat.int/Home/Main/Satellites/MeteosatThirdGeneration/Instruments/index.htm |
| PCWMP | PCW-1, -2 | Future | Aerosol | Nadir | Link |
| GACM | GACM | Future* | O3, CO, NO2, CH2O, SO2, N2O, HNO3, ClO, Aerosol | Nadir & Limb | http://decadal.gsfc.nasa.gov/gacm.html |
| GEO-CAPE | GEO-CAPE | Future* | O3, NO2, BrO, SO2, HCHO, OClO, UV, CO, Aerosol | Nadir | Link |
Composition-Climate Interaction
Additional Resources:
Monitoring
the Climate System with Satellites
Numerous activities monitor climate change in many parts of the Earth system. (For a discussion of the role of satellites, see the module, Monitoring the Climate System with Satellites.)
In the area of atmospheric composition and climate interaction, we will focus on the monitoring of atmospheric greenhouse gases—the primary emissions that are responsible for anthropogenic climate change. An important additional topic is the monitoring of aerosol parameters to better understand their role in climate change. Although water vapour is a potent greenhouse gas, and the amount of water vapour in the atmosphere will change in response to a changing climate, it is a secondary greenhouse gas (i.e., not a primary emission) and is not discussed here.
Currently, anthropogenic greenhouse gas emissions monitoring is based on bottom-up estimates reported at country-level (i.e., estimates based on economic data such as the amount of fuel consumed annually, etc.) and collated by the United Nations Framework Convention on Climate Change (UNFCCC). Given the central role that greenhouse gases play in climate change, independent verification of the reported estimates is needed, coupled with a better understanding of natural sources and sinks of greenhouse gases (i.e., natural surface fluxes).
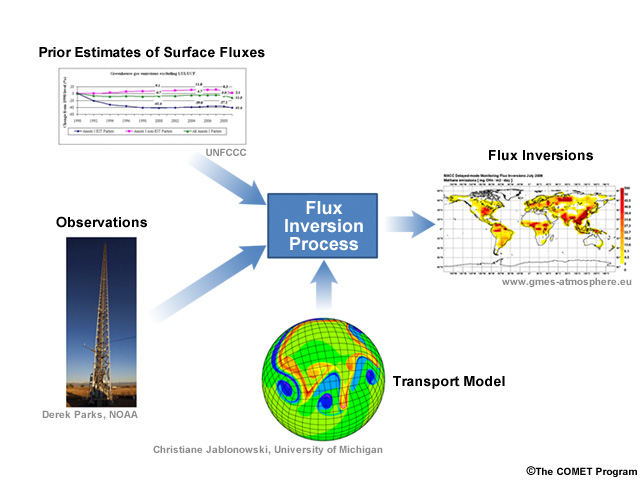
Top-down estimates of surface fluxes typically combine very sparse, but very accurate, ground-based remote sensing and in-situ measurements of greenhouse gases with a flux inversion model. This gives the optimal estimate of the total surface fluxes most consistent with the available measurements and the knowledge of atmospheric dynamics and transport processes provided by the model. Natural and anthropogenic bottom-up estimates are often used as a starting point in the flux inversion. The measurement network is currently very sparse. Therefore, the bottom-up estimates of natural and anthropogenic fluxes and the modelled transport processes, each of which have significant errors and uncertainties, dominate the resulting surface flux estimates in large areas. It is still very difficult to discriminate different source/sink types and to use flux inversion methods to provide independent verification of bottom-up reports of anthropogenic emissions.
Data Characteristics
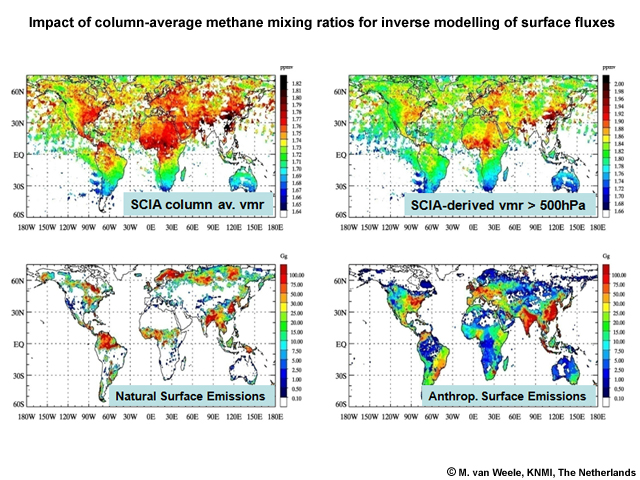
Using satellite-based greenhouse gas measurements to monitor global surface fluxes and potential hot-spots in anthropogenic emissions is an attractive option but a very challenging task because of the accuracy required. We will focus on measurements of carbon dioxide (CO2) and CH4. To monitor changes in the surface fluxes of these from space, the measurements must be very sensitive to the greenhouse gases in the planetary boundary layer, not only to those at higher altitudes. Estimates of the CO2 and CH4 column derived from measurements in the thermal infrared alone are sensitive primarily to the mid-upper troposphere and are not sufficient. Measurements made in the shortwave infrared (sometimes called near infrared), which are sensitive to the surface, are required.
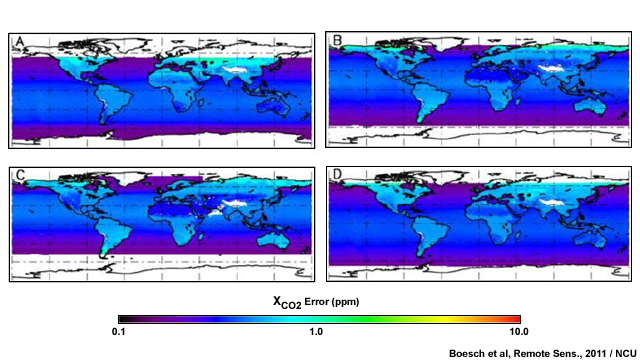
Distribution of the XCO2 retrieval errors for single soundings in glint mode for January (A), April (B), July (C) and October (D)
Additionally, as anthropogenic greenhouse gases are typically very long-lived in the Earth’s atmosphere (e.g., CO2 up to hundreds of years and CH4 ~ ten years), they are very well mixed. This means that the signal from regional and local variations in the surface fluxes is very small in the total signal measured at the satellite. As a result, satellite data must have very low biases (in particular, spatially varying biases) and very high precision for estimating surface fluxes. This requires scrupulous screening for residual aerosol and cloud effects in the measurements and very accurate calibration.
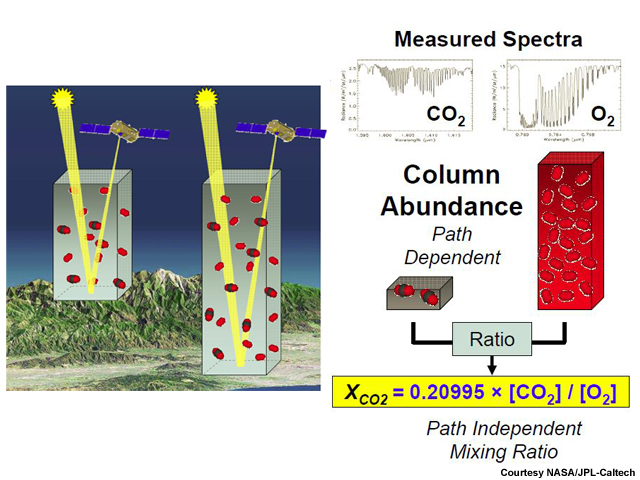
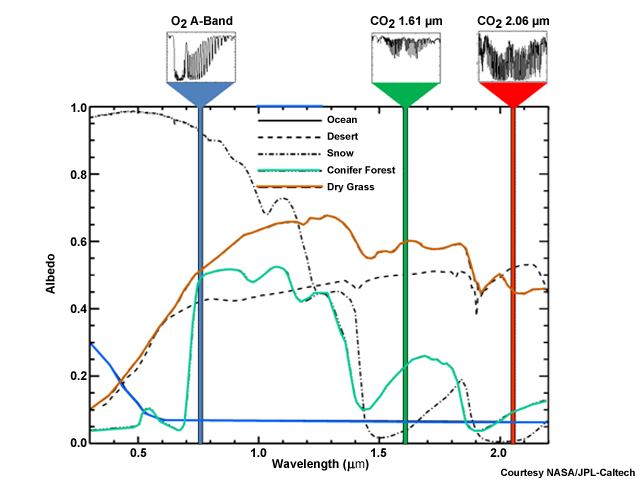
The quantity required for flux inversion modelling is the dry air mole fraction relative to the total atmospheric column at the point of the measurement (e.g. of carbon dioxide—XCO2 or methane—XCH4). This prevents variations in the overall air mass from being erroneously interpreted as variations in the greenhouse gas. The dry air mole fraction can be obtained using measurements from the Oxygen A-band at 760 nm as a proxy for the atmospheric column. This also has the advantage that any residual wavelength-independent calibration effects in the measurements will be normalised out in the final product.
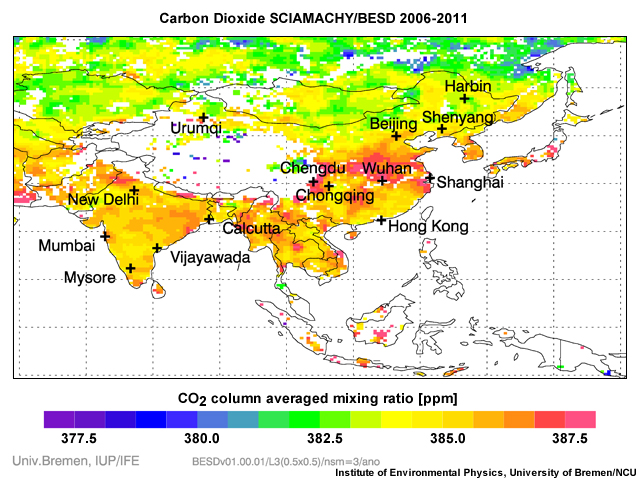
Monitoring greenhouse gases from space is still considered a research application because of the stringent requirements that must be satisfied if the data are to be useful for monitoring the surface fluxes. SCIAMACHY on ESA's ENVISAT satellite was not designed specifically for monitoring greenhouse gases. It has none the less provided estimates of XCO2 and XCH4, which have been tested in flux inversion systems.
Greenhouse Gas Missions
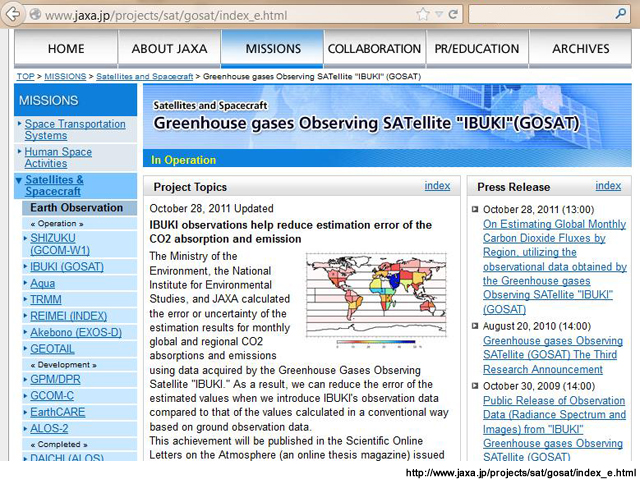
The first mission dedicated to monitoring greenhouse gases is the Japanese Aerospace Exploration Agency (JAXA)'s GOSAT “IBUKI,” launched on January 23, 2009 and carrying the TANSO Fourier Transform Spectrometer (FTS) and an accompanying Cloud and Aerosol Imager (CAI). International collaborative work is on-going to improve GOSAT calibration and to finalise the data products that can then be used for flux inversion calculations.
The NASA OCO mission, a grating spectrometer, also launched in 2009, failed to reach orbit. A replacement, OCO-2, is expected to be launched in 2014.
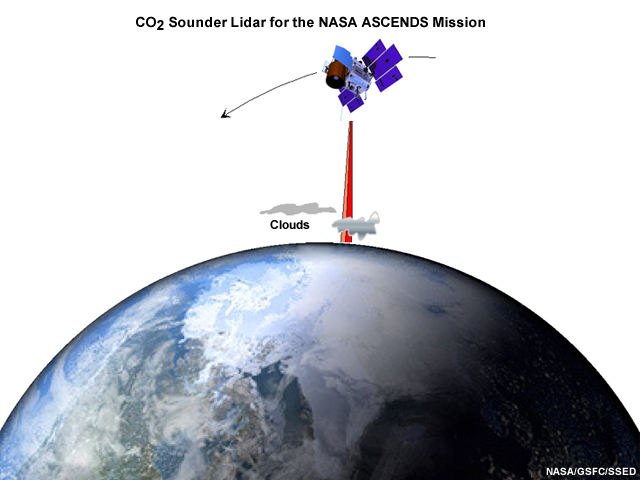
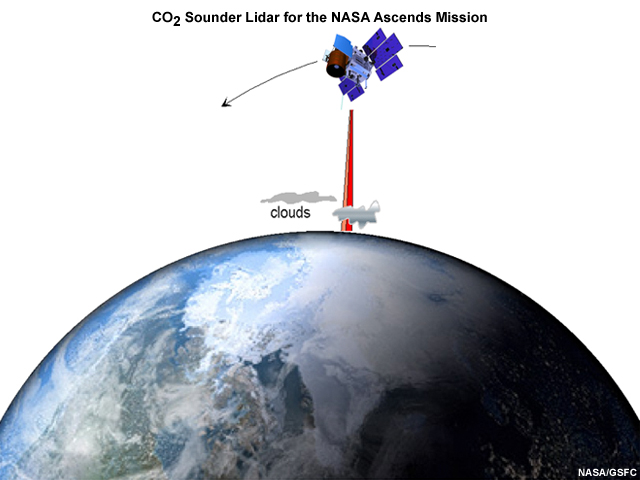
Satellite-based measurements of greenhouse gases using lidar are also possible, and there are lidar missions in the planning stages. If successful, they are expected to be very accurate, but would provide reduced spatial coverage compared to other planned missions.
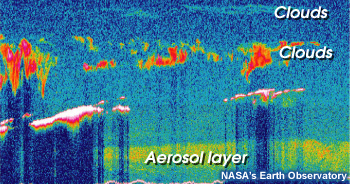
Data from the CALIPSO lidar showing clouds and an aerosol layer
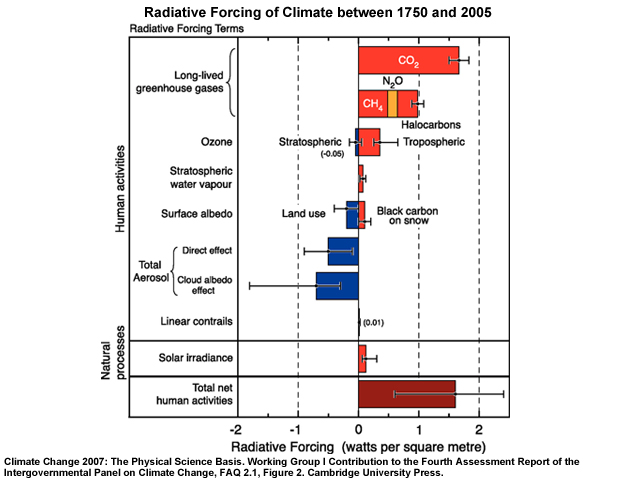
The 2007 Intergovernmental Panel on Climate Change (IPCC) report also identified one of the major uncertainties in our understanding of climate to be the radiative forcing from aerosols. Although significant advances have been made in estimating the direct forcing from aerosols, knowledge of the radiative forcing associated with secondary aerosol effects (such as those involved in cloud droplet nucleation and precipitation processes) remains highly uncertain. Important areas of research include improving the understanding of the interaction between aerosols, clouds, and precipitation processes.
Satellite Missions Monitoring Greenhouse Gases
Satellite Missions Monitoring Greenhouse Gases
Explore this table for information about past, current, and planned satellite missions. Primary measured species are in bold type.
| Instrument | Platform | Status | Species/Parameter | Viewing Geometry | Resources |
|---|---|---|---|---|---|
| AATSR | Envisat | Historic | Aerosol | Nadir | Link |
| MERIS | Envisat | Historic | Aerosol | Nadir | Link |
| MIPAS | Envisat | Historic | O3, CH4, N2O, NO2, HNO3,SO2, Aerosol and CFC's | Limb | Link 1 Link 2 |
| SCIAMACHY | Envisat | Historic | O3, NO2, BrO, SO2, HCHO, CHOCHO, OClO, UV, Aerosol, CH4, CO2 | Nadir & Limb | Link |
| MISR | Terra | Current | Aerosol | Nadir | Link |
| ACE-FTS | SCISAT-1 | Current | O3, CH4, N2O, NO2, NO, HNO3, HCl, HF, CO, CFC-11, CFC-12, N2O5, ClONO2, Aerosol . | Occultation | http://www.ace.uwaterloo.ca/instruments_acefts.html |
| Sounder | GOES-12 - 15 | Current | Aerosol | Nadir | Link |
| AIRS | Aqua | Current | O3, SO2, CO, CH4, CO2, Aerosol | Nadir | Link |
| TES | Aura | Current | CH4, CO, CO2, HNO3, NH3, O3 | Nadir | Link |
| TANSO-FTS | GOSAT | Current | CH4, CO2 | Nadir | Link
1 Link 2 |
| IASI | Metop-A, B, C | Current | CO, CH4, O3, HNO3, NH3, SO2, C2H4, CH3OH, HCOOH, PAN, CO2, Aerosol | Nadir |
http://www.eumetsat.int/Home/Main/Satellites/Metop/Instruments/SP_2010053151047495 http://smsc.cnes.fr/IASI/ |
| CrIS | Suomi NPP, JPSS-1, JPSS-2 | Current | CO, CH4, O3, SO2, CO2, Aerosol | Nadir | http://npp.gsfc.nasa.gov/cris.html |
| MODIS | Aqua, Terra | Current | Aerosol | Nadir | Link |
| CALIOP | CALIPSO | Current | Aerosol | Nadir | Link |
| POLDER | PARASOL | Current | Aerosol | Nadir | Link |
| AVHRR/3 | NOAA-15 to 19, Metop-A, -B, -C | Current | Aerosol | Nadir | http://noaasis.noaa.gov/NOAASIS/ml/avhrr.html |
| OCM | OCEANSAT-2, -3, -3A | Current | Aerosol | Nadir | http://www.isro.org/satellites/oceansat-2.aspx |
| VIIRS | Suomi NPP, JPSS-1, JPSS-2 | Current | Aerosol | Nadir | http://npp.gsfc.nasa.gov/viirs.html |
| Sentinel-5 Precursor | Sentinel-5 Precursor | Future | O3, NO2, BrO, SO2, HCHO, CHOCHO, OClO, UV, Aerosol, CH4 | Nadir | Link |
| Sentinel-5 | EPS-SG | Future | O3, NO2, BrO, SO2, HCHO, CHOCHO, OClO, UV, Aerosol, CH4, CO2 | Nadir | http://www.esa.int/esaLP/SEM3ZT4KXMF_LPgmes_0.html |
| OLCI | Sentinel-3 A, B, C | Future | Aerosol | Nadir | http://www.esa.int/esaLP/SEMTST4KXMF_LPgmes_0.html |
| SLSTR | Sentinel-3 A, B, C | Future | Aerosol | Nadir | http://www.esa.int/esaLP/SEMTST4KXMF_LPgmes_0.html |
| ALADIN | ADM-Aeolus | Future | Aerosol | Nadir | http://www.esa.int/esaLP/ESAES62VMOC_LPadmaeolus_0.html |
| ABI | GOES-R, GOES-S | Future | Aerosol | Nadir | Link |
| ATLID | EarthCARE | Future | Aerosol | Nadir | http://www.esa.int/esaLP/ASESMYNW9SC_LPearthcare_0.html |
| MSI | EarthCARE | Future | Aerosol | Nadir | http://www.esa.int/esaLP/ASESMYNW9SC_LPearthcare_0.html |
| FCI | MTG-I 1, 2, 3, 4 | Future | Aerosol | Nadir | http://www.eumetsat.int/Home/Main/Satellites/MeteosatThirdGeneration/Instruments/index.htm |
| PCWMP | PCW-1, -2 | Future | Aerosol | Nadir | Link |
| OCO-2 | OCO-2 | Future | CO2 | Nadir | http://oco.jpl.nasa.gov/ |
| MERLIN | MERLIN | Future | CH4 | Nadir | Link |
| GOSAT Follow-On | GOSAT Follow-On | Future | CH4, CO2 | Nadir | http://www.prime-pco.com/gosat2012/program.html |
| ASCENDS | ASCENDS | Future* | CO2 | Nadir | http://decadal.gsfc.nasa.gov/ascends.html |
Available Measurement Techniques
UV/Visible and SWIR Measurements
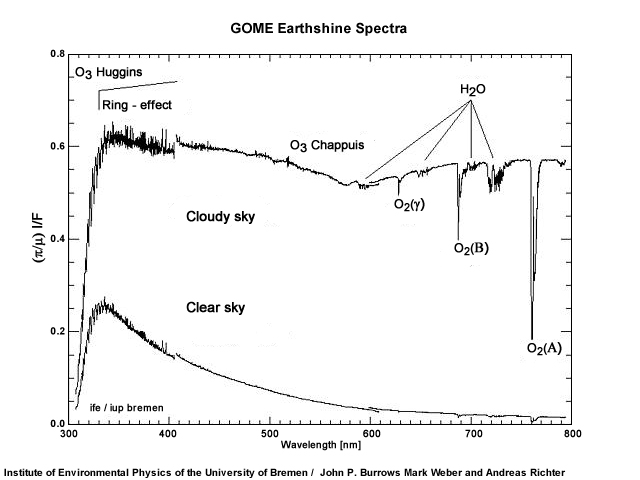
Many atmospheric composition measurements are made in the UV/Visible part of the spectrum. In this spectral range, satellite instruments measure the light from the Sun scattered back to the satellite from the molecules and particles in the atmosphere and from the surface for wavelengths longer than ~300 nm.

Radiative transfer calculations used to retrieve atmospheric trace gases from the UV/Visible part of the spectrum must therefore take account of scattering by molecules (Rayleigh scattering) and scattering by particles and clouds (Mie scattering).
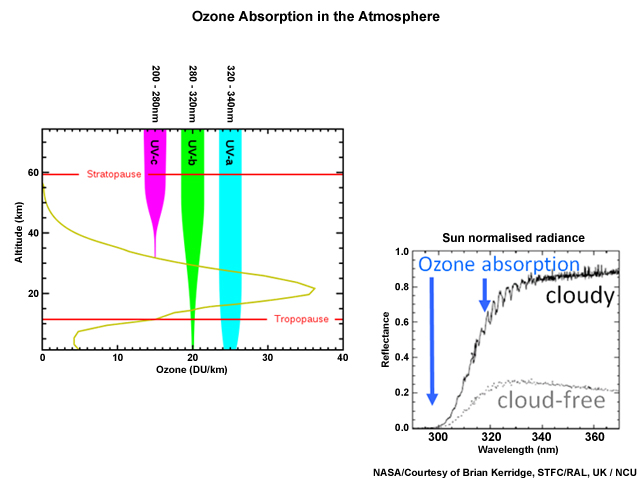
In the case of ozone, wavelengths from 270-340 nm from the Hartley-Huggins bands are typically used to obtain information on the ozone profile. This is possible because light absorbed by ozone in this spectral region is strongly wavelength dependent. As a result, the penetration depth in the atmosphere depends on wavelength, and comparing measurements at different wavelengths yields information about the ozone profile. Measurements have been made using the Hartley-Huggins bands for a variety of viewing geometries. Nadir measurements have the advantage of good spatial coverage, potentially at relatively high spatial resolution, but information on the vertical profile is difficult to obtain (with the exception of ozone for which coarse profile information is available).
Typically, instruments measuring in nadir are used to monitor the ozone hole and a number of other reactive trace gases. Ozone can also be measured in the Chappuis bands in the 500–700 nm spectral region. However, in nadir viewing geometry, the retrieval of ozone information can be hindered by the lack of accurate information regarding the surface albedo (which forms the background to the view of the atmosphere). This is not the case in limb or occultation geometry where the background to the measurements is cold space. Ozone profile measurements have also been made successfully in both geometries. Occultation measurements are self-calibrating and are therefore not prone to instrument calibration drift over time. As a result, they provide an important anchor point in long-term data sets such as those used for ozone monitoring.
39312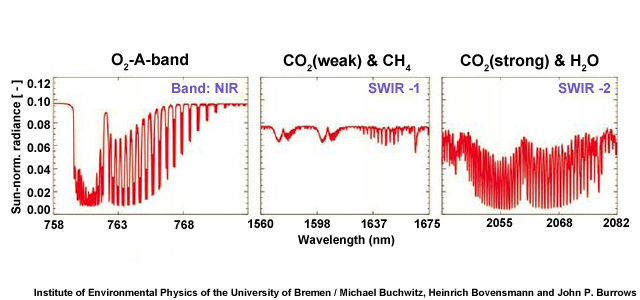
At longer wavelengths, measurements made in the shortwave infrared can be used to measure CO, CH4, and CO2 with sensitivity to the surface in the 1.6, 2.0, and 2.3 micron CO2, CH4 and CO bands.
At these wavelengths, there is still a contribution to the signal measured from solar radiation back-scattered at the surface. However, signal levels (particularly over the ocean) are very low, and over the land an accurate knowledge of the land cover type and wavelength-dependent surface albedo is required.
Nadir, Limb, Occultation
Nadir-viewing measurements can provide good spatial coverage at potentially high spatial resolution, although it may be necessary to trade coverage for spatial resolution depending on the instrument design. However, the vertical resolution of measurements made in nadir-viewing geometry is typically limited.
Limb measurements provide improved information on the vertical profile but their penetration into the troposphere can be limited by clouds, and in some spectral regions water vapour, in the field of view.
The advantage of occultation measurements is that they are inherently self-calibrating, looking directly at either the Sun or stars, both with and without the atmosphere in the field of view. They can therefore provide very accurate data. Their disadvantage is that measurements are relatively sparse but they none-the-less provide very useful anchor points for long-term data sets.
Thermal Infrared
Additional Resources:
Advanced
Satellite Sounding: The Benefits of Hyperspectral Observation - 2nd Edition
Instruments measuring in the thermal infrared part of the spectrum also collect data on a large array of atmospheric trace gases. When measuring in the infrared, it is necessary to take account of absorption and emission of all species in the spectral region of interest, including the background to the field of view.
Since thermal infrared absorption and emission vary depending on the local temperature, measurements made in limb-viewing geometry are greatly simplified. This is because the background to the field of view is the cold background of space where it is much easier to isolate signals from the atmosphere from those of the background.
Increasing the spectral resolution also makes it easier to isolate the absorption lines of species of interest from others that may absorb in the same spectral region. This is particularly important for atmospheric trace gases, which are often present in the atmosphere in very small amounts and have very weak signatures in the atmospheric spectrum.
A number of limb-viewing infrared instruments are used to address scientific research questions related to atmospheric composition. They have measured an impressive array of species, advancing research in the chemistry of the upper troposphere and stratosphere. However, their penetration into the troposphere is limited by clouds in the field of view. Therefore, limb-viewing instruments are less appropriate for air pollution and air quality studies.

With the advent of nadir-viewing, hyperspectral sounders, a wide range of atmospheric species can be detected, even against the warm background of the land surface. Some of these species can also be observed in the UV/Visible part of the spectrum, but many cannot. (See the module, Advanced Satellite Sounding: The Benefits of Hyperspectral Observation - 2nd Edition.) This capability relies on high spectral resolution and good noise performance of the instrument and is enhanced in situations when the thermal contrast between the surface and the levels of the atmosphere of interest is greatest.
Microwave/Millimetre-wave
Limb measurements in the microwave have successfully monitored a range of species, many relevant to observing the stratospheric ozone layer and others used to monitor long-range transport.
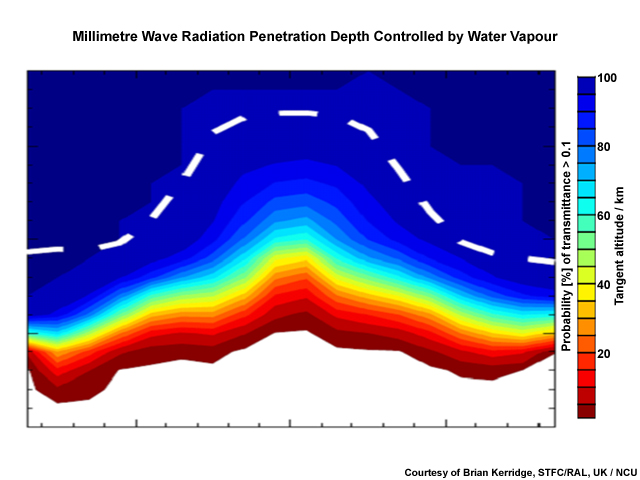
One advantage of measurements made in this part of the spectrum is that they can be obtained in the presence of ice clouds and aerosol that prevent measurements in the shorter wavelength, infrared part of the spectrum.
Nadir measurements of atmospheric trace gases in this spectral region are not feasible because the water vapour dominates the signal from the atmosphere and from the surface.
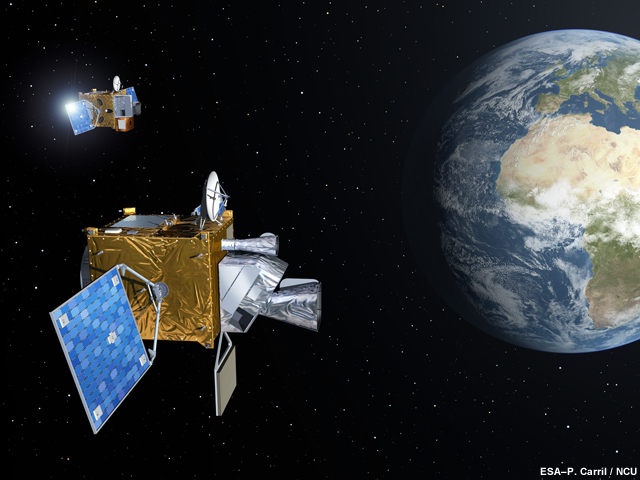
EUMETSAT and European Space Agency Missions and Future Plans
Past Missions
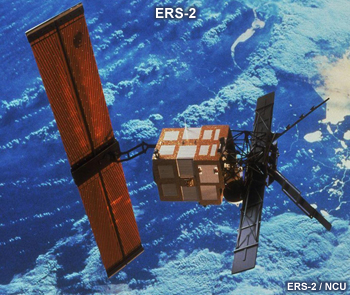
ERS2: GOME-2
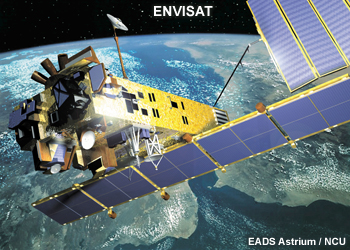
ENVISAT: SCIAMACHY, MIPAS, and MERIS
The first European missions addressing atmospheric composition were research missions flown by the European Space Agency (ESA) on the ERS-2 platform, which carried GOME, and on ENVISAT, which carried SCIAMACHY, MIPAS, and MERIS.
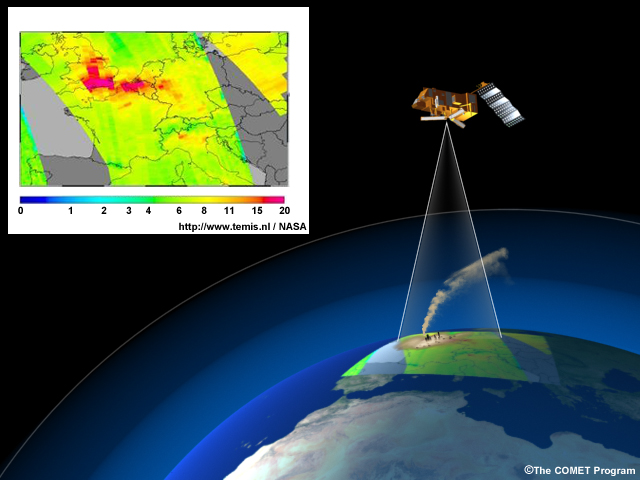
Average annual changes in tropospheric nitrogen dioxide, as observed by GOME from 1996 to 2002
GOME on ERS-2 was a UV/Visible, nadir-viewing, grating spectrometer, which successfully demonstrated the measurement of trace gases, in addition to ozone, from spectrally resolved satellite measurements in the UV-Visible spectral region. In particular, measurements of O3, NO2, SO2, BrO, HCHO, water vapour, and absorbing aerosol index were made, some of which have been used to estimate long-term trends in emissions.
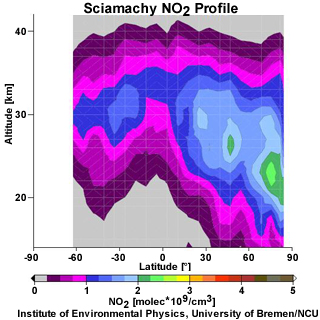
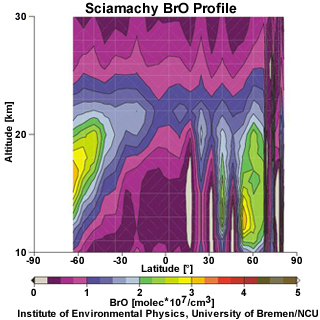
SCIAMACHY on ENVISAT continued the success of GOME by making nadir measurements of these species in the UV/Visible with the added benefit of a limb-viewing capability, which enabled profiles of ozone, NO2, and BrO to be measured.
In addition, SCIAMACHY included channels in the SWIR, which enabled measurement of the greenhouse gases CH4, and CO2.

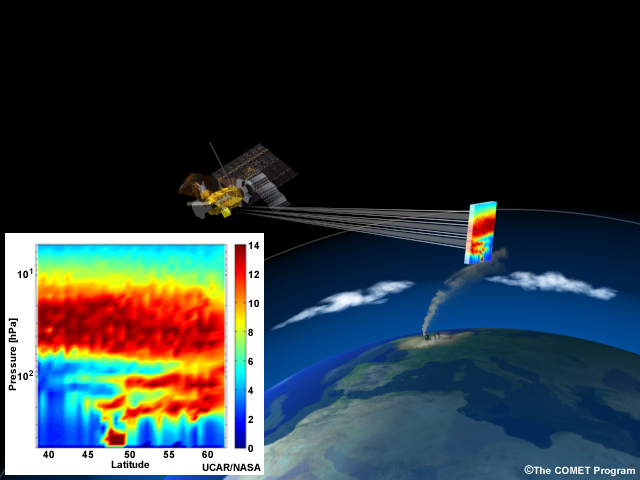
Latitudinal PAN distribution, averaged zonally and over 10 days between 4 October and 1 December, 2003
At the same time, MIPAS was demonstrating the capability of limb-viewing in the infra-red region of the spectrum. MIPAS is a Fourier Transform spectrometer measuring limb emission spectra in the middle and upper atmosphere, providing information on temperature and a range of atmospheric species including O3, H2O, CH4, N2O, NO2 and HNO3.
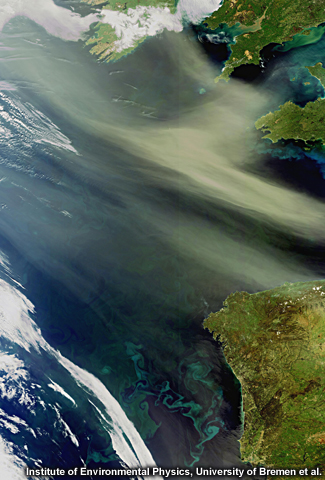
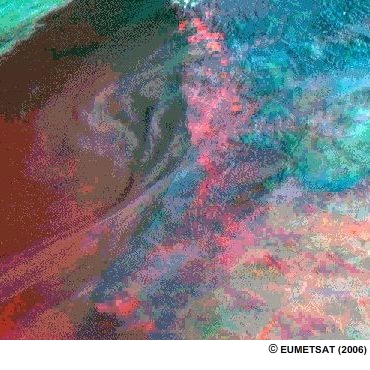
A satellite view of dust and sand from the Algerian Sahara Desert blowing west across the Atlantic Ocean. Plankton blooms are visible as blue and green swirls.
MERIS, also on board ENVISAT, was a programmable, medium-spectral resolution imaging spectrometer operating in the solar reflective range with fifteen selectable spectral bands. MERIS' main contribution to atmospheric applications has been through the measurement of clouds, precipitation, and aerosol information. In addition, MERIS provides information relevant to surface and ocean applications.
With the success of these research missions, there has been a move to include instruments targeting atmospheric composition applications on operational platforms.
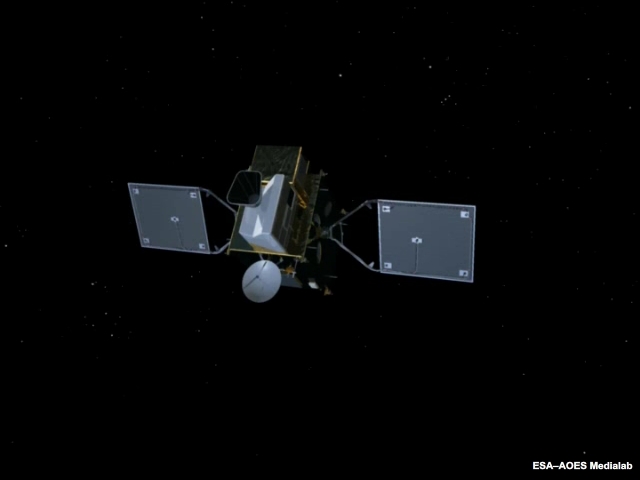
Current Missions
Additional Resources:
An
Introduction to the EUMETSAT Polar System
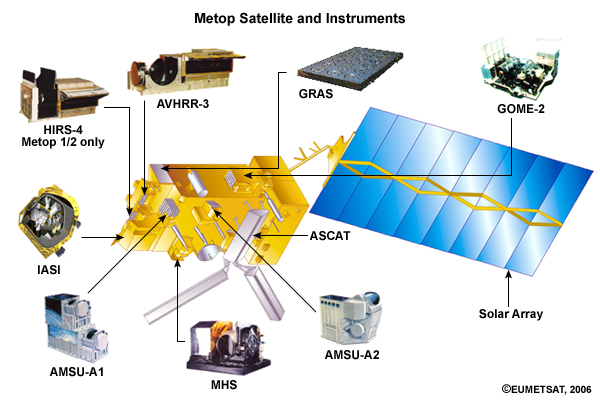
The EUMETSAT Polar System (EPS) mission series provides continuous, long-term data sets to support operational meteorological and environmental forecasting and global climate monitoring. (See the module An Introduction to the EUMETSAT Polar System.) The EPS system comprises three Metop satellites, the first of which was launched on 19 October 2006, with the second launched in September 2012, and the third planned for launch in the 2017/2018 timeframe.
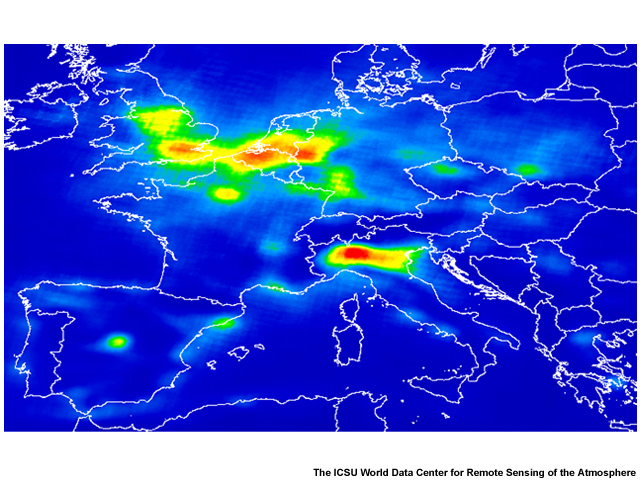
Total amount of nitrogen dioxide (NO2) in the atmosphere above Europe derived from one year of data from the GOME-2 instrument on Metop-A (March 2007 - February 2008)
GOME-2 (Global Ozone Monitoring Experiment-2), flown on EPS, measures ozone, trace gases, and aerosol in the UV/Visible part of the spectrum. In comparison to its predecessor, GOME-2 has significantly improved spatial resolution (from 40 x 320 km to 40 x 40 km), which is a benefit for measuring trace gas information in the troposphere, particularly for tropospheric ozone and NO2.
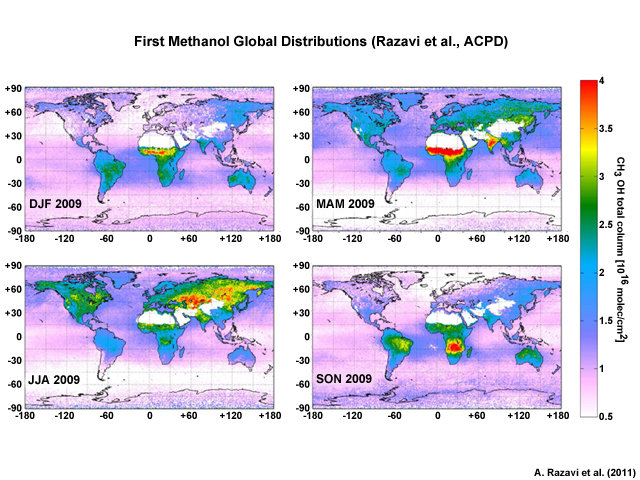
IASI methanol measurements
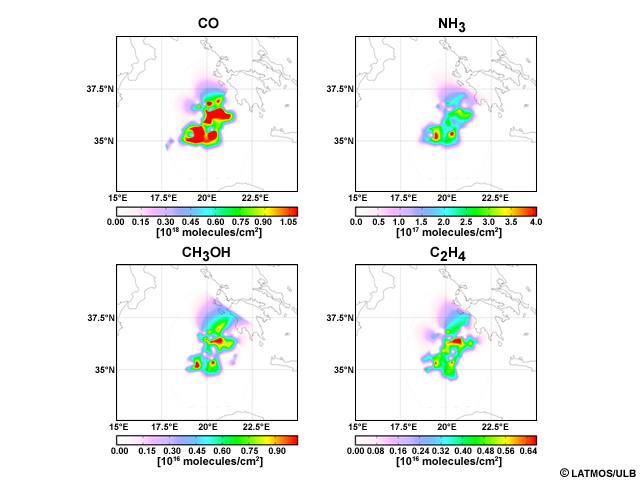
In addition to GOME-2, IASI, also flown on EPS, is an infrared Fourier transform spectrometer that provides a wealth of information on atmospheric trace gases although it is primarily dedicated to monitoring temperature and humidity. It provides operational information on ozone, carbon monoxide, and SO2 and has been used to detect a number of minor trace gases, in particular in biomass burning and fire events. IASI can also be used to detect volcanic ash. Excitingly, IASI has also been used to provide the first global measurements of ammonia sources, methanol, and formic acid from space.
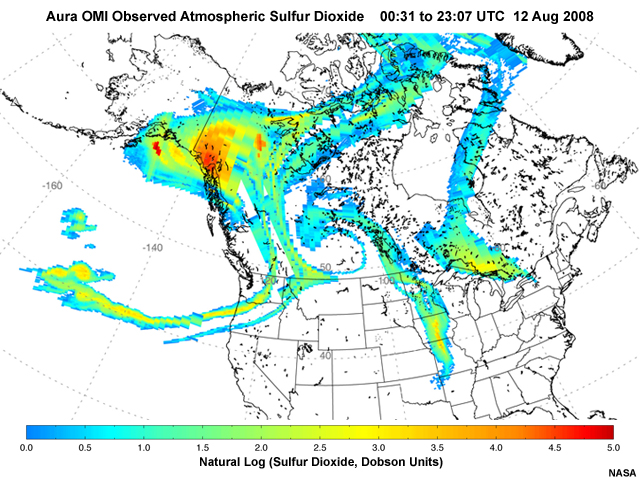
Although not specifically designed for atmospheric composition applications, Meteosat Second Generation MSG/SEVIRI can be used to detect volcanic ash and SO2. As MSG is a geostationary platform, MSG/SEVIRI provides observations with a very high time resolution, which can be very valuable in, for example, a volcanic eruption.
Future Research Missions
ESA is currently considering two missions targeting atmospheric composition in the ESA Earth Explorer 7 & 8 Programmes:
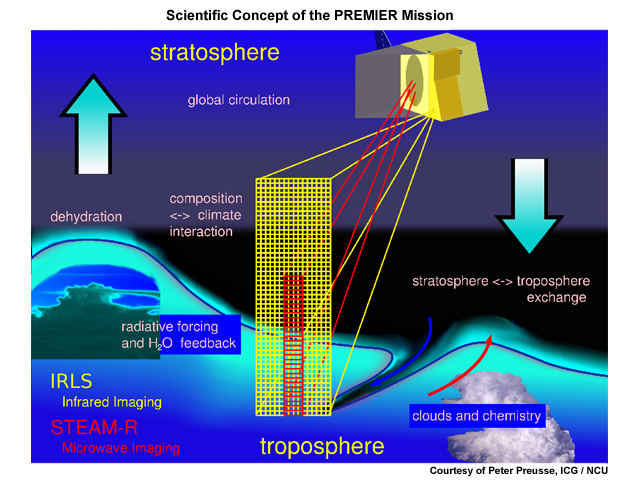
- The PREMIER mission (carrying the IRLS limb-viewing infrared Fourier transform spectrometer and the STEAM-R limb-viewing millimetre wave emission radiometer) will examine processes in the mid/upper troposphere and lower stratosphere that link atmospheric composition and climate. PREMIER measurements in the millimetre part of the spectrum are expected to provide an improved ability to penetrate into the upper troposphere because of the selection of different frequency bands.
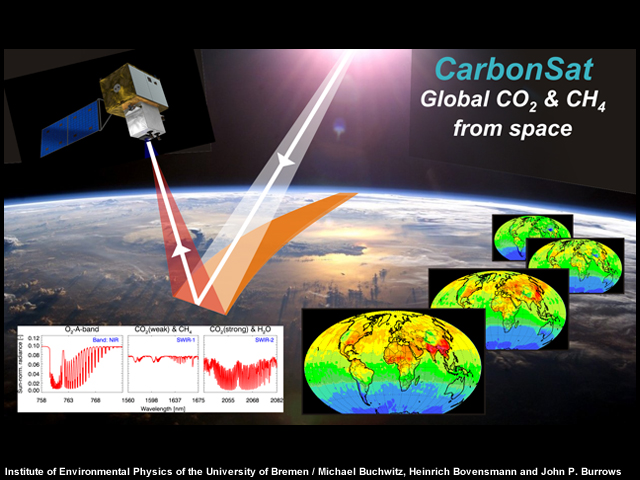
- The CarbonSat mission focussing on monitoring CO2 and CH4 and identification of hot-spots.
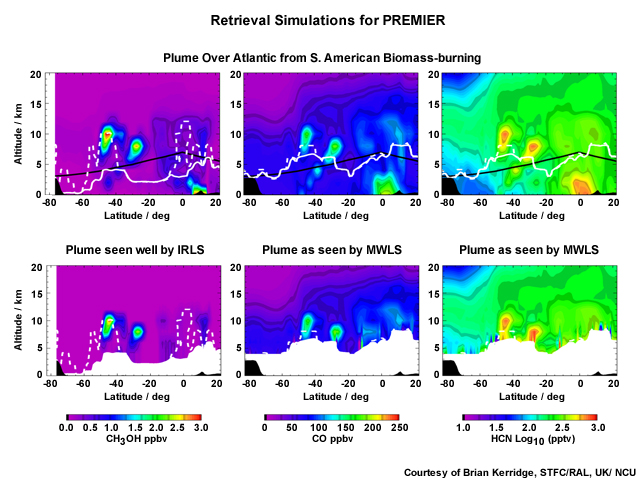
PREMIER will observe 3-D distributions from space for the first time with the resolution needed to quantify:
- Impacts on surface climate of detailed distributions and dynamical coupling
- Trace gas exchange between troposphere and stratosphere
- Impacts of convection, pyroconvection and their outflow on the UTLS (Upper Troposphere and Lower Stratosphere)
- Processes linking higher layers with the lower troposphere
In combination with data from EPS-SG, fields will be extended into the lower troposphere.
CarbonSat will map the detailed spatial pattern of CO2 emissions from moderate to strong localized emission sources such as coal-fired power plants. CarbonSat also has the capability to monitor the CO2 emissions of major cities and from strong geological sources such as volcanoes. Similar capabilities also exist for methane, which has strong localized emission sources such as large waste disposal sites or fugitive emissions from large oil and gas industrial facilities or clusters.
Future Operational Missions
The Meteosat Third Generation (MTG) system is a two-platform system. The MTG imaging platform will be launched in 2017. This platform will carry the Flexible Combined Imager, which will, in addition to other products, provide improved information on aerosol and volcanic ash as compared to the current generation of geostationary imagers.
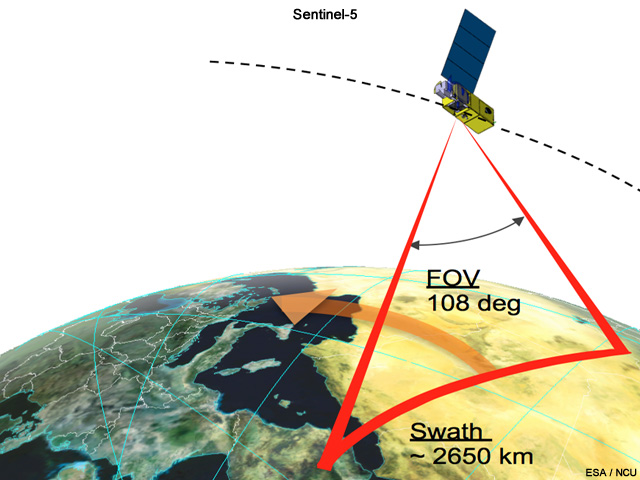
Additionally, the MTG Sounding platform is planned for launch in 2019. It will carry the new GMES Sentinel-4 mission, which will focus exclusively on monitoring European air quality. This will be the first UV/Visible spectrometer flown in geostationary orbit. It will fly alongside the MTG/Infrared sounder, the first hyperspectral sounder flown in geostationary orbit. Although the MTG/IRS is not optimised for atmospheric composition applications, it is hoped that under favourable conditions it will provide information on ozone and carbon monoxide.

Sentinel-4 has heritage from the GOME/SCIAMACHY/GOME-2/OMI series of instruments. Its primary focus will be on the monitoring of air quality in the European domain with high spatial and temporal resolution. Like other nadir instruments measuring in the UV, it will make measurements of O3, NO2, BrO, SO2, HCHO, CHOCHO etc. The spatial resolution will be ~ 7 x 7 km with hourly temporal resolution.
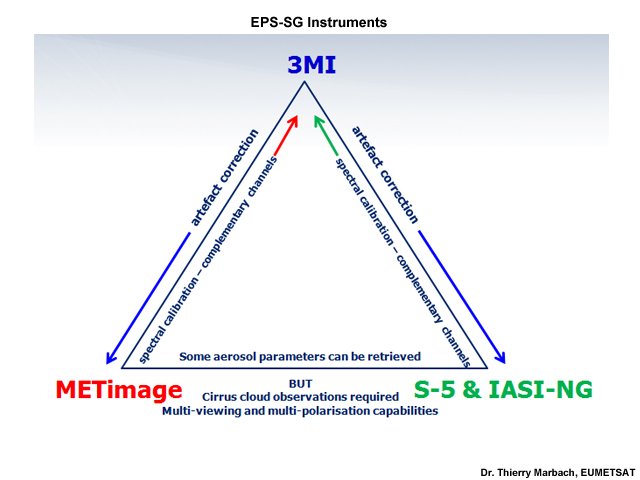
The EPS Second Generation (EPS-SG)–the follow-on to the EPS system–is planned for launch in about 2020 and will carry an improved infrared sounder (IASI-NG) with enhanced capabilities for measuring atmospheric trace gases. EPS-SG will also carry the GMES Sentinel 5 (provided by ESA), which, in addition to the species measured by GOME-2, will also measure CO and CH4, all at significantly higher spatial resolution. In addition, there are plans to fly a dedicated aerosol mission called 3MI, which is a multi-angle, multi-polarisation, multi-spectral instrument targeting aerosol properties. This will be complemented by an improved imaging instrument called MetImage that can detect aerosol optical thickness and size distribution.
Like Sentinel-4, Sentinel-5 will build on the heritage from the GOME/SCIAMACHY/GOME-2/OMI series of instruments and will provide continuity with the long-term data series collected by these instruments. The spatial resolution will be significantly improved as compared to previous missions, which is important to support development of air quality applications.
In addition to Sentinel-4 and Sentinel-5, ESA plans to launch the Sentinel-5 Precursor, also a UV/Visible spectrometer with the capability to measure CO and potentially CH4 and with improved spatial resolution. The Sentinel-5 Precursor is a joint initiative between ESA and the Netherlands and is expected to be launched in 2015.
NOAA and NASA Missions and Future Plans
Past and Current Missions

NASA and NOAA have flown a number of research and operational polar-orbiting satellite missions to monitor atmospheric composition. Possibly the best known are the TOMS and SBUV series of instruments dedicated to monitoring stratospheric ozone since the late 1970's. Another important research mission, the UARS platform, carried a range of instruments targeting upper atmosphere research including UARS MLS (or Microwave Limb Sounder).
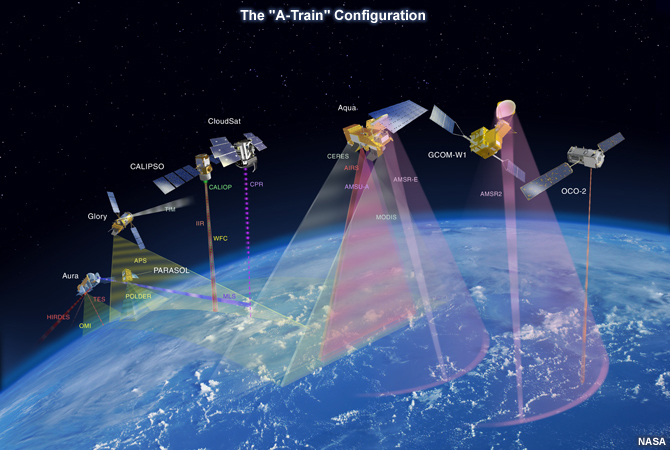
More recently, the EOS-Aura, Terra, and Aqua platforms have carried an array of instruments including OMI, MODIS, MISR, MOPITT, and AIRS, with the CALIPSO-CALIOP mission providing information on aerosol and aerosol-cloud interactions. To coordinate their observations, these polar-orbiting satellites fly in a line only minutes apart from each other in a formation referred to as the A-Train.
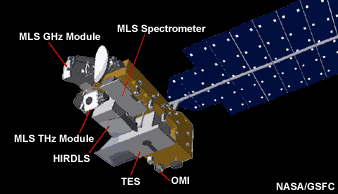
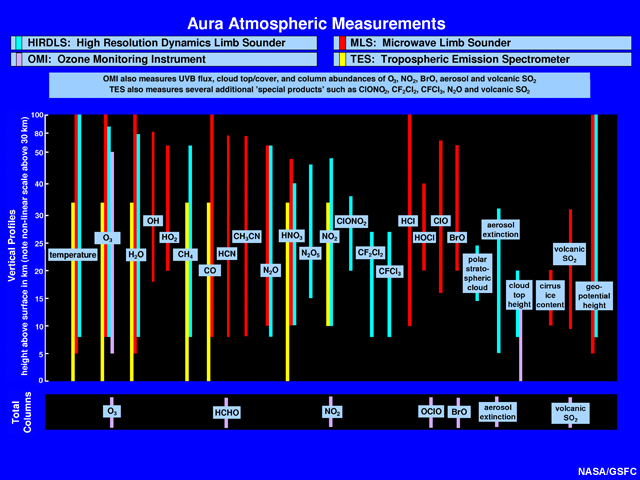
Launched in 2004 and dedicated to atmospheric chemistry, the EOS-Aura satellite's four instruments, HIRDLS, MLS, OMI, and TES, have made important contributions to observations of trace gases and atmospheric parameters to improve our understanding of chemical transport, and physical and chemical processes in Earth's atmosphere.
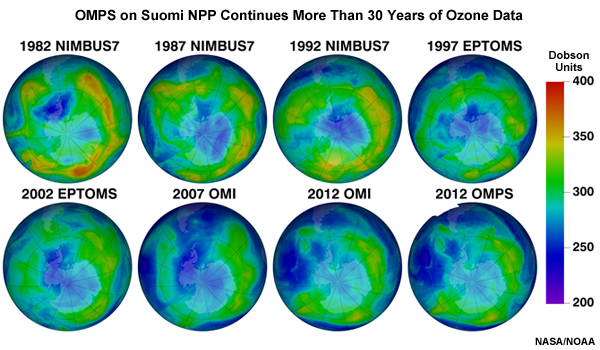
A multi-mission retrospective of ozone monitoring from the beginning (1982 Nimbus) to the present (with NPP-OMPS)
Operational ozone monitoring has been conducted with SBUV/2 flying on six NOAA platforms since 1978. October 2011 marked the beginning of a new era in ozone monitoring with the launch of the Suomi NPP satellite carrying the OMPS (Ozone Mapping and Profiler Suite) instrument.
In addition to measuring total ozone content, OMPS is capable of measuring the vertical structure of ozone with improved resolution and accuracy from the stratosphere down into the troposphere. When combined with the established ozone record, these newer measurements will shed additional light on how ozone is distributed, its sources and sinks, and how it is transported by the atmosphere.
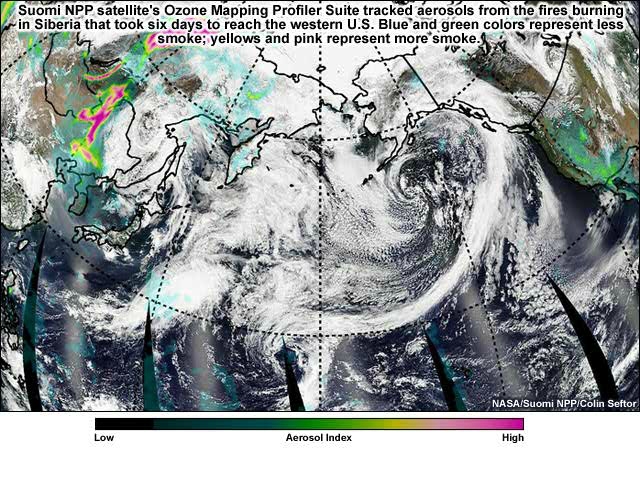
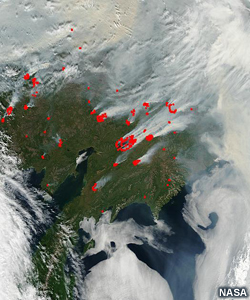
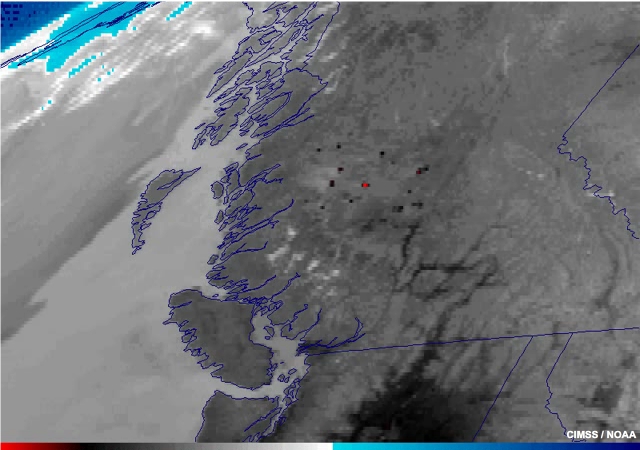
Similar to predecessor ozone monitoring missions, OMPS can measure other atmospheric constituents, including SO2 and aerosols such as blowing dust, smoke, and volcanic ash. This 6-frame sequence shows the OMPS aerosol index tracking smoke from Siberian fires as it travels across the Pacific Ocean and into the U.S. and Canada.
Also on board the current Suomi NPP polar-orbiting satellite and planned for future operational JPSS satellites is the CrIS hyperspectral infrared sounder. CrIS is similar to the NASA AIRS and Metop IASI instruments and joins the operational NOAA-Metop constellation that provides both mid-morning and early afternoon coverage. While its primary mission is profiling atmospheric temperature and moisture, CrIS is capable of monitoring carbon dioxide, carbon monoxide, water vapour, methane, and nitric acid. CrIS extends the monitoring mission that began in 2002 with NASA's Atmospheric Infrared Sounder (or AIRS).
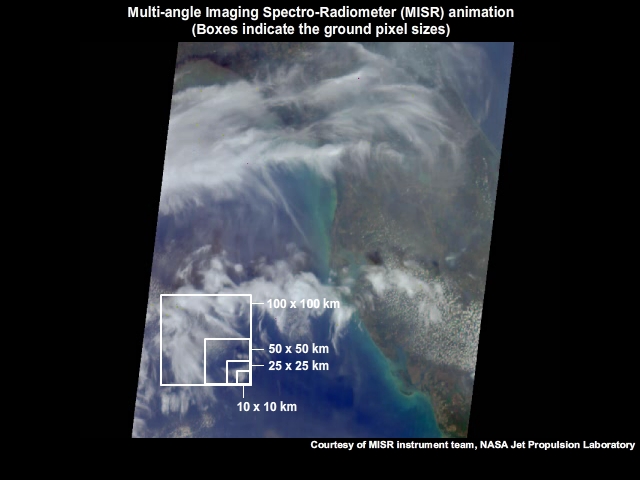
The MISR instrument launched on board NASA's EOS Terra polar-orbiting satellite in 1999 provides unique observations of clouds, aerosols, and the planet's surface based on how each uniquely scatters sunlight.

The instrument produces multi-angle imagery at five fixed angles on the day side of the Earth and is able to cover the entire Earth's surface within 9 days. MISR's data allow scientists to study the effects of air pollution, volcanic eruptions, and land use changes (such as desertification and soil erosion) on clouds, aerosols, and pollutants to improve computer models that predict future climate.
In geostationary orbit, the GOES-West and GOES-East geostationary platforms stationed at 75 West and 135 West respectively, provide information on water vapour and aerosols (such as dust, smoke, and ash) primarily from the 5-channel visible and infrared imager.
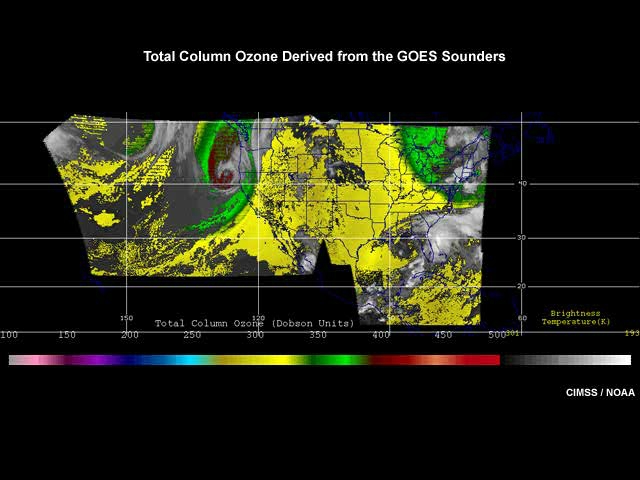
Current GOES satellites also carry a dedicated sounding instrument. While its primary mission is profiling temperature and moisture, the sounder's 18 channels enable estimation of total column ozone and upper level SO2 from volcanic eruptions. Despite the sounder's limited coverage geographically, its more frequent refresh rate when compared to polar-orbiting satellites means it can begin tracking volcanic plumes not long after an eruption.
Future Missions
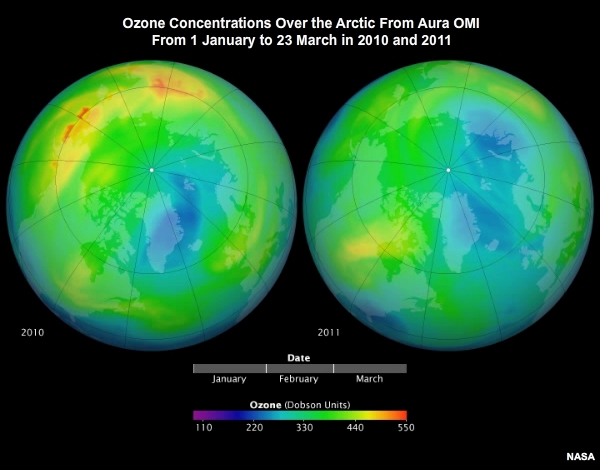
NOAA plans to extend the satellite-based ozone data record well into the 2020's by including OMPS on future U.S. operational JPSS-1 and -2 polar-orbiting satellites. OMPS measurements are critical for understanding climate and the complex chemical reactions that result in depletion of stratospheric ozone in the Earth's polar regions.
Additional atmospheric constituents will be monitored operationally on the JPSS satellites by the CrIS hyperspectral sounder. CrIS extends the monitoring record for trace gases and trends made by NASA's AIRS hyperspectral sounder launched in 2002 and nearing the end of its operational life.
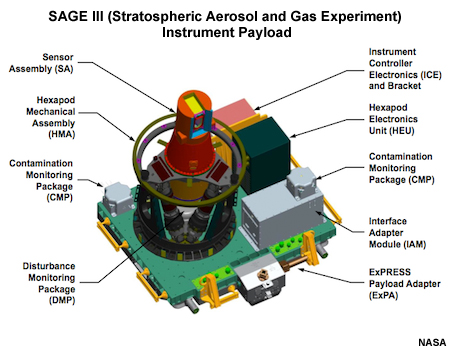
SAGE III will continue the legacy of the SAGE missions that began making long-term measurements of ozone, aerosols, water vapour, and other gases in the Earth's upper troposphere and lower stratosphere in 1979. Instead of flying on a polar-orbiting satellite, plans are for SAGE III to be placed on the International Space Station in late 2014.
The SAGE III mission is an important part of NASA's Earth Observation System for measuring key global atmospheric constituents and monitoring their long-term variability. The primary focus of SAGE III on the space station is to study aerosols, clouds, water vapour, nitrogen dioxide, nitrogen trioxide, chlorine dioxide, pressure, and temperature. These play crucial roles in stratospheric chemistry and the catalytic cycles that deplete stratospheric ozone.
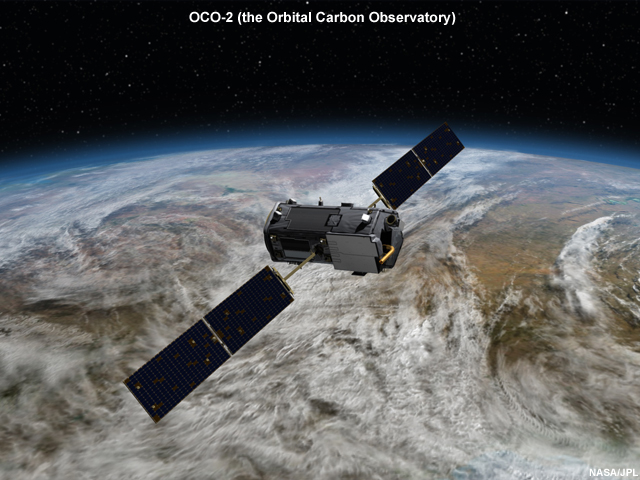
As mentioned earlier, an important new satellite for monitoring atmospheric carbon dioxide is NASA's planned OCO-2 mission. Planned for launch in 2013, OCO-2 will obtain the most precise measurements of atmospheric CO2 ever made from space, tracking both seasonal cycles and year-to-year changes. To remove diurnal variations in CO2 and discriminate between seasonal variations and long-term changes, measurements will be made from a sun-synchronous orbit. This enables viewing over a given point on the Earth's surface at approximately the same local solar time.
OCO-2 will fly in formation with several other missions in NASA's A-Train constellation of polar-orbiting research satellites.
Other Planned Missions

Satellite view of a massive phytoplankton bloom off the Atlantic coast of Patagonia
One of the future missions planned by NASA is GEO-CAPE. With launch expected in the 2013 to 2016 timeframe, GEO-CAPE is intended to advance science about coastal ecosystems and air quality by measuring both aerosols and air quality from the same platform. The scales of variability of these processes require high spatial and temporal resolution sampling possible only from geosynchronous Earth orbit.
NASA's ASCENDS mission concept is being developed for more precise monitoring and profiling of global atmospheric carbon dioxide. The instrument would use an active sensor technology, such as a lidar, to help quantify global spatial distributions of atmospheric CO2 sources and sinks on scales used by weather prediction models in 2020 and beyond. The technology is in development with launch of an ASCENDS mission planned for 2019.

The next generation GOES satellites will begin with GOES–R that is expected to launch in late 2015. The GOES-R series will begin nearly a decade of service to improve the quality and timeliness of weather and other environmental observations with a 16-channel multispectral imager known as the ABI (Advanced Baseline Imager).
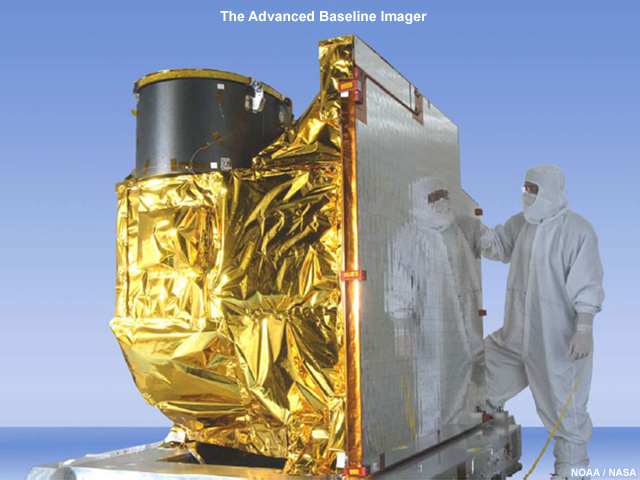
The ABI's expanded spectral coverage, increased spatial resolution, and more frequent scan rate will improve detection and monitoring of human-induced and natural hazards across the Western Hemisphere. These include dust, smoke, and aerosols that lead to smog formation and degrade visibility as well as ozone, volcanic ash, and sulphur dioxide that impact air quality.
Operational Services
Europe
Operational data products from satellite missions have been developed to support operational services that monitor, forecast, and regulate various aspects of atmospheric composition. In Europe, this is being addressed in the frame of the Global Monitoring for Environment and Security (GMES) initiative, which includes the development of a GMES Atmosphere Service (GAS) (via the EC FP7 MACC project, which is currently providing pre-operational services and is expected to be fully operational by 2014).
The MACC project includes partners from more than 30 European institutes and provides services related to the following thematic areas:
- Global atmospheric composition
- European air quality
- Climate
- UV
- Solar energy
- Stratospheric ozone
These thematic areas can be grouped into global, regional, and policy-relevant service lines.
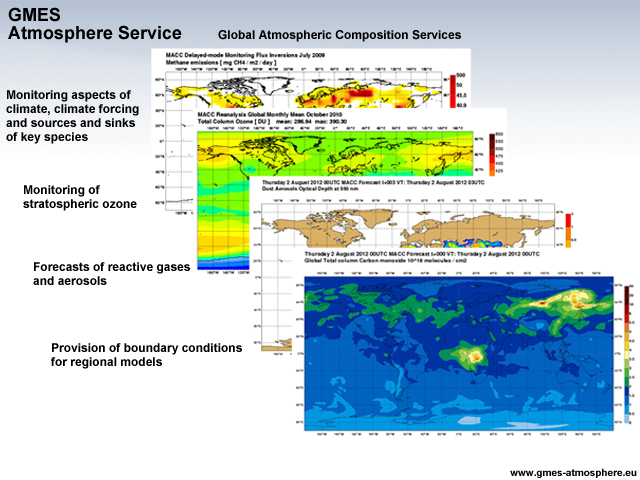
The global atmospheric composition services provide global assimilated fields and forecasts of a number of atmospheric trace gases on a routine operational basis. Global services provide:
- Monitoring of aspects of climate, climate forcing, and the sources and sinks of key species
- Monitoring of stratospheric ozone
- Forecasts of reactive gases and aerosols, and
- Boundary conditions for regional models
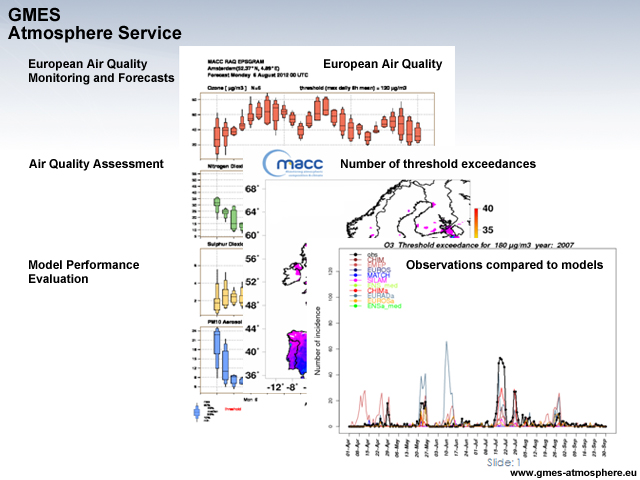
The European air quality services estimate European air quality based on an ensemble of air quality forecast fields, the results of which are used to inform the public or to provide policy-relevant information for assessing the state of European air quality. European services provide:
- Air quality forecasts from high-resolution regional systems
- Air quality assessments based on retrospective running of the regional systems using validated observational data
- Model performance evaluations by comparison to observations
UV radiation assessments and forecasts and solar-energy resource assessments and forecasts are also provided.
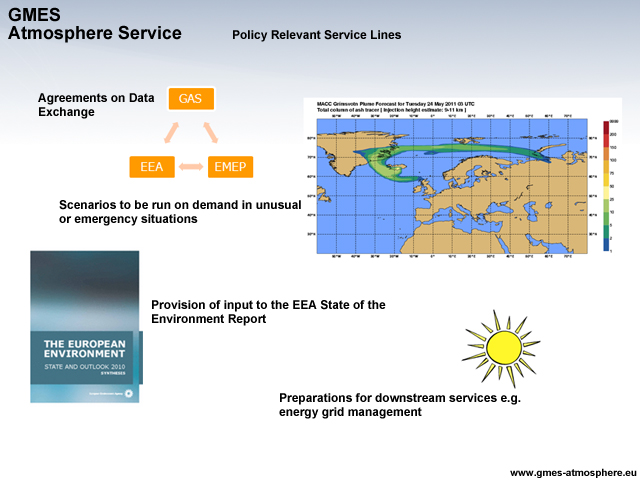
Service lines for policy development include establishing effective dialogue with the European Environment Agency (EEA), national and regional environment agencies, and the European Monitoring and Evaluation Programme (EMEP). Activities include:
- Agreements on data exchange
- Preparation of scenarios to be run on demand in unusual or emergency situations
- Provision of agreed input to the EEA State of the Environment report, and
- Preparations for downstream services in contexts such as energy grid management, which incorporate solar energy and related applications
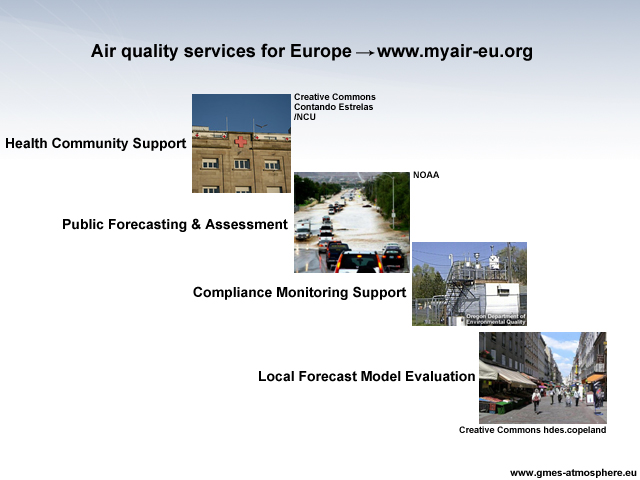
The MACC project underpinning the GMES Atmosphere Service development is supplemented by the EC FP7 project PASODOBLE, a project intended to develop and demonstrate user-driven information services (MYAIR services) for the regional and local air quality sector by combining space-based data, in-situ data, and models in four thematic service lines:
- Health community support for people at risk, hospitals, pharmacies, and doctors
- Public forecasting and assessment for regions, cities, tourist industries, and sporting event organisers
- Compliance monitoring support on particulate matter for regional environmental agencies, and
- Local forecast model evaluation support for local authorities and city governing bodies
U.S.
U.S. satellite operators, NOAA and NASA, provide satellite data to support operational services that track and forecast atmospheric composition for applications related to air quality, atmospheric chemistry, biogeochemistry, and climate monitoring.
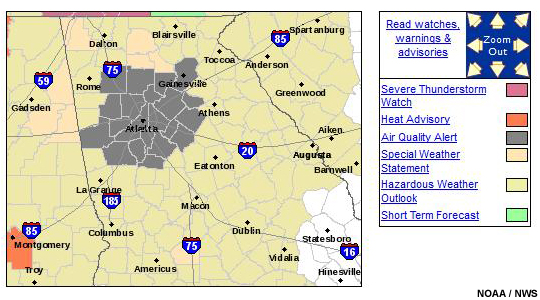
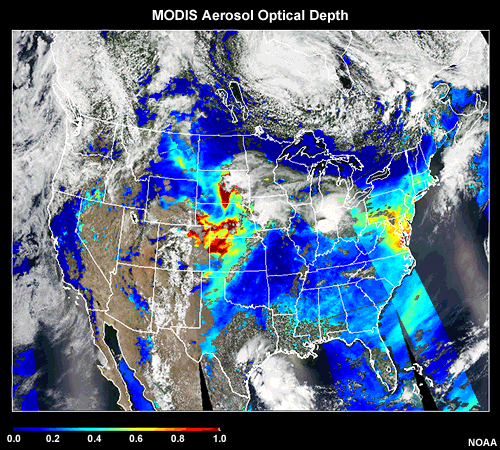
For air quality, multiple agencies are working in partnership to blend satellite, ground-based, and other in situ observations that improve analyses and numerical model predictions. Those efforts result in air quality updates and forecast products that alert the public to potentially hazardous conditions and the associated threat level.
The product examples shown here are the result of a multi-agency partnership between the Environmental Protection Agency (EPA), NOAA, NASA, and the National Weather Service to disseminate air quality information and forecasts to the public via the Internet. A forecast system produces analyses and hourly forecast concentrations of ozone, smoke, and dust.
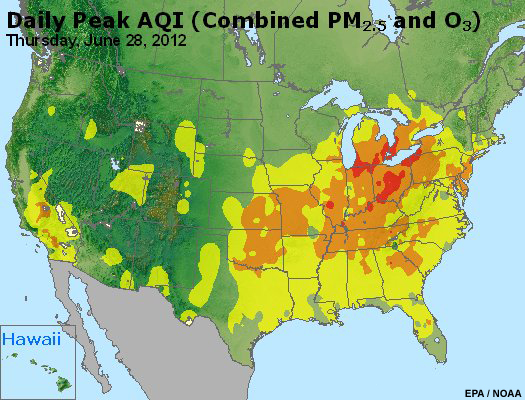
To be more useful to the general public, constituent data streams are also blended into a single Air Quality Index product, which is then posted to the EPA's Web site.
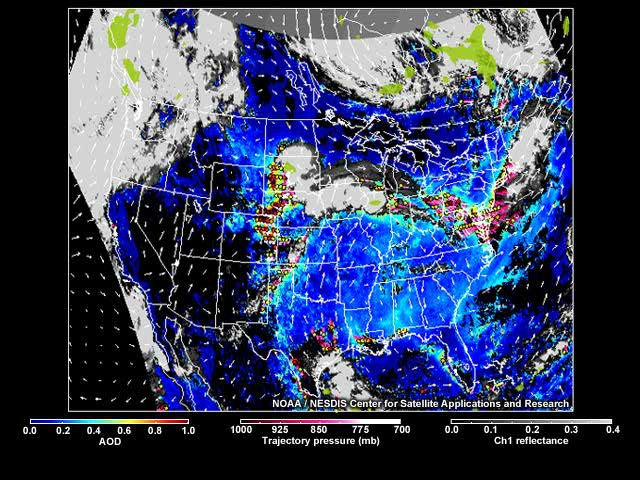
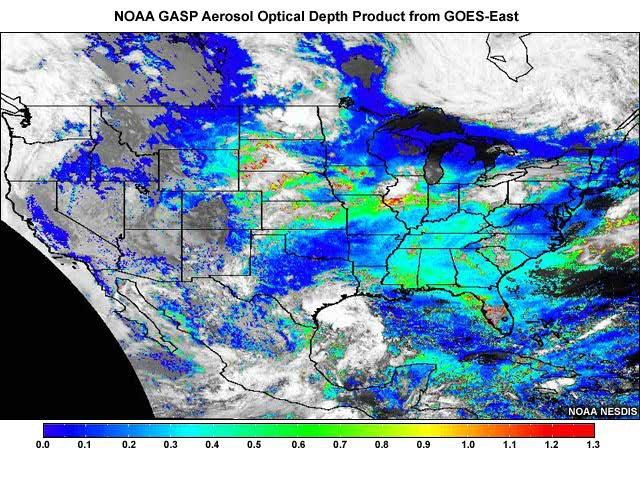
Efforts to increase the satellite input to aerosol and trace gas forecasts are being demonstrated by a joint NASA, NOAA, and EPA effort known as IDEA (Infusing Satellite Data into Environmental Applications). The animation shows a 48-hour forecast of aerosol optical depth and trajectories based on blending satellite and ground-based measurements, meteorological observations, and computer modelling. Most notable are the plumes of smoke carried eastward by westerly winds from wildfires in the western U.S.
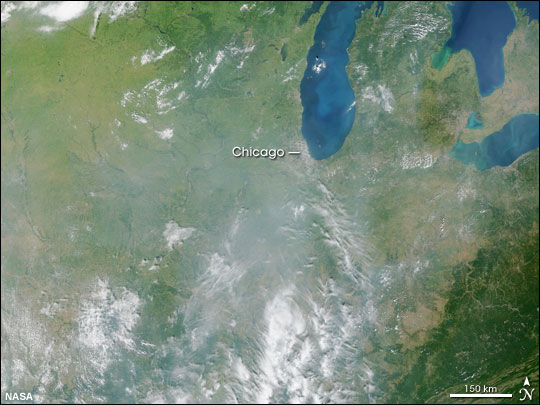
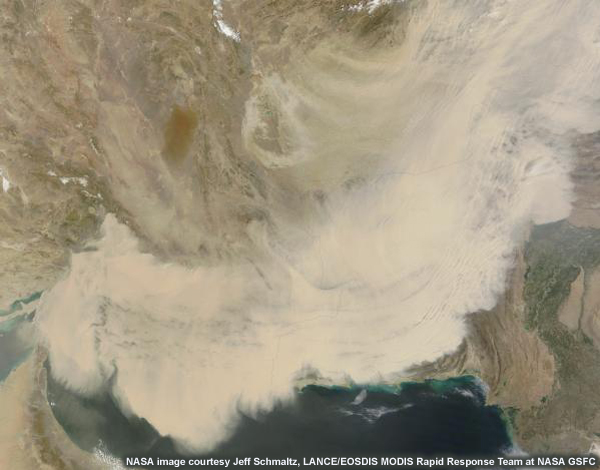
MODIS image showing the polluted air like a gray veil over the region southwest of Chicago on September 9, 2002
Additional activities are underway to improve regional tracking of air pollution by fusing detailed local measurements with satellite-based measurements for other pollutants including ozone and carbon monoxide.
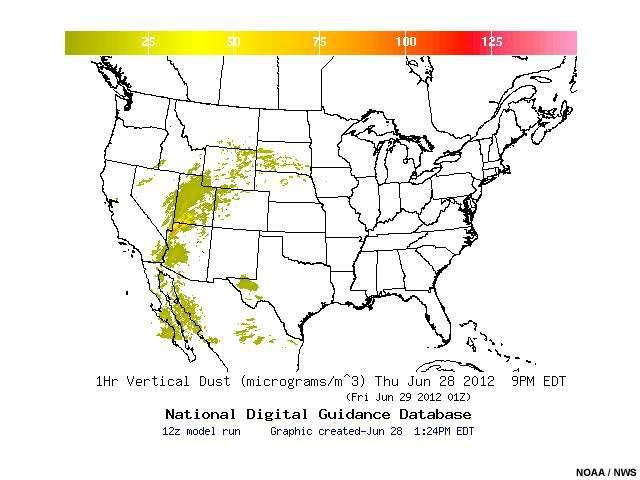
Atmospheric concentrations of aerosols and dust from sources such as dust storms, transportation, industry, agriculture, and land use pose serious concerns for human health and also affect weather and climate.
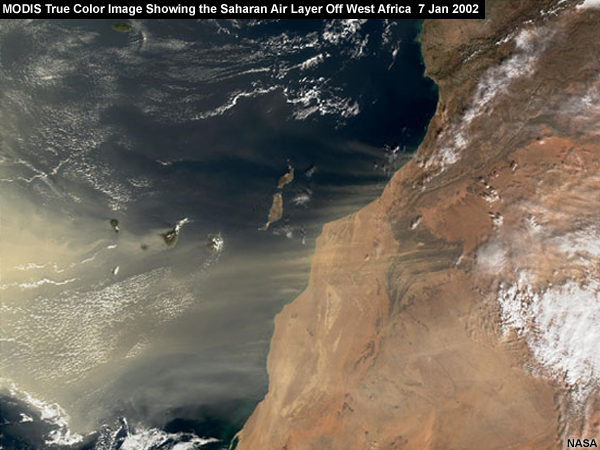
Aerosols and dust can have a significant influence on precipitating clouds and tropical disturbances. Scientists believe that dust storms from the Sahara may stifle storm development by injecting a layer of dust and dry air, known as the Saharan Air Layer or SAL, into the low- to mid-level easterly jet stream.
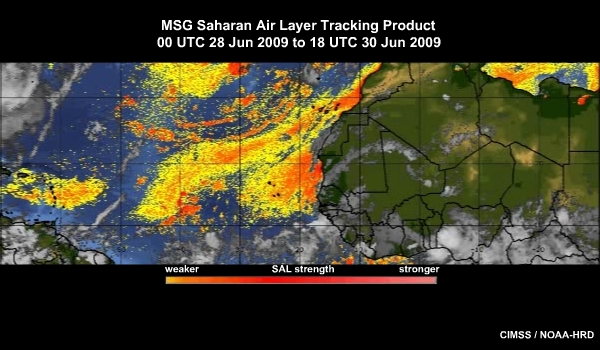
But Saharan dust may also seed clouds, which could then invigorate convection and promote storm formation. Satellites that map dust and other aerosols near developing storms are helping scientists decide whether dust inhibits or strengthens storms.
The University of Wisconsin produces the SAL product in real-time using split-window infrared observations from geostationary satellites, which clearly shows the movement and extent of dry air. This animation, produced from Meteosat-9 observations, shows pulses of dust in orange and darker reds moving westward off the West African coast on 30 June 2009. The reintroduction of a 12-micrometer split window channel on the next-generation U.S. GOES-R satellites will allow expansion of the SAL product to include both Atlantic and Pacific Ocean Basins.

The Geostationary Lightning Mapper, or GLM, also on board GOES-R, will provide a new data source to improve air quality forecasts, as lightning is a major producer of nitrogen oxides that lead to ozone production in the middle and upper troposphere. This ozone increase can subsequently impact surface air quality in downwind regions.
Conclusion and Summary
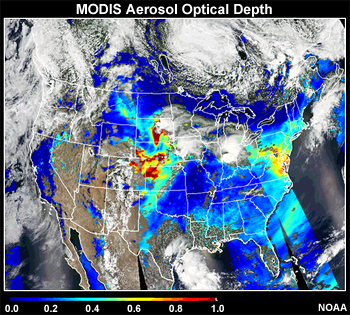
With advances in atmospheric composition monitoring from space, we can look forward to operational agencies ensuring the continuity of satellite-based measurements and to seeing these data used in a range of operational applications that will benefit the public and policy makers alike. The development and improvement of these applications also requires the continued development of research missions addressing open science questions that will push the boundaries of our knowledge.
This concludes the module. Please consider taking the quiz or sending a survey.
Resources
Environmental Protection Agency (EPA) AIRNowhttps://www.airnow.gov/
European Commission
ec.europa.eu/environment/air/
European Environment Agency (EEA)
www.eea.europa.eu/themes/air
European Space Agency (ESA)
www.esa.int
EUMETSAT
www.eumetsat.int/
https://acsaf.org/
Global Monitoring for Environment and Security (GMES)
www.gmes.info/
www.gmes-atmosphere.eu/
www.myair.eu/
Infusing satellite Data into Environmental Applications (IDEA)
https://www.star.nesdis.noaa.gov/smcd/spb/aq/AerosolWatch/
International Bodies
unfccc.int
ozone.unep.org/
www.unece.org/env/lrtap/
www.htap.org/
Joint Polar Satellite System (JPSS)
http://www.star.nesdis.noaa.gov/jpss/index.php
NASA
http://earthobservatory.nasa.gov/Features/IDEA/
http://www.nasa.gov/vision/earth/environment/New_IDEA_Air_Quality_Monitoring.html
National and Other Initiatives
wdc.dlr.de/
www.woudc.org/
ether.ipsl.jussieu.fr/
http://www2.prevair.org/
www.nilu.no/
sacs.aeronomie.be/
www.temis.nl/
www.airtext.info/
NOAA/NESDIS
http://www.ospo.noaa.gov/Products/atmosphere/index.html
https://www.ospo.noaa.gov/Products/atmosphere/toast/index.html
http://www.ospo.noaa.gov/Products/land/fire.html
http://www.star.nesdis.noaa.gov/star/AQ_index.php
NOAA/NESDIS/STAR/IOSSPDT Team
http://www.star.nesdis.noaa.gov/smcd/spb/iosspdt/iosspdt.php
NWS Air Quality Forecast Guidance
http://airquality.weather.gov/
Schmetz, Johannes, Paolo Pili, Stephen Tjemkes, Dieter Just, Jochen Kerkmann, Sergio Rota, Alain Ratier,
2002: An Introduction to Meteosat Second Generation (MSG). Bull. Amer. Meteor. Soc., 83, 977–992.
doi: http://dx.doi.org/10.1175/1520-0477(2002)083<0977:AITMSG>2.3.CO;2
References
CCSP: Coastal Sensitivity to Sea-Level Rise: A Focus on the Mid-Atlantic Region. A report by the U.S. Climate Change Science Program and the Subcommittee on Global Change Research. [James G. Titus (Coordinating Lead Author), K. Eric Anderson, Donald R. Cahoon, Dean B. Gesch, Stephen K. Gill, Benjamin T. Gutierrez, E. Robert Thieler, and S. Jeffress Williams (Lead Authors)]. U.S. Environmental Protection Agency, Washington D.C., USA, 320 pp. (2009)
Church, John A., ed. Understanding Sea-Level Rise and Variability. West Sussex: Blackwell Publishing Limited, 2010.
EPA Climate Change Indicators:
http://epa.gov/climatechange/science/indicators/oceans/index.html
Glatthor, N. et al.: Global peroxyacetyl nitrate (PAN) retrieval in the upper troposphere from limb emission spectra of the Michelson Interferometer for Passive Atmospheric Sounding (MIPAS), Atmos. Chem. Phys., 7, 2775-2787.
IPCC Fourth Assessment Report: Climate Change 2007 5.5 Changes in Sea Level:
http://www.ipcc.ch/publications_and_data/ar4/wg1/en/ch5s5-5.htm
Jevrejeva, S., J. C. Moore, and A. Grinsted (2010: How will sea level respond to changes in natural and anthropogenic forcings by 2100? Geophys. Res. Lett., doi:10.1029/2010GL042947
NOAA Coastal Flooding impacts viewer:
http://www.csc.noaa.gov/slr/viewer/
NOAA's State of the Coast:
http://stateofthecoast.noaa.gov/vulnerability/localthreat.html
NOAA Technical Report NOS 2010-01: “Technical Considerations for Use of Geospatial Data in
Sea Level Change Mapping and Assessment:”
http://tidesandcurrents.noaa.gov/publications/tech_rpt_57.pdf
Partnership for the Delaware Estuary, “Weather Change:”
http://www.delawareestuary.org/pdf/Climate/weathering_change.pdf
Schmetz et al.: An introduction to METEOSAT Second Generation (MSG) Bull. Amer. Meteor. Soc., 83, 977-992.
Strauss et al.: Tidally adjusted estimates of topographic vulnerability to sea level rise and flooding for the contiguous United States, Environmental Research Letters, 7, doi:10.1088/1748-9326/7/1/014033
Contributors
COMET Sponsors
The COMET® Program is sponsored by NOAA National Weather Service (NWS), with additional funding by:
- Bureau of Meteorology of Australia
- Bureau of Reclamation (United States Department of Interior)
- European Organisation for the Exploitation of Meteorological Satellites (EUMETSAT)
- Meteorological Service of Canada (MSC)
- NOAA National Environmental Satellite, Data and Information Service (NESDIS)
- Naval Meteorology and Oceanography Command (NMOC)
Project Contributors
Principal Science Advisor
- Dr. Rosemary Munro — EUMETSAT
Science Contributors
- Patrick Dills — UCAR/COMET
- Dr. Shobha Kondragunta — NOAA/NESDIS/STAR
Senior Project Manager
- Wendy Schreiber-Abshire — UCAR/COMET
Project Lead and Instructional Design
- Dr. Vickie Johnson — UCAR/COMET
Graphics/Interface Design
- Steve Deyo — UCAR/COMET
- Marianne Weingroff — UCAR/COMET
Multimedia Authoring
- Carl Whitehurst — UCAR/COMET
COMET HTML Integration Team 2020
- Tim Alberta — Project Manager
- Dolores Kiessling — Project Lead
- Steve Deyo — Graphic Artist
- Gary Pacheco — Lead Web Developer
- David Russi — Translations
- Gretchen Throop Williams — Web Developer
- Tyler Winstead — Web Developer
COMET Staff, Fall 2012
Director
- Dr. Timothy Spangler
Deputy Director
- Dr. Greg Byrd
Administration
- Elizabeth Lessard, Administration and Business Manager
- Lorrie Alberta
- Michelle Harrison
- Hildy Kane
Hardware/Software Support and Programming
- Tim Alberta, Group Manager
- Bob Bubon
- Ken Kim
- Mark Mulholland
- Victor Taberski - Student Assistant
- Chris Webber - Student Assistant
- Malte Winkler
Instructional Designers
- Dr. Alan Bol
- Lon Goldstein
- Bryan Guarente
- Dr. Vickie Johnson
- Tsvetomir Ross-Lazarov
- Marianne Weingroff
Media Production Group
- Bruce Muller, Group Manager
- Steve Deyo
- Dan Riter
- Carl Whitehurst
Meteorologists/Scientists
- Wendy Schreiber-Abshire, Senior Project Manager
- Dr. William Bua
- Patrick Dills
- Matthew Kelsch
- Dolores Kiessling
- Dr. Arlene Laing
- Dave Linder
- Dr. Elizabeth Mulvihill Page
- Amy Stevermer
Spanish Translations
- David Russi
NOAA/National Weather Service - Forecast Decision Training Branch
- Anthony Mostek, Branch Chief
- Dr. Richard Koehler, Hydrology Training Lead
- Brian Motta, IFPS Training
- Dr. Robert Rozumalski, SOO Science and Training Resource (SOO/STRC) Coordinator
- Ross Van Til, Meteorologist
- Shannon White, AWIPS Training
Meteorological Service of Canada Visiting Meteorologists
- Brad Snyder