Introduction
A variety of tools exist for evaluating and predicting the presence and dispersion of volcanic ash. This module will focus on forecast tools used in aviation operations to ensure the safety of aircraft crews and passengers. These tools include both in situ and remote sensing instruments as well as numerical models.
Please note that before a volcanic event occurs, you should be familiar with your regional Interagency Operating Plan for Volcanic Ash Events. These plans detail interagency protocols and response procedures in case of a volcanic event. Plans currently exist for Alaska, the Pacific Northwest, and the Marianas Islands. Plans are under development for Hawaii and California. You can find existing planning documents at this website: https://www.ofcm.gov/publications/volcanicash/volash2.htm
When volcanic unrest or eruptions occur in or near your forecast area, it is vitally important that you remain in close communication with the Volcano Observatory responsible for the volcano. A list of observatories worldwide is available at http://www.wovo.org/observatories.html. Volcanic eruptions can be detected by ground-based monitoring instruments, pilots, webcams if available, or observed on satellite imagery. It is important to coordinate with all the agencies mentioned in your region’s operating plan to ensure consistent and helpful warning information.
Nine Volcanic Ash Advisory Centers (VAACs) worldwide issue Volcanic Ash Advisories when a volcanic event occurs within their area of responsibility. These Advisories provide information about the volcano's location, eruption details, and altitude and geographic coverage of any volcanic ash cloud.
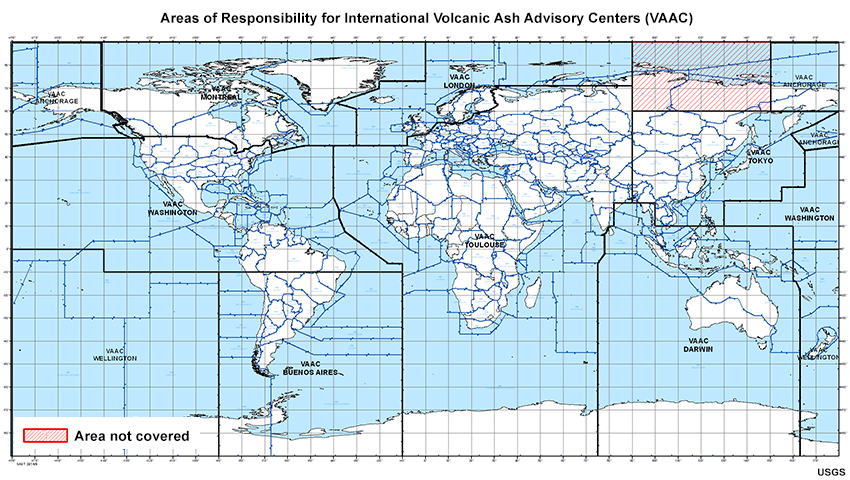
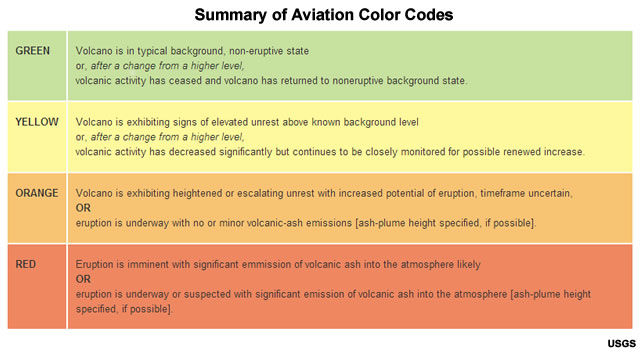
The level of threat to aviation is indicated by an Aviation Color Code, proceeding in increasing severity from green to yellow to orange to red. Volcanic activity alert notifications are issued whenever the Aviation Color Code changes (up or down). Notifications are available through the VAACs and additional information can be accessed via the U.S. Geological Survey (USGS).
Note:
Satellite Monitoring
Satellite imagery can help us detect and follow volcanic ash at all levels of the atmosphere over wide geographical areas.
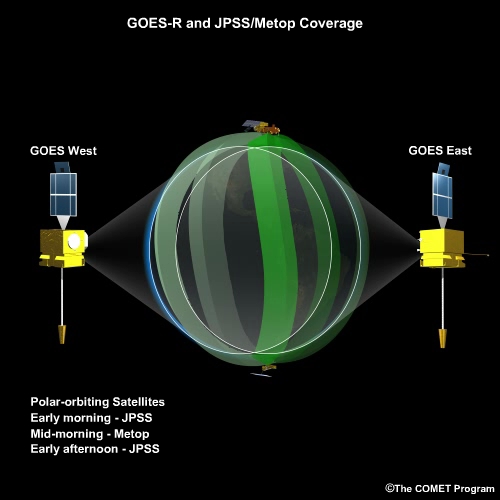
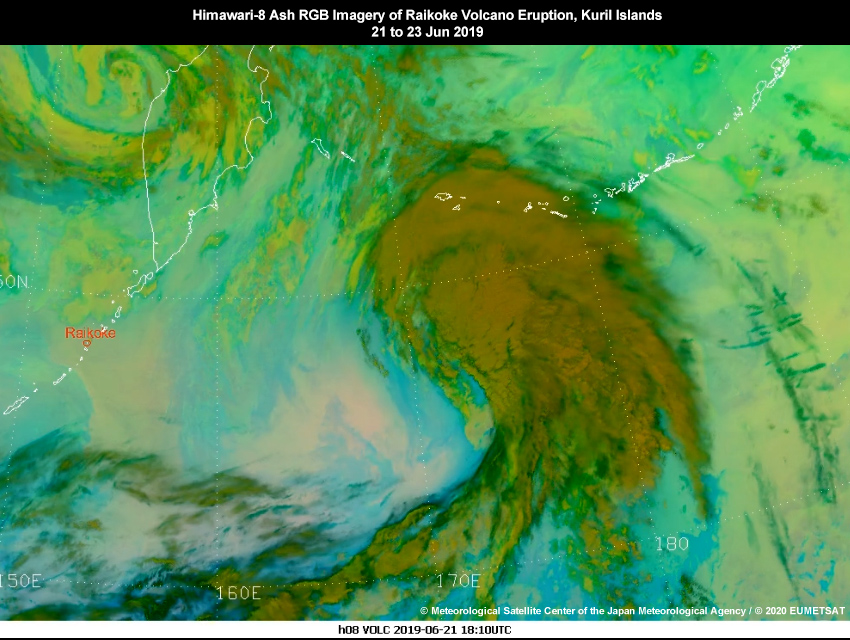
Geostationary satellites have the advantage of orbiting over the same location above the Earth's surface at all times. This position allows for continuous monitoring of an ash cloud to determine the areal extent of the plume and its temporal evolution as can be seen in the following animation of the ash and SO2 plume from the Raikoke eruption in the North Pacific Kuri Islands.
The resolution of the imagery decreases with increasing latitude as the viewing angle of satellite increases. In addition, there is a parallax error with increasing latitude and height of the eruptive plume, which will cause the plume to appear displaced from its actual geographic location in the direction away from the satellite.
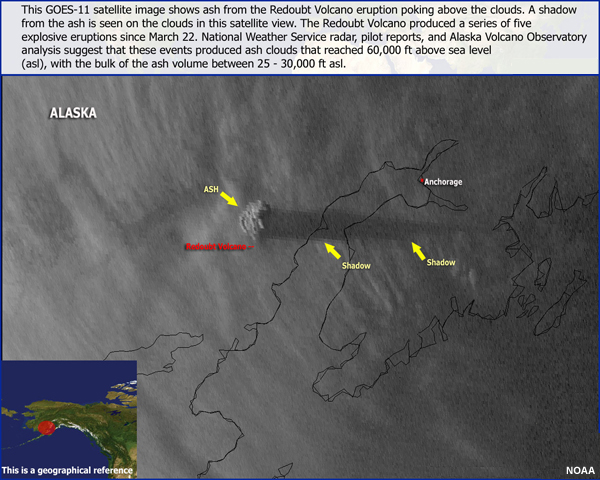
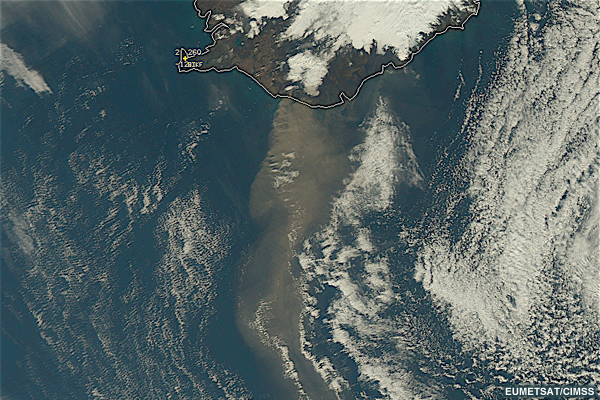
Mt. Redoubt eruption, March 22, 2009.
The signal from the observed feature travels a longer distance through the atmosphere and interacts with its constituents before reaching the satellite. Also, the features that can be detected are limited by the instrumentation carried, which varies by satellite.
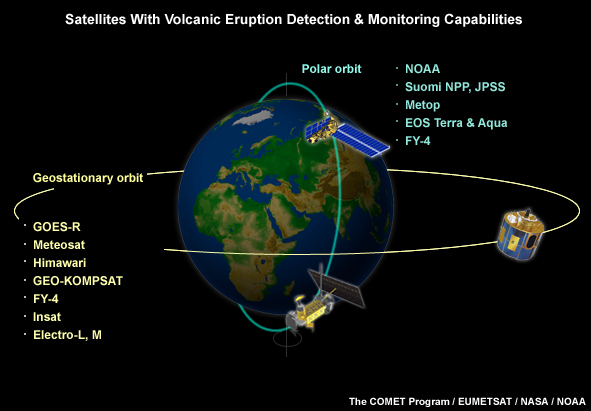
Geostationary satellites positioned above Earth’s equator around the globe include the GOES-R satellites that monitor the Western Hemisphere, Meteosat satellites that monitor Europe and Africa, Himawari that monitors the Asia-Pacific region, GEO-KOMPSAT that also monitors the Asia-Pacific region, INSAT that monitors the Indian Ocean region, and the Feng-Yun (FY) satellites that monitor China and adjacent regions of East Asia.
Question 1
Which of the following statements about using geostationary satellite data for volcanic eruptions at high latitudes are true? (Select all that apply.)
Statements a), c), and e) are true.
The advantage of geostationary satellite data is that rapid updates are available, which allows for continuous monitoring over the same area. For high altitude ash plumes, parallax errors misplace the location of a volcanic ash plume in the direction away from the satellite.
Polar orbiting imagery provides high resolution data with better coverage over high latitudes than seen over the equatorial regions of Earth. However, the observations are not as frequent as with geostationary satellites covering the same region. Similar to geostationary satellites, parallax errors can also occur with polar orbiting imagery towards the edge of the scan. Polar orbiting satellites used for monitoring volcanoes include those from NOAA, NASA (Terra and Aqua), EUMETSAT (MetOp series), and China (FY-1 and -3 series).
Question 2
Which of the following statements about using polar orbiting satellite data to evaluate volcanic eruptions in Iceland are true? (Select all that apply.)
Statements b) and c) are true.
The advantage of polar orbiting satellite data in higher latitude regions is the increased coverage and improved spatial resolution. There are a variety of polar orbiting satellites that fly over the region and provide different types of observations to analyze the plume. The polar orbiting satellites provide better spatial resolution than the geostationary satellites. Parallax errors also occur with polar orbiting satellites when one looks towards the edges of a scan. Such errors may result in misplacing the location and movement of the plume.
Identify Presence of Ash
Each type of satellite observation gives a unique view of a volcanic ash plume. Different data processing techniques allow forecasters to focus on specific aspects of the volcanic ash. We will utilize these data to help identify the presence of volcanic ash, and predict the height and extent of dispersion of volcanic ash. First, let's focus on identifying the presence of ash.

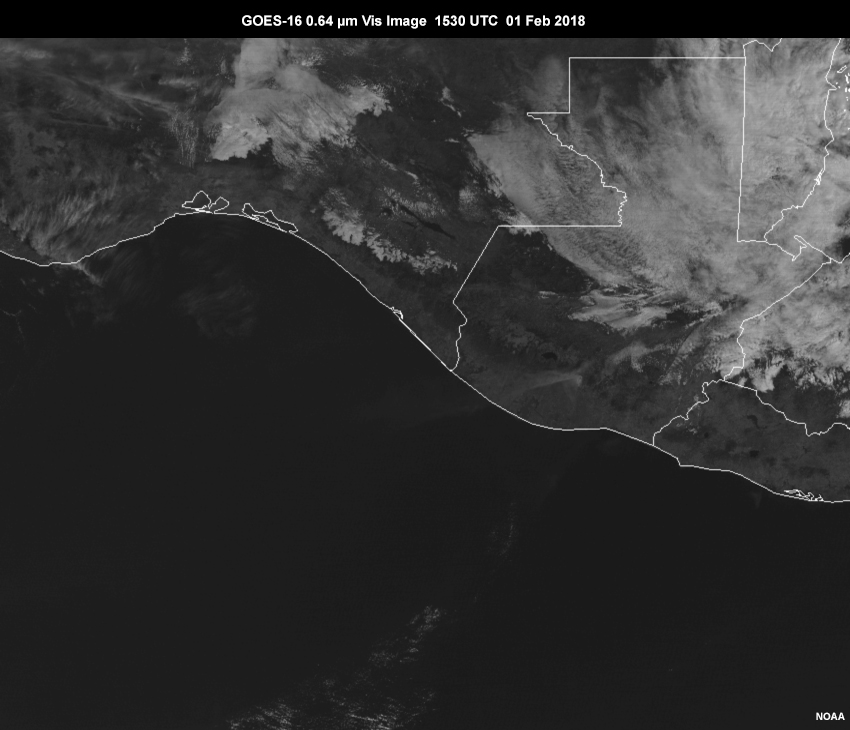
Landsat-8 True Color Image of Volcán de Fuego Eruption on 3 Feb 2018
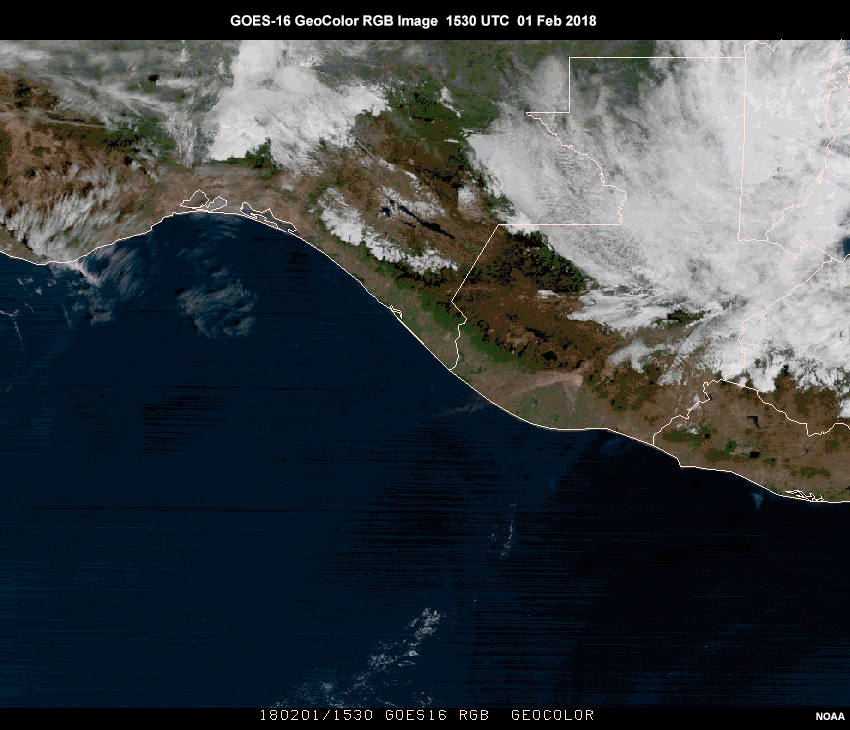
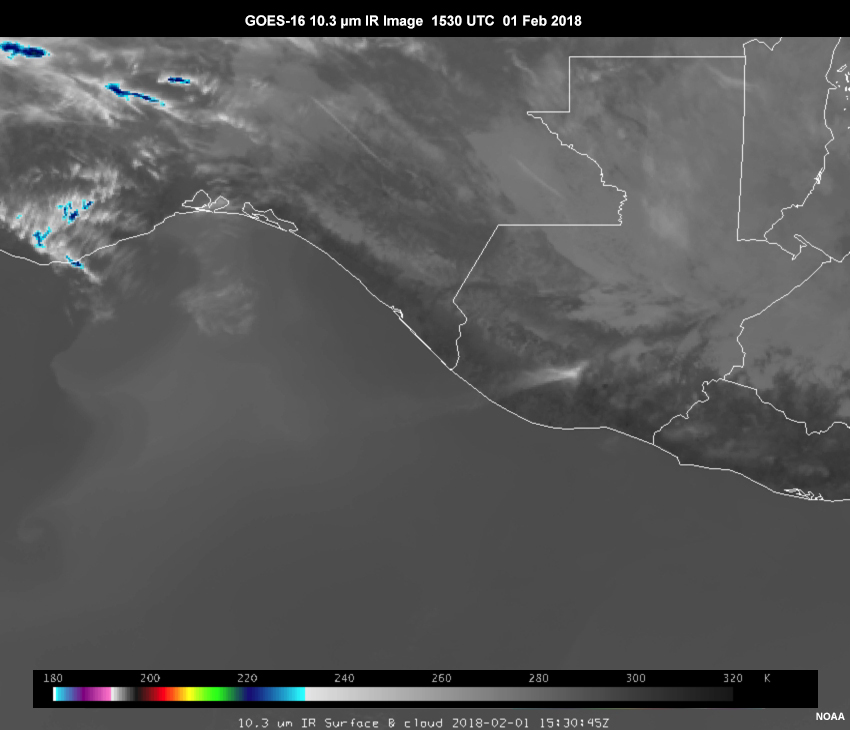
Identify Presence of Ash Visible and Longwave IR Imagery, GeoColor RGB
Ash clouds can be seen on visible satellite imagery, especially when the plume is moving over darker features below, such as ocean surfaces or dark vegetation.
Exercise
From what is visible in the images above, use the pen tool to outline the plume to the best of your ability.
While all three products have some ability to identify Fuego’s plume, there are limitations to each. Both visible and Geocolor imagery work during daytime, but we lose detection at night.
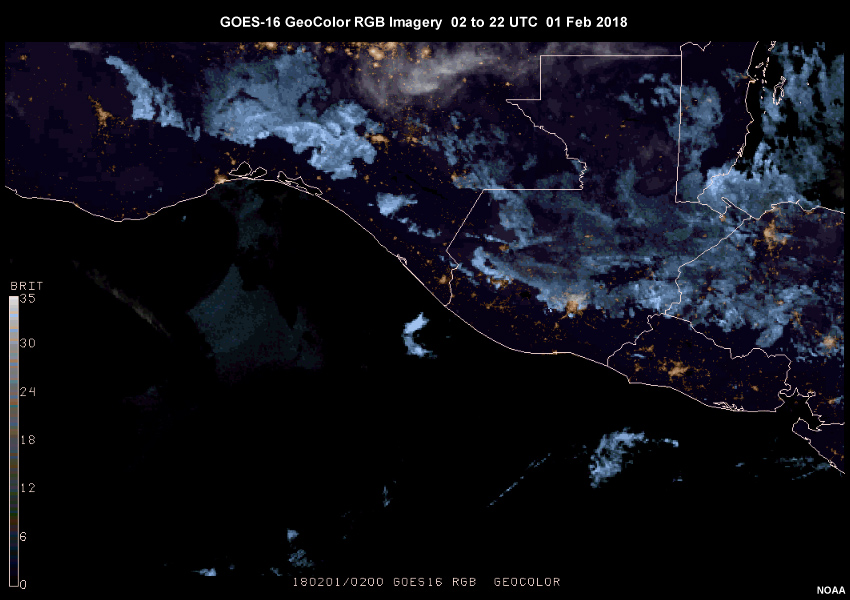
Because of its pseudo-true color appearance, GeoColor imagery provides a convenient baseline for interpreting visible and false-color imagery products. Compared to single band visible imagery, ash and dust plumes can appear brown in GeoColor imagery, similar to how human eyes would see it. This allows us to better distinguish ash from cloud and snow cover.
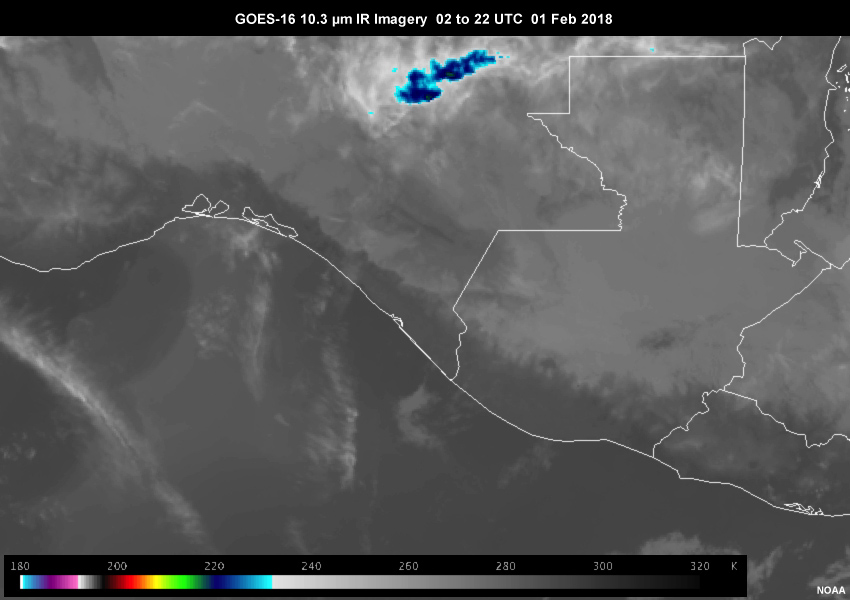
Longwave IR imagery provides day and night detection. But with IR imagery, plumes often look similar to cloud cover, making thinner plumes more difficult to detect, similar to the challenges posed in detection of thin cirrus.
As we’ll see in the next section, by combining elements from a variety of imagery bands we can leverage their strengths to create derived products that are better suited for detecting volcanic plumes during both daytime and nighttime. We also need tools for better identifying the composition of a plume, whether it’s composed of ash, water and ice cloud, SO2, or a combination of these elements.
Identify Presence of Ash RGB Products (Split Window, Ash, SO2)
Review the split window, Ash RGB and SO2 loops for the Volcan de Fuego case in the tabs below, then answer the questions that follow.
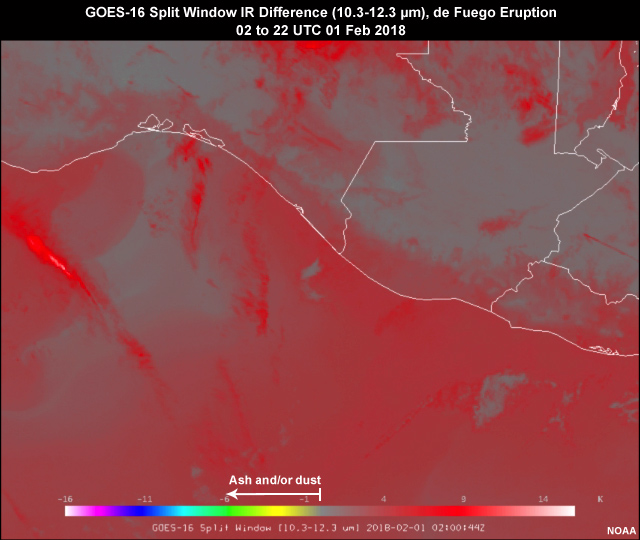
GOES-16 Split Window, de Fuego Eruption
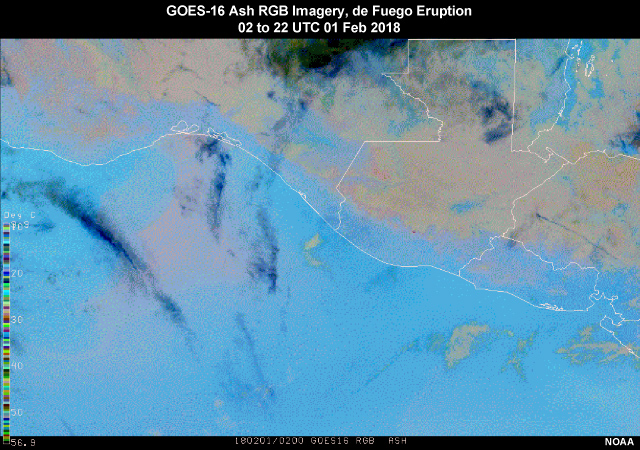
GOES-16 Ash RGB, de Fuego Eruption
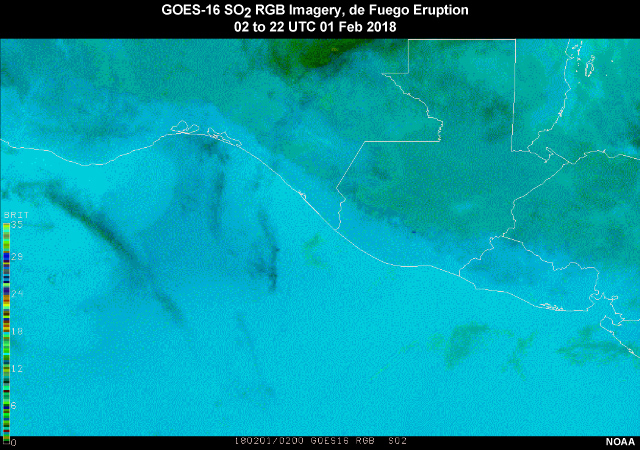
GOES-16 SO2 RGB, de Fuego Eruption
Question
From what you see in the three tabs, which images display the plume’s spread and spatial extent more effectively? (Choose all that apply.)
The best answers are b) and c), the Ash and SO2 RGB imagery.
Before the advent of imagers with expanded spectral coverage in the 1990’s, the split window IR difference product was the best available tool for detecting volcanic ash plumes. Its use continues today, and is generated by differencing 10 to 11 µm clean IR window and 12 to 13 µm “dirty window” IR bands. Detection works due to opposite absorption characteristics of ash and ice clouds.
The expanded spectral coverage of recent imagers on both geostationary and polar-orbiting satellites allows for improved detection and characterization of volcanic plumes. The Ash RGB takes advantage of four longwave IR bands to emphasize ash detection, and is also sensitive to SO2, especially at middle to lower tropospheric levels.
The SO2 RGB was developed to focus specifically on SO2 detection, however it is sensitive to ash as well. It incorporates a slightly different combination of longwave IR spectral bands that allows it to detect SO2 at both higher and lower tropospheric levels.
For additional information on the specific spectral band combinations used, view the Ash RGB and SO2 RGB quick guides listed on the VISIT Quick Guides webpage.
Next, answer the following question on the composition of the Fuego plume.
Question
What is the likely composition of this plume? (Choose the best answer.)
Both Ash and SO2 RGB imagery indicate the presence of ash within the plume. If the plume contained significant concentrations of SO2, the SO2 RGB would show those areas in colors other than blue, typically light green for low-level SO2, and shades of yellow and/or orange for upper-level SO2.
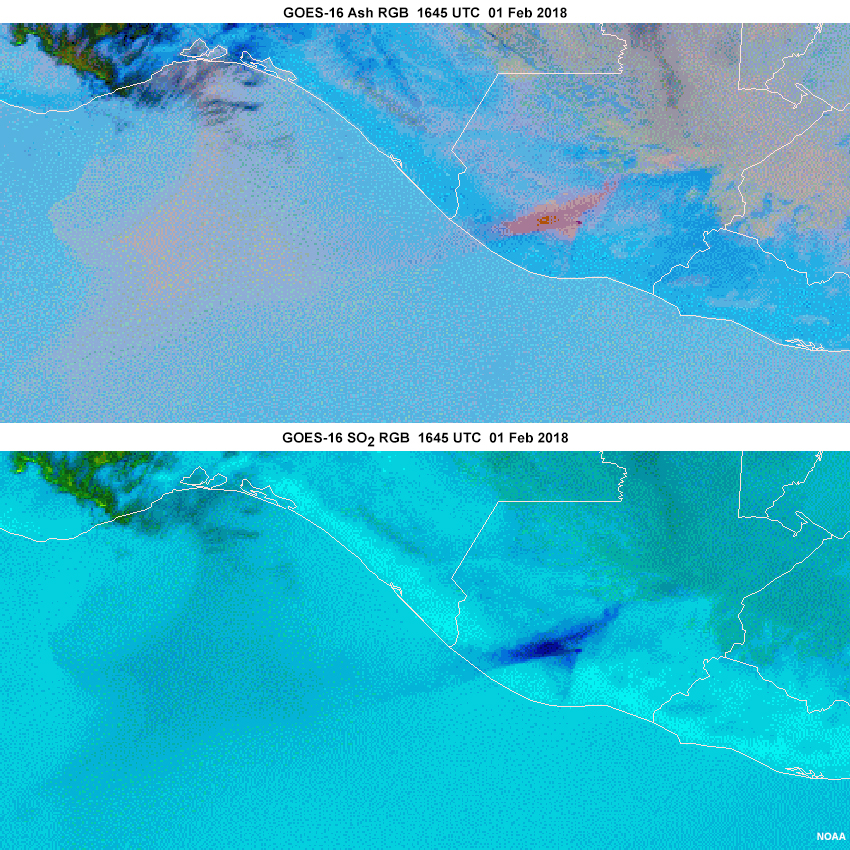
Since we only see the plume as dark blue, which is typical for ash in this product, we can assume the plume contains mainly ash. There is, however, one caveat for using the SO2 RGB for discriminating between ash and ice cloud: since thin cirrus can also appear dark blue in this product, we can refer to the Ash RGB product for confirmation since ash is usually colored differently (reds to magentas) compared to meteorological clouds. It looks like the ash plume for this event appears mostly in shades of magenta, which increases our confidence that the plume is composed mainly of ash.
Identify Presence of Ash RGB Loops (Ash, SO2)
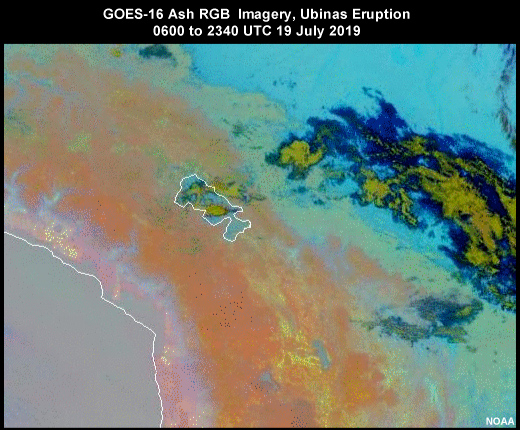
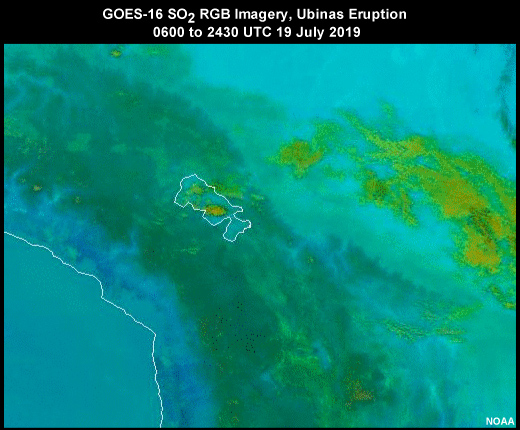
Let’s now look at a different event, the eruption of the Ubinas volcano in southern Peru on July 19, 2019. Use the tabs to compare the Ash and SO2 RGB products for the Fuego and Ubinas eruptions and answer the question that follows.
Question

After reviewing the loops and the product legends, identify what elements make up the Ubinas volcanic plume. (Choose all that apply.)
After viewing the loops, it becomes apparent that the composition of the Ubinas volcanic plume is far more complex than for the Fuego plume. Comparing Ash and SO2 RGB images for Ubinas, we see a mixture of ash, SO2, and ice.
From the Ash RGB alone, we see clear indications of ash (reds to magentas), convective ice clouds (light browns), SO2 (light bright greens) and even SO2 mixed with ash (brighter yellows).
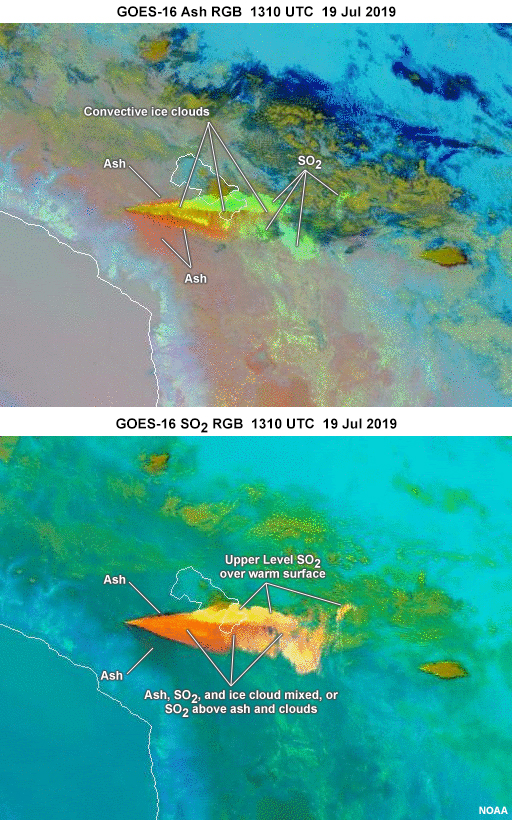
Looking at the SO2 RGB, it not only helps confirm the presence of SO2, it indicates that most of the SO2 is in the upper troposphere. Yellow shaded SO2 indicates SO2 over warm ground, whereas orange colored indicates SO2 over a colder surface or cloud. The Ash RGB indicates ash and cold convective clouds in the southern portion of the plume. This suggests that the orange shading in the SO2 RGB contains either a mixture of ash, SO2 and ice cloud, or possibly high-level SO2 above the cold ash and convective cloud cover. Using both products together, we can better ascertain the extent of the SO2, estimate its height, and assess whether it’s mixed with ash or other constituents like water and ice clouds.
Interpreting the colors presented in the Ash and SO2 RGB products takes a little practice. The variation in colors can change depending on satellite viewing angle (low vs. high latitude viewing from geostationary satellites for example), underlying geography, and can vary by season.
Quick Guides have been developed to help users gain a quick understanding of the importance, applications, and limitations of these and other derived satellite products. They also serve as a convenient reference for interpreting some of the many color variations inherent in RGB imagery. Geostationary and polar-orbiting satellite product Quick Guides can be found on a dedicated VISIT “Quick Guides” webpage hosted at Colorado State University’s Cooperative Institute for Research in the Atmosphere (CIRA).
Additional tutorials and information addressing RGB imagery and other derived products for monitoring volcanic clouds are available on the NOAA-CIMSS VOLCAT website.
Plume Spread
Let’s take a look at how forecasters use satellite data and integrate it with other forecasting and analysis tools to monitor and predict volcanic ash dispersion once an eruption has occurred and the Volcanic Ash Advisory Center (VAAC) has issued a Volcanic Ash Advisory (VAA). Actions will differ depending on the proximity of the forecast area (near and distant) to the eruption. This section will focus on actions taken by a forecaster regardless of proximity to the eruption. A brief discussion of the actions taken near an eruption will be added where appropriate.
While the products and forecast priorities will vary depending on each case, the following steps will help you generate a volcanic ash forecast and alert your customers to any potential dangers:
- Evaluate/Confirm the height of the eruption plume
- Review VAAC (and METWATCH office) products about the eruption
- Review satellite imagery and radar data
- Review pilot reports
- Contact the relevant Volcano Observatory listed in your regional plan
- Determine the direction of plume drift (movement in different directions at different
heights)
- Review satellite and radar data
- Review HYSPLIT output
- Review upstream wind observations
- Review forecast winds
As you are working through these tasks to generate a product in the vicinity of an erupting volcano, it is vital that you remain in communication with the Volcano Observatory responsible for that area, and VAACs, Meteorological Watch Offices, and other forecast offices responsible for warning products in the area covered by ash.
Plume Spread Plume Height
Plume Spread » Plume Height VAAC Information
The height of the ash cloud is an important factor in determining hazardous regions for aviation operations. Also, dispersion and trajectory models use the height of the plume as an input. A variety of observed data can be used and combined to determine the height of the plume. These include satellite data, radar, pilot reports, and model output from trajectory models.
The first step in the forecast process is to review the Volcanic Ash Advisory (VAA) issued by the VAAC and any additional information provided in any volcanic ash SIGMETs. Remember to consult with the local Volcano Observatory. Below is an example of a VAA issued for Puyehue Cordón-Caulle following a 19 January 2013 eruption.
FVAG01 SABM 191515
VA ADVISORY
DTG: 20130119/1515Z
VAAC: BUENOS AIRES
VOLCANO: CORDON CAULLE 1507-141
PSN: S4031 W07212
AREA: CHILE-C
SUMMIT ELEV: 1798M
ADVISORY NR: 2013/001
INFO SOURCE: GOES 13 - GFS MODEL - OVDAS WEB CAM - ARS
ERUPTION DETAILS: ERUPTION AT 19/1010Z APROX
OBS VA DTG: 19/1010Z

OBS VA CLD: SFC/FL100 S4031 W07212 - S4037 W07459 - S3901 W07558 - S4025 W07630 - S4133 W07545 - S4031 W07212 MOV SW15/20KT
FCST VA CLD +06HR: 19/2115Z SFC/FL100 S4031 W07212 - S4048 W07542 - S3841 W07627 - S3947 W07710 - S4131 W07609 - S4031 W07212
FCST VA CLD +12HR: 20/0315Z SFC/FL100 S4031 W07212 - S4049 W07616 - S3848 W07806 - S4002 W07840 - S4136 W07649 - S4031 W07212
FCST VA CLD +18HR: 20/0915Z SFC/FL100 S4031 W07212 - S4150 W07658 - S4101 W07900 - S4229 W07909 - S4301 W07658 - S4031 W07212

RMK: VA CLD CAN BE SEEN IN FIRST VIS SATELLITE IMAGERY MOV SW 15/20KT

GRAPHIC AT http://www.smn.gov.ar/vaac/buenosaires/inicio.php?lang=es

NXT ADVISORY: WILL BE ISSUED BY 20130119/2115Z
Click to view the Decoded Advisory
Question 1
While all information contained in the VAA is important, which parts of the advisory would you use in creating your local products? (Select all that apply.)
The correct answers are a) and b).
The observations, forecast, and remarks contain very useful information to include in your local forecast products. The summit elevation is not normally included (option c). The Volcanic Ash Advisory number is used for internal purposes, but usually not repeated in other forecast products.
Volcanic Ash SIGMETs are issued when a hazard exists. These products display areas affected by volcanic ash. Text products describing the location and valid time for the product are also available.
Collaboration
If a volcanic eruption occurs within your forecast area, you will need to make contact with the responsible Volcanic Ash Advisory Center to get the most up-to-date information.
Question 2
You are the forecaster on duty in the area of the Puyehue Cordón-Caulle eruption. What information would you need from the Volcanic Ash Advisory Center? (Select all that apply.)
All of the choices are correct.
Answers to these questions will enable you to refine your forecast and issue appropriate warnings for your forecast area. Be sure to coordinate with adjacent offices to ensure that you provide consistent information to customers.
In addition to working with the appropriate Volcanic Observatory, you can call the nearest aviation forecast or en route weather center to review any incoming pilot reports and coordinate the issuance of any aviation or public advisories. Refer to your regional interagency operations plan for contact information. As you can see, it is important to begin developing your relationship with these offices so that collaboration with them is easy and effective during an event. You may even consider developing a checklist with the appropriate steps for a volcanic event.
Plume Spread » Plume Height Satellite Characterization
After you have become familiar with the VAAC advisory, you are ready to review some of the satellite data that is available. The brightness temperature of the top of the plume, if opaque, can be measured using satellite imagery and compared to rawinsonde data to estimate the height in the atmosphere to which that temperature corresponds. This method assumes that the temperature of the ash plume measured from satellite really corresponds to the atmospheric temperature at that level and that the plume top corresponds to the coldest part of the plume. If the ash plume has reached into the stratosphere, its top will appear warmer and could be mistaken for a cloud at a lower tropospheric height. For this reason it is important to look at all available data, radar observations, pilot reports, and dispersion model output to help assign an ash cloud height.
Question 1
Based on this NOAA-18 infrared image from a Mt. Redoubt eruption, what is the temperature of the coldest tops of the ash plume? (Select the best answer.)
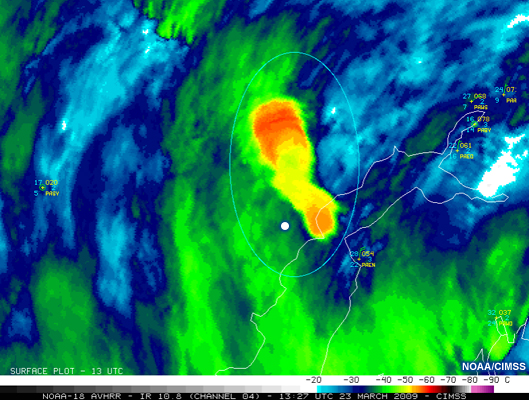
The correct answer is c) -55°C.
The red color in the center of the plume is the coldest temperature which is lower than -50°C but slightly warmer than -60°C. Remember that operationally, you may be able to use the cursor readout to determine the pixel temperature.
Question 2
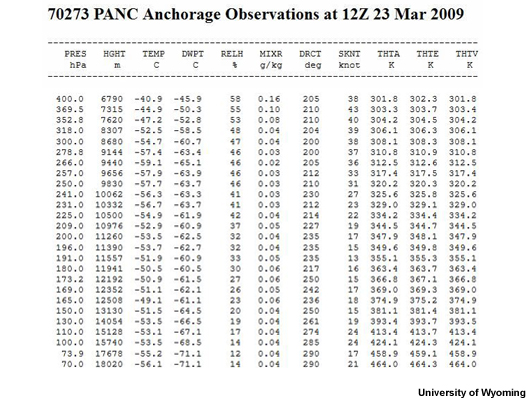
Use the rawinsonde plot of the atmospheric temperature and winds with height for Anchorage to help determine the height of the ash plume. (Select the best answer.)
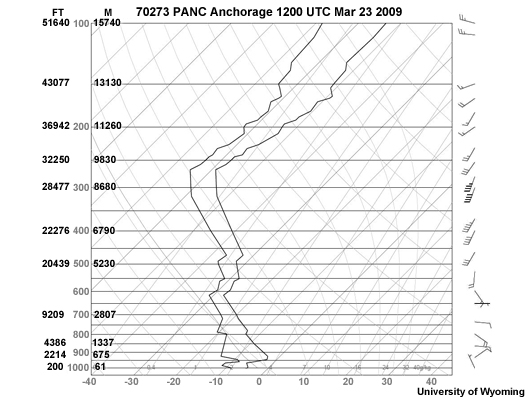
The correct answer is d) 16km.
From the rawinsonde data, -55°C appears near 9 km. This level is also near the height of the tropopause. You might expect that this level would logically be where the top of the ash cloud would be observed. However, in this case, the plume actually rose to 16 km. Looking more closely at the sounding, you can see there are several levels where the temperature is near -55°C. To further refine your estimate of which level corresponds to the top of the ash cloud, you need to investigate the wind profile. Because the plume has moved east of the volcano’s location, and the winds above 13 km are from the west, the plume must be located where the temperature is -55°C above 13 km, which is 16 km.
A word of caution, volcanic ash clouds downstream of an eruption tend to become progressively semi-transparent rather than opaque, and can be contaminated by nearby clouds and a warmer surface below. This results in an overestimate of the ash cloud temperature and thus an underestimate of the actual plume height. The trajectory of the ash cloud can also be evaluated on satellite imagery and numerical model output to help pinpoint the plume's height. Satellite observed plume motions can be compared with the altitude where the winds from either rawinsonde data or model soundings appear to match. Radar data may also be used to find the top of the ash cloud.
Plume Spread » Plume Height New Satellite Products
New products are being developed continually to help map the height as well as other properties of the ash cloud.
In addition to the ash and SO2 RGBs shown in this lesson, additional products useful for characterizing a volcanic plume include ash loading (analogous to ash concentration), ash cloud height estimates, and ash effective radius. For ash effective radius, the longer the residence time of ash particles in the plume, which also correlates with distance downwind of the eruption, the smaller the particles.
The VOLcanic Cloud Analysis Toolkit (or VOLCAT) developed at NOAA-CIMSS in Wisconsin, is a website that features near real-time GEO and LEO satellite imagery and derived ash products for detecting and monitoring of ash plumes. The VOLCAT project was initiated in 2010 in response to underserved and emerging needs for volcanic hazard mitigation, where satellite measurements, in combination with other data sources, have potential for adding significant value.
Satellite imagery and derived product loops contain data for approximately the last 30 days. The 'Satellite Imagery' page is organized by Volcanic Ash Advisory Center (VAAC) regions of responsibility with sectors over the historically most active locations of those VAAC regions. Currently the following satellites are being processed in near real-time: GOES-EAST, GOES-WEST, MSG SEVIRI, MODIS, VIIRS, and HIMAWARI (via direct broadcast feeds and both NASA/SSEC near real-time feed) over parts of the globe. Additional sensors are added to the site as their data becomes available.
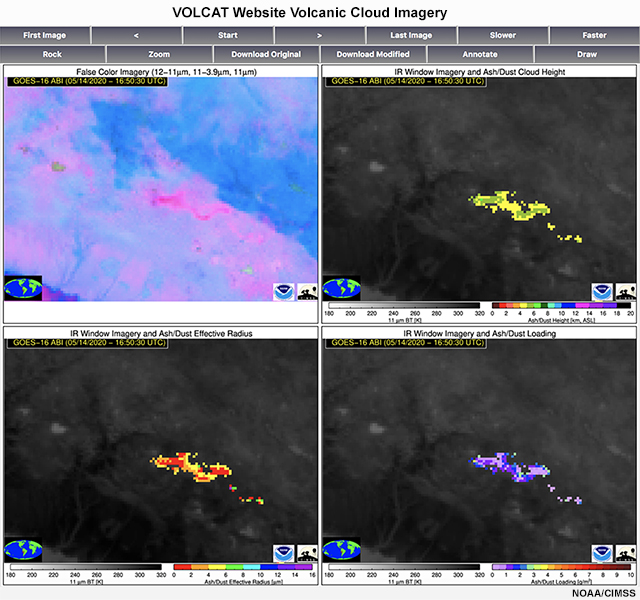
The four-image display shows various characteristics of the volcanic ash plume from the 14 May 2020 Sabancaya eruption located in southern Peru. The top left panel is an RGB image indicating where volcanic ash is present. The top right image provides an estimate of the height of the ash cloud. The bottom left image displays the ash effective radius. The bottom right image quantitatively depicts the amount of ash loading (analogous to ash concentration).
If you want more information about VOLCAT, click the panel below.
VOLCAT products and services, which are routinely utilized by Volcanic Ash Advisory Centers (VAACs), are grouped into five primary categories: support for volcano monitoring, volcanic event alerting, volcanic cloud tracking, volcanic cloud characterization, and support for volcanic cloud forecasting. The most mature VOLCAT capabilities are the volcanic event alerting service and VOLCAT image viewer. The alerting service is a predecisional product, so it is only available to VAACs and volcano observatory users. The VOLCAT image viewer, however, is publically available at: https://volcano.ssec.wisc.edu/imagery/view/. The image viewer allows users to examine various types of satellite images, including RGBs and maps of quantitative products (e.g. ash height and ash mass loading).
Over 100 spatial domains, tailored to volcano monitoring and organized by VAAC region, are available. Several overlay options and annotation tools are also offered. Images from at least the last 30 days are available for several geostationary and low earth orbit satellite sensors (GOES-16 ABI, GOES-17 ABI, Meteosat-11, Himawari-8, S-NPP VIIRS, NOAA-20 VIIRS, Terra MODIS, and Aqua MODIS). The VOLCAT image viewer supports user training through easy access to satellite images of new volcanic ash and SO2 emissions. While large eruptions are relatively infrequent, small volcanic ash and/or SO2 clouds/plumes are generally identifiable near at least a few volcanoes at any given time (Tip: use current Volcanic Ash Advisories to identify interesting VOLCAT image sectors). The VOLCAT blog (https://volcano.ssec.wisc.edu/blog/) is another volcanic cloud training resource that will continue to grow. VOLCAT POC: Mike.Pavolonis@noaa.gov
Plume Spread » Plume Height Volcanic Ash on Radar
Initially, radar systems close to an erupting volcano will detect the ash plume and give initial estimates of plume height. As the larger particles fall out, the remaining fine ash particles can be difficult to track with radar. Radar was instrumental in providing input data for dispersion models used to forecast the track of the volcanic ash plumes in Iceland in 2010 and 2011. In general, radar instruments are not located very close to volcanoes, but the nearest Volcano Observatory may have a portable radar deployed near the eruption site.
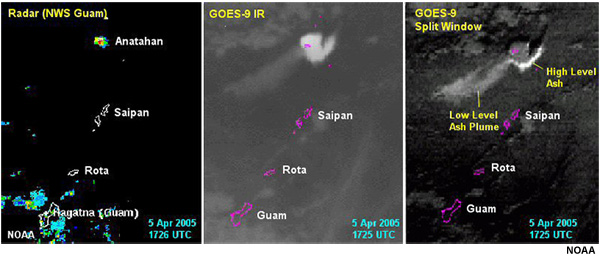
In the example of Anatahan Volcano in the Marianas Islands, the radar on Guam detected reflectivity values of 50 dBz despite being more than 300 km from the volcano. In situations where ash plumes are detected by radar, the height of the plume can possibly be estimated using radar cross-sections through the ash cloud.
Plume Spread » Plume Height Pilot Reports and Webcams
Pilot reports, when available, provide data directly from the flight path and with other methods can help determine the height as well as the vertical extent of the ash plume. Working with the local forecast office to analyze the pilot reports may be an effective way to review all the incoming data and issue a product.
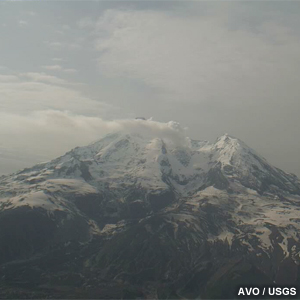
In addition, if one is available, you can view a live video stream from a webcam to see conditions at the volcano. This is an image from Mt. Redoubt’s webcam taken on August 12, 2011:
Question
Which of the following tools are useful in determining the height of ash plume when used with satellite imagery? (Select all that apply.)
The correct answers are a), b), and c).
Rawinsonde data and pilot reports can be combined with satellite imagery to determine the height of an ash plume. Model-derived sounding data could also be useful. Surface observations generally do not include observations of the tops of clouds or ash plumes. Remember that collaboration with the local Volcano Observatory will provide you with the most up-to-date information about an eruption.
Plume Spread Plume Drift
The direction an ash plume is moving can be observed by animating consecutive geostationary satellite images and watching the expansion of the ash cloud. Also, once the height of the plume is known, wind field forecasts and trajectory models can be used to determine where the plume can be expected to move. Keep in mind that ash plumes that reach high into the atmosphere are subject to parallax error, especially at high latitudes on geostationary imagery and in regions away from the satellite sub-point with polar orbiting satellites. These errors can lead to incorrect placement of the plume and analysis of plume drift.
Upstream Wind Obs
Wind and temperature observations provided by rawinsondes and aircraft aid in the analysis of the height and direction of transport of the volcanic ash plume. Upstream data indicates what direction the plume will travel and when or if it will reach your location. Also, the direction of the winds at different heights above the ground can be used to predict how the plume will move initially at specific levels. Data near the location of the plume can be used to determine the height of the plume. Note that incoming pilot reports depend on the location and perspective of the pilot, and as such they may or may not represent the reality of the situation.
Let’s go back to the 2011 Cordón-Caulle eruption, which significantly impacted aviation. The locations of nearby upper air stations are shown here.
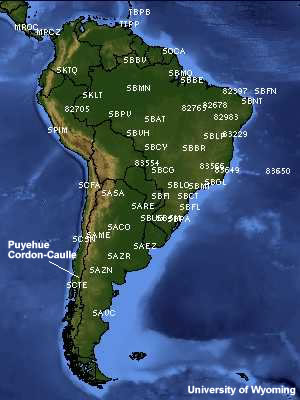
Volcano location with surrounding upper air stations mapped.
Question 1
Which upper air stations (image, above) would best represent the conditions surrounding the volcano? (Select the best answer.)
The correct answer is b), SAZN and SCTE.
These stations are closest to the location of Puyehue Cordón-Caulle. Additionally, SCTE is on the same side of the mountain range.
Question 2
Based on the Puerto Montt sounding from 12 UTC on 5 June, at what level would you expect the fastest transport of ash, and toward which direction will it travel? Use drop down boxes for flight levels and direction, then click Done.
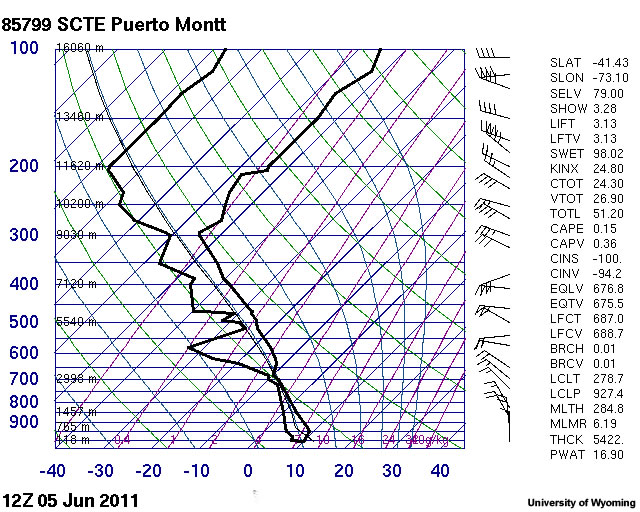
The correct answer is SFC to FL300 with movement of the plume toward the east. The strongest winds affecting the volcanic ash are westerly, so we expect to see the strongest transport moving the ash plume toward the east.
In addition to rawinsonde data, sounder data from satellites and AMDAR data can provide higher temporal resolution of the vertical profile of the atmosphere.
Forecast Winds
Gridded forecast data will give you a comprehensive view of the three-dimensional wind field based on observed and numerical weather prediction forecast data. These wind fields can be used to evaluate the evolution and transport of the ash cloud and are input into dispersion models.
Locations near the volcano may not have rawinsonde sites nearby. However, soundings derived from model data can give estimates of the vertical characteristics of the wind field.
HYSPLIT Output
The HYSPLIT (Hybrid Single Particle Lagrangian Integrated Trajectory) trajectory and dispersion model can be run using the volcanic ash version of the model available through: http://ready.arl.noaa.gov/READYVolcAsh.php. The version of the model on the site above was developed specifically for volcanic ash events. You may also contact some of your partners and check if they have run it already. The input parameters to the model have been limited to facilitate running the model. HYSPLIT may also be installed and run on a PC Windows, Mac, or LINUX workstation by referring to instructions posted at https://www.ready.noaa.gov/index.php. This offers users an expanded set of options, such as mass emission rate and wet deposition that are not available for running HYSPLIT on ARL’s volcanic ash webpage.
A list of volcanoes provides the details on location and summit. You can select a volcano and then add details about the eruption including the date and time, duration and the height of the ash cloud. There is an option to reduce the amount of ash displayed which is intended for situations where a great deal of water vapor is present in the plume and the displayed ash cloud does not represent the actual presence of ash. This feature is also used when the ash cloud produced by the model is much larger than the one observed on satellite imagery.
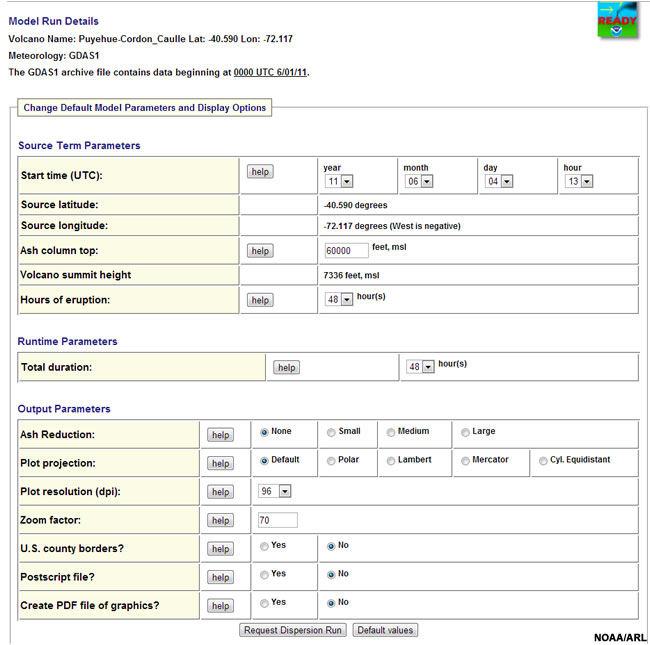
Screen shot of the NOAA HYSPLIT model interface using the data for the 2011 Puyehue Cordón-Caulle eruption in Chile. Information for major volcanoes worldwide is pre-loaded in the model and individual eruption parameters can be user-specified.
Running the trajectory model will provide estimates of the direction and timing of spread of the plume over time. The data input to the model includes the time and duration of the eruption, the location of the volcano, a sounding representing the vertical temperature and wind fields and/or a numerical model forecast file. Using this information, the HYSPLIT model predicts the evolution of the location, transport, and concentration of the ash cloud over time.
Weather data can be input either as numerical weather prediction model output or observed sounding data. These model data are archived for two days and can be helpful for modeling longer-term eruptions.
Output from the HYSPLIT model can be displayed directly from the website, and can be saved in a variety of formats, including that which can be displayed via Google Earth. The output is a trajectory of the visual ash cloud, and can be plotted at levels of interest to the aviation community.
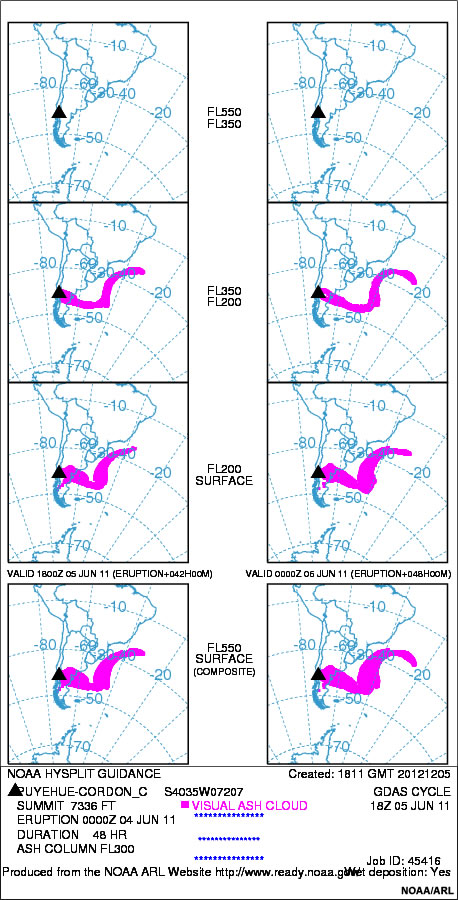
Results from NOAA's HYSPLIT model for the June 2011 Puyehue Cordón-Caulle eruption based on Global Forecast System meteorological data for the eruption time period.
Question
Evaluate the HYSPLIT output for each flight level (FL) in the animation below. At what time and at which altitude will the ash impact the following cities? Use the drop down boxes to select times and layers for each city, then click Done. (Choose a level only if the plume is over the city, not just touching it.)
Compare the correct answers to your own. The ash plume first affects the western U.S. as might be expected, and then travels across the US to the east coast in 48 hours.
Once you have reviewed the HYSPLIT output, you need to consult with the agencies concerned and determine a course of action.
Other Trajectory/Dispersion Models
Both the HYSPLIT and Ash3D three-dimensional models are used by The Alaska Volcano Observatory (AVO) and the Anchorage Volcanic Ash Advisory Center (AAWU VAAC) to monitor and assess volcanoes and eruptions. The AVO in Fairbanks runs Ash3D automatically to generate Ash3D model output every six hours for currently active volcanoes. This may be your first stop for model data in case of a volcanic eruption in the North Pacific region.
MLDP0 is the Modèle Lagrangien de Dispersion de Particules d’ordre zéro (Lagrangian Particle Dispersion Model of zeroth order) used operationally by the Volcanic Ash Advisory Center (VAAC) in Montreal to help predict the track of volcanic ash clouds that affect Canadian air space.
The Numerical Atmospheric-dispersion Modelling Environment (NAME) is used by the United Kingdom Meteorological Service (UK Met Office) in the London VAAC to model the dispersion of volcanic ash.
You may wish to check with the VAAC for your region to find out if specific dispersion models are available for your area.
Issue Products
The release of a Volcanic Ash Advisory (VAA) or a Volcanic Ash Graphic (VAG) from a Volcanic Ash Advisory Center triggers forecasters to take action. In the U.S., the Ocean Prediction Center (OPC) and the Aviation Weather Center provide large scale forecasts and warnings to alert marine and aviation customers to volcanic ash events. Meteorologists at en route air traffic centers provide information to air traffic flow managers. Forecasters alert their warning area through marine and volcanic ash fall forecasts and warnings. Meteorological Watch Offices work on a larger scale in their area of responsibility to warn aviation operators of volcanic ash incidents. Meteorological Watch Offices support tasks jointly defined by the International Civil Aviation Organization, the World Meteorological Organization and various U.S. government agencies.
Question 1
Let’s return to the eruption of Puyehue Cordón-Caulle and prepare a forecast product for volcanic ash. Select the most appropriate title for a volcanic ash product for your area.
The correct answer is b).
Question 2
Select the discussion that best describes a hypothetical volcanic ash fall advisory for Puyehue Cordón-Caulle’s eruption.
The correct answer is c).
The discussion contained in option c) does the best job of describing the event and its impacts to the forecast area. Discussion a) is very general and does not cover information pertaining to aviation and the public. Discussion b) is very vague and very wordy.
Communication
When a volcanic ash event threatens your area of operations, you will need to provide follow-up communication to your customers in addition to the products that you issue. Forecasters may use instant messaging systems or other means to communicate directly with customers and agencies affected by the ash. These tools facilitate collaboration through the exchange of information during an unfolding event.
Question
Which of the following people would you contact after issuing your product? (Select all that apply.)
The correct answers are a), b), and c.
You should contact your customers and partners who will be directly impacted by volcanic ash. These include emergency managers, airport authority and meteorologists working for the airline. Proactive communication with all partners is crucial for the duration of the ash event in your area. You may need to investigate how often local emergency managers hold a call about an event and make sure that you participate in the call. To ensure that you will be invited to such a call, you will need to develop a good working relationship with the local emergency authorities prior to an event.
Summary
A variety of tools are used to evaluate volcanic ash. Satellite and radar imagery are used to identify presence and the areal extent of ash plume. Combining satellite with rawinsonde and numerical weather prediction data is helpful in evaluating the vertical extent of the plume and the direction of movement. Products are being developed as part of the GOES-R proving ground that provide the concentration of the ash cloud as well as values for the height of the plume.
Forecasters provide forecasts and warning products related to volcanic ash. Customers depend on timely information to make operational decisions. This information is especially important in aviation operations where volcanic ash can cause serious damage to aircraft, marine vessels and may impact public health and communications.
Collaboration with agencies like the Volcano Observatory, METWATCH office, nearest VAAC, and local emergency managers is crucial during an event. Thus, developing a good working relationship with all those agencies prior to an event is very important.
Contributors
Media used in this module may be covered by a variety of copyright licenses which are available for viewing in the Media Gallery.
COMET Sponsors
The COMET® Program is sponsored by NOAA National Weather Service (NWS), with additional funding by:
- European Organisation for the Exploitation of Meteorological Satellites (EUMETSAT)
- Meteorological Service of Canada (MSC)
- NOAA National Environmental Satellite, Data and Information Service (NESDIS)
- Naval Meteorology and Oceanography Command (NMOC)
Project Contributors
Senior Project Manager
- Dr. Greg Byrd — UCAR/COMET
Project Lead
- Dr. Elizabeth Mulvihill Page — UCAR/COMET
Instructional Design
- Tsvetomir Ross-Lazarov — UCAR/COMET
Principal Science Advisors
- Christina Neal —U.S. Geological Survey Anchorage, AK
- Kristine Nelson — NWS CWSU Anchorage, AK
Science Advisors
- Dr. Alan Bol — UCAR/COMET
- Jon Carney — NWS WFO St. Louis
- Patrick Dills — UCAR/COMET
- David Linder — UCAR/COMET
- Richard Mamrosh — NWS WFO Green Bay, WI
- Michael Pavolonis — NESDIS
- Warren W. Rodie — UCAR/COMET
- Dr. David Schneider — U.S. Geological Survey Anchorage, AK
- Doug Schneider — NWS WFO Morristown, TN
- Dr. Marina Timofeyeva — NWS Climate Service Division
- Ken Venzke — NWS CWSU Oakland, CA
- Leslie Wanek — NWS WFO Phoenix, AZ
- Dr. Peter Webley — University of Alaska Fairbanks
- Carl Weiss — NWS Aviation Program
- Paul Witsaman — NWS Southern Region Headquarters
Graphics/Interface Design
- Steve Deyo — UCAR/COMET
- Michelle Harrison — UCAR/COMET
- Brannan McGill — UCAR/COMET
Multimedia Authoring
- Carl Whitehurst — UCAR/COMET
Audio/Video Editing/Production
- Steve Deyo — UCAR/COMET
- Seth Lamos — UCAR/COMET
COMET HTML Integration Team 2020
- Tim Alberta — Project Manager
- Dolores Kiessling — Project Lead
- Steve Deyo — Graphic Artist
- Gary Pacheco — Lead Web Developer
- David Russi — Translations
- Gretchen Throop Williams — Web Developer
- Tyler Winstead — Web Developer
COMET Staff, Fall 2011
Director
- Dr. Timothy Spangler
Administration
- Elizabeth Lessard, Administration and Business Manager
- Lorrie Alberta
- Michelle Harrison
- Hildy Kane
Hardware/Software Support and Programming
- Tim Alberta, Group Manager
- Bob Bubon
- Ken Kim
- Mark Mulholland
- Victor Taberski - Student Assistant
- Chris Webber - Student Assistant
- Malte Winkler
Instructional Designers
- Dr. Patrick Parrish, Senior Project Manager
- Dr. Alan Bol
- Maria Frostic
- Lon Goldstein
- Bryan Guarente
- Dr. Vickie Johnson
- Tsvetomir Ross-Lazarov
- Marianne Weingroff
Media Production Group
- Bruce Muller, Group Manager
- Steve Deyo
- Dan Riter
- Carl Whitehurst
Meteorologists/Scientists
- Dr. Greg Byrd, Senior Project Manager
- Wendy Schreiber-Abshire, Senior Project Manager
- Dr. William Bua
- Patrick Dills
- Matthew Kelsch
- Dolores Kiessling
- Dr. Cody Kirkpatrick
- Dr. Arlene Laing
- Dave Linder
- Dr. Elizabeth Mulvihill Page
- Amy Stevermer
Spanish Translations
- David Russi
NOAA/National Weather Service - Forecast Decision Training Branch
- Anthony Mostek, Branch Chief
- Dr. Richard Koehler, Hydrology Training Lead
- Brian Motta, IFPS Training
- Dr. Robert Rozumalski, SOO Science and Training Resource (SOO/STRC) Coordinator
- Ross Van Til, Meteorologist
- Shannon White, AWIPS Training
Meteorological Service of Canada Visiting Meteorologists
- Brad Snyder