The following media items used in this module are protected by the details of their copyrights. Please use the "copyright terms" link associated with each media item below for more information.
Click an image to view it at full size in a new browser window/tab.
credits:
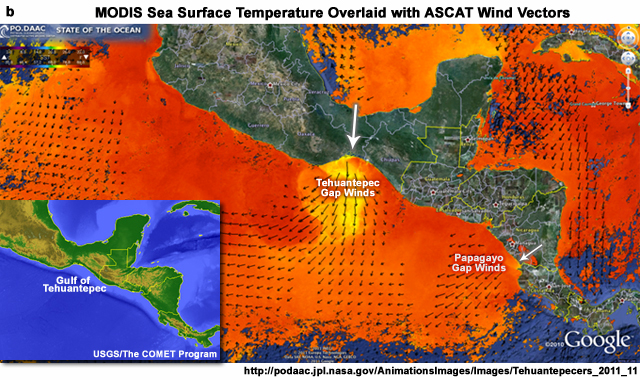
http://podaac.jpl.nasa.gov/AnimationsImages/Images/Tehuantepecers_2011_11
copyright terms:
COMET Standard Terms of Use
description:
MODIS sea surface temperature overlaid with ASCAT wind vectors on Nov. 12, 2011 showing strong gap winds and anomalously low SSTs in the Gulf of Tehuantepec. Also marked are Papagayo gap winds from mountain gaps in Nicaragua. Image obtained from site, http://podaac.jpl.nasa.gov, maintained by the NASA JPL Physical Oceanography DAAC, Pasadena, CA. (2011). Inset map shows digital elevation from the USGS.
|

credits:
Grist 2002
copyright terms:
COMET Standard Terms of Use
description:
Mean intensity and location of the AEJ; averaged from 10°W to 20°E for 1958-97 (from Grist 2002).
|
credits:
Berry et al. 2007
copyright terms:
COMET Standard Terms of Use
description:
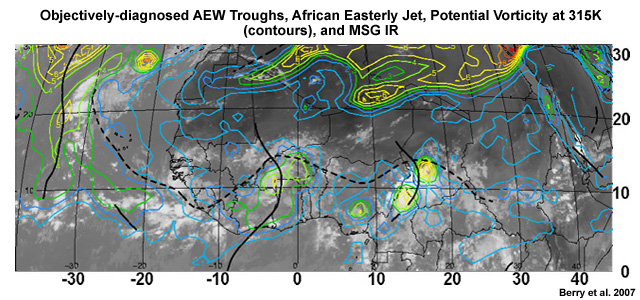
Objectively-diagnosed AEW troughs, the AEJ, with PV at 315K, overlaid on a satellite IR image. Black lines are the wave troughs, dashed line is the AEJ axis, and colored contours are PV at 315K (Berry et al. 2007).
|
credits:
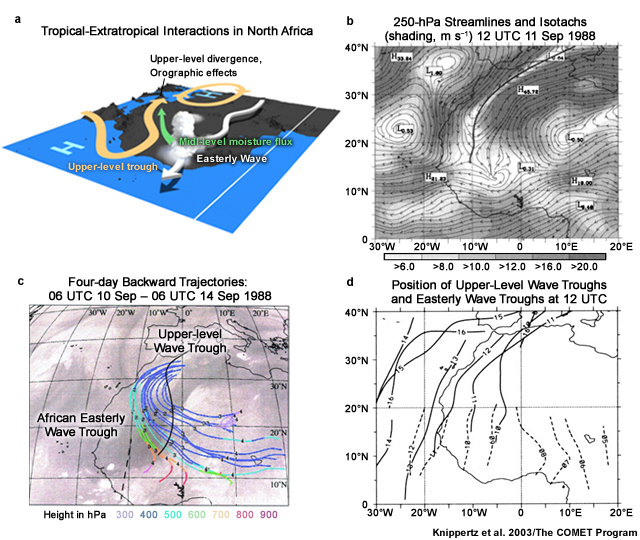
Knippertz et al. 2003/The COMET Program
copyright terms:
COMET Standard Terms of Use
description:
(a) Conceptual model of AEW and midlatitude upper-level trough interactions; (b) 250-hPa streamlines and isotachs on 11 Sep 1988; (c) back trajectories for 10-14 Sep 1988; (d) positions of upper-level wave troughs and easterly wave troughs at 12 UTC. (b), (c), and (d) are from Knippertz, P., 2003
|
credits:
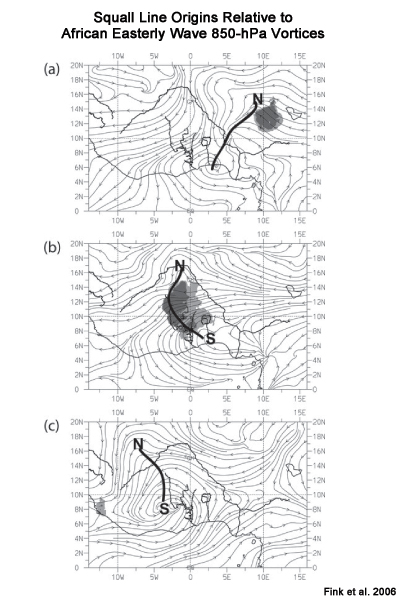
Fink et al. 2006
copyright terms:
COMET Standard Terms of Use
description:
850-hPa streamlines at 0600 UTC 3 Sep, 0000 UTC 4 Sep, and 1800 UTC 4 Sep 2002, areas enclosed by the 233- (light gray) and 213-K (dark gray) brightness temperatures used to track deep convective systems. The analyzed cyclonic centers of northerly and southerly AEWs are labeled N and S, respectively. The boldface AEW trough lines delineate the subjectively analyzed maximum cyclonic curvature between the two AEW vortices. (From Fink et al. 2006).
|
credits:
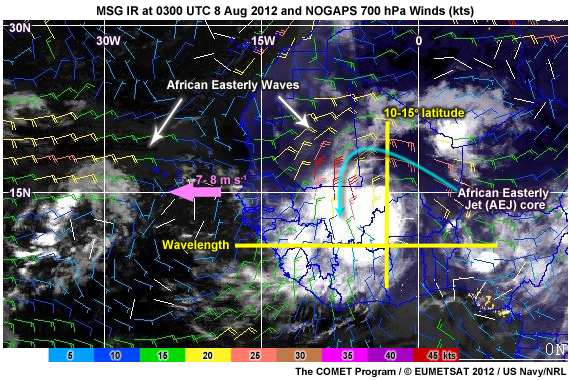
The COMET Program / © EUMETSAT 2012 / US Navy/NRL
copyright terms:
COMET Standard Terms of Use
description:
MSG IR at 0300 UTC 8 Aug 2012 and NOGAPS 700 hPa Winds (kts)
|
credits:
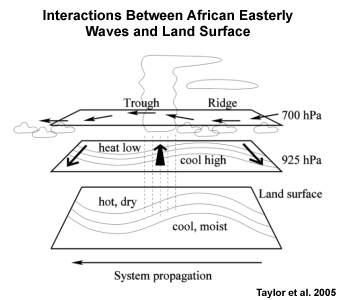
Taylor et al. 2005
copyright terms:
COMET Standard Terms of Use
description:
Schematic of the interactions between African easterly waves and land surface temperature and moisture anomalies (Taylor et al. 2005)
|
credits:
Thorncroft and Hodges 2001 and Carlson 1969
copyright terms:
COMET Standard Terms of Use
description:
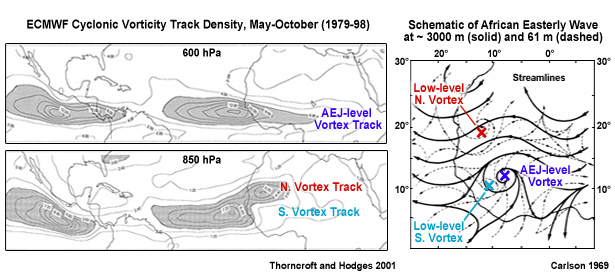
ECWMF Cyclonic Vorticity Track Density at 600 and 850 hPa May-October (1979-98)
|
credits:
© EUMETSAT 2009
copyright terms:
COMET Standard Terms of Use
description:
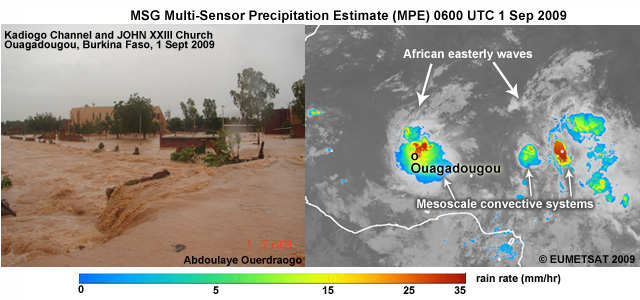
Multi-sensor Precipitation Estimates (MPE) at 0600 UTC 1 Sep 2009 showing a strong African Easterly wave and intense mesoscale convective systems associated with the record breaking flood over Ouagadougou, Burkina Faso
|
credits:
Fink and Reiner 2003
copyright terms:
COMET Standard Terms of Use
description:
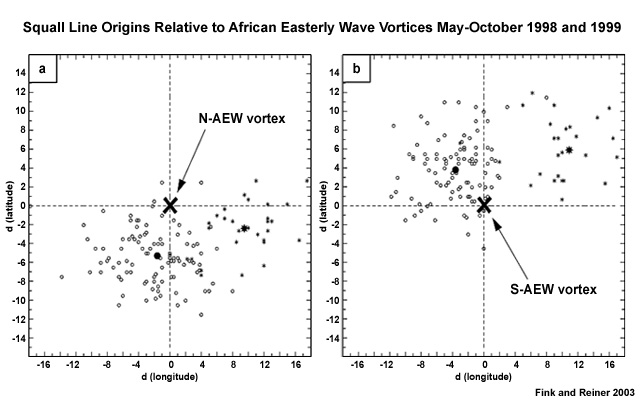
Scatterplots of origin points of squall lines relative to locations of accompanying (a) northerly and (b) southerly AEW vortices in May-Oct 1998 and 1999. Negative values indicating that the origin is west (south) of the respective vortices. Mean positions of squall lines are indicated by the large bold circles and stars. West of the trough is favorable for MCS generation for all of West Africa. In the Sahel, a secondary peak in MCS generation is found east of the trough, in the southerlies. Both diagrams cover the periods May-October 1998 and 1999 (From Fink and Reiner JGR 2003)
|
View animation
credits:
Kiladis et al. 2006
copyright terms:
COMET Standard Terms of Use
description:
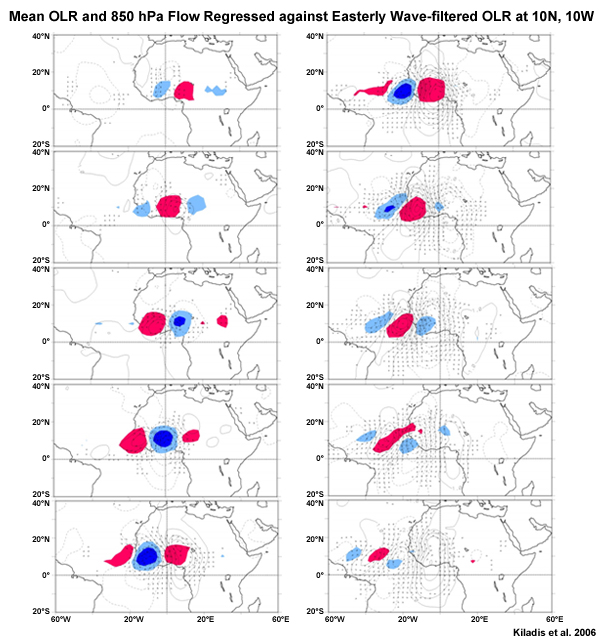
OLR and 850 hPa flow regressed against easterly wave-filtered OLR (scaled -20 W m2) at 10°N, 10°W for June-September 1979-1993. Stream function (contours 1 × 10⁵ m2 s-1), Wind (vectors, largest around 2 m s-1), OLR (shading starts at +/- 6 W s-2), negative (blue) represents enhanced convection, positive (red) indicates suppression (from Kiladis et al. 2006)
|

credits:
Kiladis et al. 2006
copyright terms:
COMET Standard Terms of Use
description:
OLR and 850 hPa flow regressed against easterly wave-filtered OLR (scaled -20 W m2) at 10°N, 10°W for June-September 1979-1993. Stream function (contours 1 × 10⁵ m2 s-1), Wind (vectors, largest around 2 m s-1), OLR (shading starts at +/- 6 W s-2), negative (blue) represents enhanced convection, positive (red) indicates suppression (from Kiladis et al. 2006)
|
credits:
Zipser et al. 2009
copyright terms:
COMET Standard Terms of Use
description:
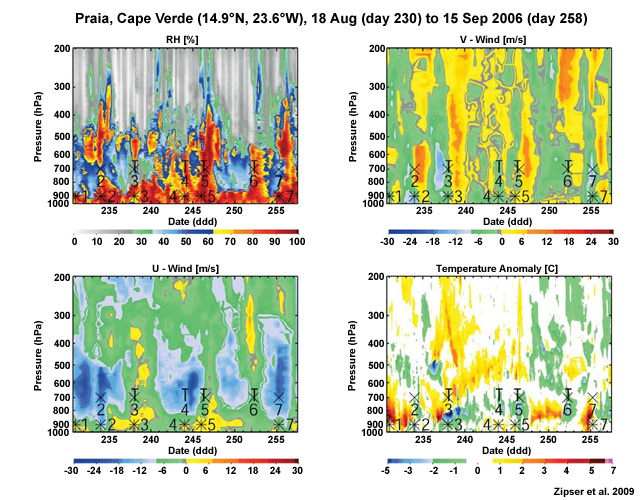
Time height analysis of relative humidity, meridional wind (v), and zonal wind (u), and temperature anomalies for Praia, Cape Verde(14.9°N, 23.6°W), from 1700 UTC 18 Aug (day 230) to 15 Sep 2006 (day 258). The letter X marks the passage of an analyzed 700-hPa vorticity maximum, T marks the passage of a 700-hPa wave trough, and the asterisk indicates the passage of a 925-hPa vorticity maximum. Numbers indicate AEWs 17 (Zipser et al. 2009).
|
credits:
Pytharoulis and Thorncroft 1999
copyright terms:
COMET Standard Terms of Use
description:
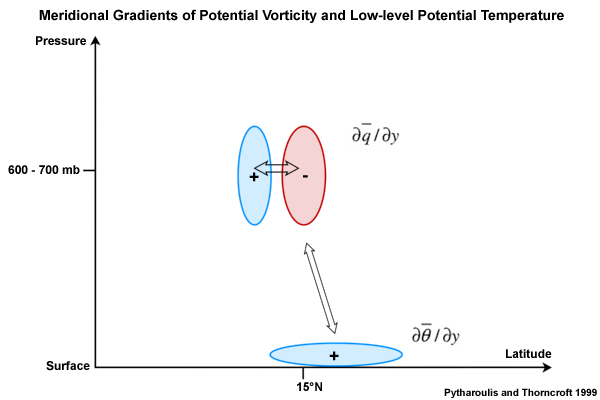
Schematic of the meridional gradients of potential vorticity, the low-level meridional gradient of potential temperature, and their interactions (indicated by the arrows) over North Africa. The plus (+) and minus (?) signs denote positive and negative values, respectively (from Pytharoulis and Thorncroft 1999)
|
credits:
Matthew Janiga / Data from NOAA/NCEP
copyright terms:
COMET Standard Terms of Use
description:
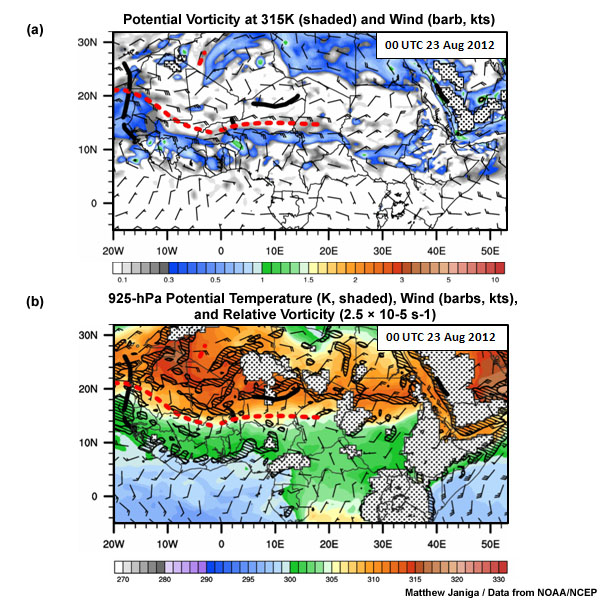
(Upper) Potential vorticity at 315K (shaded, 1 PV unit = 10-6 K kg-1 m2 s-1) and wind velocity (kts) and (lower) 925-hPa potential temperature (shaded, K), wind velocity (kts), and relative vorticity (2.5 × 10⁻⁵ s-1) at 00 UTC 23 Aug 2012. The red dashed line marks the AEJ core and the solid black line near the coast marks an AEW trough axis. (courtesy, Matthew Janiga)
|

View animation
credits:
Zipser et al. 2009
copyright terms:
COMET Standard Terms of Use
description:
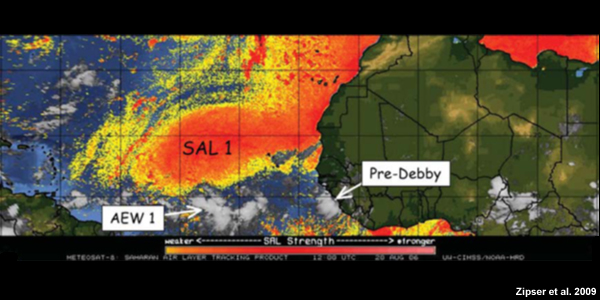
GOES satellite SAL product at 1200 UTC on 20-23 Aug. 2006. The weak, non-developing AEW1 that is moving with the region of dry lower-tropospheric air and high dust content (SAL 1) while the Pre-Debby cloud system quickly intensifies in a moister lower troposphere and lower dust content (from Zipser et al. 2009).
|
credits:
Zipser et al. 2009
copyright terms:
COMET Standard Terms of Use
description:
GOES satellite SAL product at 1200 UTC on 20 Aug. 2006. The weak, non-developing AEW1 that is moving with the region of dry lower-tropospheric air and high dust content (SAL 1) while the Pre-Debby cloud system quickly intensifies in a moister lower troposphere and lower dust content (from Zipser et al. 2009).
|
credits:
Berry et al. 2007
copyright terms:
COMET Standard Terms of Use
description:
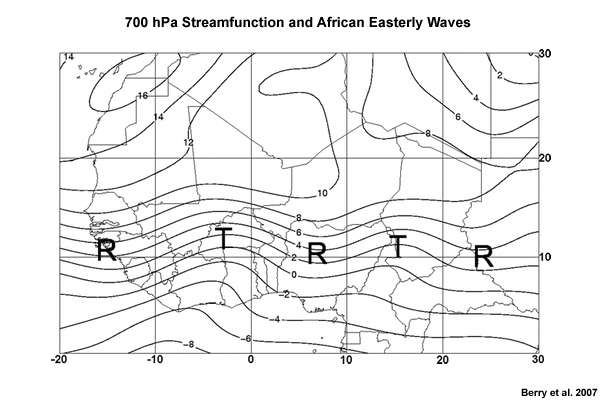
African easterly wave troughs and ridges identify from the stream function at 700 hPa, the level of the AEJ (from Berry et al. 2007).
|

credits:
Kiladis et al. 2006
copyright terms:
COMET Standard Terms of Use
description:
Time-height analysis of outgoing long-wave radiation (OLR) and temperature at Dakar (15°N, 18°W), Bamako (12.6°N, 8°W), regressed against easterly wave-filtered OLR for June-September 1979-1993 (From Kiladis et al. 2006).
|
credits:
Kiladis et al. 2006
copyright terms:
COMET Standard Terms of Use
description:
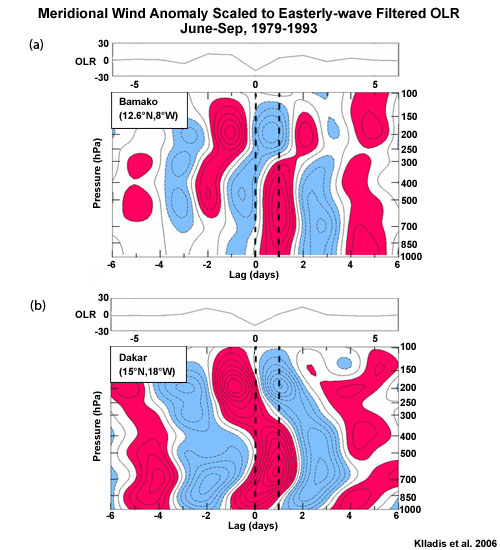
Time-height analysis of meridional wind anomaly at (upper) Bamako and (lower) Dakar, scaled to a -40 W m-2 perturbation in easterly wave-filtered OLR at the grid point nearest to each station. Contour interval is 0.5 m s-1, negative contours dashed. red (blue) shading denotes anomalies greater than (less than) 0.5 m s-1. The associated OLR anomaly is shown at the top in W m?2 (From Kiladis et al. 2006).
|
credits:
NOAA/US Navy/ NRL
copyright terms:
COMET Standard Terms of Use
description:
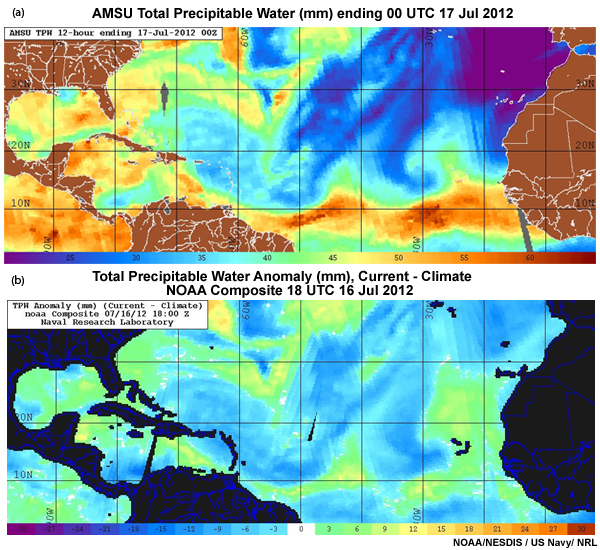
(a) Total precipitable water (TPW, mm) and (b) TPW anomalies (mm) from composite polar satellite microwave retrieval.
|
credits:
NOAA/NCEP
copyright terms:
COMET Standard Terms of Use
description:
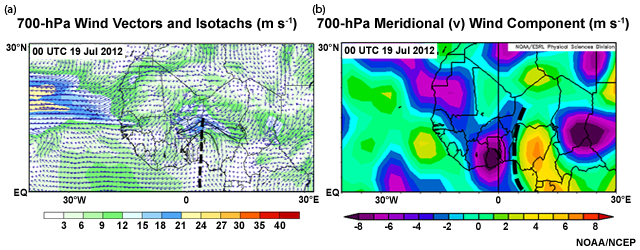
700-hPa wind vectors and isotachs and Meridional (v) wind component at 00 UTC 19 July. Easterly wave trough axis is marked by thick black dashed lines over West Africa. A few representative streamlines are drawn around the wave trough. Analysis on the left is from NCEP global data assimilation and on the right from NCAR/NCEP Reanalysis.
|
credits:
NOAA/NCEP
copyright terms:
COMET Standard Terms of Use
description:
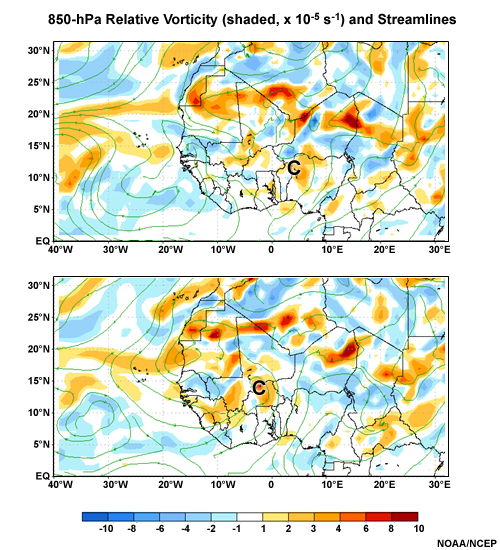
850-hPa relative vorticity (shaded, x 10-5 s-1) and streamlines at (upper) 00 UTC 19 July and (lower) 00 UTC 20 July 2012. Wave trough cyclonic circulation marked by letter "C"
|
credits:
Mekonnen et al. 2008
copyright terms:
COMET Standard Terms of Use
description:
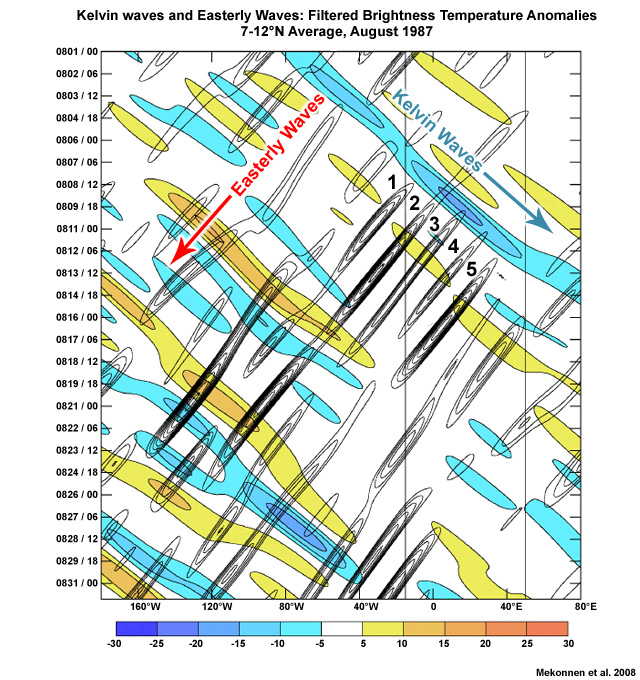
Kelvin waves (shaded) and easterly waves (black contours) from filtered cloud-top brightness temperature anomalies for August 1987. Averages are taken from 7-12°N. Africa is between the two vertical black lines (from Mekonnen et al. 2008).
|
credits:
Grist 2002
copyright terms:
COMET Standard Terms of Use
description:
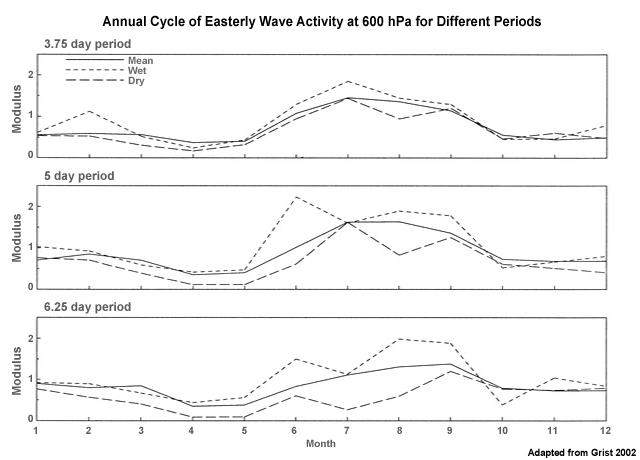
Annual cycle of significant wavelet moduli (proxy for easterly wave activity) for different wavelet scales at 600 mb. The values represent daily averages for each month. Solid line is 40-year mea, short-dashed line is mean of 10 wet years, and long-dashed line is mean of 10 dry years (Grist 2002).
|
credits:
Chen et al. 2008
copyright terms:
COMET Standard Terms of Use
description:
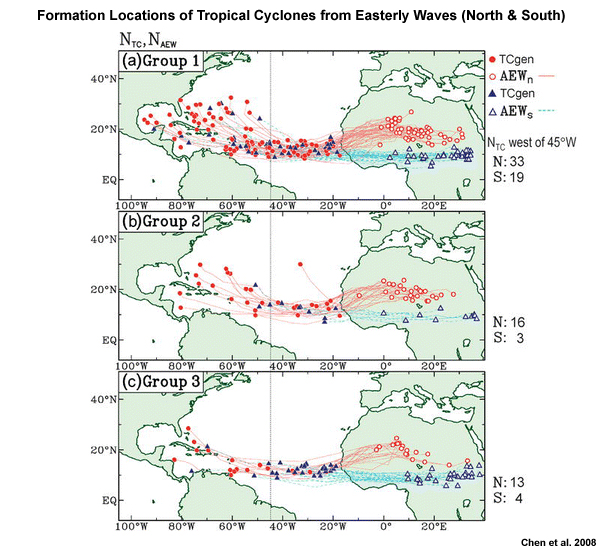
Formation locations of group (a) 1, (b) 2, and (c) 3 tropical cyclones formed from AEWns (red dots) and AEWSs (blue triangles). Genesis locations of AEWns and AEWSs are marked by red open dots and blue open triangles, respectively, while their trajectories are depicted by dashed lines in corresponding color. Numbers of tropical cyclones formed west of 45°W (dashed line) originated from AEWns (N) and AEWSs (S) are given at the right of each panel
|
credits:
The COMET Program /© EUMETSAT 2007 / US Navy/NRL
copyright terms:
COMET Standard Terms of Use
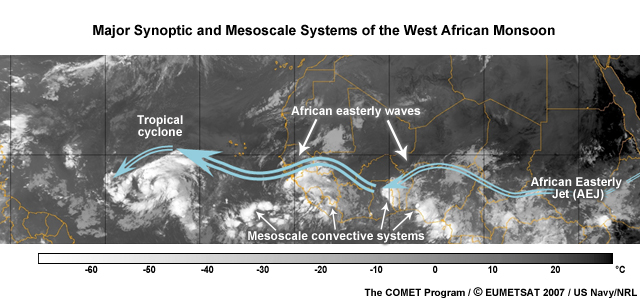
description:
Major synoptic and mesoscale weather systems of the West Africa monsoon and the tropical Atlantic.
|
credits:
Reed et al. 1977
copyright terms:
COMET Standard Terms of Use
description:
Divergence deviation from zonal means at surface, 850, 700, and 200 hPa for composite African Easterly Wave. Units are +10 to -6 per second
|
credits:
Reed et al. 1977
copyright terms:
COMET Standard Terms of Use
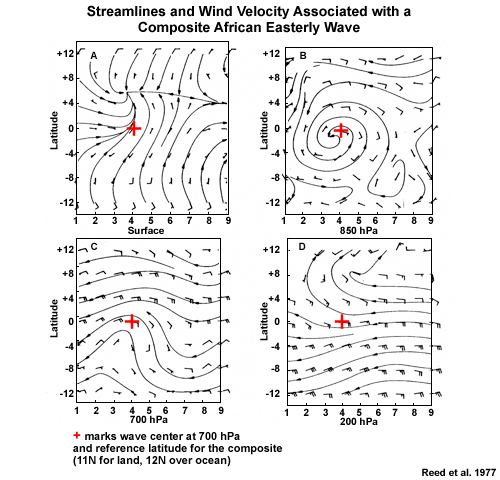
description:
Streamlines and wind barbs at the surface, 850, 700, and 200 hPa for a composite African easterly wave. Category separation is approximately 3 degrees longitude. Cross denotes disturbance center at 700 hPa
|

credits:
Reed et al. 1977
copyright terms:
COMET Standard Terms of Use
description:
Vorticity at surface, 850, 700, and 200 hPa for composite African easterly wave. Units are +10 to -5 per second
|
credits:
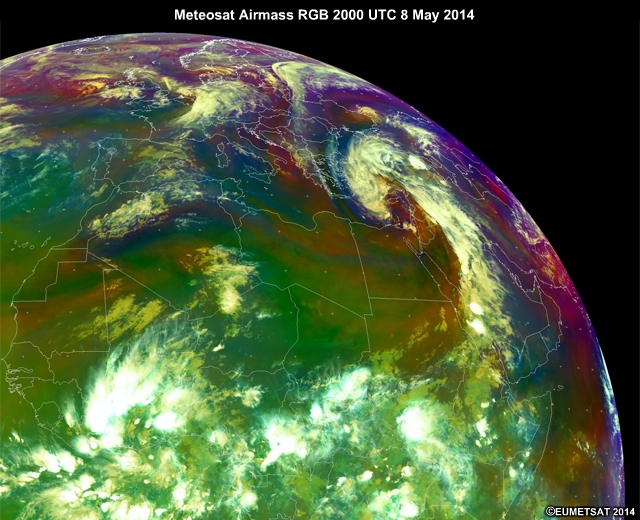
EUMETSAT 2014
copyright terms:
COMET Standard Terms of Use
description:
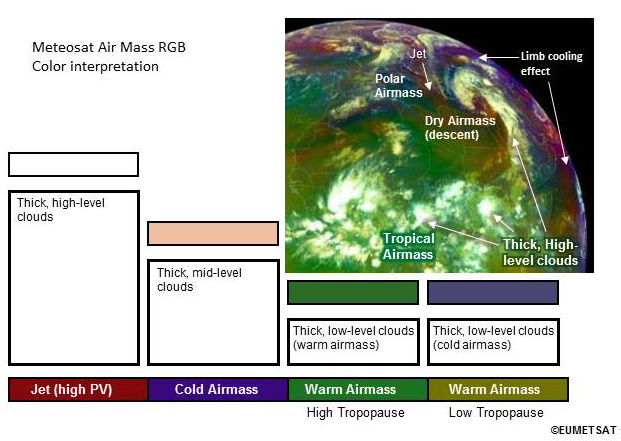
Meteosat Airmass RGB image with color interpretation ©EUMETSAT
|

credits:
(USGS or NASA ??)/The COMET Program
copyright terms:
COMET Standard Terms of Use
description:
Map showing station locations for question
|
credits:
University of Wyoming/The COMET Program/USGS or NASA (for map)
copyright terms:
COMET Standard Terms of Use
description:
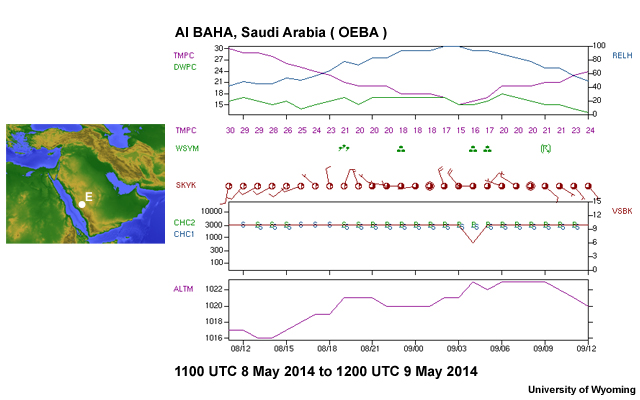
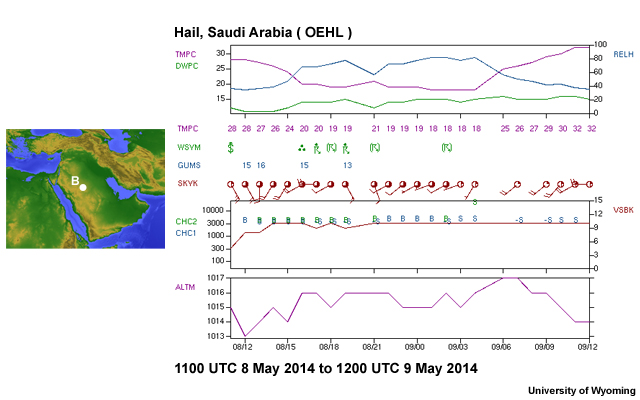
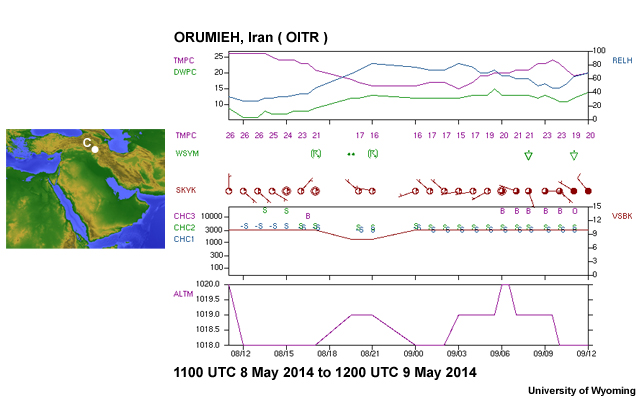
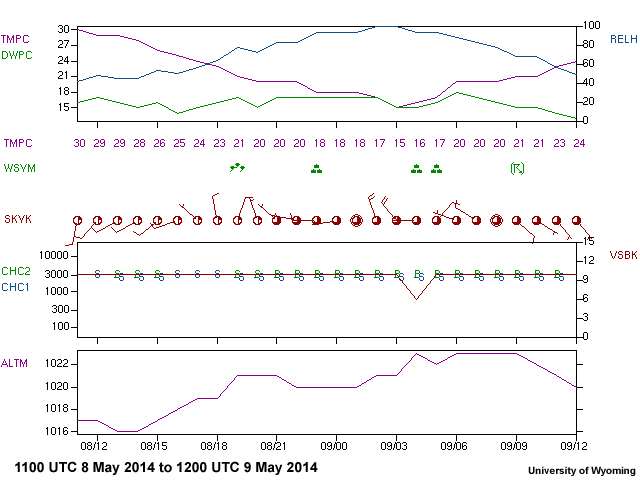
Location matched with correct meteogram for 1100 UTC 8 May - 1200 UTC 9 May 2014
|
credits:
University of Wyoming/The COMET Program/USGS or NASA (for map)
copyright terms:
COMET Standard Terms of Use
description:
Location matched with correct meteogram for 1100 UTC 8 May - 1200 UTC 9 May 2014
|
credits:
University of Wyoming/The COMET Program/USGS or NASA (for map)
copyright terms:
COMET Standard Terms of Use
description:
Location matched with correct meteogram for 1100 UTC 8 May - 1200 UTC 9 May 2014
|
|
credits:
Photograph by Donald Simon, Credit on inset map:
copyright terms:
COMET Standard Terms of Use
description:
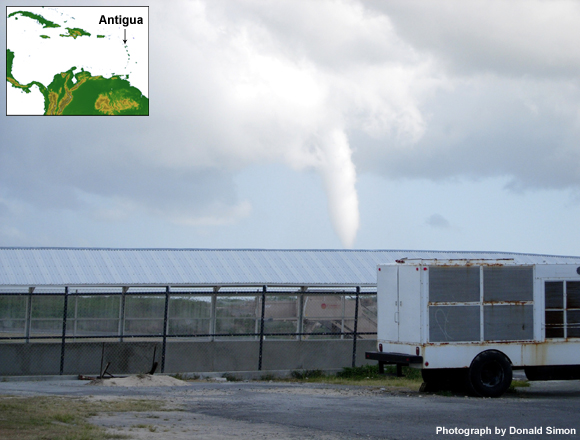
Photograph of tornado touching down in Antigua, an island in the northeastern Caribbean, 11 April 2005 (photograph courtesy Mr. Donald Simon).
|
credits:
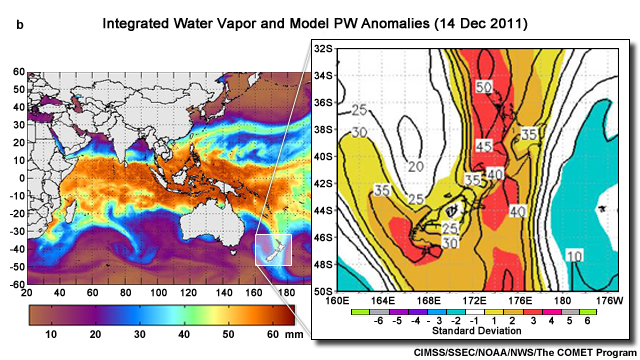
CIMSS/SSEC/NOAA/NWS/The COMET Program
copyright terms:
COMET Standard Terms of Use
description:
Numerical Weather Prediction precipitable water anomalies over New Zealand for December 14, 2011. The PW anomalies image is zoomed out from the corresponding global integrated water vapor image at the same time.
|
credits:
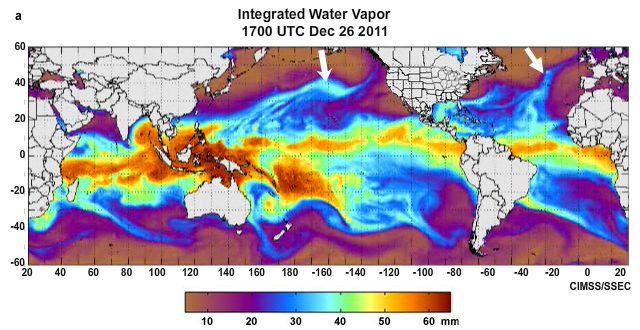
CIMSS/SSEC/The COMET Program
copyright terms:
COMET Standard Terms of Use
description:
Global integrated water vapor from December 28, 2011 with arrows pointing out the long AR path over the Pacific Ocean originating from 20 N, 160 E and the meridional AR in the middle of the Atlantic Ocean.
|
![Schematic of typical northeast Pacific atmospheric river (AR). (a) Horizontal analysis showing the polar-cold-front and the Low Level Jet (LLJ). Outlined arrow depicts the AR; blue arrow the low-level jet (LLJ). Green area is IWV >=2 cm and red marks the AR enhanced rain-rate (RR) >=0.5 mm/h. Dashed blue line depicts a symbolic area of precipitation associated with the tropical plume. Magenta line AB defines a cross-section for panel (d). Pink segments over the LLJ (ab) mark the limits for integrating variables shown in panel (c). [Note that thresholds are regionally specific]. (b) Cross section through an AR [AB in (1)] showing the vertical structure along the front, isotachs (blue contours; m/s), specific humidity (dotted green contours; g/kg), and horizontal moisture flux (red contours and shading; ×10^5 kg/s). (b) Vertical structure of moisture flux (red line), moist static stability (green), and wind speed (blue) along the LLJ. (d) Cross-section depicting air flow along the LLJ, from the ocean being lifted by coastal mountains and producing precipitation (Adapted from Ralph et al. (2004), Ralph et al. (2005) and Gimeno et al 2014)](media/graphics/AR_horiz_vert_NEPac.jpg)
credits:
Ralph et al. 2004, 2005/Gimeno et al. 2014
copyright terms:
COMET Standard Terms of Use
description:
Schematic of typical northeast Pacific atmospheric river (AR). (a) Horizontal analysis showing the polar-cold-front and the Low Level Jet (LLJ). Outlined arrow depicts the AR; blue arrow the low-level jet (LLJ). Green area is IWV >=2 cm and red marks the AR enhanced rain-rate (RR) >=0.5 mm/h. Dashed blue line depicts a symbolic area of precipitation associated with the tropical plume. Magenta line AB defines a cross-section for panel (d). Pink segments over the LLJ (ab) mark the limits for integrating variables shown in panel (c). [Note that thresholds are regionally specific]. (b) Cross section through an AR [AB in (1)] showing the vertical structure along the front, isotachs (blue contours; m/s), specific humidity (dotted green contours; g/kg), and horizontal moisture flux (red contours and shading; ×10^5 kg/s). (b) Vertical structure of moisture flux (red line), moist static stability (green), and wind speed (blue) along the LLJ. (d) Cross-section depicting air flow along the LLJ, from the ocean being lifted by coastal mountains and producing precipitation (Adapted from Ralph et al. (2004), Ralph et al. (2005) and Gimeno et al 2014)
|
![Conceptual schematic of tropical-extratropical interactions resulting in tropical moisture transported into an atmospheric river (AR) over the northeast Pacific on 24-26 March 2005: (a) Schematic of 150-hPa large-scale streamline anomalies [red: planetary scale circulations; green: extratropical wave packet (EWP) tied to the AR]. A and C mark anticyclonic and cyclonic circulation centers, respectively. Purple arrows show the mean direction of energy dispersed by the EWP. Grey shading depicts coherent cold cloud tops associated with the MJO, three Kelvin waves (K1, K2, and K3), and the AR. (b) Depiction of the EWP at regional scale (thick grey-shaded arrow; purple arrow shows direction of propagation) and associated extratropical cyclone with fronts. Green shading marks the tropical IWV reservoir and narrow IWV band associated with the AR, and green arrows depict how tropical water vapor is tapped into the AR. Kelvin waves 2 and 3 are encircled by thin, black lines. Black arrows show the lower-tropospheric flow pattern. Inset boxes in (a) and (b) outline the domains of the subsequent panels. Panel (c) shows the frontal boundary on 26-27 March 2005 as a frontal wave propagates across the eastern Pacific and makes landfall in NW Oregon causing heavy rain and flooding. The blue contours show the number of hours of AR conditions, based on the frontal analysis, and assuming that the AR was 500 km wide. (From Ralph et al. 2011)](media/graphics/AR_MJO_Kelvin.jpg)
credits:
Ralph et al. 2011
copyright terms:
COMET Standard Terms of Use
description:
Conceptual schematic of tropical-extratropical interactions resulting in tropical moisture transported into an atmospheric river (AR) over the northeast Pacific on 24-26 March 2005: (a) Schematic of 150-hPa large-scale streamline anomalies [red: planetary scale circulations; green: extratropical wave packet (EWP) tied to the AR]. A and C mark anticyclonic and cyclonic circulation centers, respectively. Purple arrows show the mean direction of energy dispersed by the EWP. Grey shading depicts coherent cold cloud tops associated with the MJO, three Kelvin waves (K1, K2, and K3), and the AR. (b) Depiction of the EWP at regional scale (thick grey-shaded arrow; purple arrow shows direction of propagation) and associated extratropical cyclone with fronts. Green shading marks the tropical IWV reservoir and narrow IWV band associated with the AR, and green arrows depict how tropical water vapor is tapped into the AR. Kelvin waves 2 and 3 are encircled by thin, black lines. Black arrows show the lower-tropospheric flow pattern. Inset boxes in (a) and (b) outline the domains of the subsequent panels. Panel (c) shows the frontal boundary on 26-27 March 2005 as a frontal wave propagates across the eastern Pacific and makes landfall in NW Oregon causing heavy rain and flooding. The blue contours show the number of hours of AR conditions, based on the frontal analysis, and assuming that the AR was 500 km wide. (From Ralph et al. 2011)
|
View animation
credits:
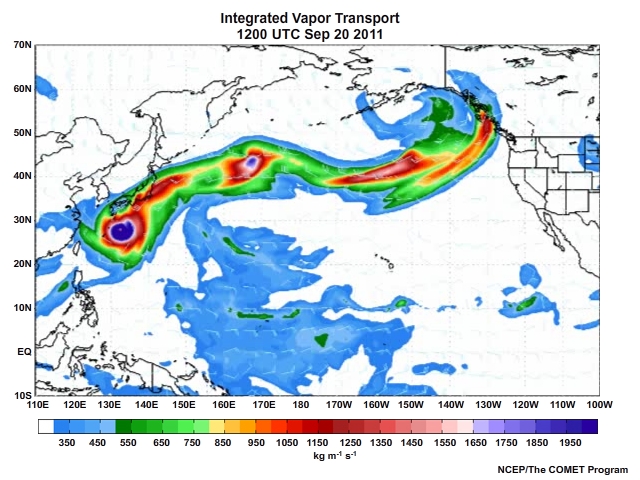
NCEP/The COMET Program
copyright terms:
COMET Standard Terms of Use
description:
Global integrated water vapor animation from September 2011 showing atmospheric river extending from a tropical cyclones in the Northwest Pacific to the West coast of North America.
|
credits:
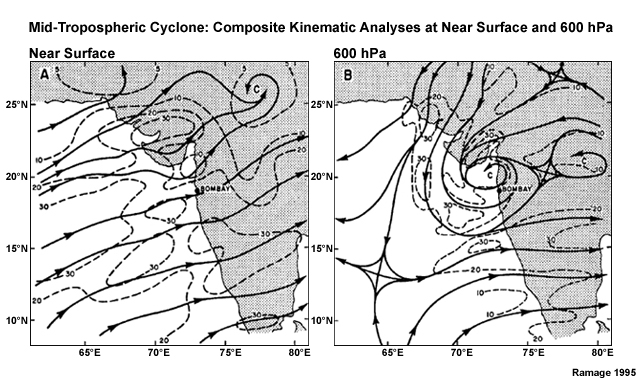
Ramage 1995
copyright terms:
COMET Standard Terms of Use
description:
Composite kinematic analysis for near surface layer (left) and 600 hPa (right). Solid lines are streamlines; dashed lines are isotachs, labeled in kts (Ramage 1995, adapted from Miller and Keshavamurthy 1968).
|
credits:
Carr 1977
copyright terms:
COMET Standard Terms of Use
description:
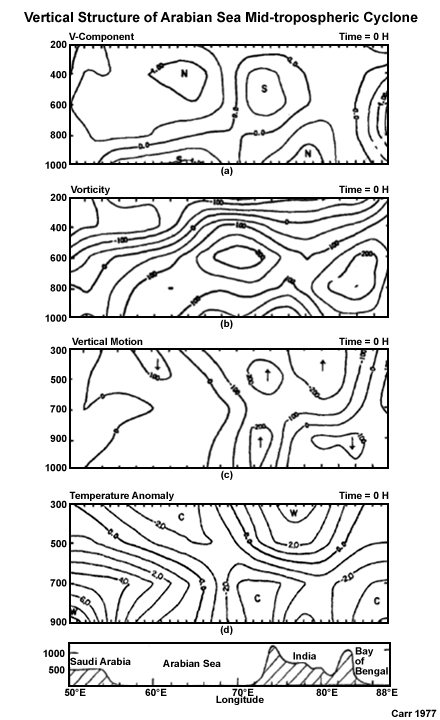
East-west vertical cross-section through an Arabian Sea Mid-tropospheric cyclone along 18ºN at the initial time; (a) v-component (m s-1); (b) vorticity (x 10-7 s-1); (c) vertical velocity (x 10-5 hPa s- 1); (d) temperature anomaly (º C); and elevation (m) in the bottom panel
|
credits:
Main image - Mapes/Data from NOAA , Soundings-
copyright terms:
COMET Standard Terms of Use
description:
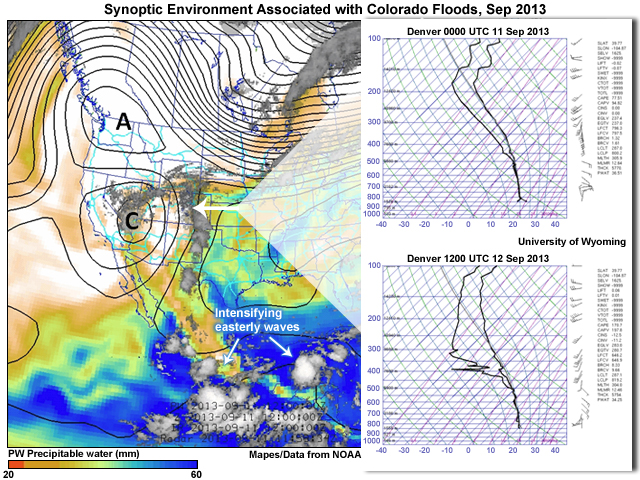
Synoptic environment associated with record-breaking flooding in the Colorado Front Range 11-15 September 2013. Colors show column integrated water vapor, also known as Precipitable Water (PW), from the operational NOAA GFS analyses, on a scale from 20 (lightest brown) to 60 (deep blue) in units of kg m-2 = mm of liquid equivalent. Black contours are 500 hPa geopotential height from GFS analyses. Gray shading shows satellite-observed infrared (IR) imagery indicating cloud top temperature (white = cold = high or deep clouds). Transparency effects were used to make some PW and IR values invisible for clarity. Interstate highways are shown in cyan. Note the "Rex block"flow pattern in the west.
|
View animation
credits:
Mapes/ Data from NOAA
copyright terms:
COMET Standard Terms of Use
description:
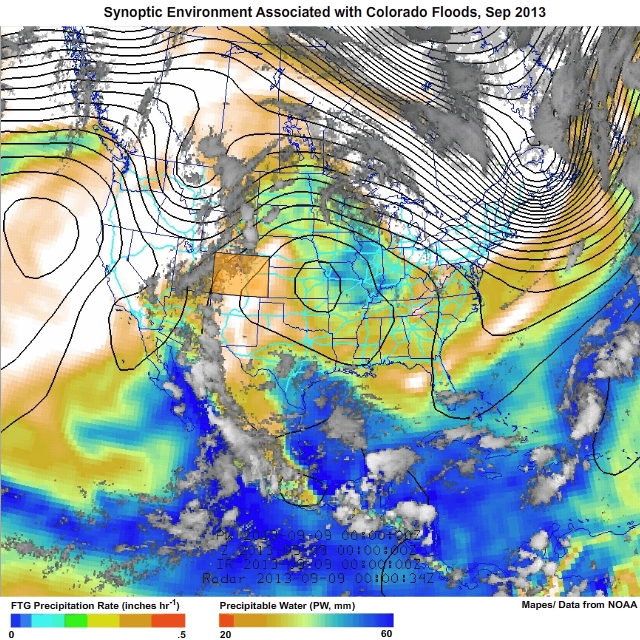
Synoptic environment associated with record-breaking flooding in the Colorado Front Range 11-15 September 2013. Colors show column integrated water vapor, also known as Precipitable Water (PW), from the operational NOAA GFS analyses, on a scale from 20 (lightest brown) to 60 (deep blue) in units of kg m-2 = mm of liquid equivalent. Black contours are 500 hPa geopotential height from GFS analyses. Gray shading shows satellite-observed infrared (IR) imagery indicating cloud top temperature (white = cold = high or deep clouds). Transparency effects were used to make some PW and IR values invisible for clarity. Interstate highways are shown in cyan. Note the "Rex block"flow pattern in the west.
|
credits:
NOAA/NWS
copyright terms:
COMET Standard Terms of Use
description:
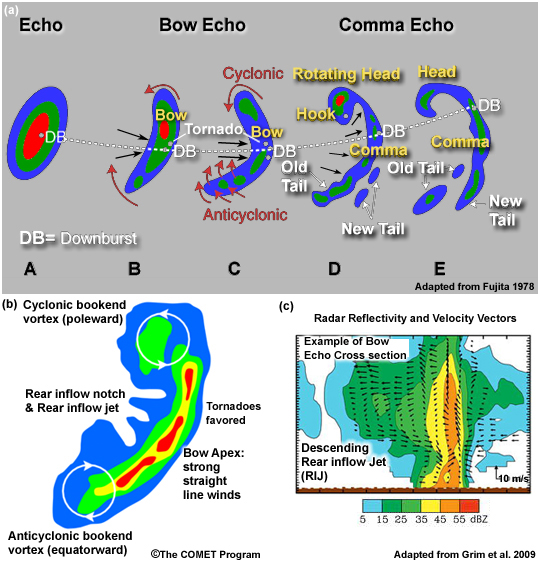
(Upper) Conceptual model of bow echo evolution and favored locations for downbursts, tornadoes, and bookend vortices. (Lower left) Conceptual diagram of bow echo features and an example cross section showing the rear-inflow notch or weak echo notch which signifies the location of a descending rear inflow jet that leads to damaging straight line surface winds. (Lower right) Example of a bow-echo cross section showing radar reflectivity and storm relative flow including the rear inflow jet (from Grim et al. 2009).
|
credits:
NOAA/NCEP/The COMET Program
copyright terms:
COMET Standard Terms of Use
description:
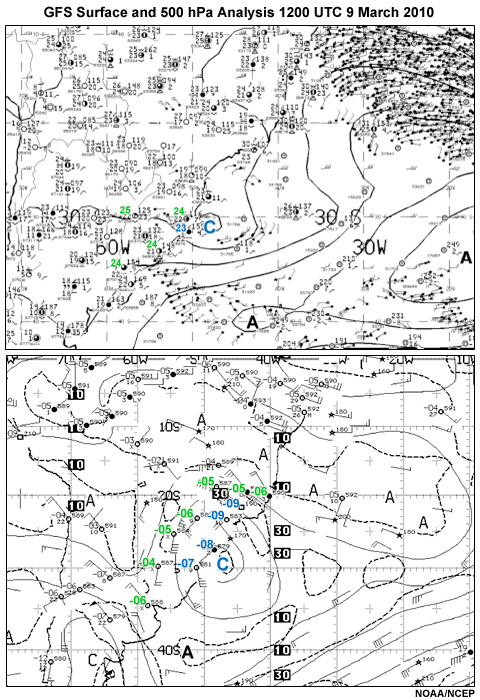
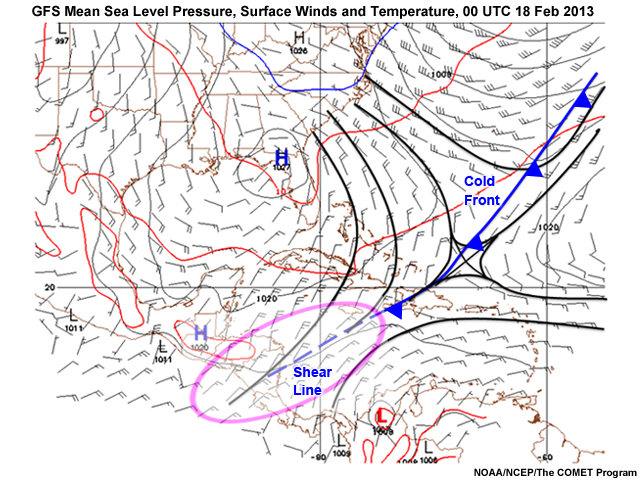
GFS Mean Sea Level Pressure, Surface Winds and Temperature, 00 UTC 18 Feb 2013
|
credits:
Churchill and Houze 1984
copyright terms:
COMET Standard Terms of Use
description:
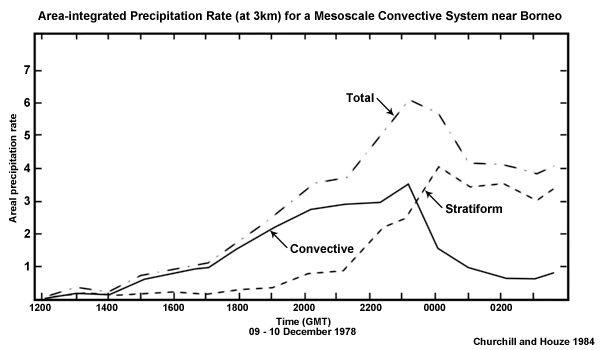
Graph showing the differences in areal coverage of total, convective, and stratiform precipitation for a non-squall tropical cluster.
|
credits:
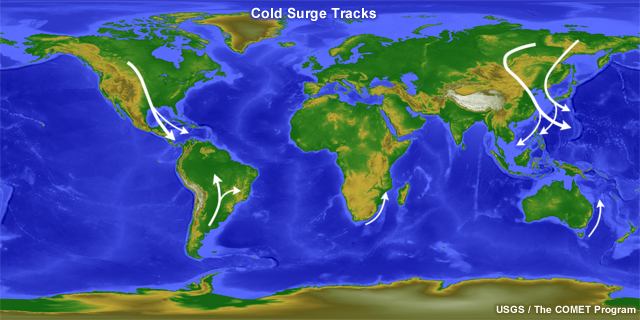
Adapted from Garreaud 2000 and Vera et al. 2006
copyright terms:
COMET Standard Terms of Use
description:
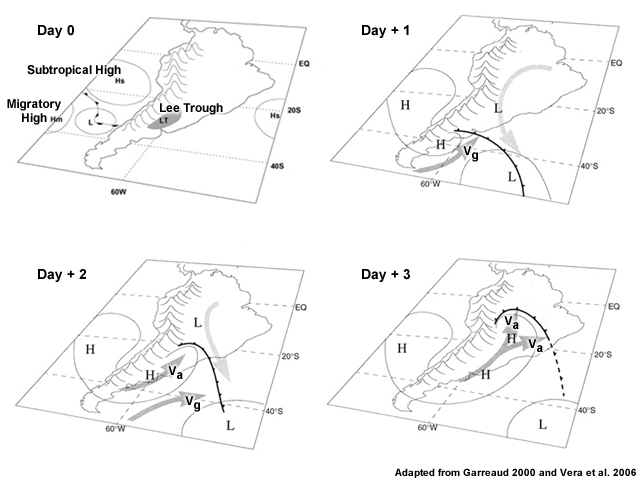
Cold surge conceptual model for South America
|
|
credits:
Schultz et al. 1998
copyright terms:
COMET Standard Terms of Use
description:
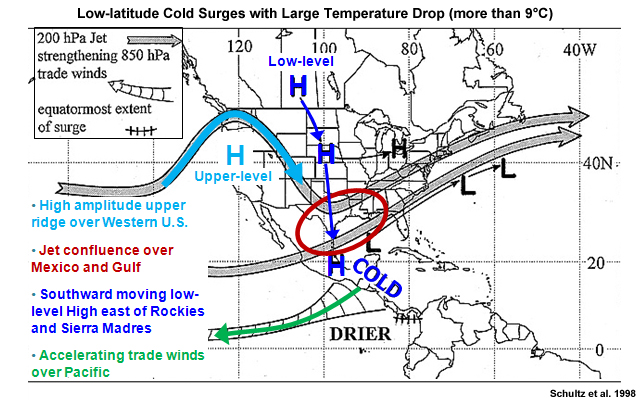
Synoptic features associated with cold surges into the low-latitudes of Central America and the Caribbean (Schultz et al 1998)
|
credits:
NOAA/NCEP/The COMET Program
copyright terms:
COMET Standard Terms of Use
description:
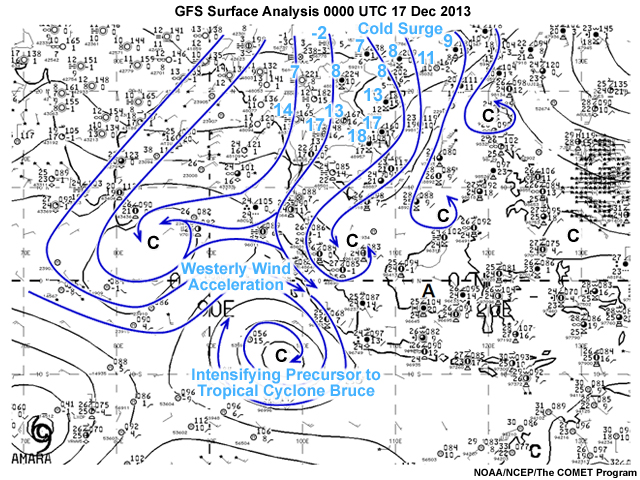
GFS Surface Analysis at 0000 UTC 17 Dec 2013 associated with a cold surge over Southeast Asia and the South China Sea, westerly wind accelerations along the equator, and genesis of Tropical Cyclone Bruce
|
credits:
NOAA
copyright terms:
COMET Standard Terms of Use
description:
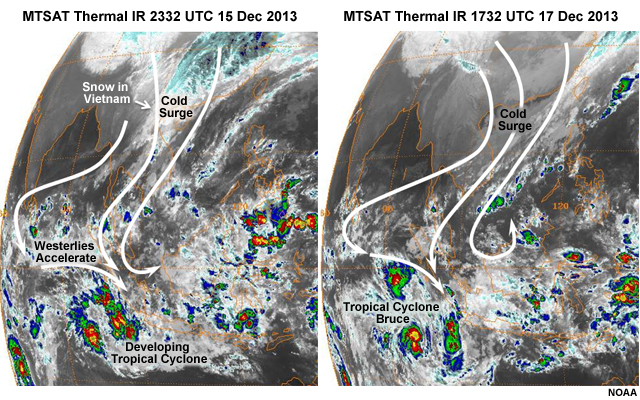
MTSAT enhanced IR at 2332 UTC 15 Dec and 1732 UTC 17 Dec 2013 showing extremely cold air mass in the wake of a strong extratropical cyclone that produced snow in northern Vietnam (a rare occurrence). Surging northeasterlies, cross-equatorial flow, and accelerating westerly winds supported genesis of Tropical Cyclone Bruce west of Sumatra.
|
credits:
Liu et al. 2007
copyright terms:
COMET Standard Terms of Use
description:
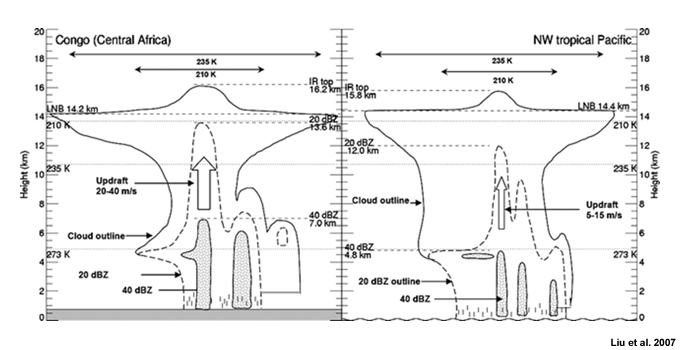
Conceptual diagram comparing continental and oceanic MCSs.
|
![Dispersion curves for equatorial waves (up to n=4) as a function of the nondimensional frequency, v*, and zonal wavenumber, k*, where v^* ??v/(??((gh) ))?^(1?2) and ?k^*?k(?((gh) )/?)?^(1?2). Eastward propagating waves appear in the right-hand quadrant (relative to the zero basic state employed) and westward propagating waves appear on the left. [From Kiladis, G. N., M. C. Wheeler, P. T. Haertel, K. H. Straub, and P. E. Roundy (2009), Convectively coupled equatorial waves, Rev. Geophys., 47, RG2003, doi:10.1029/2008RG000266. Reproduced with permission from the American Geophysical Union.]](media/graphics/dispersion_curves_eq_waves.jpg)
credits:
Kiladis et al. 2009
copyright terms:
COMET Standard Terms of Use
description:
Dispersion curves for equatorial waves (up to n=4) as a function of the nondimensional frequency, v*, and zonal wavenumber, k*, where v^* ??v/(??((gh) ))?^(1?2) and ?k^*?k(?((gh) )/?)?^(1?2). Eastward propagating waves appear in the right-hand quadrant (relative to the zero basic state employed) and westward propagating waves appear on the left. [From Kiladis, G. N., M. C. Wheeler, P. T. Haertel, K. H. Straub, and P. E. Roundy (2009), Convectively coupled equatorial waves, Rev. Geophys., 47, RG2003, doi:10.1029/2008RG000266. Reproduced with permission from the American Geophysical Union.]
|
credits:
Adapted from Johnson, R., 2011.
copyright terms:
COMET Standard Terms of Use
description:
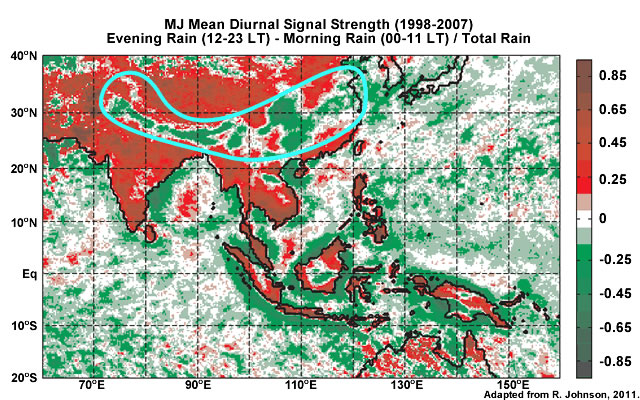
Difference between evening, 1200 to 2300 local time and morning, 0000 to 1100 local time, precipitation amounts over the Australasian Monsoon Region, average from May to June, 1998 through 2007. Difference normalized by total rainfall for the 10 year period. Evening maximum is in red, morning maximum in green. Blue contour encomses Himalayan and interior China areas with morning precipitation maximum.
|
|
credits:
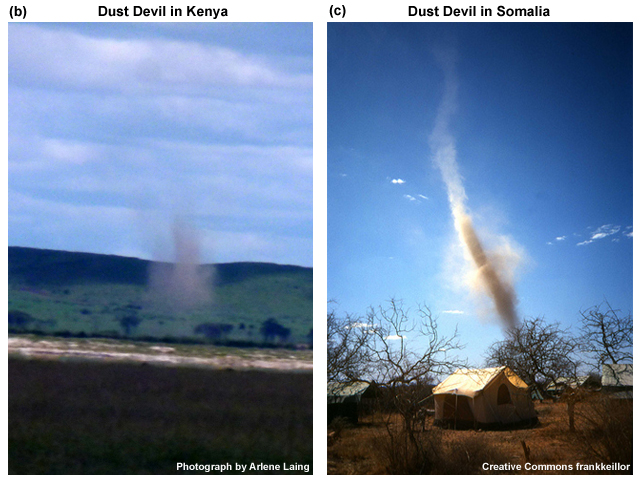
(left) Creative Commons frankkeillor (right) Photograph by Arlene Laing
copyright terms:
COMET Standard Terms of Use
description:
Dust devil with clear sky, Somalia, http://www.flickr.com/photos/frankkeillor/4665215427/sizes/l/in/photostream/
(Photo by Frank Keillor, Creative Commons license for non-commercial use)
Dust devil with fair weather cumulus, Amboseli, Kenya, 12 May 2012 (photograph by Arlene Laing)
|

credits:
Fuller and Stensrud 2000
copyright terms:
COMET Standard Terms of Use
description:
Conceptual model of the initiation and movement of surges of moisture from the Gulf of California. The letter S marks where the surge begins and the arrow pointing to the direction of propoagation. Upward/downward motion associated with the preceding easterly wave trough is indicated by +/- symbols (from Fuller and Stensrud 2000)
|
credits:
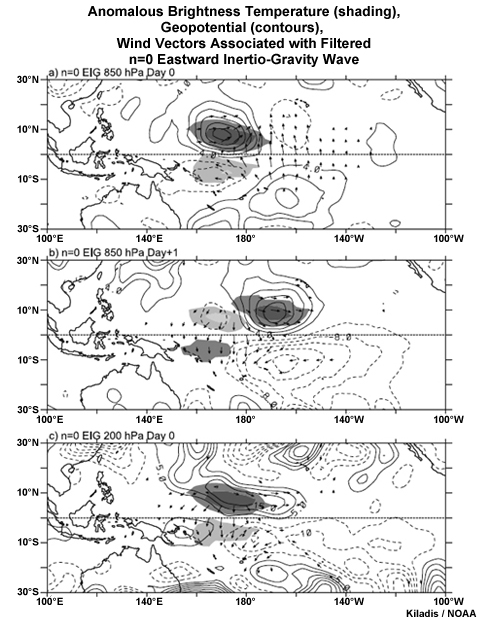
Kiladis/NOAA
copyright terms:
COMET Standard Terms of Use
description:
Anomalous brightness temperature (shading), geopotential (contours), and wind vectors associated with a -20K perturbation in n=0 EIG wave. Tb at the base point 0.0, 155E, for (a) day -1 at 850 hPa (b) day 0 at 850 hPa, and (c) day 0 at 200 hPa. Contours are every 2m^2 s^2 with negative contours dashed. Dark (light) shading marks negative (positive) Tb perturbations of 10K and 3K. Tb and wind vectors are locally significant at the 95% level, with the largest vectors around 2 m s-1. (Kiladis et al. 2009)
|
credits:
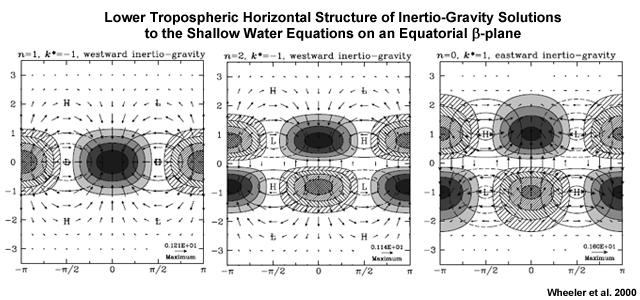
Wheeler et al. 2000
copyright terms:
COMET Standard Terms of Use
description:
Lower tropospheric horizontal structures of IG solutions to the shallow water equations on an equatorial ?-plane. Each is shown for a non-dimensional zonal wave number, k* = ±1. All scales and fields have been non-dimensionalized to an equatorial Rossby radius of 1 and plotted for a non-dimensional zonal wave number, k* = ±1. Divergence is hatched and convergence is shaded, with a 0.6 unit contour interval. Line contours are geopotential, with a contour interval of 0.5 units; negative contours are dashed, and the zero contour is omitted. Maximum wind vectors in each panel are shown in the bottom right corner.
|
credits:
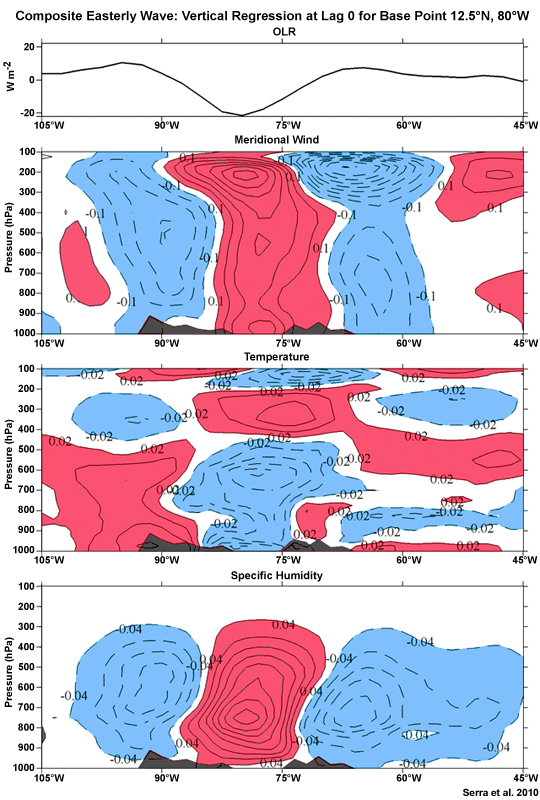
Serra et al. 2010
copyright terms:
COMET Standard Terms of Use
description:
Vertical regressions at lag 0 along 12.5°N of (a) OLR and (b) meridional wind, (c) temperature, and (d) specific humidity for the 12.5°N, 80°W base point. Contour intervals are 0.2 m s-1, 0.04°C, and 0.08 g kg?1 in (b)(d), respectively. Minimum surface pressures between 9.5° and 15.5°N are also shown to represent the orography (Serra et al. 2010).
|
|
credits:
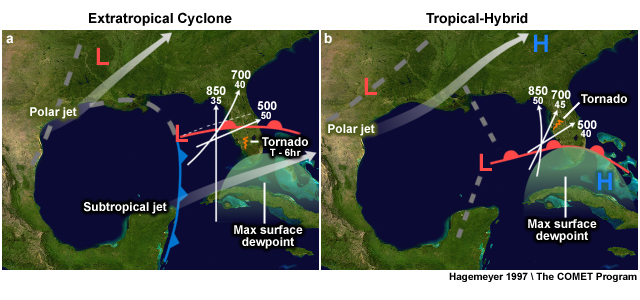
Hagemeyer 1997 \ The COMET Program
copyright terms:
COMET Standard Terms of Use
description:
Synoptic environment that produced tornadoes over Florida on (a) 5 Apr 1993 and (b) 3 Oct. 1992
|
|
credits:
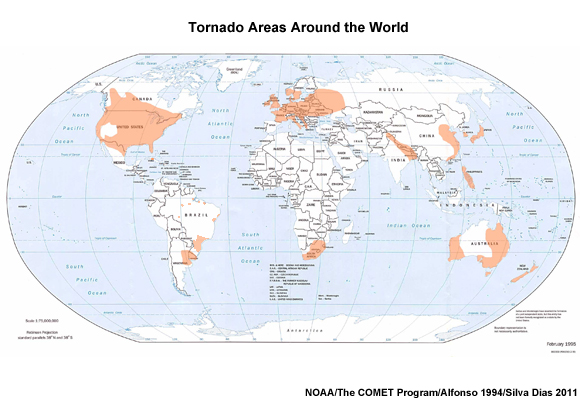
NOAA/The COMET Program/ Silva Dias 2011
copyright terms:
COMET Standard Terms of Use
description:
Global map of tornadoes based on NOAA NCDC map and 'An Increase in the Number of Tornado Reports in Brazil' by Silva Dias (2011)
|
|
credits:
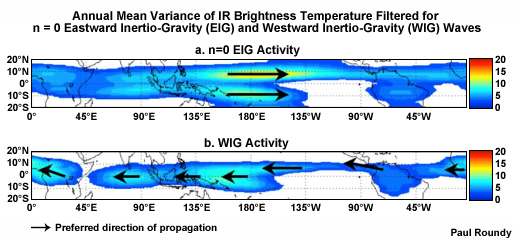
Paul Roundy
copyright terms:
COMET Standard Terms of Use
description:
Distribution of annual mean variance of IR brightness temperature filtered for the equatorial (a) n=0 eastward inertio-gravity waves, (b) westward inertio-gravity wave. Also shown are preferred direction of propagation and preferred location of tropical cyclone genesis associated with each mode (courtesy of Paul Roundy).
|
credits:
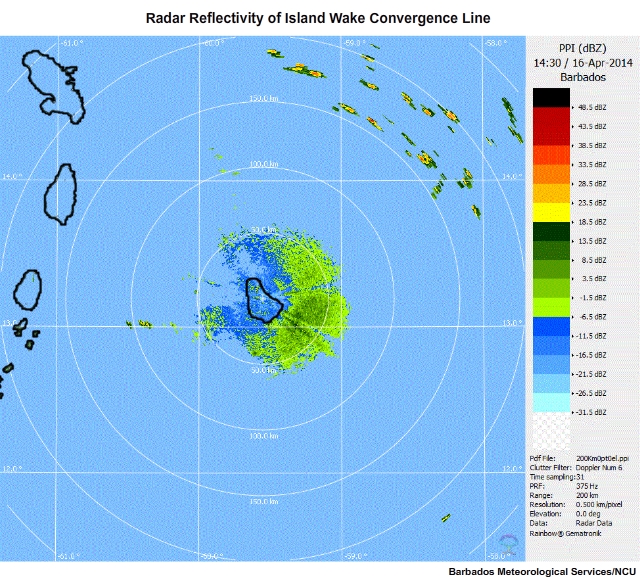
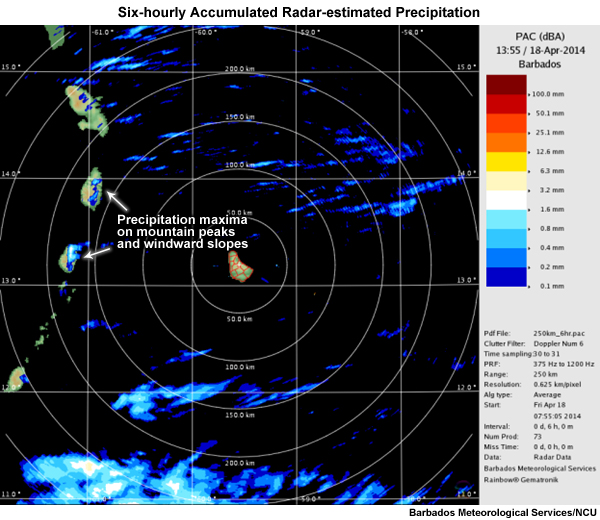
Barbados Meteorological Services/NCU
copyright terms:
COMET Standard Terms of Use
description:
Six-hourly accumulated precipitation estimated from Barbados radar at 0755 UTC 18 April 2014.
|
credits:
NOAA/CIRA
copyright terms:
COMET Standard Terms of Use
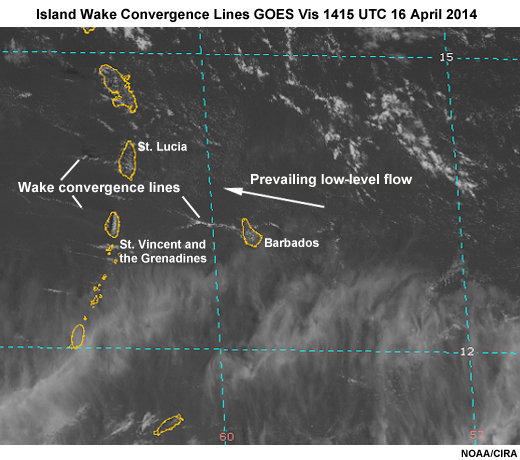
description:
GOES visible image showing island wake convergence lines 1415 UTC 16 April 2014.
|
|
|
|
credits:
Adapted from Barnes 2001
copyright terms:
COMET Standard Terms of Use
description:
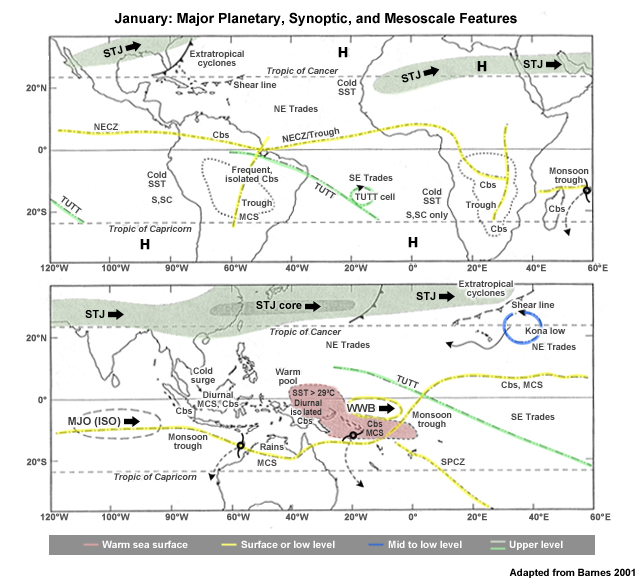
January: Major Planetary, Synoptic, and Mesoscale Features of the tropical atmosphere (adapted from Barnes 2001)
|
credits:
The COMET Program/NOAA
copyright terms:
COMET Standard Terms of Use
description:
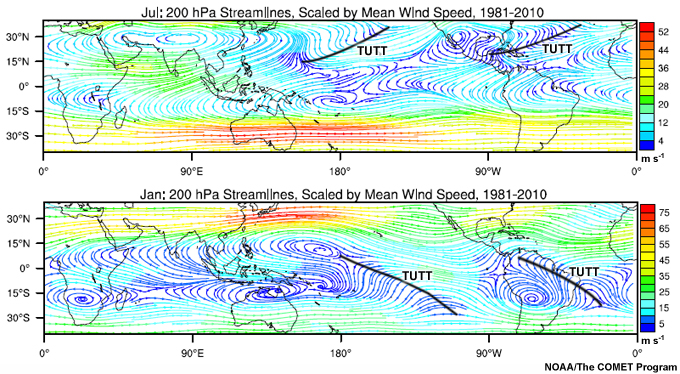
July and January mean 200 hPa streamlines and wind speed (m s-1) for 1981-2010. Thick black lines mark the TUTTs.
|
credits:
Adapted from Barnes 2001
copyright terms:
COMET Standard Terms of Use
description:
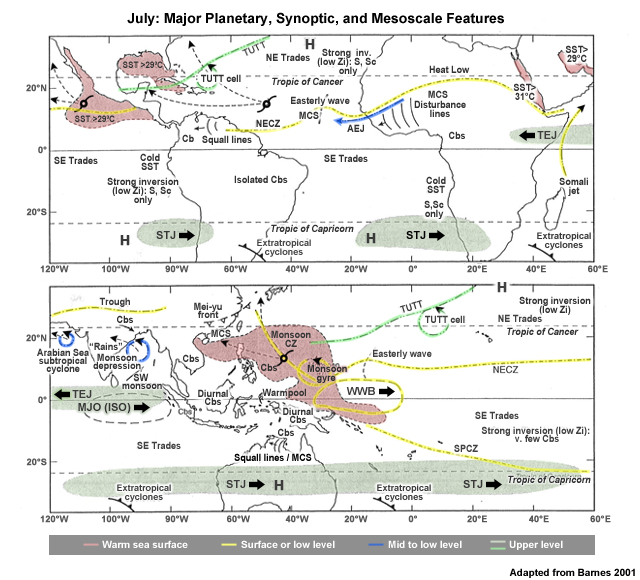
July: Major Planetary, Synoptic, and Mesoscale Features of the tropical atmosphere (adapted from Barnes 2001)
|
View animation
credits:
NOAA
copyright terms:
COMET Standard Terms of Use
description:
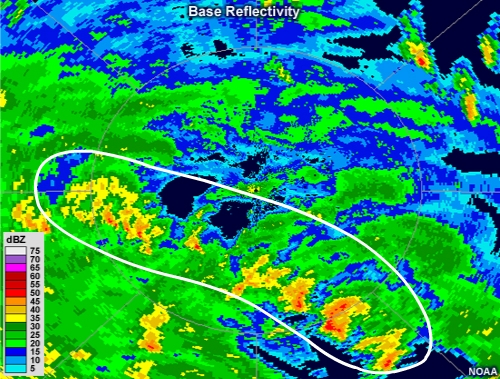
Radar reflectivity animation showing bands of intense precipitation spiraling couterclockwise about a ring of more intense precipitation with an echo-free region in its center. Several strong, discrete cells are embedded within the northernmost rainbands.
|
|
credits:
Adapted from Vinnichenko 1970
copyright terms:
COMET Standard Terms of Use
description:
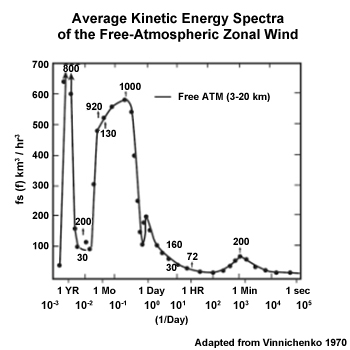
Average kinetic energy spectra (spectral density) of the free-atmospheric zonal wind as a function of frequency. The numbers are the maximum kinetic energy at particular periods. The synoptic scale near the maximum with a secondary peak at the mesoscale (After Vinnichenko (1970).
|
credits:
Morrison and Businger 2001
copyright terms:
COMET Standard Terms of Use
description:
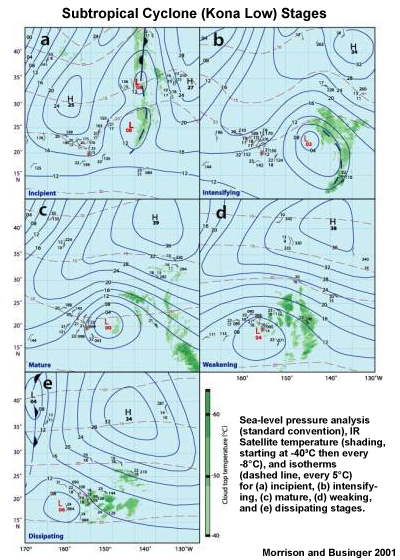
Surface analysis and thermal IR (shaded) associated with a subtropical cyclone over the north Pacific, 24-28 Feb 1997 (Morrison and Businger 2001)
|
credits:
Morrison and Businger 2001
copyright terms:
COMET Standard Terms of Use
description:
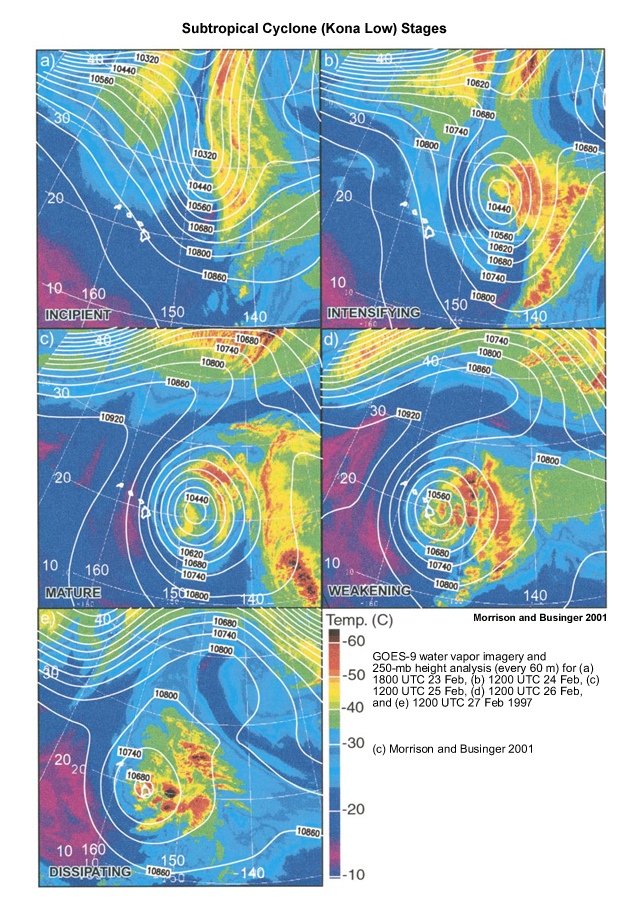
250-hPa height analysis and enhanced IR water vapor imagery associated with a subtropical cyclone over the north Pacific, 24-28 Feb 1997 (Morrison and Businger 2001)
|
credits:
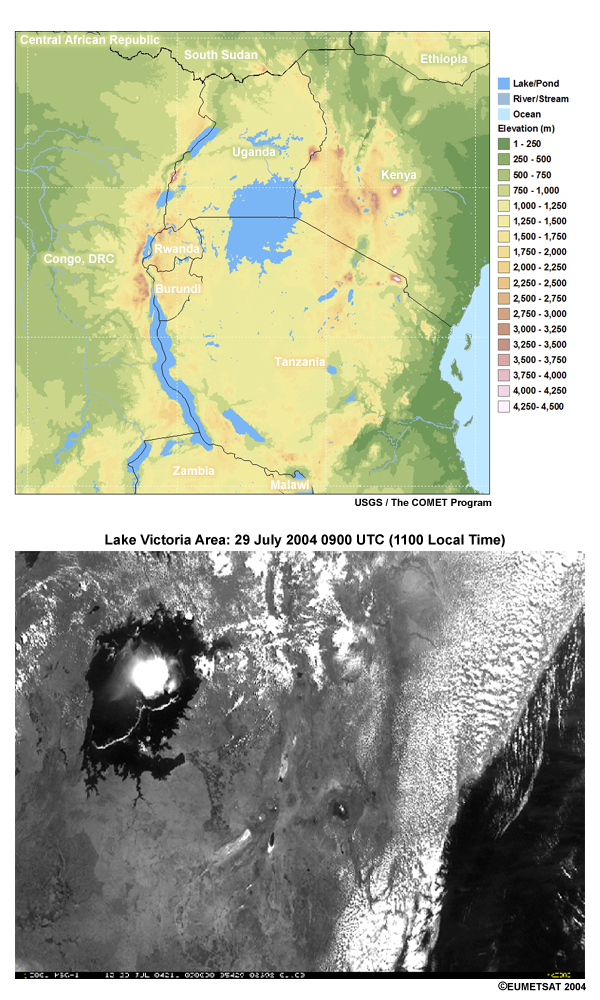
Left panel: USGS/The COMET Program, Right panel: ©EUMETSAT 2004
copyright terms:
COMET Standard Terms of Use
description:
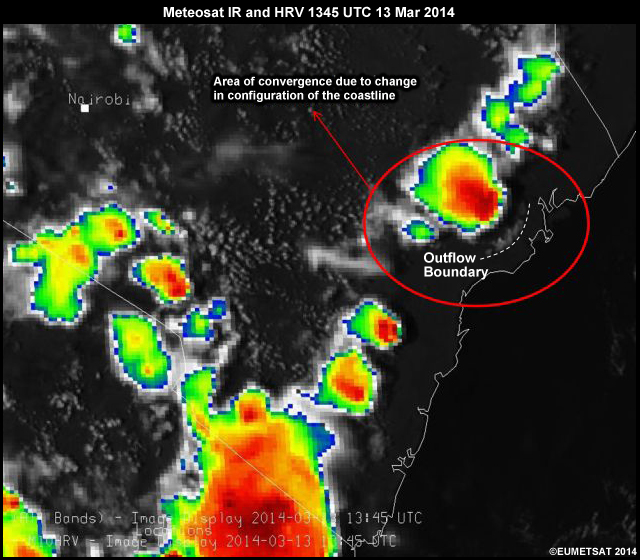
Digital elevation map of Lake Victoria and Rift Valley (left) and Meteosat Visible 0900 UTC 29 July 2004 showing thunderstorm, thunderstorm outflow, and mesoscale convergence lines generated by thermally-driven diurnal circulations.
|
credits:
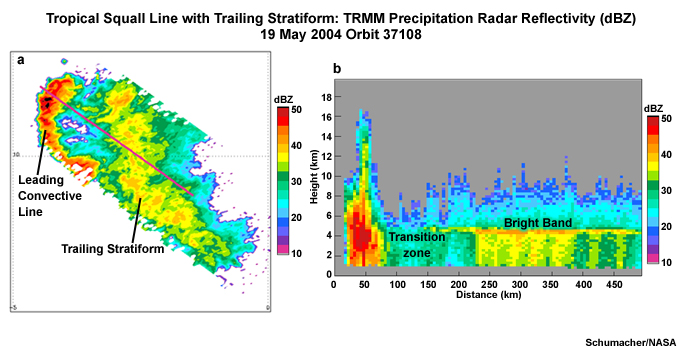
Schumacher/NASA
copyright terms:
COMET Standard Terms of Use
description:
TRMM Precipitation Radar reflectivity (a) horizontal slice and (b) vertical slice through a tropical squall line with leading line and trailing stratiform region, 19 May 2004 Orbit 37108 (courtesy of Courtney Schumacher)
|
credits:
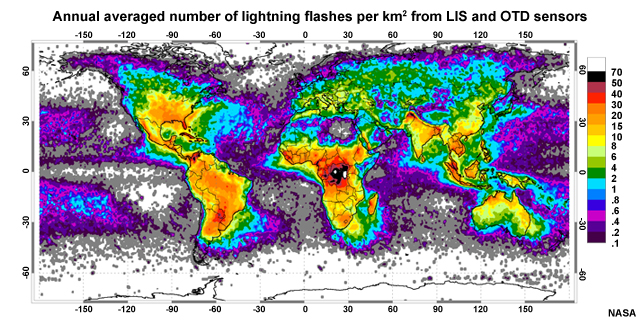
NASA
copyright terms:
COMET Standard Terms of Use
description:
Annual averaged number of lightning flashes per km2 from merged TRMM LIS and OTD gridded data, 1995-2003
|
credits:
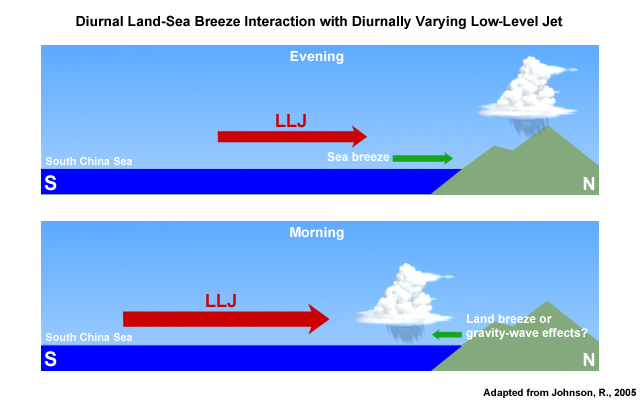
Adapted from Johnson, R., 2005
copyright terms:
COMET Standard Terms of Use
description:
Schematic of interaction of diurnally varying low-level jet and thermal land-sea local circulation in the North China Sea and southern mainland China.
|
credits:
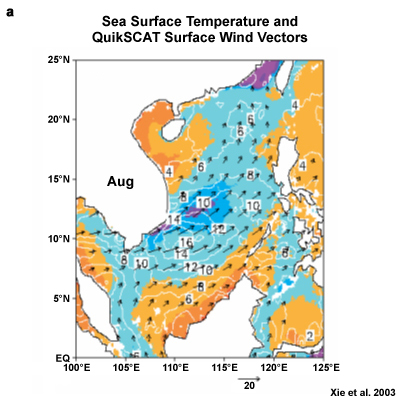
Xie et al. 2003
copyright terms:
COMET Standard Terms of Use
description:
Advanced Very High Resolution Radiometer (AVHRR) SST climatology (color shade in C), along with QuikSCAT surface wind vectors and magnitude (contours)
|
credits:
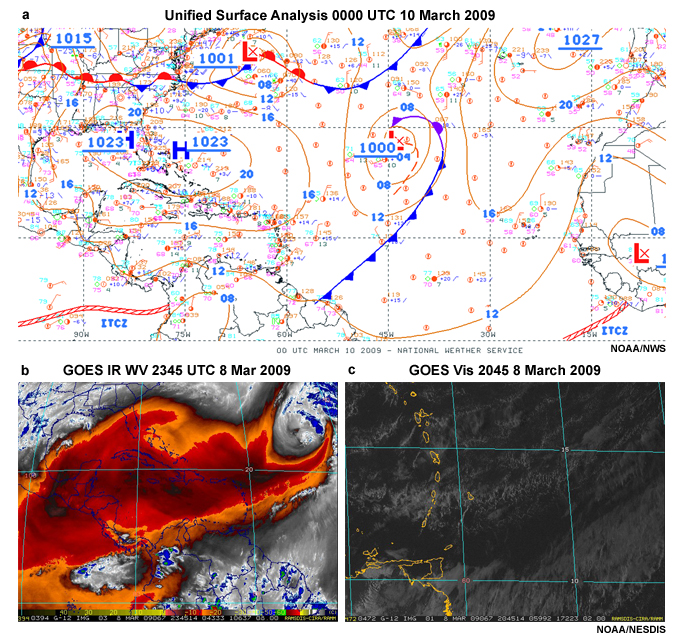
Panel (a), NOAA/NWS Panels (b,c), NOAA/NESDIS
copyright terms:
COMET Standard Terms of Use
description:
Unified surface analysis 0000 UTC 10 March 2009 and related (b) GOES enhanced IR water vapor image 2345 UTC 8 Mar 2009 (c) GOES visible image 2045 UTC 8 March 2009.
|
credits:
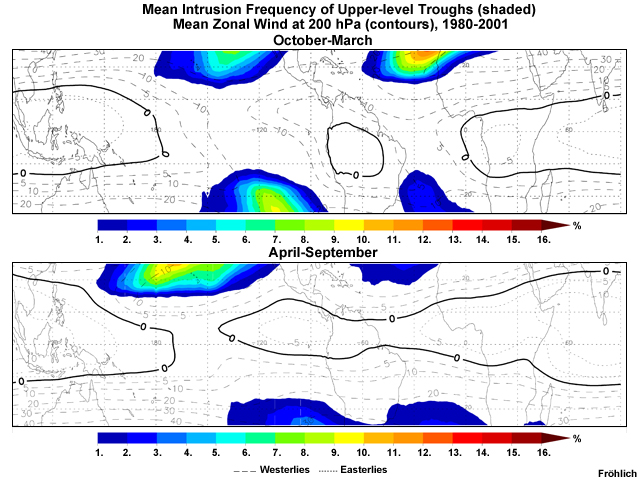
Fröhlich
copyright terms:
COMET Standard Terms of Use
description:
Upper level troughs at low latitude: Mean 400100-hPa PV intrusion frequency (shaded) and mean zonal wind at 200 hPa (m s-1) for OctoberMarch 19802001. (Adapted from Frolich and Knippertz 2008)
|
credits:
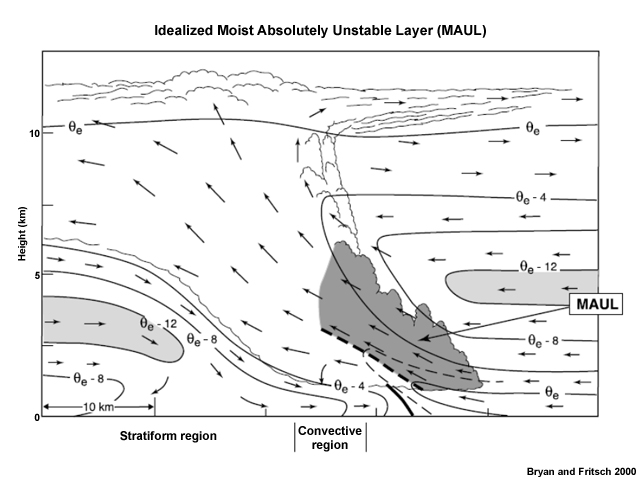
Bryan and Fritsch 2000
copyright terms:
COMET Standard Terms of Use
description:
Idealized cross section through slab convective overturning. Flow vectors are system-relative, scalloped lines indicate cloud boundaries, solid lines are ?e contours every 4 K (thin dashed line is an intermediate contour and heavy dashed line marks axis of highest values), heavy solid line indicates outflow boundary or frontal zone, light shading highlights midlevel layer of low ?e air, and dark shading depicts the MAUL. (Bryan and Fritsch 2000)
|
credits:
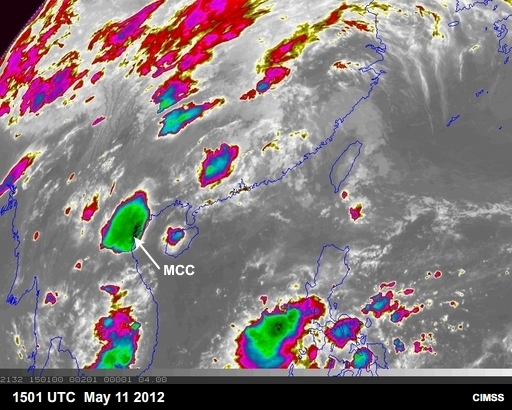
CIMSS
copyright terms:
COMET Standard Terms of Use
description:
MCC over along southeast Asia, along Mei-Yu front, as seen from infrared satellite imagery on 11 May 2012.
|
credits:
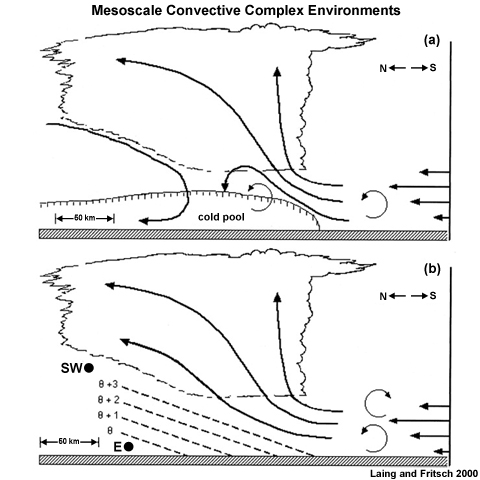
Laing and Fritsch 2000
copyright terms:
COMET Standard Terms of Use
description:
Schematic cross-section of MCC environments: (a) Cold pool forms in the warm sector. The circulation induced by the cold pool combines with the circulation associated with the shear to tilt the system downstream and downshear (northward). (If the shear-induced circulation is of the opposite sign, the cold pool circulation overwhelms the shear and tilts upshear, northward, over the cold pool.) (b) Low-level jet overruns a frontal zone. (Laing and Fritsch 2000)
|
credits:
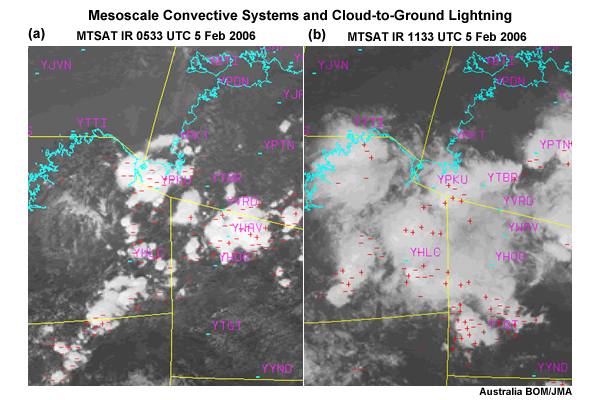
Australia BOM/JMA
copyright terms:
COMET Standard Terms of Use
description:
MTSAT IR images and lightning flashes associated with squall lines over northwest Australia on 5 Feb 2005. at (a) 0533 UTC, mostly convective stage with predominantly negative flashes and (b) 1133 UTC, mostly stratiform precipitation period with predominantly positive flashes.
|
View animation
credits:
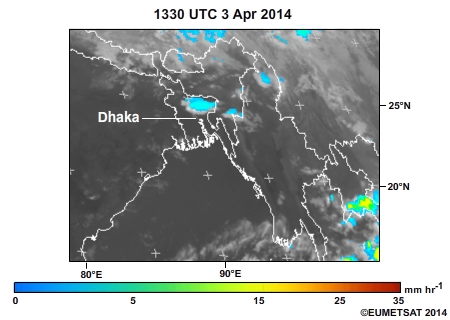
©EUMETSAT 2014
copyright terms:
COMET Standard Terms of Use
description:
Meteosat MPE (satellite estimated precipitation rate) for 1330 UTC 3 Apr - 0130 UTC 4 Apr 2014 showing mesoscale convective systems that produced heavy rain, hail, gusty winds and prematurely ended the 2014 International Cricket Council (ICC) World Twenty-20 semifinals between the West Indies and Sri Lanka.
|
![(left) Schematic of heating processes in MCS (Houze 2004); (right) idealized mature MCS and non-dimensional heating rate profiles for convective and stratiform areas of the MCS. (Johnson 1986)
[left panel from Houze, R. A. Jr. (2004), Mesoscale convective systems, Rev. Geophys., 42, RG4003, doi:10.1029/2004RG000150. Copyright 2004 American Geophysical Union. Reproduced with permission of American Geophysical Union]
[right panel from Johnson, R. H. (1986) Implications of lower tropospheric warming and drying in tropical mesoscale convective systems for the problem of cumulus parameterization. J. Meteorol. Soc. Japan, 64, 721-726. Reproduced with permission of R.H. Johnson]](media/graphics/mcs_heating_rates.jpg)
credits:
(a) Houze 2004 (b,c) Johnson 1986
copyright terms:
COMET Standard Terms of Use
description:
(left) Schematic of heating processes in MCS (Houze 2004); (right) idealized mature MCS and non-dimensional heating rate profiles for convective and stratiform areas of the MCS. (Johnson 1986)
[left panel from Houze, R. A. Jr. (2004), Mesoscale convective systems, Rev. Geophys., 42, RG4003, doi:10.1029/2004RG000150. Copyright 2004 American Geophysical Union. Reproduced with permission of American Geophysical Union]
[right panel from Johnson, R. H. (1986) Implications of lower tropospheric warming and drying in tropical mesoscale convective systems for the problem of cumulus parameterization. J. Meteorol. Soc. Japan, 64, 721-726. Reproduced with permission of R.H. Johnson]
|

credits:
Laing et al. 2011
copyright terms:
COMET Standard Terms of Use
description:
(a)(g) Enhanced IR images for 612 Apr 2002; (h) theoretical equatorially trapped Kelvin wave circulation at 200 hPa; (i) Hovmöller of Tb < 233-K frequency (solid contours >10%, gray shade >21%) overlaid on 200-hPa zonal wind anomaly (orange shades are easterly, turquoise shades are westerly) and Kelvin waves filtered from daily OLR anomaly (negative is dashed black, positive is solid black at 20 W m?2 intervals). (h) Adapted from Wheeler et al. (2000) with shading (hatching) for divergence (convergence). Unshaded contours are geopotential, negative contours are dashed, and the 0 contour is omitted. The largest wind vector is 2.3 units. Dimensional scales are as in Matsuno (1966). Average elevation (m) is below the Hovmöller diagram in (i). Averages are taken between 7.5°S and 7.5°N.
|
credits:
Adapted from Houze et al. 1989/The COMET Program
copyright terms:
COMET Standard Terms of Use
description:
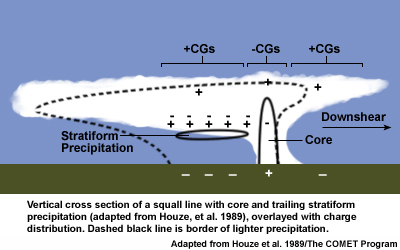
Schematic of flash distribution in a squall line with leading line and trailing stratiform precipitation
|
credits:
Nesbitt et al. 2006
copyright terms:
COMET Standard Terms of Use
description:
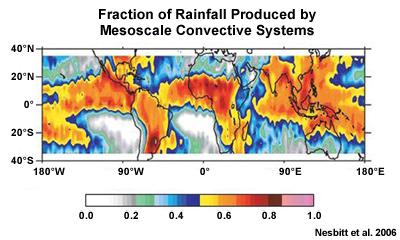
Fraction of rainfall produced by mesoscale convective systems (Adapted from Nesbitt et al. 2006)
|
credits:
Zipser 1977
copyright terms:
COMET Standard Terms of Use
description:
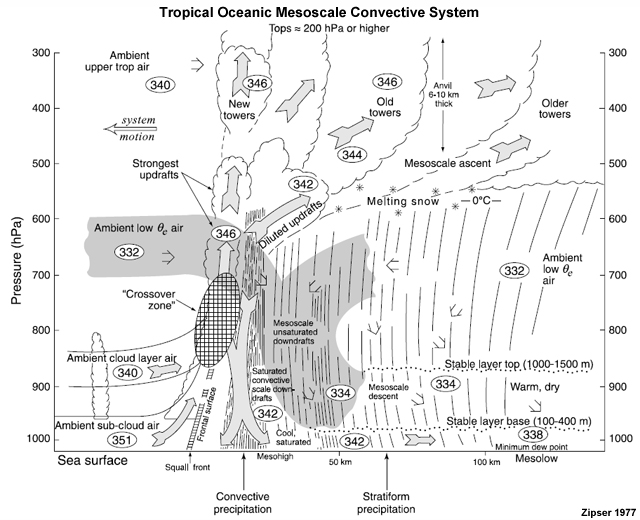
Idealized tropical oceanic MCS with leading-line/trailing stratiform structure. Air from the mixed layer (sub-cloud) rises to form the convective updrafts. Convective downdrafts result when these updraft parcels loses their buoyancy and sink to the surface with convective precipitation. A broad layer of mesoscale ascent slopes backward over an area of mesoscale unsaturated downdrafts (Zipser 1977).
|
View animation
credits:
CIMSS
copyright terms:
COMET Standard Terms of Use
description:
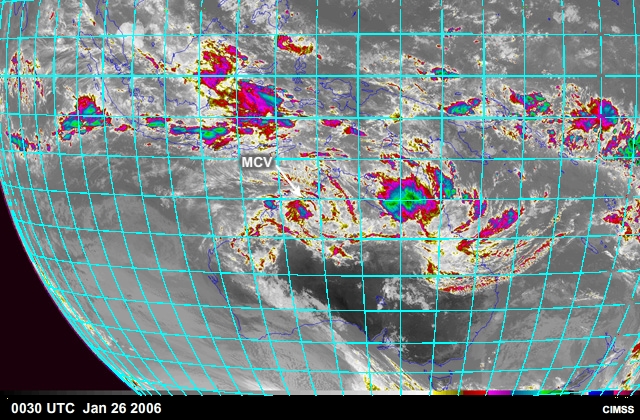
Mesoscale Convective Systems and Vortex as seen from enhanced infrared satellite imagery over Australia 26-29 January 2006.
|
credits:
Fritsch et al. 1994
copyright terms:
COMET Standard Terms of Use
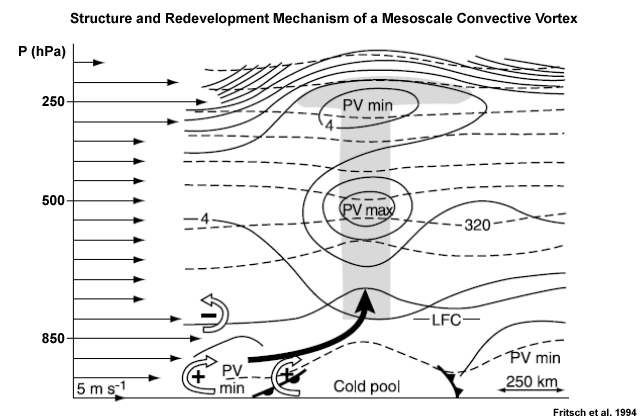
description:
Conceptual diagram of the structure and redevelopment mechanism of a mesoscale warm core vortex associated with an MCS. Thin arrows along the ordinate indicate the vertical profile of the environmental wind. Open arrows with plus or minus signs indicate the sense of the vorticity component perpendicular to the plane of the cross section produced by the cold pool and by the environmental vertical wind shear. The bold solid arrow indicates the updraft axis created by the vorticity distribution. Frontal symbols indicate outflow boundaries. Dashed lines are potential temperature (5 K intervals), and solid lines are potential vorticity. The system is propagating left to right at about 58 m/s and is being overtaken by air of high equivalent potential temperature in the low level jet. Air overtaking the vortex ascends isentropic surfaces, reaches its level of free convection (LFC), and thereby initiates deep convection. Shading indicates cloud. (Fritsch et al. 1994)
|
credits:
Johnson and Bartels 1992
copyright terms:
COMET Standard Terms of Use
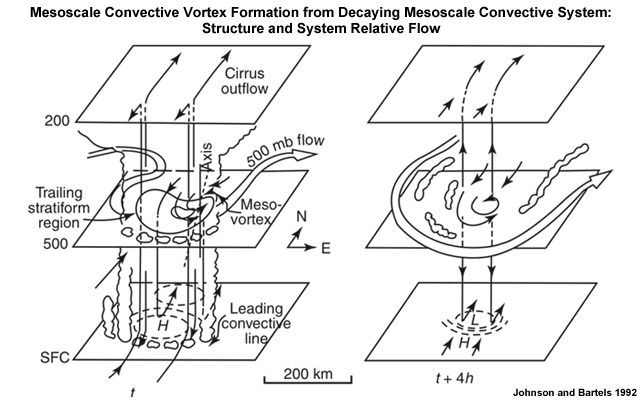
description:
Idealized cloud and system-relative flow structure during decaying squall line stage (t) and fully developed mesovortex stage (t + 4h). Solid arrows denote storm-relative flow and open arrows denote large-scale 500 hPA flow. The dotted line indicates approximate vertical extent and tilt (towards the north-east) of the mesovortex core (Johnson and Bartels 1992)
|
credits:
© The COMET Program
copyright terms:
COMET Standard Terms of Use
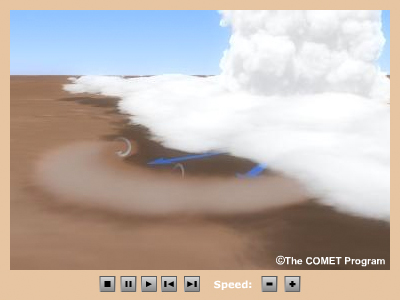
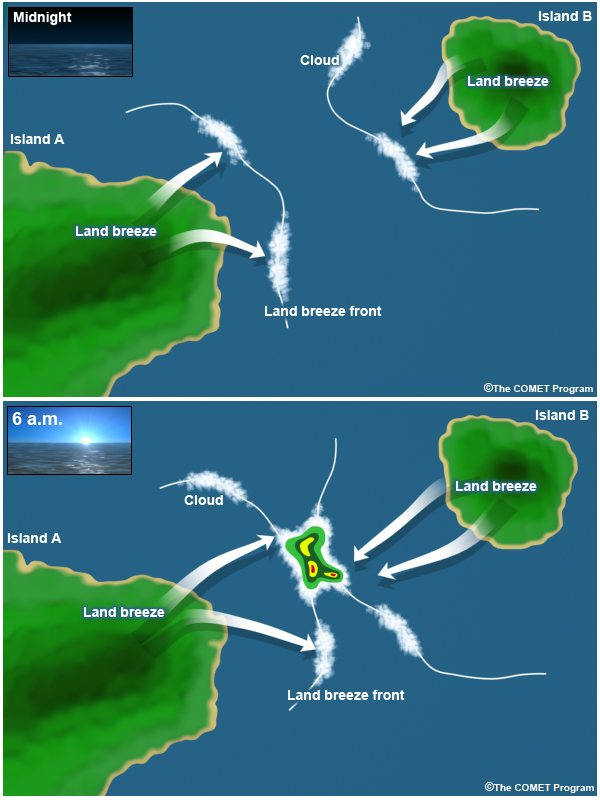
description:
Schematic of land breezes from tropical islands interacting, pre-intersection of land breeze boundaries at about midnight and noon local time.
|
credits:
© EUMETSAT 2012
copyright terms:
COMET Standard Terms of Use
description:
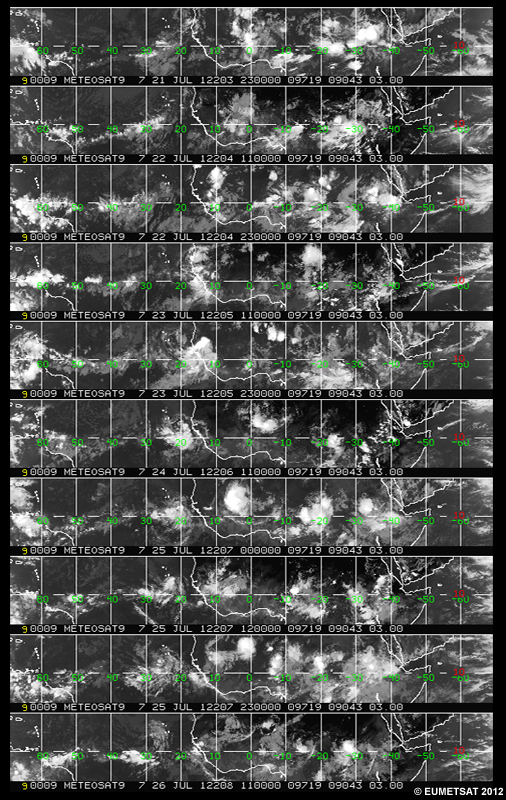
Hovmoller of Meteosat 9 IR images over tropical Africa and Atlantic, from 2300 UTC 21 Jul to 1100 UTC 13 Sep 2006
|
credits:
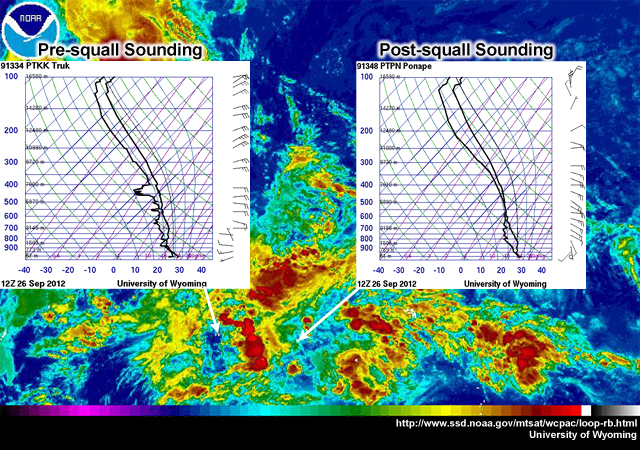
University of Wyoming
copyright terms:
COMET Standard Terms of Use
description:
Soundings from before and after passage of a mesoscale convective system.
|
view/save .mp4 file
credits:
1st layer- Adames et al. 2014/The COMET Program; 2nd- Lin et al. 2006; 3rd- The COMET Program; 4th- Adapted from Zhang 2014
copyright terms:
COMET Standard Terms of Use
description:
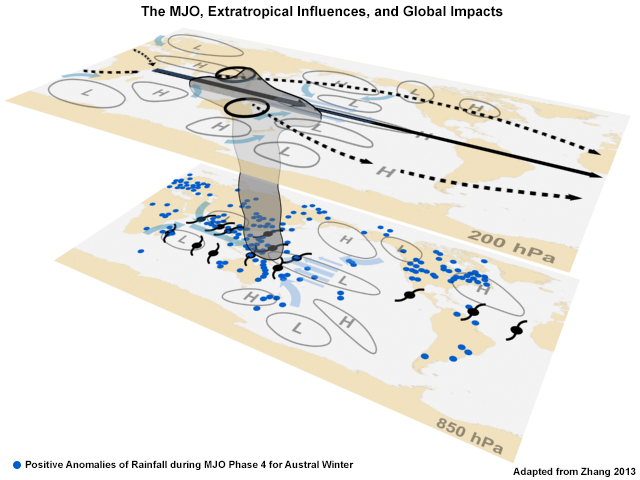
MJO and Tropical Circulations interacting with extratropical waves and the generation of Rossby wave trains, impacts on tropical cyclone activity, and anomalously high precipitation.
|

credits:
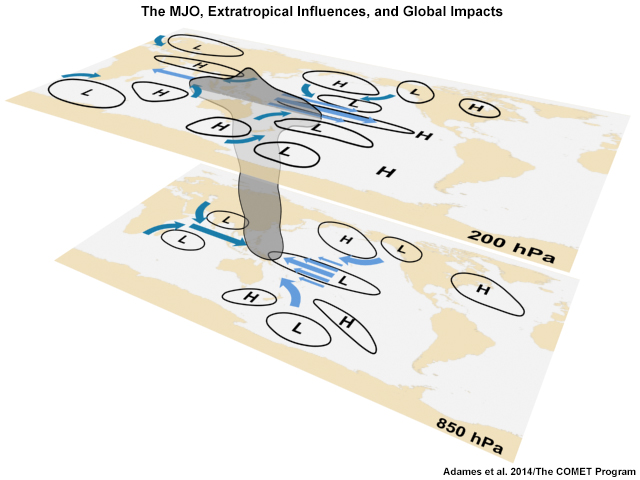
Adames et al. 2014/The COMET Program
copyright terms:
COMET Standard Terms of Use
description:
MJO and Tropical Circulations interacting with Extratropical Waves
|
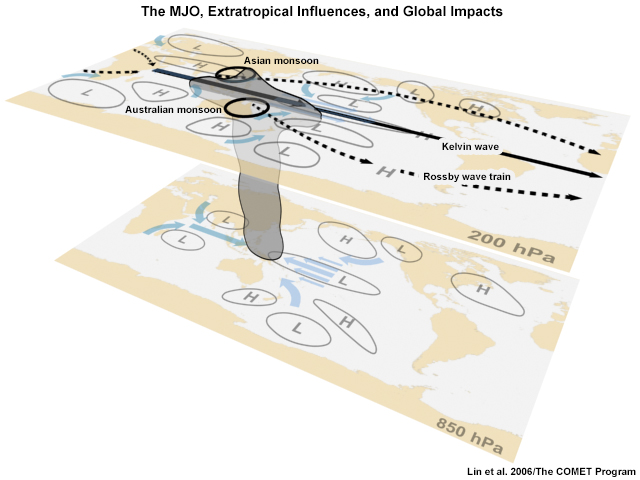
credits:
Lin et al. 2006/The COMET Program
copyright terms:
COMET Standard Terms of Use
description:
MJO and Tropical Circulations interacting with Extratropical Waves
|
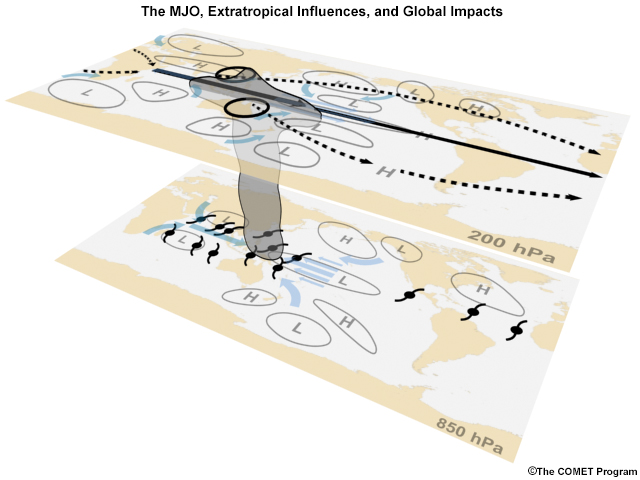
credits:
The COMET Program
copyright terms:
COMET Standard Terms of Use
description:
MJO and Tropical Circulations interacting with Extratropical Waves
|
credits:
Adapted from Zhang 2013
copyright terms:
COMET Standard Terms of Use
description:
MJO and Tropical Circulations interacting with Extratropical Waves
|
credits:
Chen et al. 2005
copyright terms:
COMET Standard Terms of Use
description:
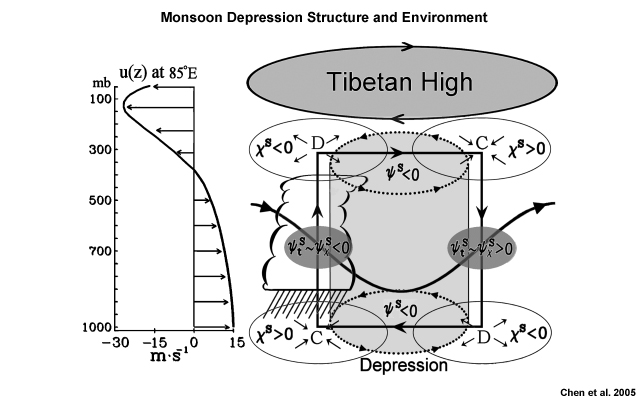
Schematic depicting the westward propagation mechanism of a monsoon depression embedded in the lower-tropospheric monsoon westerlies (indicated by the left diagram) and overlaid by the Tibetan high (the elliptic stippled area at the top of the right diagram). The combination of the depression and monsoon westerlies is portrayed by the thick sinusoidal streamline. The eastwest asymmetric circulation of the depression is denoted by solid lines with shafts encircling this depression, which is represented by the stippled cylinder. The divergent circulation coupled with the eastwest circulation is denoted by thin-line circles centered at Ds and Cs at the upper and lower levels. Cumulus convection/rainfall west of the depression center is coincident with the upward branch of the eastwest circulation. (From Chen et al. 2005).
|
credits:
Yoon and Huang 2012
copyright terms:
COMET Standard Terms of Use
description:
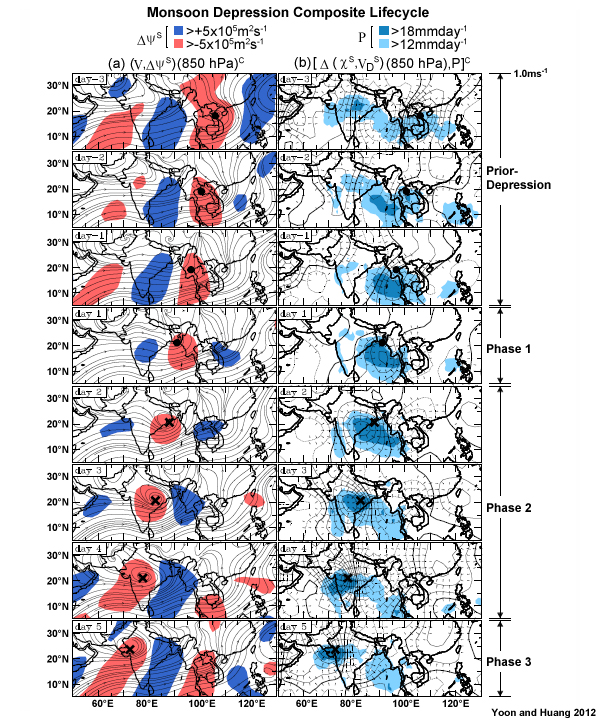
Composite of monsoon depressions from 19792002 for 7-day lifecycle (2 days before the depression and 5 days after formation, using (a) wind at 850hPa superimposed with departures of the short-wave stream function at 850hPa, where represents the depression and (b) composite 850-mb velocity potential and divergent wind departures in the short-wave regime superimposed with precipitation. (From Yoon and Huang 2012)
|
credits:
Yoon and Huang 2012
copyright terms:
COMET Standard Terms of Use
description:
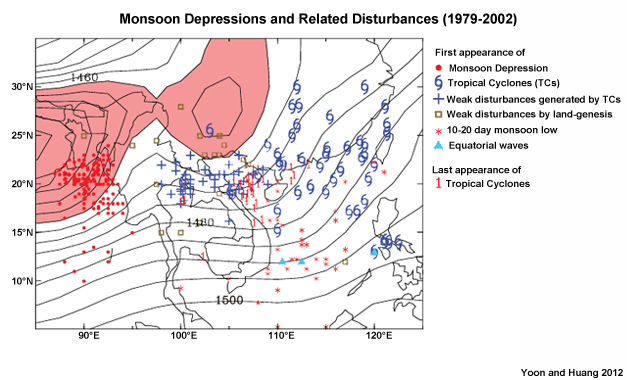
Location of first appearance of monsoon depressions in the Bay of Bengal and related weather disturbances during 1979-2002. 1) first appearances of monsoon depressions (red dot) in the Bay of Bengal; 2) first appearances of weak disturbances generated in association with tropical cyclones (open tropical cyclone symbol) and by land genesis (marked by symbols + and ?, respectively) over Indochina; and 3) last appearances of tropical cyclones (symbol 1), 1224 day monsoon lows (symbol *), and equatorial waves (symbol ?) in the south China Sea. (From Yoon and Huang 2012)
|
View animation
credits:
©EUMETSAT 2004
copyright terms:
COMET Standard Terms of Use
description:
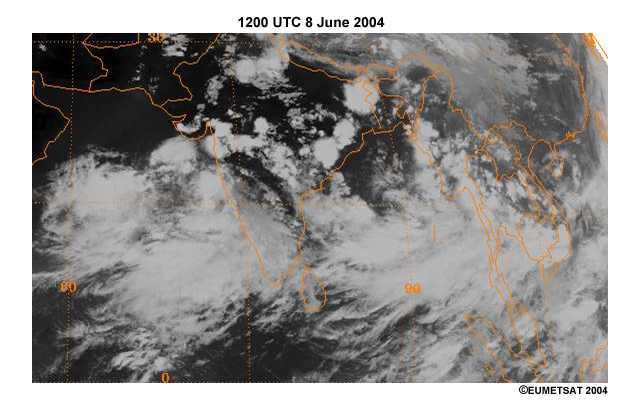
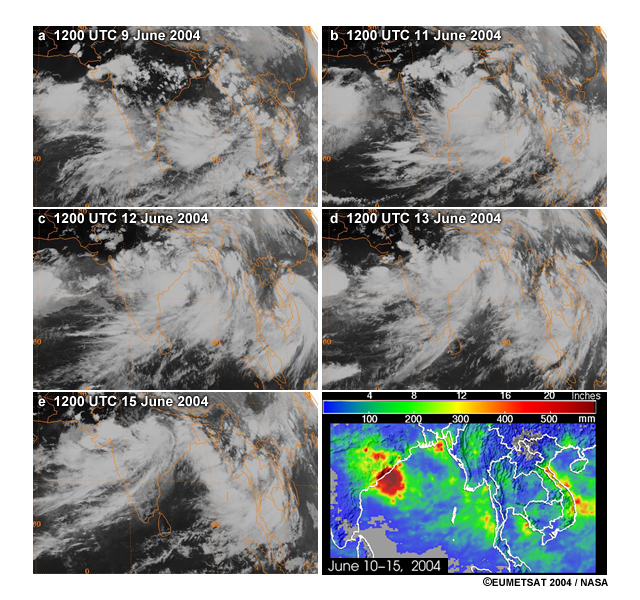
(a-d) Meteosat IR images of a monsoon depression that moved from the Bay of Bengal westward across India, 9-15 Jun 2004. (e) Radar estimates of rain from 10-15 June 2004 measured by the NASA Tropical Rainfall Measurement Mission (TRMM).
|
credits:
©EUMETSAT 2004 / NASA
copyright terms:
COMET Standard Terms of Use
description:
(a-3) Meteosat IR images of a monsoon depression that moved from the Bay of Bengal westward across India, 9-15 Jun 2004. (f) Radar estimates of rain from 10-15 June 2004 measured by the NASA Tropical Rainfall Measurement Mission (TRMM).
|
credits:
© The COMET Program
copyright terms:
COMET Standard Terms of Use
description:
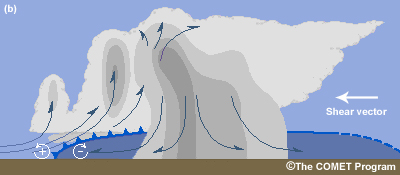
Schematic of multicellular thunderstorm in easterly shear
|
credits:
http://www.srh.noaa.gov/jetstream/tstorms/tstrmtypes.htm
copyright terms:
COMET Standard Terms of Use
description:
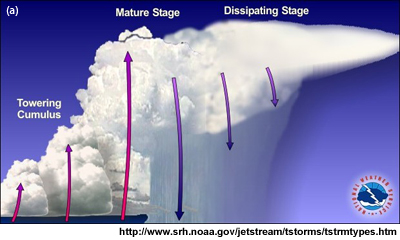
Schematic of multicellular thunderstorm
|
credits:
USGS/ The COMET Program
copyright terms:
COMET Standard Terms of Use
description:
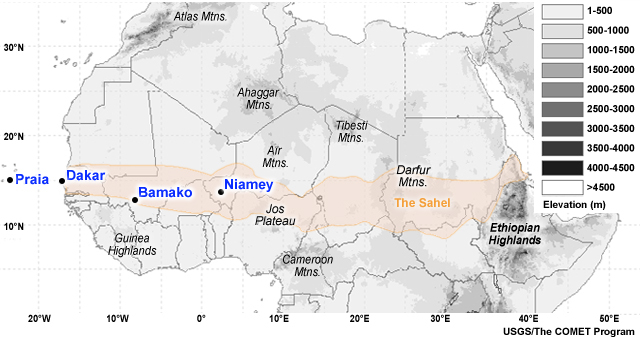
Map of north Africa elevation (m, shaded) showing locations of Cape Verde, Dakar, Bamako, and Niamey. Shaded area marks the Sahel.
|
credits:
Adapted from Houze et al., 1981, Amer. Met. Soc.
copyright terms:
COMET Standard Terms of Use
description:
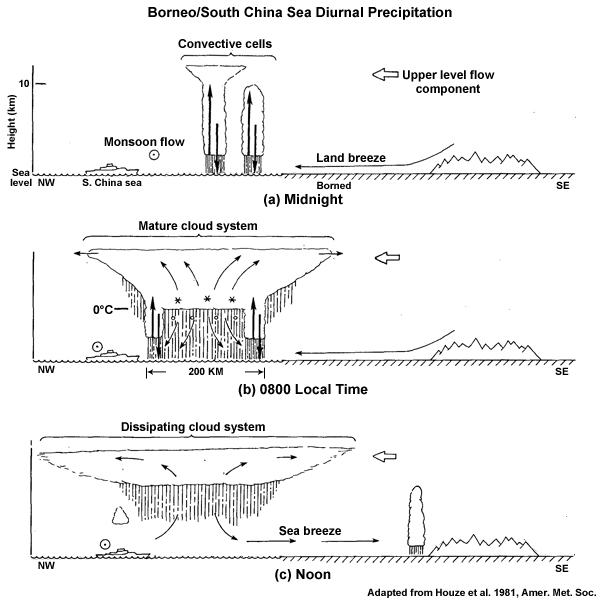
Schematic of the development of diurnal convection off the coast of Borneo during the winter monsoon (from Houze et al., 1981). Large scale upper level flow depicted by open arrow, monsoon flow by dot enclosed by circle coming out of the page, thin arrows denote local circulations.
|
credits:
Adapted from Houze et al., 1981, Amer. Met. Soc.
copyright terms:
COMET Standard Terms of Use
description:
Schematic of the development of diurnal convection off the coast of Borneo during the winter monsoon (from Houze et al., 1981). Large scale upper level flow depicted by open arrow, monsoon flow by dot enclosed by circle coming out of the page, thin arrows denote local circulations.
|
credits:
Wakimoto and Wilson 1989 / The COMET Program
copyright terms:
COMET Standard Terms of Use
description:
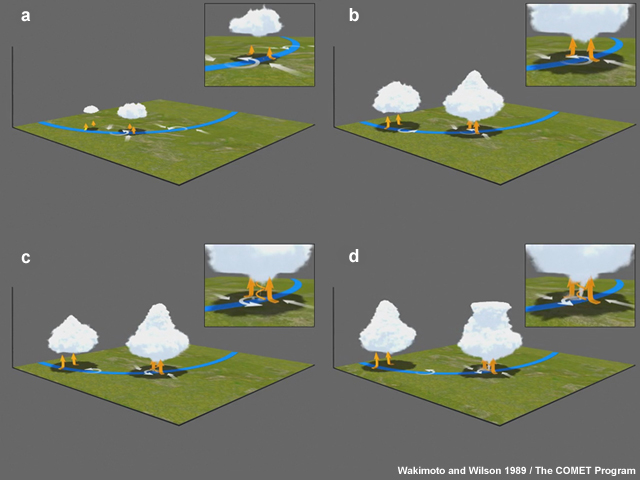
Conceptual model of the formation of non-supercell tornado (adapted from Wakimoto and Wilson 1989).
|
view/save .mp4 file
credits:
Wakimoto and Wilson 1989 / The COMET Program
copyright terms:
COMET Standard Terms of Use
description:
Conceptual animation of the formation of non-supercell tornado (adapted from Wakimoto and Wilson 1989).
|
|
credits:
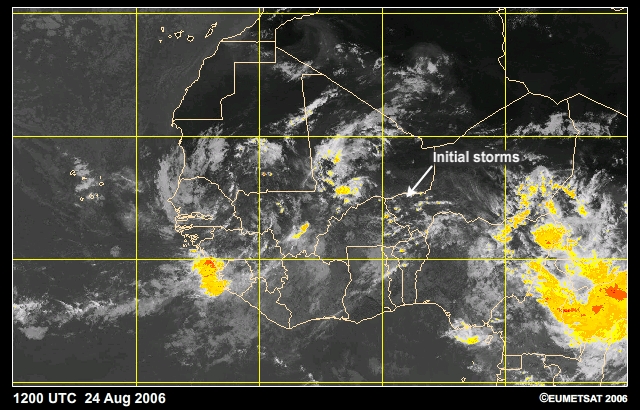
Radar image: Nieto-Ferreira et al. 2009, satellite image: ©EUMETSAT 2006
copyright terms:
COMET Standard Terms of Use
description:
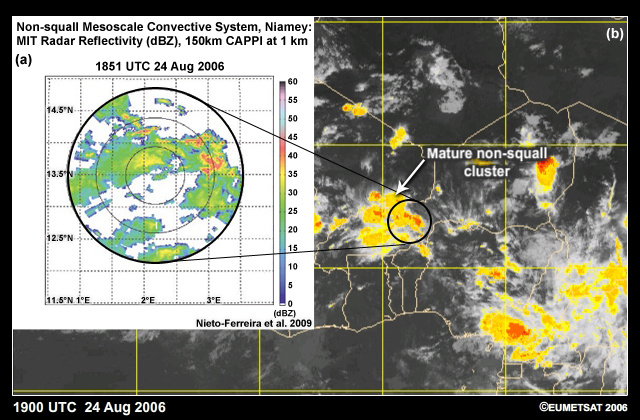
Non-squall mesoscale convective system over Niamey, West Africa: MIT Radar Reflectivity and enhanced Meteosat IR imagery on 24 Aug 2006
|
credits:
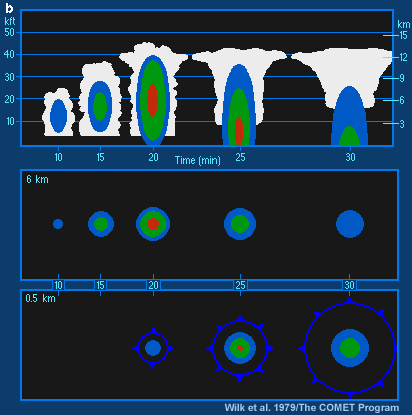
Wilk et al. 1979/ The COMET Program
copyright terms:
COMET Standard Terms of Use
description:
radar structure of a single cell thunderstorm as it evolves with time. (Top) An RHI presentation of radar echoes together with a schematic of the cloud. (Bottom) Two constant altitude PPI (CAPPI) displays at 6km (middle) and 0.5km (bottom), with the edge of the spreading cold pool indicated by the spiked blue circles.
|
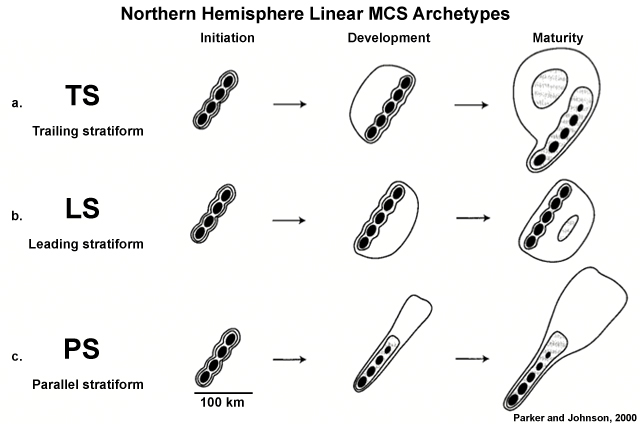
credits:
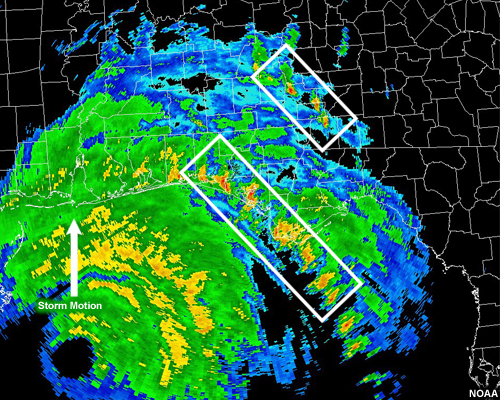
Parker and Johnson 2000
copyright terms:
COMET Standard Terms of Use
description:
Three archetypes of northern hemisphere mid-latitude squall iines showing the differences in stratiform cloud shield.
|
credits:
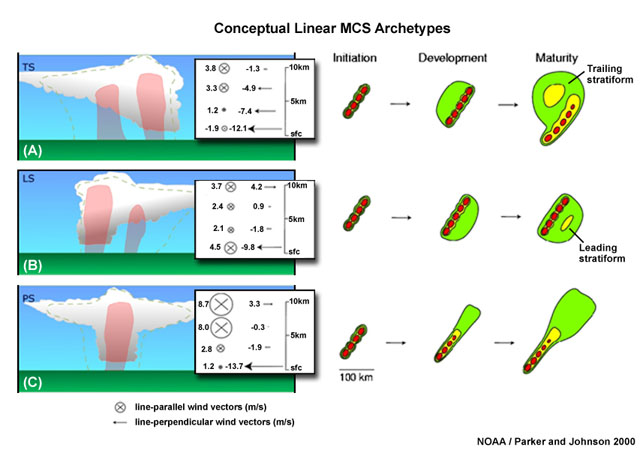
NOAA/Parker and Johnson 2000
copyright terms:
COMET Standard Terms of Use
description:
Linear mesoscale convective system archetypes (trailing, leading, and parallel stratiform) and associated vertical wind shear (from Parker and Johnson 2000 and NOAA/NWS, respectively)
|
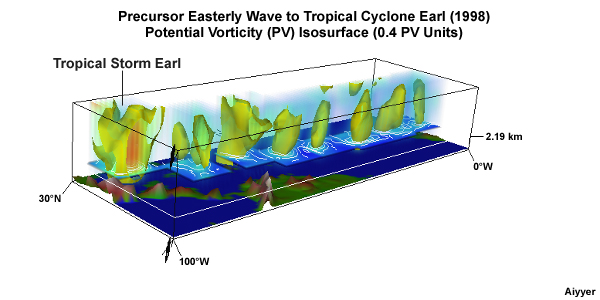
credits:
Aiyyer
copyright terms:
COMET Standard Terms of Use
description:
Montage of the precursor to Tropical Cyclone Earl (1998), shown roughly every two days as it marches across the Atlantic from the coast of North Africa to the Gulf of Mexico. The 0.4 Potential Vorticity Unit (PVU) isosurface is shown in the shaded colors.
|
credits:
Riehl 1945
copyright terms:
COMET Standard Terms of Use
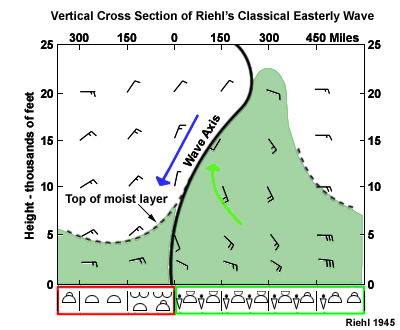
description:
Schematic of Riehl's Classical Easterly Wave: Time-height plot of winds, moist layer, and surface weather conditions that accompany the passage of an easterly wave over the Caribbean.
|
credits:
Kiladis and Weickmann 1997
copyright terms:
COMET Standard Terms of Use
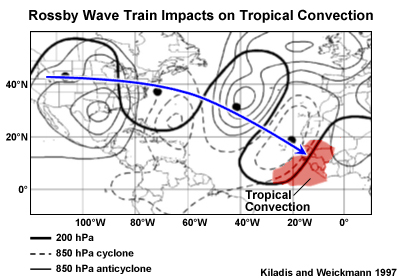
description:
Vertical structure of wave trains related to a -1 standard deviation in OLR in the westerly duct regions: (a) Eastern Atlantic (base region 0N10N, 20W10W) black lines schematically depict upper-level wave trains based on 200 hPa streamfunction and wind anomalies; filled circles indicate the respective local maxima and minima. Thin contours show 850 hPa streamfunction, with the zero contour omitted. The shading outlines regions of OLR anomaly less than -10 Wm^2. All data were 630-days bandpass-filtered. Data basis are the NCEP operational analyses DecFeb 1984/19851992/1993 Kiladis and Weickmann (1997).
|
credits:
Roundy and Frank 2004
copyright terms:
COMET Standard Terms of Use
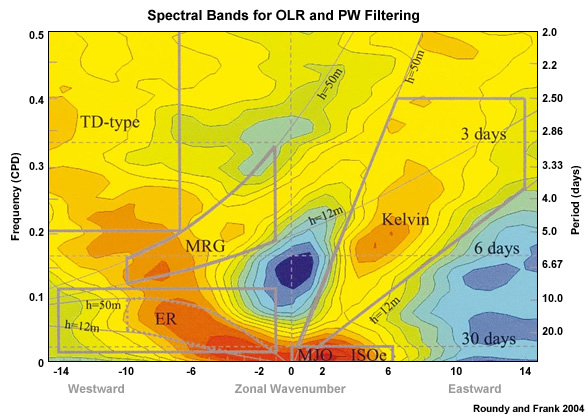
description:
Wavenumber-frequency diagram illustrating the spectral bands used to filter OLR data to identify real-world equatorial waves. The solid lines indicate the filters imposed by Roundy and Frank, while the dotted lines define the filter boundaries imposed by Wheeler and Kiladis.
|
View animation
credits:
© EUMETSAT 2001
copyright terms:
COMET Standard Terms of Use
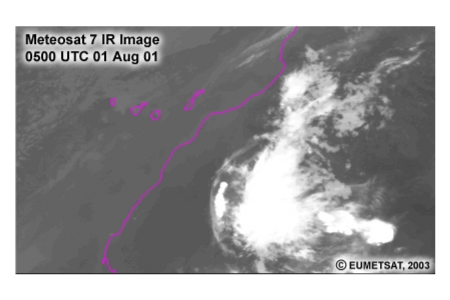
description:
Meteosat 7 IR/VIS image loop showing a haboob in the western Sahara Desert that eventually moves offshore as far as the Canary Islands
|
credits:
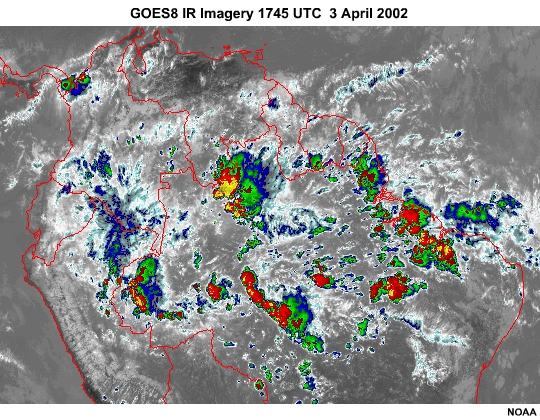
NOAA
copyright terms:
COMET Standard Terms of Use
description:
GOES8 IR Imagery of westward moving squall lines in northern South America.
|
|
|
credits:
NOAA
copyright terms:
COMET Standard Terms of Use
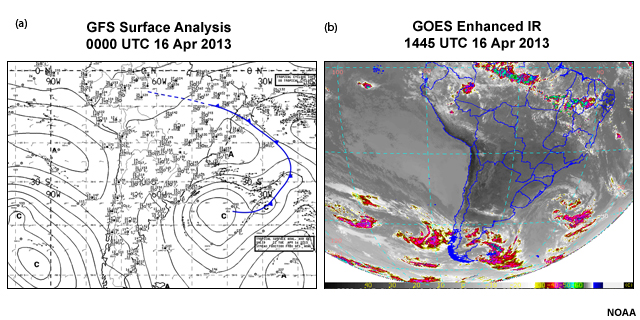
description:
(a) GFS surface analysis at 0000 UTC 16 Apr 2013 (b) Enhanced GOES IR image at 1445 UTC 16 Apr 2013
|
|
credits:
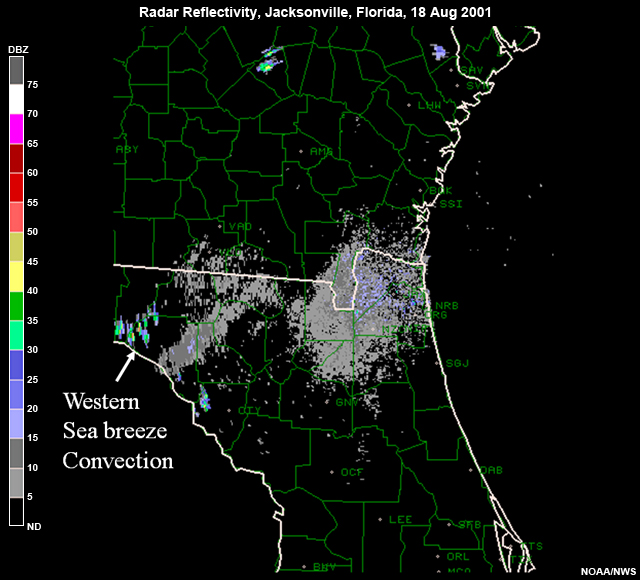
Radar image credit is NOAA/NWS, Photograph credit is Arlene Laing
copyright terms:
COMET Standard Terms of Use
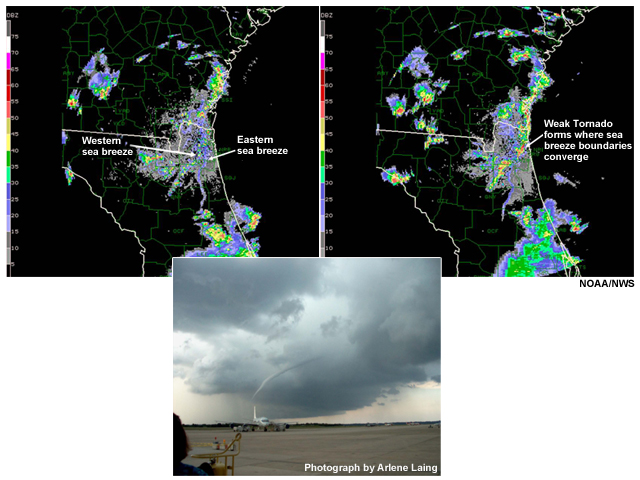
description:
Radar images of convergence between western and eastern Florida sea breezes and photograph of associated tornado touching down in Jacksonville, Florida, 18 Aug 2001
|
credits:
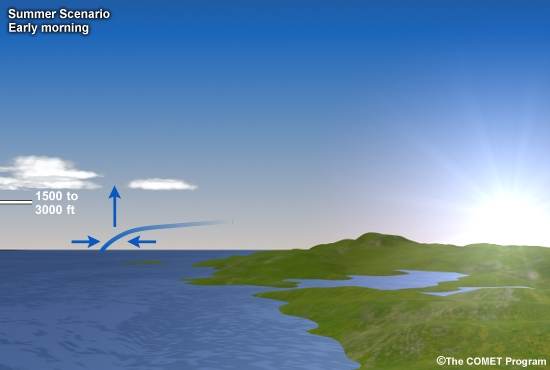
The COMET Program
copyright terms:
COMET Standard Terms of Use
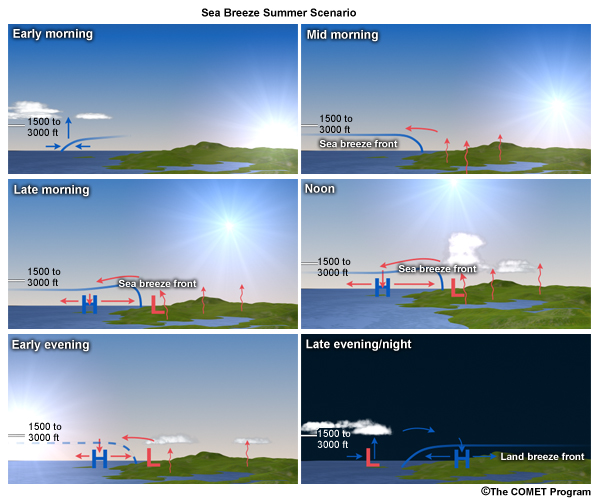
description:
6-panel graphic showing sea breeze formation throughout the day
|
credits:
©EUMETSAT 2014
copyright terms:
COMET Standard Terms of Use
description:
Enhanced Meteosat IR images of sea-breeze thunderstorms along the coast of Kenya
|
credits:
WMO 2005
copyright terms:
COMET Standard Terms of Use
description:
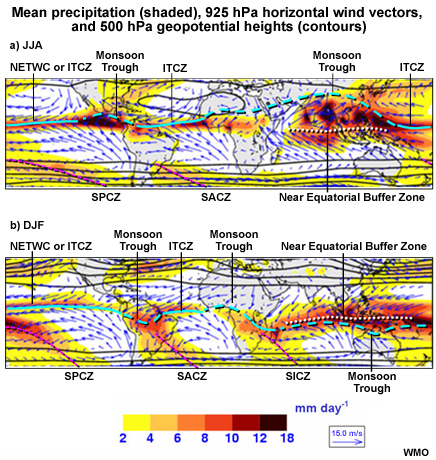
Mean precipitation (shaded), 925 hPa horizontal wind vectors, and 500 hPa geopotential heights (contours) for (a) June-August and (b) December-February. Major large-scale confluence and convergence zones of the tropics and subtropics are labeled.
|

credits:
NOAA/NWS/ The COMET Program (lower panel) and NOAA/NCEP (for upper panel)
copyright terms:
COMET Standard Terms of Use
description:
Two layers showing, respectively, the 250 hPa heights and winds and the corresponding surface analysis. The green arrow represents rising motion that is induced by the upper-level divergence.
|
credits:
NOAA/NWS
copyright terms:
COMET Standard Terms of Use
description:
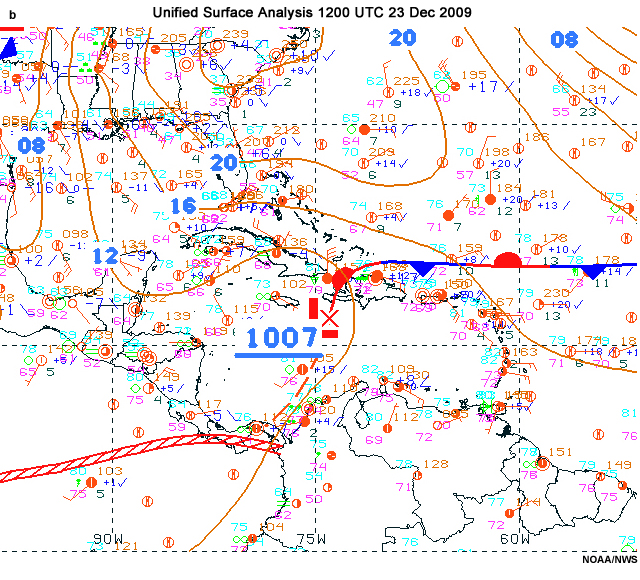
Unified Surface Analysis for the Caribbean and Tropical Atlantic for 1200 UTC 23 December 2009 (from US National Weather Service)
|
credits:
University of Wyoming
copyright terms:
COMET Standard Terms of Use
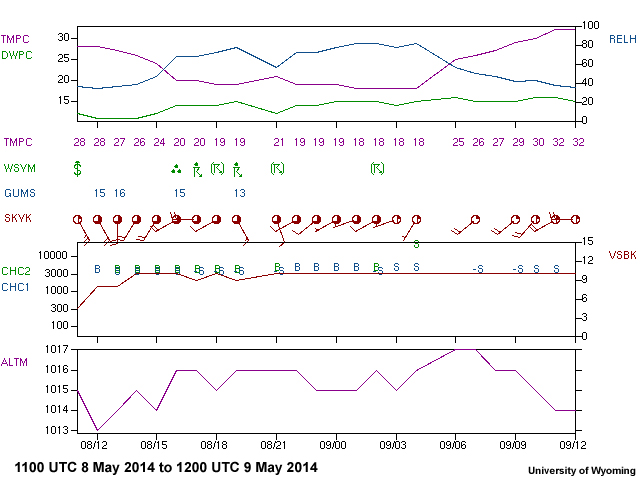
description:
Meteogram for OEBA, Al Baha, Saudi Arabia, 1100 UTC 8 May - 1200 UTC 9 May 2014
|
credits:
University of Wyoming
copyright terms:
COMET Standard Terms of Use
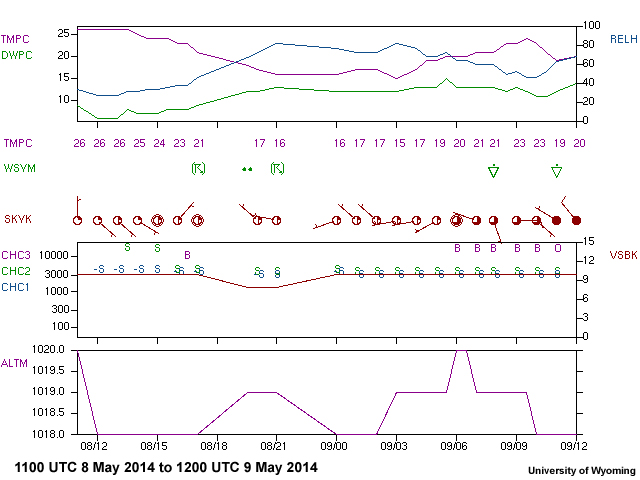
description:
Meteogram for OEHL, Hail, Saudi Arabia, 1100 UTC 8 May - 1200 UTC 9 May 2014
|
credits:
University of Wyoming
copyright terms:
COMET Standard Terms of Use
description:
Meteogram for OITR, Orumieh, Iran, 1100 UTC 8 May - 1200 UTC 9 May 2014
|
credits:
NOAA/CIMSS
copyright terms:
COMET Standard Terms of Use
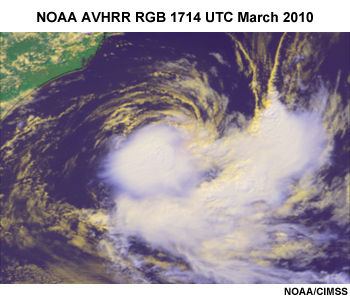
description:
NOAA RGB Image of a Tropical Cyclone over the South Atlantic, 1714 UTC March 2010 (NOAA/CIMSS)
|
credits:
NOAA/CIMSS/The COMET Program
copyright terms:
COMET Standard Terms of Use
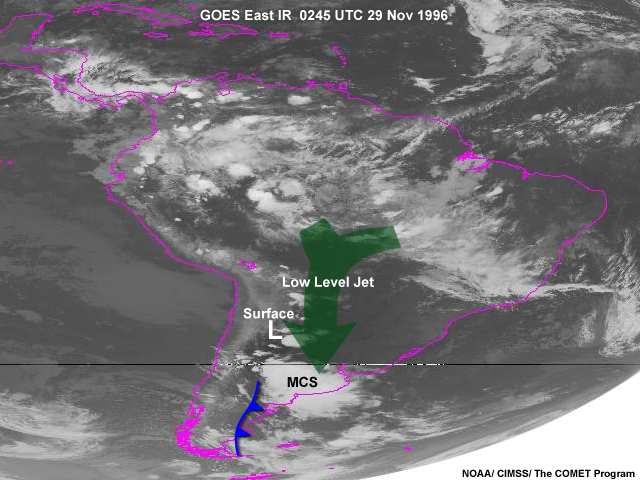
description:
MCS and other deep convective systems over midlatitude South America, 0245 UTC 29 Nov 1996
|
|
credits:
Stensrud, 1996
copyright terms:
COMET Standard Terms of Use
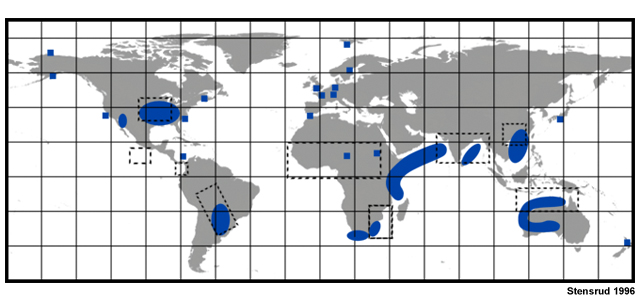
description:
Map showing the general areas where low-level jets are common across the globe and the locations of MCC activity.
|
credits:
NASA
copyright terms:
COMET Standard Terms of Use
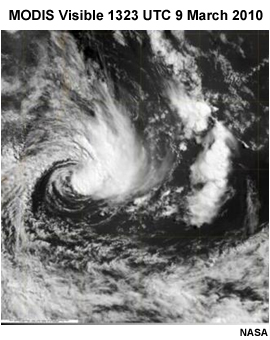
description:
MODIS image of subtropical cyclone off the coast of Brazil, South Atlantic, 1323 UTC 9 March 2010
|
|

credits:
Davis 2010
copyright terms:
COMET Standard Terms of Use
description:
Schematic of two idealized pathways suggested for subtropical cyclone formation (Davis 2010)
|
credits:
©The COMET Program
copyright terms:
COMET Standard Terms of Use
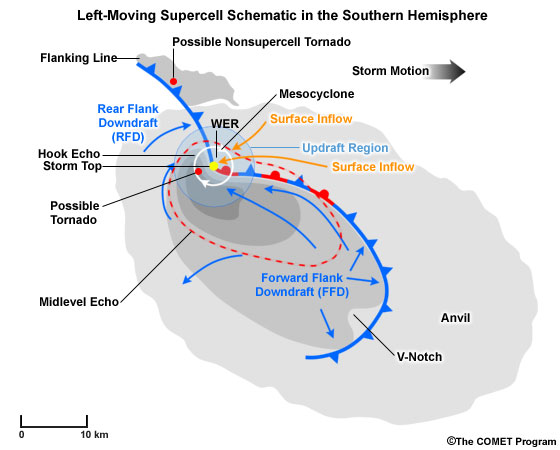
description:
Conceptual image of a left-moving supercell in the southern hemisphere combining elements observed by satellite, radar and conceptual features. The Anvil and Flanking Line are observable in the visible satellite channel. The bean-shaped grey shaded area marks the near-ground radar reflectivity echo, whereas the red outline shows the corresponding stronger (40 dBZ+) echo at the storms midlevels. Some individual radar signatures and storm structure elements are also shown.
|
credits:
NOAA
copyright terms:
COMET Standard Terms of Use
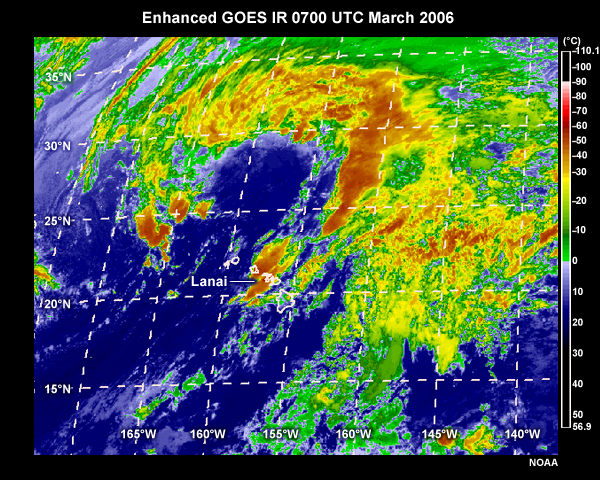
description:
Enhanced GOES IR images of supercell and tornado producing storms over Hawaii at 0700 UTC 24 March 2006
|
credits:
NOAA
copyright terms:
COMET Standard Terms of Use
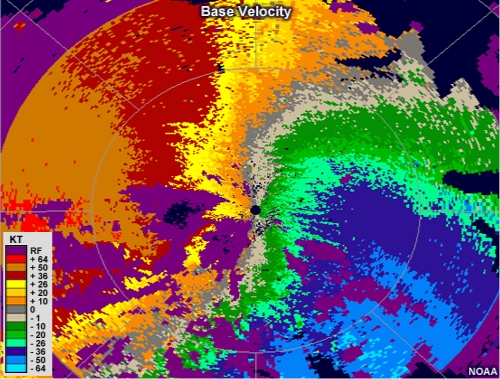
description:
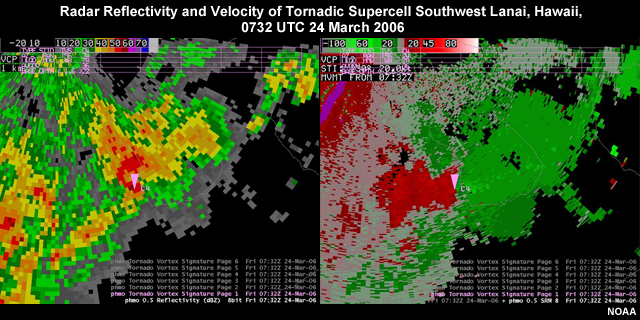
Radar reflectivity and velocity of tornadic supercell southwest of Lanai, Hawaii at 0732 UTC 24 March 2006
|
credits:
Weisman/The COMET Program
copyright terms:
COMET Standard Terms of Use
description:
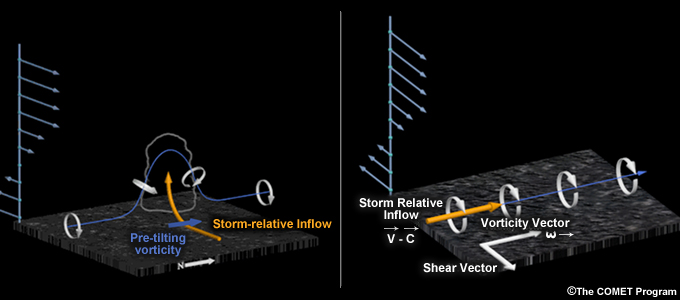
Tilting of crosswise vorticity (a) and streamwise vorticity (b).
|
credits:
Berry et al. 2007
copyright terms:
COMET Standard Terms of Use
description:
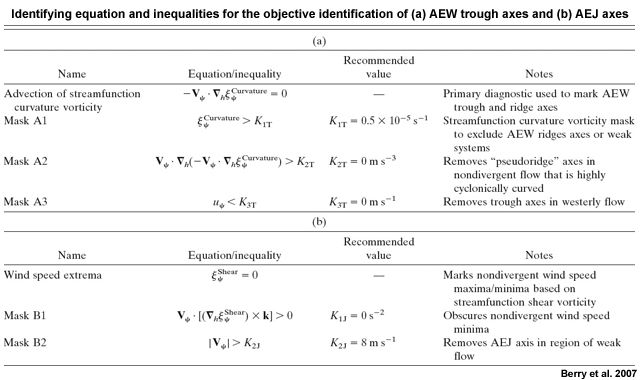
Table: Identifying equation and inequalities used for the objective identification of (a) AEW trough axes and (b) AEJ axes (Berry et al. 2007).
|
credits:
NOAA/ESRL
copyright terms:
COMET Standard Terms of Use
description:
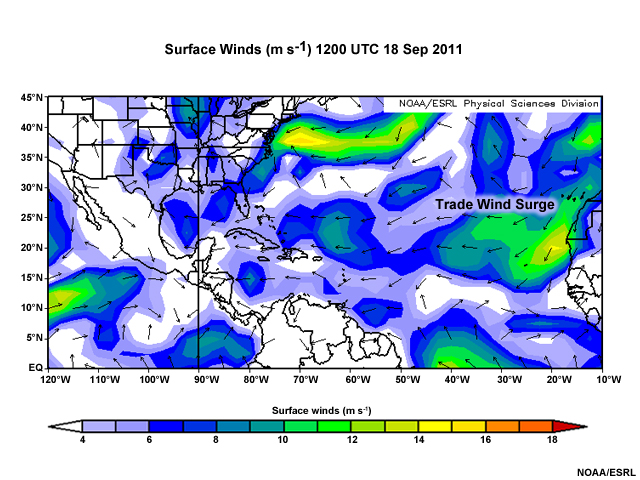
Trade wind surge over the tropical Atlantic, 18 Sep 2011 (courtesy of NOAA ESRL/Physical Science)
|
|
credits:
Credit for five color panels is
copyright terms:
COMET Standard Terms of Use
description:
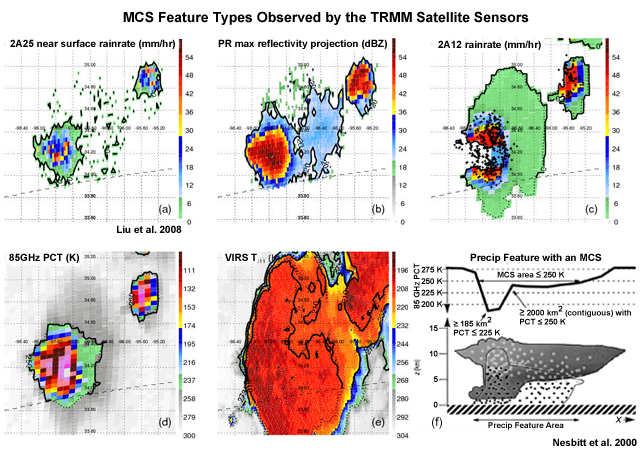
MCS feature types observed by TRMM satellite, a severe hail storm case: (a)Precipitation Radar (PR) near surface rainfall rate. Precipitation feature is the area with rain shown by black contour. (b) PR maximum reflectivity ground projection. Reflectivity Feature is area with 20 dBZ shown by black contour. (c) TRMM Microwave Imager (TMI) rain rate. (d) TMI 85 GHz PCT. PCT feature is shown by 250 K contour line. (e) IR cold cloud feature defined by brightness temperature < 210 K, 235 K and 273 K shown by black contours. The dash line in each panel is the edge of the PR swath. (Liu et al. 2008) (f) Cross section of a precipitation feature with an MCS. (Nesbitt et al. 2000)
|
credits:
Johnson et al. 2005
copyright terms:
COMET Standard Terms of Use
description:
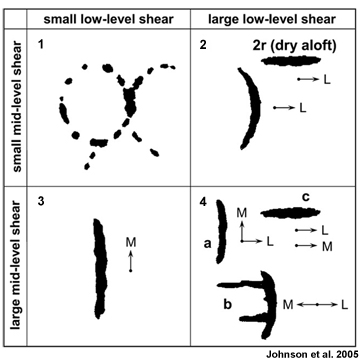
Four panel shear-based organizational diagram of MCSs showing mid-level and low-level shear and radar reflectivity pattern.
|
credits:
Mohr and Zipser 1996
copyright terms:
COMET Standard Terms of Use
description:
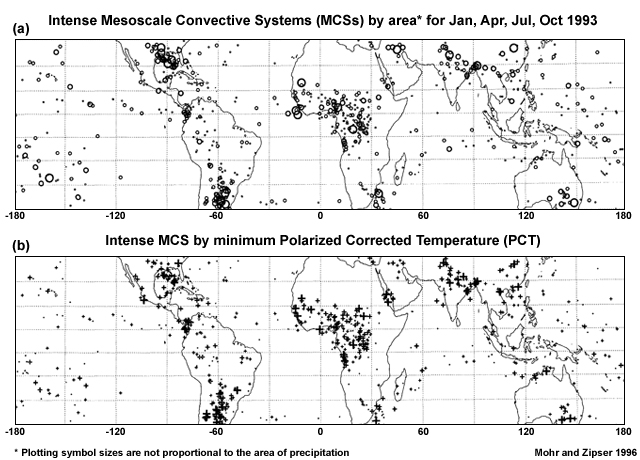
(a) Intense MCSs by area, all months. Plotting symbol sizes are not proportional to the area of precipitation. (b) Intense MCS by minimum PCT, all months. (Mohr and Zipser 1996)
|

View animation
credits:
NOAA
copyright terms:
COMET Standard Terms of Use
description:
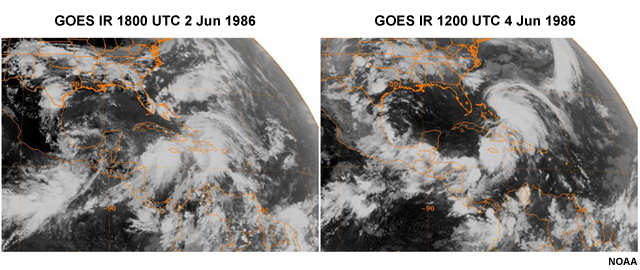
GOES IR showing tropical and extropical systems interacting and producing floods and a tropical cyclone, May-June 1986
|
credits:
NOAA
copyright terms:
COMET Standard Terms of Use
description:
GOES IR showing tropical and extropical systems interacting and producing floods and a tropical cyclone, June 1986
|
|

credits:
NOAA/NSSL
copyright terms:
COMET Standard Terms of Use
description:
Schematic of ordinary thunderstorm lifecycle: developing, mature, dissipating
|
credits:
©EUMETSAT 1998
copyright terms:
COMET Standard Terms of Use
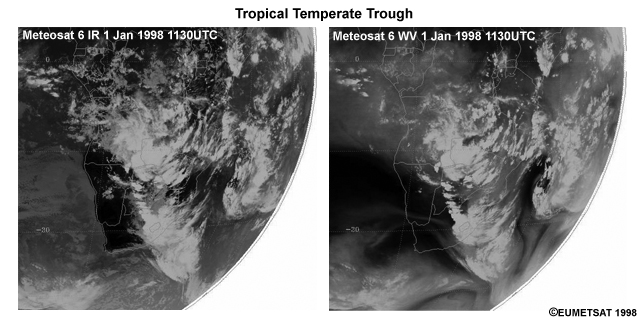
description:
Meteosat IR (left) and water vapor images of a tropical temperate trough over southern Africa at 1130 UTC 1 Jan 1998.
|
![Maps of 345-K PV (thin contours, PVU), PV advection [thick contours starting at +-3 PVU day-1 with positive advection dotted (negative advection solid)] and 345-K diabatic PV tendency (shaded, PVU day-1) on (a) 31 Dec 1997, (b) 1 Jan 1998. Vectors represent 345-K winds >20 m s?1. (c) Moisture transports (vectors, g kg?1 s?1), moisture convergence (shaded, 10?8 g kg?1 s?1), and pressure (contours, hPa) at 309 K for 1 Jan 1998. Regions of moisture export off Africa and into the midlatitudes are noted as warm conveyor belts (WCBs) (Hart et al. 2010)](media/graphics/ttt_pv_moisture_19980101.jpg)
credits:
Hart et al 2010
copyright terms:
COMET Standard Terms of Use
description:
Maps of 345-K PV (thin contours, PVU), PV advection [thick contours starting at +-3 PVU day-1 with positive advection dotted (negative advection solid)] and 345-K diabatic PV tendency (shaded, PVU day-1) on (a) 31 Dec 1997, (b) 1 Jan 1998. Vectors represent 345-K winds >20 m s?1. (c) Moisture transports (vectors, g kg?1 s?1), moisture convergence (shaded, 10?8 g kg?1 s?1), and pressure (contours, hPa) at 309 K for 1 Jan 1998. Regions of moisture export off Africa and into the midlatitudes are noted as warm conveyor belts (WCBs) (Hart et al. 2010)
|
credits:
Fitzpatrick, Knaff, Landsea, and Finley, 1995
copyright terms:
COMET Standard Terms of Use
description:
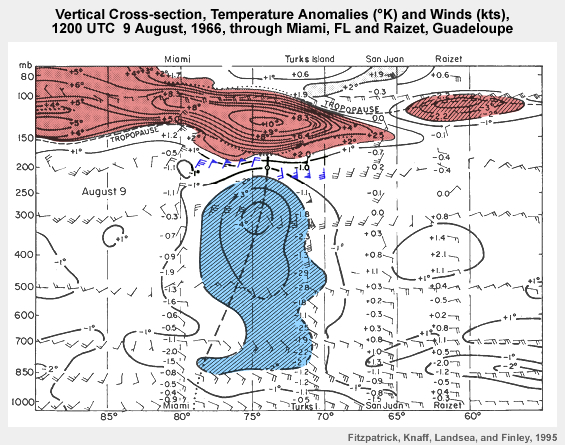
Vertical Cross-section, Temperature Anomalies ( K) and Winds (kts), 12 UTC 9 August, 1966, through Miami, Fl and Raizet, Guadeloupe
|
credits:
NOAA
copyright terms:
COMET Standard Terms of Use
description:
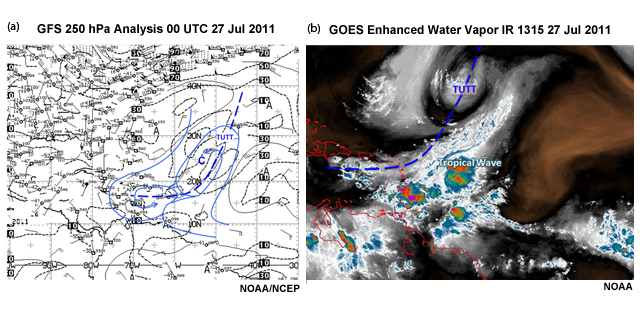
GFS 250 hPa analysis and Enhanced water vapor image showing TUTT extending from the tropical Atlantic into the eastern Caribbean 27 Jul 2011
|
credits:
© The COMET Program
copyright terms:
COMET Standard Terms of Use
description:
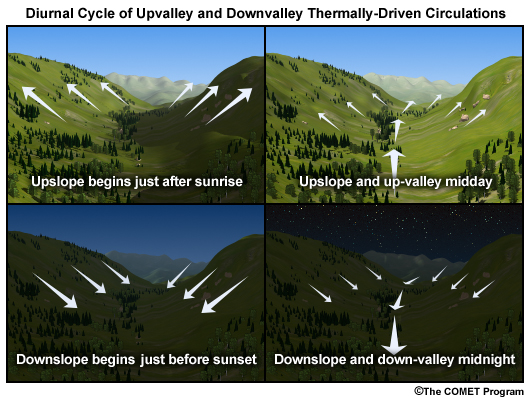
Schematic of diurnal cycle of thermally-driven mountain/valley circulation with sloping valley resulting in up- and down-valley circulation.
|
credits:
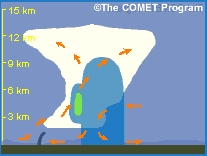
The COMET Program
copyright terms:
COMET Standard Terms of Use
description:
Vorticity balance cross-sectional diagram for a mature MCS.
|
credits:
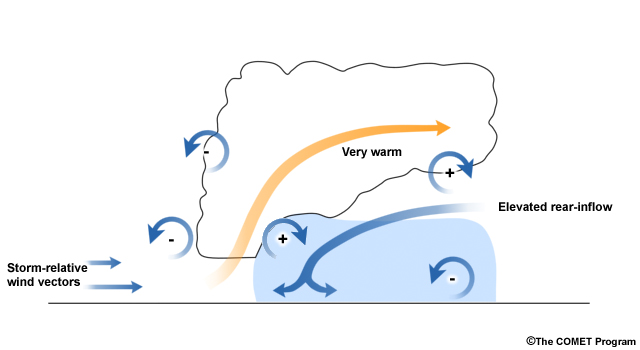
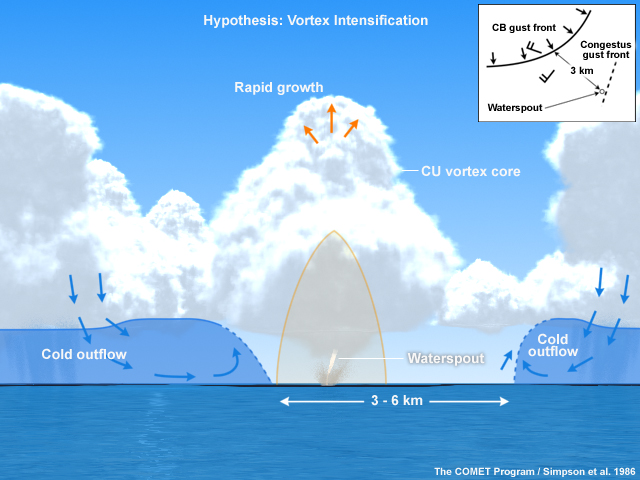
The COMET Program / Simpson et al. 1986
copyright terms:
COMET Standard Terms of Use
description:
Schematic of waterspout formation (Simpson et al. 1986)
|
credits:
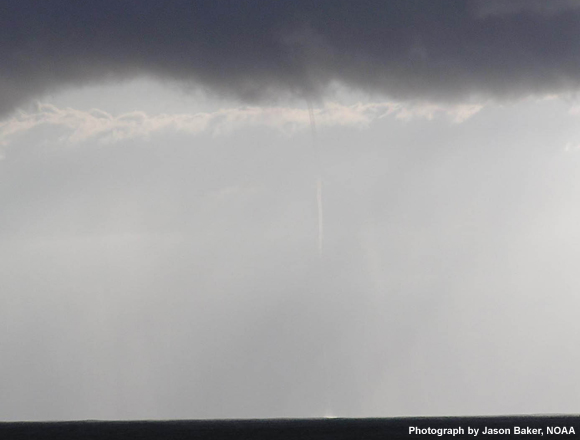
Photograph by Jason Baker, NOAA
copyright terms:
COMET Standard Terms of Use
description:
Photograph of waterspout near Northwest Hawaiian Islands, September 2007 (courtesy of Dr. Jason Baker, NOAA Marine Biologist).
|
![Wavenumber-frequency power spectrum of the (a) symmetric and (b) antisymmetric components of brightness temperature (Tb) from the Cloud Archive User Services (CLAUS) for July 1983 to June 2005, summed from 15N to 15S. Peaks associated with convectively coupled equatorial waves (shaded contours) spectrum are marked. Solid black lines represent the Matsuno (1966) shallow water wave dispersion curves for equivalent depths of 12, 25, and 50 m. Outline boxes represents regions of wave numberfrequency filtering. [From Kiladis, G. N., M. C. Wheeler, P. T. Haertel, K. H. Straub, and P. E. Roundy (2009), Convectively coupled equatorial waves, Rev. Geophys., 47, RG2003, doi:10.1029/2008RG000266. Copyright 2009 American Geophysical Union. Reproduced with permission of American Geophysical Union]](media/graphics/wavenumber_freq_wheeler_kiladis.jpg)
credits:
Kiladis et al. 2009
copyright terms:
COMET Standard Terms of Use
description:
Wavenumber-frequency power spectrum of the (a) symmetric and (b) antisymmetric components of brightness temperature (Tb) from the Cloud Archive User Services (CLAUS) for July 1983 to June 2005, summed from 15N to 15S. Peaks associated with convectively coupled equatorial waves (shaded contours) spectrum are marked. Solid black lines represent the Matsuno (1966) shallow water wave dispersion curves for equivalent depths of 12, 25, and 50 m. Outline boxes represents regions of wave numberfrequency filtering. [From Kiladis, G. N., M. C. Wheeler, P. T. Haertel, K. H. Straub, and P. E. Roundy (2009), Convectively coupled equatorial waves, Rev. Geophys., 47, RG2003, doi:10.1029/2008RG000266. Copyright 2009 American Geophysical Union. Reproduced with permission of American Geophysical Union]
|
credits:
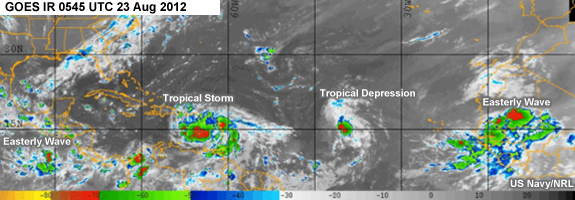
US Navy/NRL
copyright terms:
COMET Standard Terms of Use
description:
GOES Enhanced IR image at 0545 UTC 23 Aug 2012 showing an easterly wave over Africa, a tropical depression over the Atlantic, Tropical Storm Isaac over the Caribbean, and an easterly wave over the East Pacific.
|
credits:
The COMET Program/NASA
copyright terms:
COMET Standard Terms of Use
description:
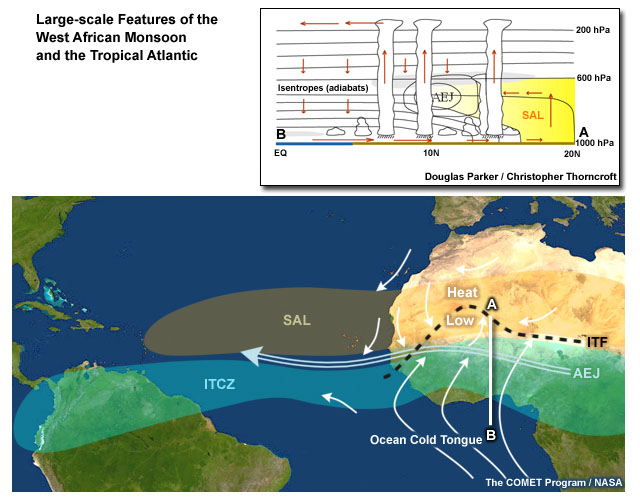
(a) Major large-scale features and (b) key synoptic and mesoscale weather systems of the West Africa monsoon and the tropical Atlantic. (c) Schematic of N-S vertical cross section along the Greenwich Meridian highlighting the heat low-AEJ-ITCZ system, the SAL
|
credits:
Chen et al. 1996
copyright terms:
COMET Standard Terms of Use
description:
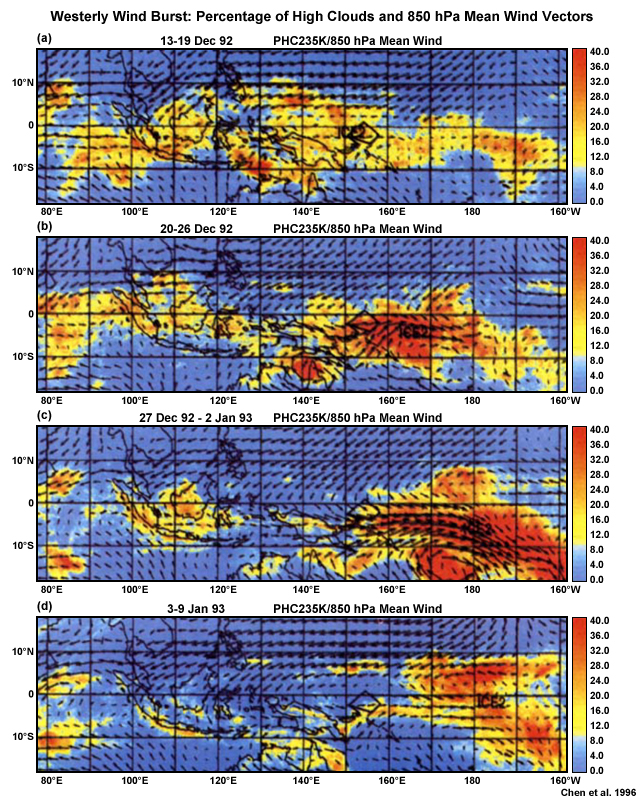
A westerly wind burst during Dec 1992 to Jan 1993. Shaded areas are percentage of high (cold) clouds and vectors are 850 hPa mean winds.
|
credits:
(left) UCAR Digital Image Library/NCU (right) The COMET Program
copyright terms:
COMET Standard Terms of Use
description:
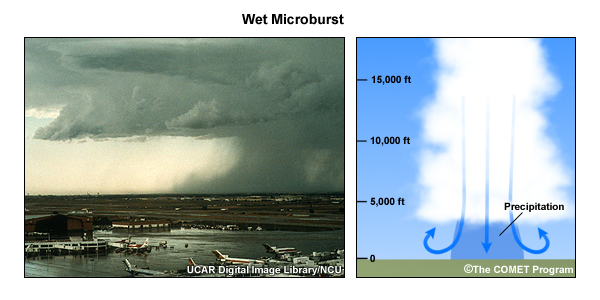
Rainshaft and accompanying microburst at Stapleton Airport, Denver, CO (left) and idealized schematic of a wet microburst (right)
|
credits:
Kiladis et al. 2009
copyright terms:
COMET Standard Terms of Use
description:
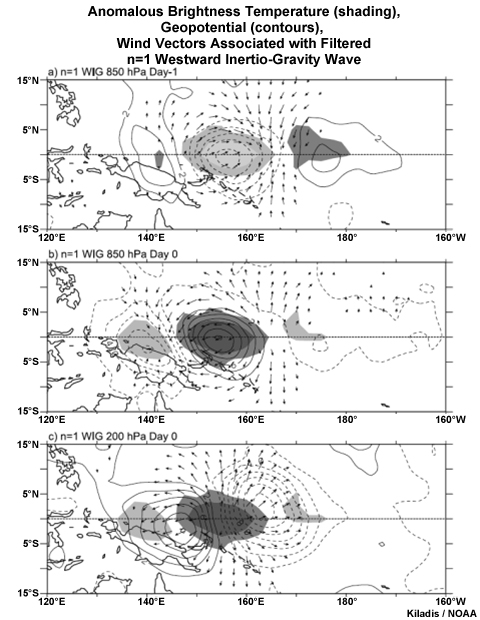
Anomalous brightness temperature (shading), geopotential (contours), and wind vectors associated with a -20K perturbation in n=1 WIG wave. Tb at the base point 0.0, 155E, for (a) day -1 at 850 hPa (b) day 0 at 850 hPa, and (c) day 0 at 200 hPa. Contours are every 2m^2 s^-2 with negative contours dashed. Dark (light) shading marks negative (positive) Tb perturbations of 10K and 3K. Tb and wind vectors are locally significant at the 95% level, with the largest vectors around 2 m s-1. (Kiladis et al. 2009)
|