The following media items used in this module are protected by the details of their copyrights. Please use the "copyright terms" link associated with each media item below for more information.
Click an image to view it at full size in a new browser window/tab.
![mean diurnal cycle of the ABL height observed over Gadanki (13.5°N, 79.2°E), India, from 19 April 2006 to 31 August 2008, averaged for (a) MAM (pre-monsoon), (b) JJA (monsoon), (c) SON (post-monsoon), and (d) DJF (winter). The ABL heights are estimated from potential temperature (black), virtual potential temperature (red), mixing ratio (green), refractivity from GPS radio occultation (magenta), and radiosonde refractivity (blue). Number of profiles for radiosonde (COSMIC GPS radio occultation) are listed above the x-axis. [Basha and Ratnam 2009]](media/graphics/abl_height_diurnal_seasonal.jpg)
credits:
Basha and Ratnam 2009
copyright terms:
COMET Standard Terms of Use
description:
mean diurnal cycle of the ABL height observed over Gadanki (13.5°N, 79.2°E), India, from 19 April 2006 to 31 August 2008, averaged for (a) MAM (pre-monsoon), (b) JJA (monsoon), (c) SON (post-monsoon), and (d) DJF (winter). The ABL heights are estimated from potential temperature (black), virtual potential temperature (red), mixing ratio (green), refractivity from GPS radio occultation (magenta), and radiosonde refractivity (blue). Number of profiles for radiosonde (COSMIC GPS radio occultation) are listed above the x-axis. [Basha and Ratnam 2009]
|
![Structure of the undisturbed tropical atmosphere in the trade wind regime based on aircraft soundings. Undisturbed conditions are marked by subsidence, clear skies, or fair weather cumulus. [From Garstang and Betts (1974), based on Malkus (1956)].](media/graphics/abl_layers_sndg.jpg)
credits:
Garstang and Betts 1974
copyright terms:
COMET Standard Terms of Use
description:
Structure of the undisturbed tropical atmosphere in the trade wind regime based on aircraft soundings. Undisturbed conditions are marked by subsidence, clear skies, or fair weather cumulus. [From Garstang and Betts (1974), based on Malkus (1956)].
|
credits:
Johnson 1978
copyright terms:
COMET Standard Terms of Use
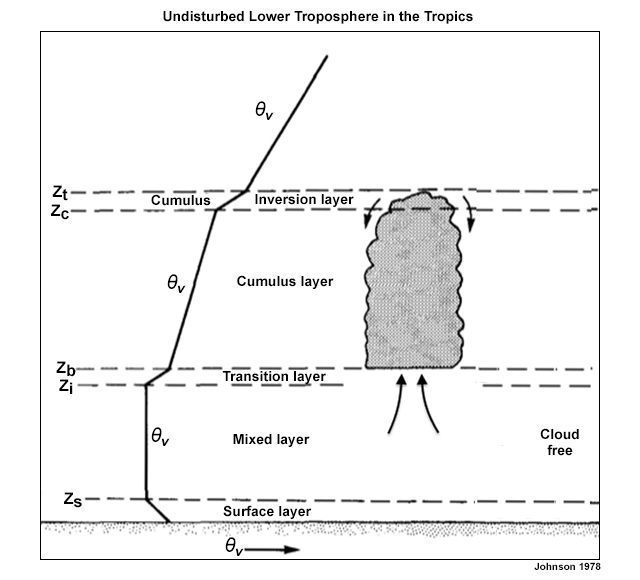
description:
Conceptual profile of the boundary layer virtual potential temperature during mean fair weather conditions over South Florida with cloudy and cloud free regions (Johnson 1978).
|
credits:
(c) The COMET Program
copyright terms:
COMET Standard Terms of Use
description:
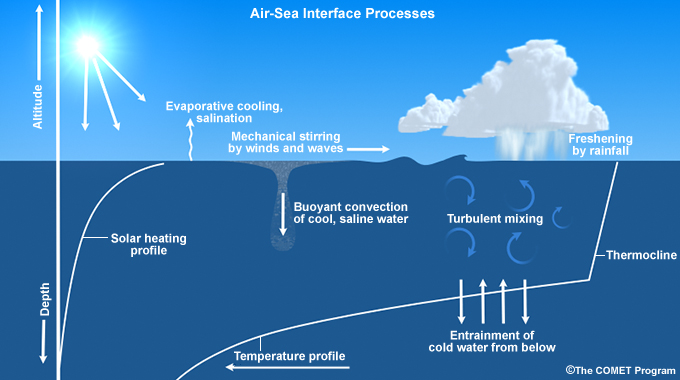
Conceptual figures showing processes at the air-sea interface
|
credits:
ECMWF
copyright terms:
COMET Standard Terms of Use
description:
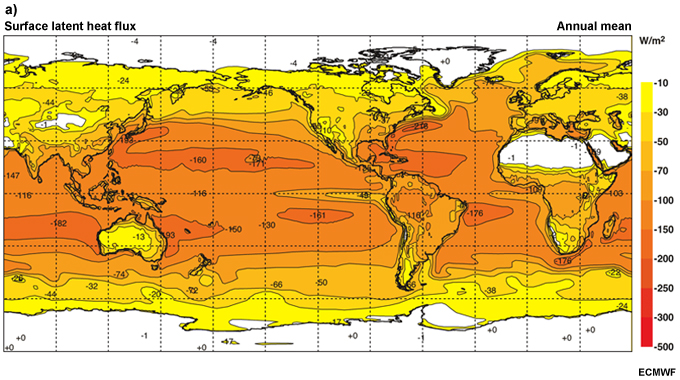
Global distribution of fluxes of surface latent heat (courtesy of ECMWF).
|
credits:
ECMWF
copyright terms:
COMET Standard Terms of Use
description:
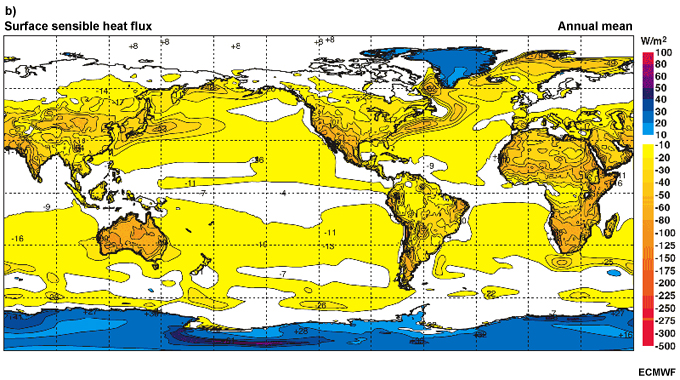
Global distribution of fluxes of sensible heat (courtesy of ECMWF).
|
credits:
(c) The COMET Program
copyright terms:
COMET Standard Terms of Use
description:
Schematic diagrams showing idealized Skew-T log P profiles and conceptual cloud processes during initial and final state for the Arakawa-Schubert cumulus parameterization scheme.
|
credits:
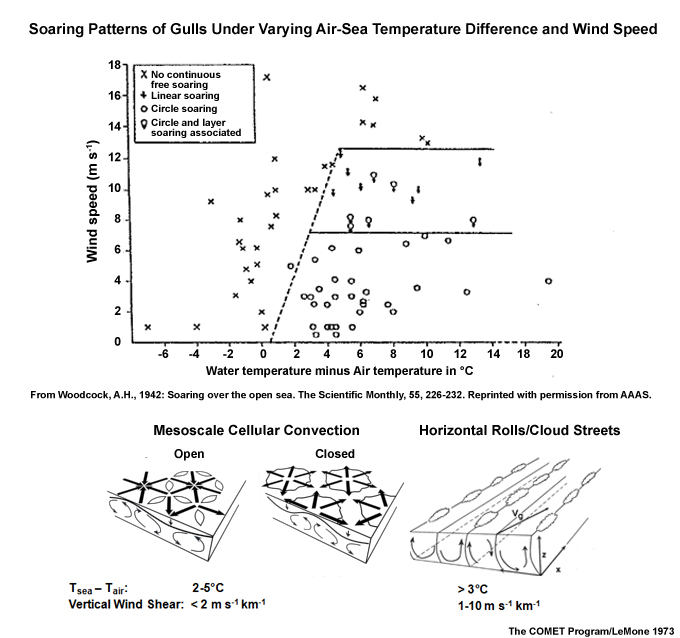
From Woodcock, A.H., 1942: Soaring over the open sea. The Scientific Monthly, 55, 226-232. Reprinted with permission from AAAS
copyright terms:
COMET Standard Terms of Use
description:
Soaring patterns of gulls categorized by wind speed and air-sea temperature difference. From Woodcock, A.H., 1942: Soaring over the open sea. The Scientific Monthly, 55, 226-232. Reprinted with permission from AAAS.
|
![Climatological frequency of cumulonumbus with anvil during daytime from (top) Jun - Aug and (bottom) Dec Feb. Contour interval is 5%. Shading indicates frequency above 10% (light) and 20% (dark).[Norris 1998, AMS]](media/graphics/cb_distrib.jpg)
credits:
Norris 1998
copyright terms:
COMET Standard Terms of Use
description:
Climatological frequency of cumulonumbus with anvil during daytime from (top) Jun - Aug and (bottom) Dec Feb. Contour interval is 5%. Shading indicates frequency above 10% (light) and 20% (dark).[Norris 1998, AMS]
|
credits:
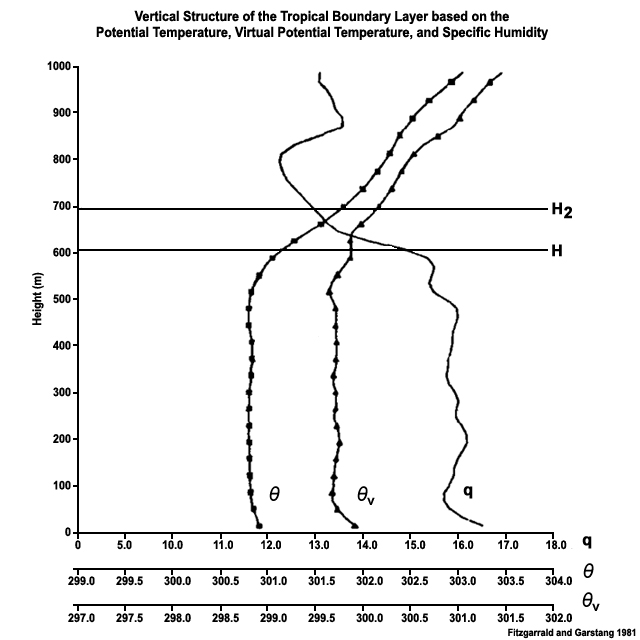
Fitzgarrald and Garstang 1981
copyright terms:
COMET Standard Terms of Use
description:
(a) Profiles of potential temperature (?), virtual potential temperature (?v), and specific humidity, (q), during undisturbed conditions at 1630 GMT 6 August 1974, over the Dallas research ship in the tropical East Atlantic during the Global Atmospheric Research Project (GARP) Atlantic Tropical Experiment (GATE). H marks the top of the mixed layer, and H2 the top of the transition layer.
|
credits:
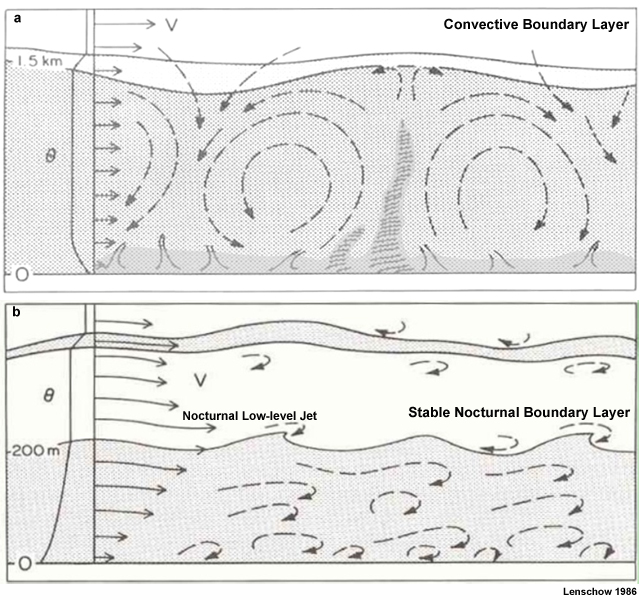
Lenschow 1986
copyright terms:
COMET Standard Terms of Use
description:
Schematic of (a) a convective PBL capped by an inversion; (b) a stably stratified nocturnal PBL. Lenschow, D.H., 1986: Aircraft measurements in the boundary layer. Probing the Atmospheric Boundary Layer, D.H. Lenschow, Ed., American Meteorological Society, 39-55. Reused with permission of the American Meteorological Society.
|

credits:
Johnson 1977
copyright terms:
COMET Standard Terms of Use
description:
A mixed layer model of the daytime boundary layer over South Florida; it uses a first-order closure. A closure assumption is needed for the heat flux term. (Johnson 1977)
|
credits:
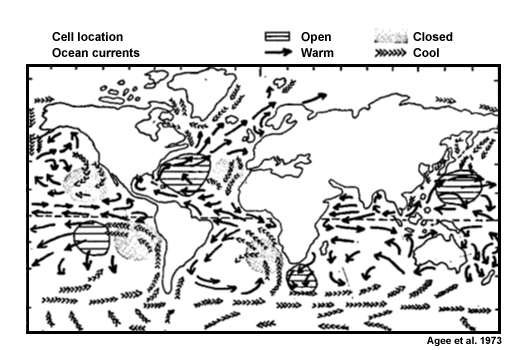
Agee et al. 1973
copyright terms:
COMET Standard Terms of Use
description:
Favored regions for open and closed cellular convection with respect to warm and cool ocean currents (Ernest Agee et al. 1973).
|
credits:
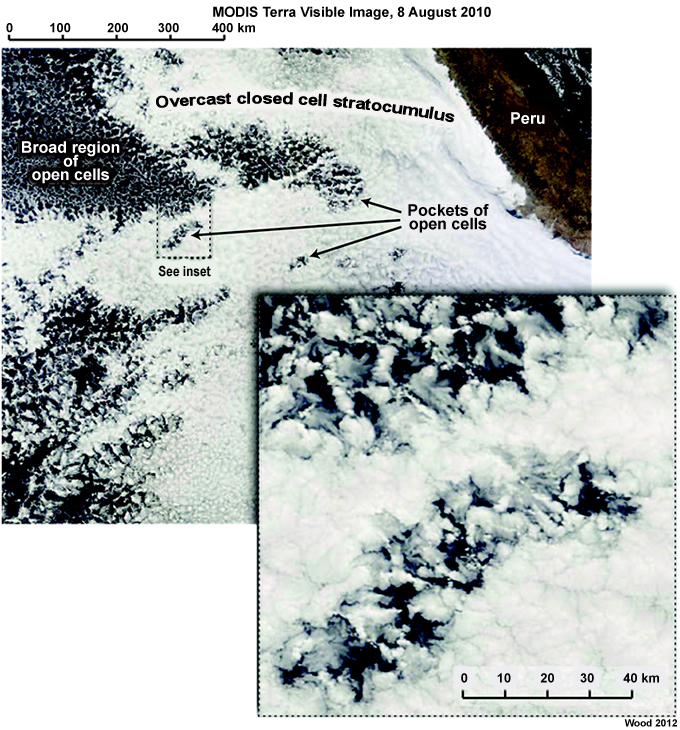
Wood 2012
copyright terms:
COMET Standard Terms of Use
description:
(a) Open and closed boundary layer cloud cells over the tropical, southeast Pacific (offshore of Peru).
|
![Convective internal boundary layer formed by advection of cool marine air over a warm land surface. Here h is the depth of the CIBL and varies as a function of distance from the coast. [From Miller et al. 2003, Reproduced with permission of the AGU]](media/graphics/cibl_seabreeze_miller_etal2003.jpg)
credits:
Miller et al. 2003
copyright terms:
COMET Standard Terms of Use
description:
Convective internal boundary layer formed by advection of cool marine air over a warm land surface. Here h is the depth of the CIBL and varies as a function of distance from the coast. [From Miller et al. 2003, Reproduced with permission of the AGU]
|
credits:
(c) The COMET Program
copyright terms:
COMET Standard Terms of Use
description:
Schematic diagrams showing idealized Skew-T log P profiles and conceptual cloud processes during initial and final state for the Arakawa-Schubert cumulus parameterization scheme.
|
credits:
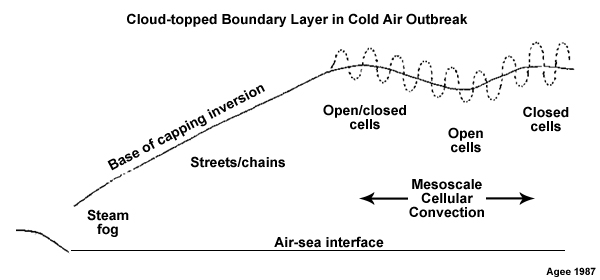
Agee 1987
copyright terms:
COMET Standard Terms of Use
description:
Schematic vertical cross section through cloud-topped boundary layer from shore to open sea and associated convective regime during a cold-air outbreak. Note the variation of convective depth (capping inversion base) from shore to sea and between open and closed cell regions as well as individual cell circulation (dashed line). (Dr. Ernest Agee, 1987).
|
credits:
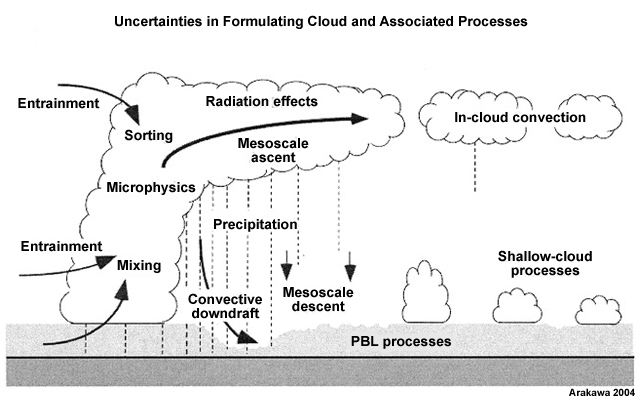
Arakawa 2004
copyright terms:
COMET Standard Terms of Use
description:
Clouds and processes with major uncertainties in their formulation that are parameterized in numerical models (Arakawa 2004)
|
credits:
Walter 1980
copyright terms:
COMET Standard Terms of Use
description:
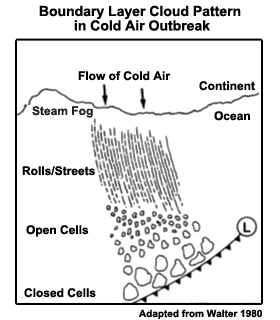
Schematic representation of changes in the convective cloud regimes with distance from shore during a cold air outbreak over the ocean (Walter 1980)
|
credits:
Modified from Rockwell/NCAR
copyright terms:
COMET Standard Terms of Use
description:
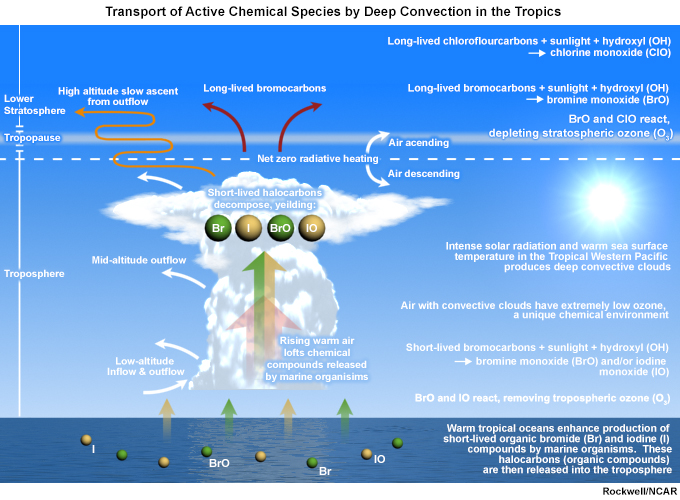
Schematic of trace gases vertical transport and sampling by aircraft during the Convective transport of active species in the Tropics (CONTRAST) field program, Jan-Feb 2014.
|
credits:
(a) Houze 2004; (b) Yanai and Johnson 1993; (c) Schumacher et al. 2004
copyright terms:
COMET Standard Terms of Use
description:
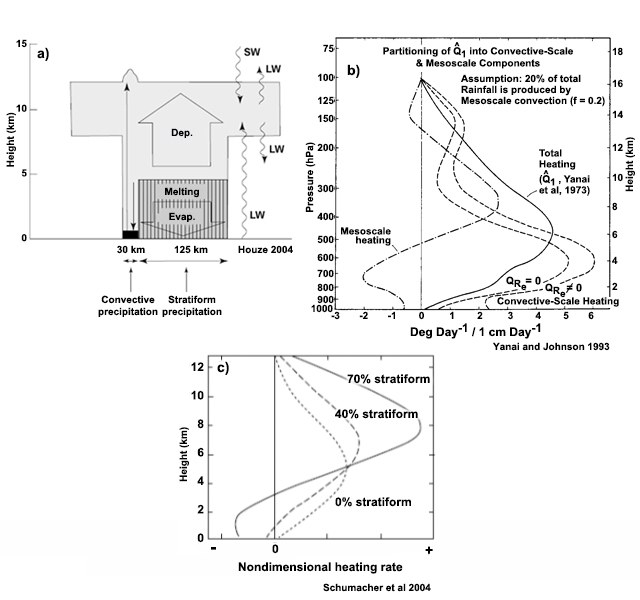
(a) Heating and moisture processes in a mature MCS with convective line and trailing stratiform region (Houze 2004); (b) idealized apparent heat source for convective and stratiform regions of a GATE MCS (Yanai and Johnson 1993); and (c) idealized heating for MCSs with different fractions of stratiform precipitation (Schumacher et al. 2004)
|
credits:
Arakawa 2004
copyright terms:
COMET Standard Terms of Use
description:
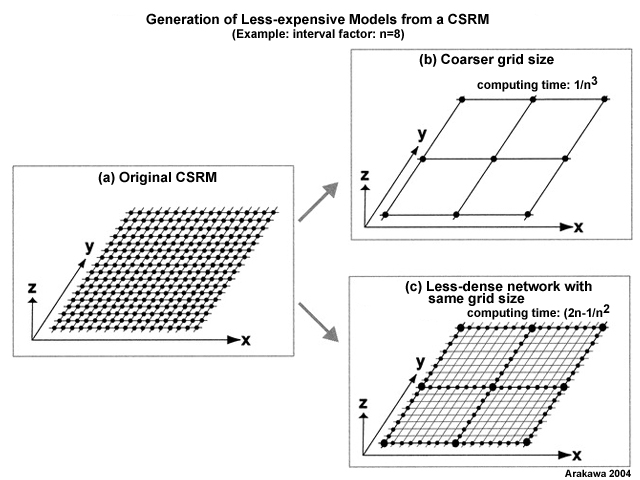
(a) Horizontal grid of a 3D CSRM. (b) Same as in (a) but with a coarser grid size. (c) Same as in (a) but for a quasi-3D gridpoint network with the same grid size. (Arakawa 2004)
|
credits:
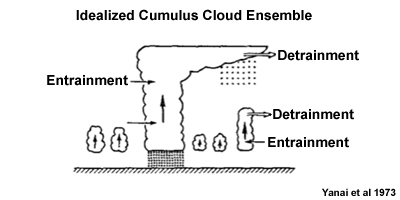
Yanai et al 1973
copyright terms:
COMET Standard Terms of Use
description:
Conceptual diagram of an ensemble of cumulus clouds and kinematic flow. (Yanai et al 1973)
|
![Lifecycle and structure of tropical mesoscale convective system and the corresponding variations in the mixed and transition layers. [The COMET Program]](media/graphics/cumulus_growth_trop_disturbance.jpg)
credits:
(c) The COMET Program
copyright terms:
COMET Standard Terms of Use
description:
Lifecycle and structure of tropical mesoscale convective system and the corresponding variations in the mixed and transition layers. [The COMET Program]
|
credits:
(c) The COMET Program
copyright terms:
COMET Standard Terms of Use
description:
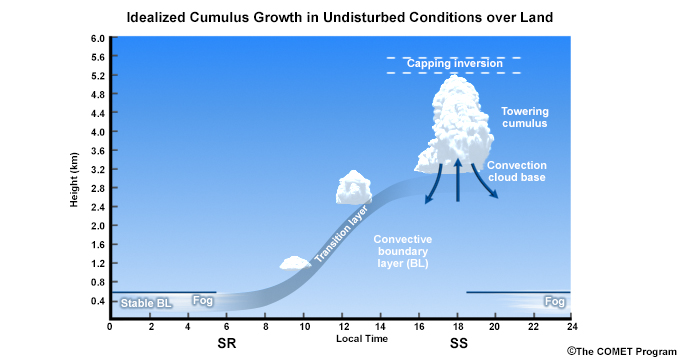
Growth of cumulus from boundary layer to towering cumulus during an idealized diurnal cycle for undisturbed conditions over land
|
![Statistics of the diurnal cycle of the ABL height over tropical oceans and islands observed during field experiments: (c) Northern Australia, plus Nauru; (d) Eastern Pacific Investigation of Climate (EPIC); (e) Indian Ocean Experiment (INDOEX), excluding islands; (f) INDOEX islands. [Liu and Liang 2010]](media/graphics/diurnal_abl_trop_oceans_islands.jpg)
credits:
Liu and Liang 2010
copyright terms:
COMET Standard Terms of Use
description:
Statistics of the diurnal cycle of the ABL height over tropical oceans and islands observed during field experiments: (c) Northern Australia, plus Nauru; (d) Eastern Pacific Investigation of Climate (EPIC); (e) Indian Ocean Experiment (INDOEX), excluding islands; (f) INDOEX islands. [Liu and Liang 2010]
|
![Development of supergeostrophic winds in the low-level jet (after Blackadar 1957), where Vg is the geostrophic wind, V0 is the initial wind, and V the true wind. W is the deviation from the geostrophic wind at some time t, W0 the deviation at initial time.[USDA Forest Service 1981, after Blackadar 1957]](media/graphics/diurnal_llj_oscillation.jpg)
credits:
USDA Forest Service 1981/Adapted from Blackadar 1957
copyright terms:
COMET Standard Terms of Use
description:
Development of supergeostrophic winds in the low-level jet (after Blackadar 1957), where Vg is the geostrophic wind, V0 is the initial wind, and V the true wind. W is the deviation from the geostrophic wind at some time t, W0 the deviation at initial time.[USDA Forest Service 1981, after Blackadar 1957]
|
credits:
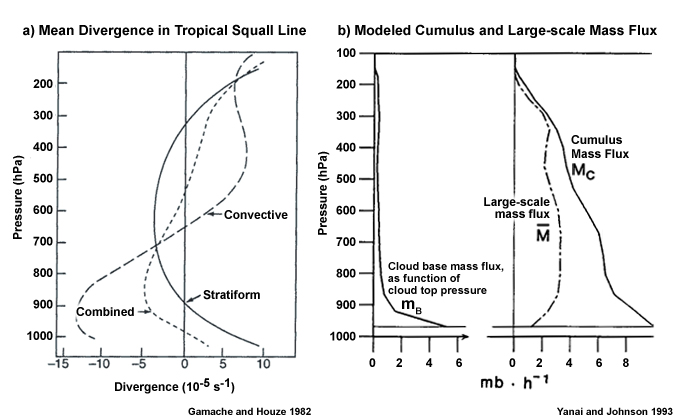
(a) Gamache and Houze 1982 and (b)Yanai and Johnson 1993
copyright terms:
COMET Standard Terms of Use
description:
(a) Average divergence over the convective (long-dashed), stratiform (solid), and combined (short-dashed) regions of a tropical squall line. The combined effect has maximum in convergence in the lower troposphere and maximum divergence in the upper troposphere. (Gamache and Houze 1982); (b) Vertical profiles of cumulus mass flux (MC) diagnosed from GATE Phase III mean data using a model without downdrafts and the mean large scale mass flux, M ? (dash-dotted). Cumulus mass flux peaks near the surface and decreases with height (Yanai and Johnson 1993)
|
credits:
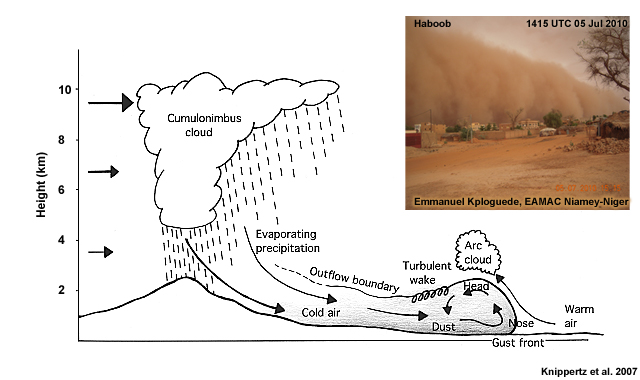
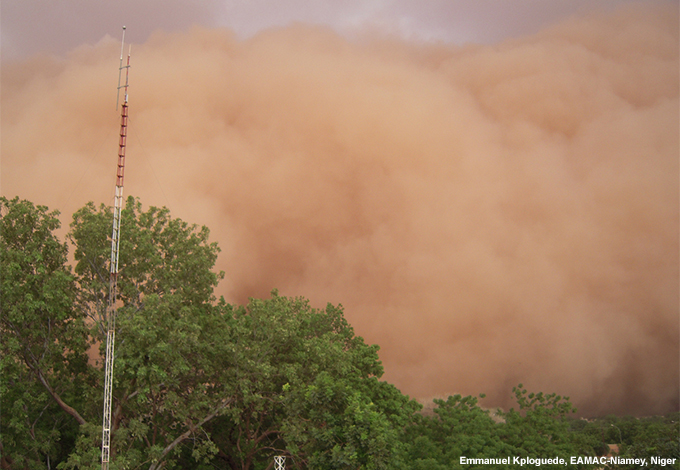
Schematic credit: Knippertz et al. 2007; Photograph credit: Dust cloud 05072010 1515 Niamey
copyright terms:
COMET Standard Terms of Use
description:
Schematic of dust mobilization in West Africa by thunderstorm cold pool and gust front. Inset is photograph of a dust wall produced by an MCS outflow, 5 July 2010 at 15:15 LMT (EUMETSAT Image Library, copyright: Emmanuel Kploguede)
|
credits:
Emmanuel Kploguede, EAMAC-Niamey, Niger
copyright terms:
COMET Standard Terms of Use
description:
Photograph of a dust wall (copyright: Emmanuel Kploguede, EAMAC-Niamey, Niger)
|
credits:
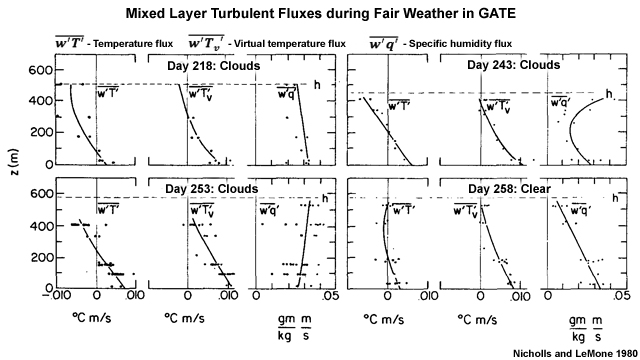
Nicholls and LeMone 1980
copyright terms:
COMET Standard Terms of Use
description:
Profiles of mixed layer temperature flux, virtual temperature flux, and specific humidity flux, for fair weather days during GATE. Significant cumulus occurred on (a) Day 218, (b) Day 243, (c) Day 253, no clouds on (d) Day 258. To convert units to W m-2, multiply temperature fluxes by 1150 and humidity flux by 2800. (Reprinted from Nicholls and LeMone 1980 with permission of the AMS)
|
credits:
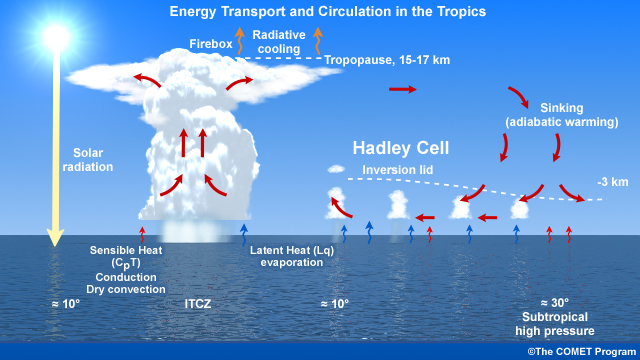
(c) The COMET Program
copyright terms:
COMET Standard Terms of Use
description:
Conceptual diagram of energy cycles and vertical transport in the Hadley cell
|
credits:
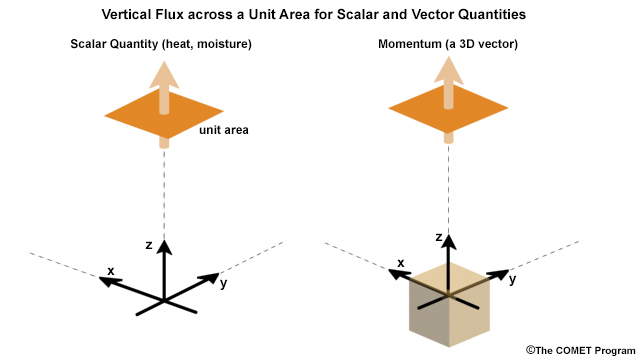
(c) The COMET Program
copyright terms:
COMET Standard Terms of Use
description:
Schematic of vertical flux of (a) a scalar quantity and (b) momentum (a vector quantity)
|
![Mean NLLJ index (shaded) and 500-m AGL winds (arrows) at local midnight for 19852005 for (a) July and (b) January calculated from three-¬dimensional global hourly analyses. The inset shows the locations of NLLJs. Vector winds are plotted at approximately every 20th grid point.[Rife et al. 2010]](media/graphics/global_llj_rife_etal2010.jpg)
credits:
Rife et al. 2010
copyright terms:
COMET Standard Terms of Use
description:
Mean NLLJ index (shaded) and 500-m AGL winds (arrows) at local midnight for 19852005 for (a) July and (b) January calculated from three-¬dimensional global hourly analyses. The inset shows the locations of NLLJs. Vector winds are plotted at approximately every 20th grid point.[Rife et al. 2010]
|
credits:
Nitta 1977
copyright terms:
COMET Standard Terms of Use
description:
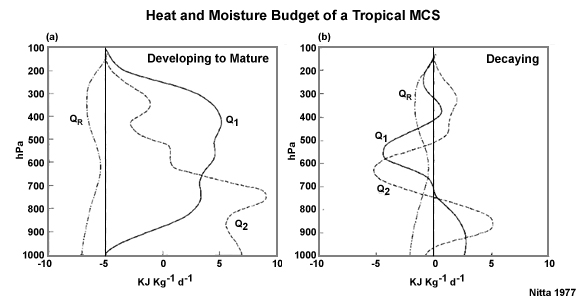
Mean large-scale apparent heat source, Q1, apparent moisture sink, Q2, and radiation heating, QR for convection during GATE: (a) cloud cluster that developed to maturity (and (b) decaying convection. Units are KJ Kg-1 d-1.(Nitta 1997)
|
credits:
DOE/ARM
copyright terms:
COMET Standard Terms of Use
description:
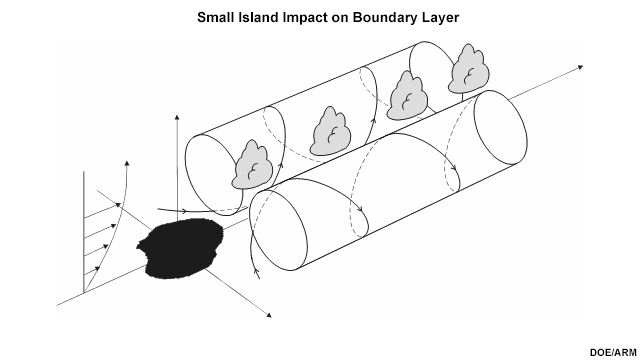
Schematic of the 3-D flow and horizontal convective rolls produced by the island thermal perturbation (DOE/ARM)
|
credits:
DOE/ARM
copyright terms:
COMET Standard Terms of Use
description:
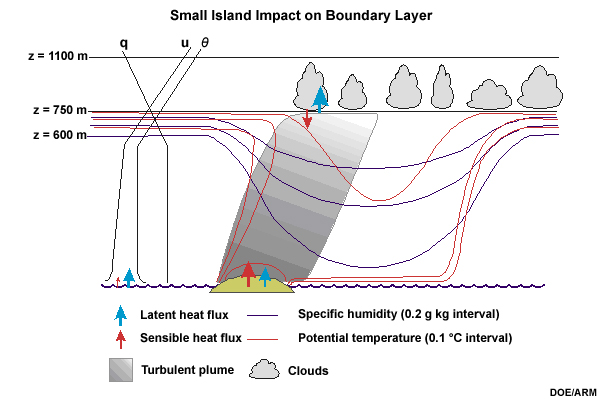
) Modifications in the marine boundary layer (sensible and latent heat fluxes, potential temperature, and specific humidity) over Nauru, which produce boundary layer cumulus (DOE/ARM)
|

credits:
(c) The COMET Program
copyright terms:
COMET Standard Terms of Use
description:
Areas of absolute stability, neutral stability, instability, and conditional instability shown on a tephigram
|
credits:
LeMone/NCAR
copyright terms:
COMET Standard Terms of Use
description:
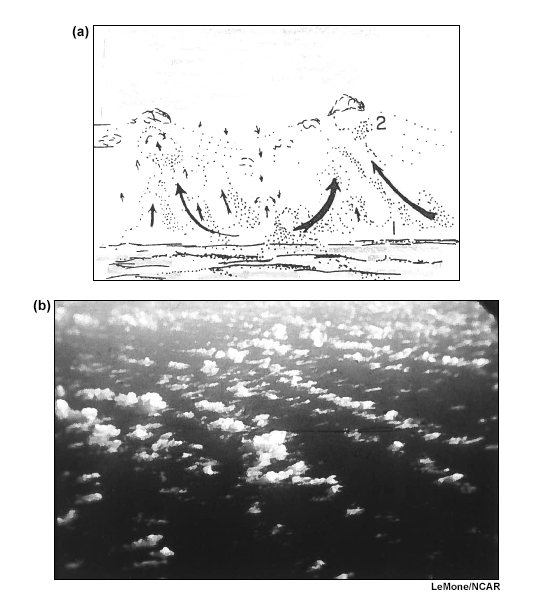
Cloud street or horizontal rolls over the Caribbean south of Puerto Rico (a) Schematic of kinematic flow (b) Photograph from 8000 m (Courtesy of Margaret LeMone, NCAR)
|
credits:
LeMone/NCAR
copyright terms:
COMET Standard Terms of Use
description:
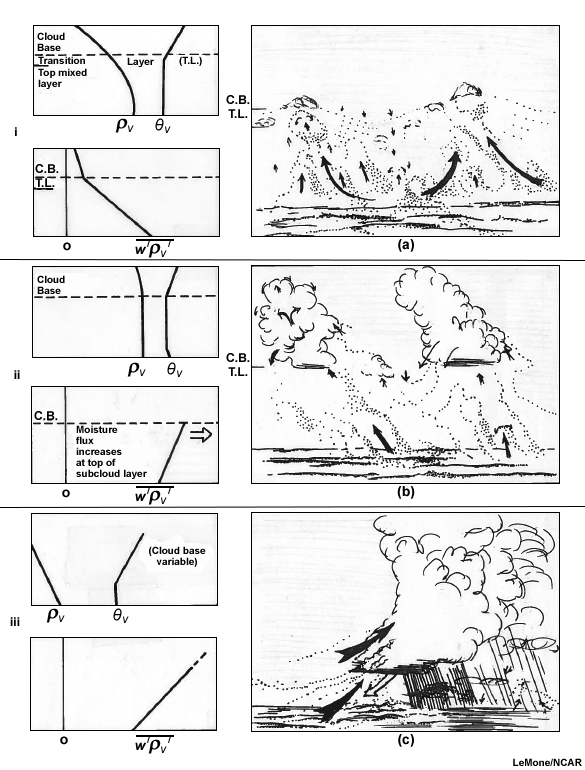
Variations in the sub-cloud thermodynamic structure and eddy moisture flux with increasing convective intensity and cloud cover (Courtesy of Margaret LeMone, NCAR)
|
credits:
Moeng/NCAR
copyright terms:
COMET Standard Terms of Use
description:
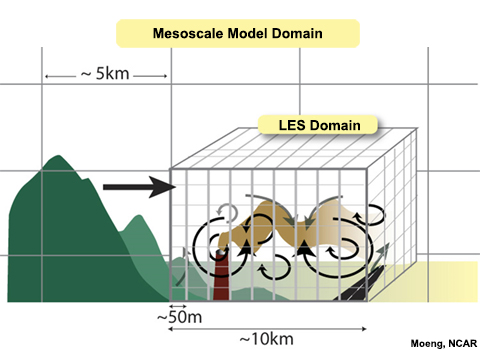
Example of how a large eddy simulation could be nested within a mesoscale model (courtesy of Chin-Hoh Moeng/NCAR)
|
credits:
Mechoso et al. 2014
copyright terms:
COMET Standard Terms of Use
description:
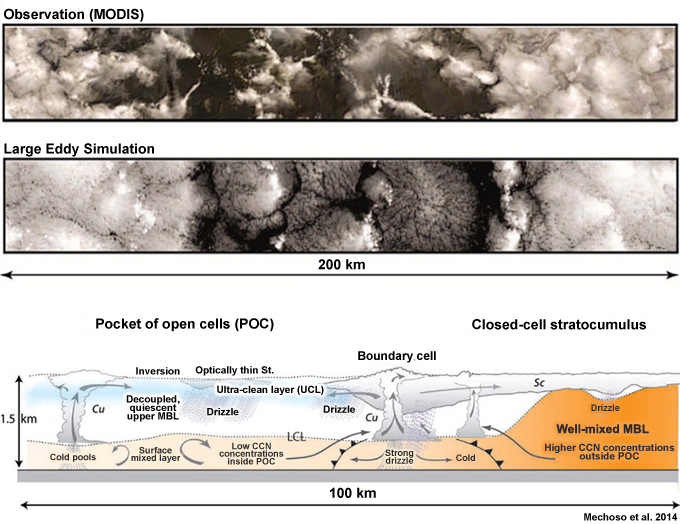
Observed cloud pattern, the corresponding large eddy simulation (LES) visible reflectance, and a schematic of the vertical structure of flows and CCN interactions in the trade wind boundary layer between pockets of open cells and closed cell stratocumulus. (Mechoso et al. 2014)
|
credits:
Adapted from Bonner and Paegle 1970
copyright terms:
COMET Standard Terms of Use
description:
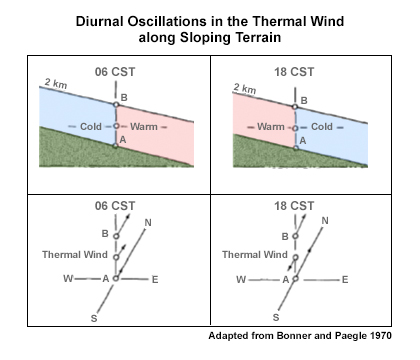
Conceptual representation of diurnal oscillations in the thermal wind along sloping terrain
|
credits:
Bjorn Stevens
copyright terms:
COMET Standard Terms of Use
description:
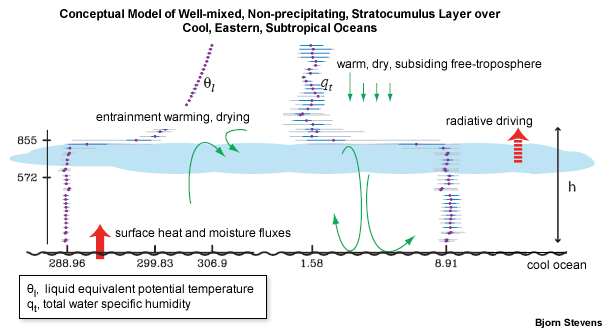
Cartoon of well-mixed, non-precipitating, stratocumulus layer, overlaid with data from research flight near 30?N, 120?W. Plotted are the full range, middle quartile, and mean of liquid equivalent potential temperature, ?l , specific humidity, qt , and ql from all the data over the target region. Heights of cloud base and top are indicated on the left. (Courtesy of Dr. Bjorn Stevens)
|
![Composite for undisturbed days in the Amazon region. The upper plot shows contours of virtual potential temperature, v, as measured by the tethered balloon. Observed mixed layer heights are marked with a plus for the tethered balloon and a box for the rawinsonde sounding. The nocturnal stable layer top is marked with an asterisk. The lower three graphs show time series of the heat flux, temperature T, moisture flux, specific humidity q, incoming solar radiation flux, Rs, net radiation flux Rn, and rainfall, all measured at the micrometeorological level. The sensible heat and latent heat fluxes were measured at the 40-m level; the other parameters were measured at the 45-m level. SR and SS are approximate sunrise and sunset. [Martin et al. 1988, JGR]](media/graphics/mixed_layer_amazon_martinetal1988.jpg)
credits:
Martin et al. 1988
copyright terms:
COMET Standard Terms of Use
description:
Composite for undisturbed days in the Amazon region. The upper plot shows contours of virtual potential temperature, v, as measured by the tethered balloon. Observed mixed layer heights are marked with a plus for the tethered balloon and a box for the rawinsonde sounding. The nocturnal stable layer top is marked with an asterisk. The lower three graphs show time series of the heat flux, temperature T, moisture flux, specific humidity q, incoming solar radiation flux, Rs, net radiation flux Rn, and rainfall, all measured at the micrometeorological level. The sensible heat and latent heat fluxes were measured at the 40-m level; the other parameters were measured at the 45-m level. SR and SS are approximate sunrise and sunset. [Martin et al. 1988, JGR]
|
![(a) Temperature in °C, (b) wind speed in m s-1 for 10-20 September 1992; measured by tethersondes over Namibia; X axis: Local Standard Time; Y axis: Height above ground in m. [Zunckel et al. 1996]](media/graphics/mixed_layer_dry_tropics.jpg)
credits:
Zunckel et al. 1996
copyright terms:
COMET Standard Terms of Use
description:
(a) Temperature in °C, (b) wind speed in m s-1 for 10-20 September 1992; measured by tethersondes over Namibia; X axis: Local Standard Time; Y axis: Height above ground in m. [Zunckel et al. 1996]
|
credits:
Greco et al. 1992
copyright terms:
COMET Standard Terms of Use
description:
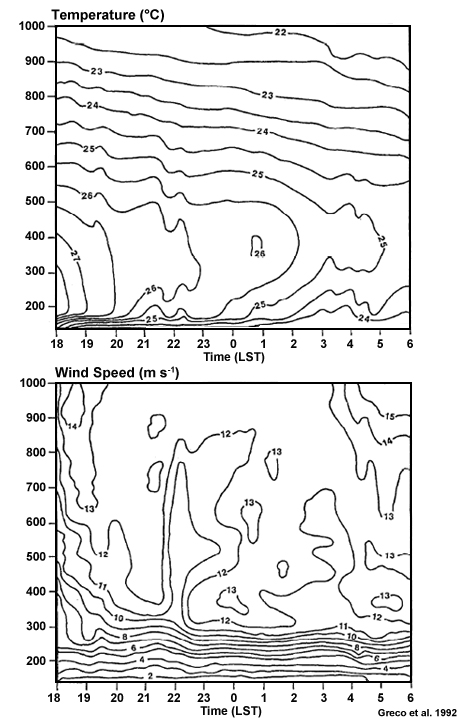
Sunset to sunrise time-height contours of temperature and wind speed in the boundary layer over central Amazon Basin, 30-31 July 1985. Greco et al. 1992.
|
![Mixed Layer Before and After Tropical Disturbance [Fitzgarrald and Garstang 1981]](media/graphics/mixedlayer_before_after_disturb.jpg)
credits:
Fitzgarrald and Garstang 1981
copyright terms:
COMET Standard Terms of Use
description:
Mixed Layer Before and After Tropical Disturbance [Fitzgarrald and Garstang 1981]
|
credits:
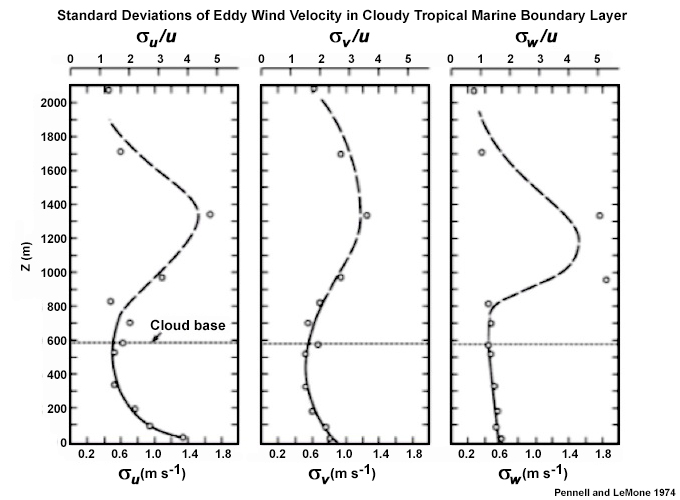
Pennell and LeMone 1974
copyright terms:
COMET Standard Terms of Use
description:
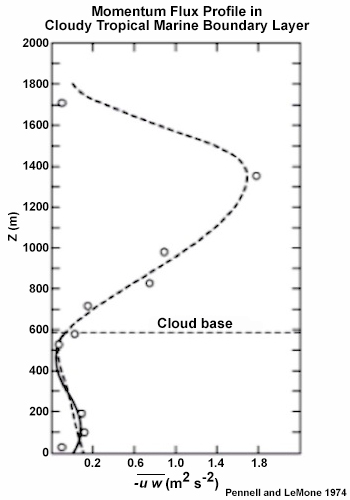
Momentum flux as a function of height for cloudy regions over the tropical Atlantic
|
credits:
LeMone and Pennell 1974
copyright terms:
COMET Standard Terms of Use
description:
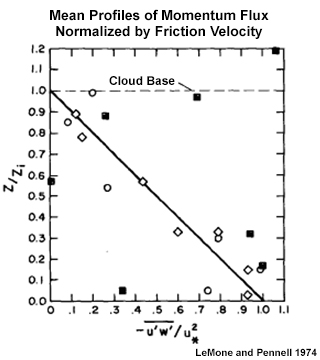
Mean profiles of zonal momentum flux, -(u' w^ ) ?, normalized by friction velocity, u*2 for observations during GATE. Cases of few or no clouds are diamonds; scattered shallow cumulus are open circle; black squares are more active scattered-broken trade cumulus. (Reprinted from LeMone and Pennell 1974 with permission of the AMS)
|

credits:
NASA/The COMET Program
copyright terms:
COMET Standard Terms of Use
description:
Global Satellite IR image at 1200 UTC 22 Aug 2014 showing a belt of intermittent deep convection in the equatorial trough flanked by broad areas of shallow stratocumulus and cumulus from the tropics to the subtropics
|
credits:
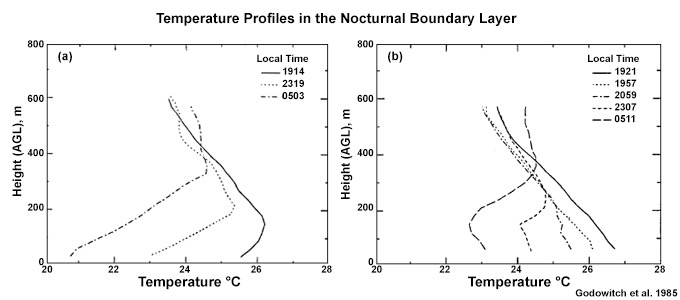
Godowitch et al. 1985
copyright terms:
COMET Standard Terms of Use
description:
Profiles showing the diurnal cycle of temperature near the surface over land for urban and non-urban regions
|
|
|
![Diurnal cycle of wind speed relative to height measured from a tower in Oklahoma City and averaged during June 1966 to May 1967.[Crawford and Hudson 1973]](media/graphics/pbl_wind_diurnal_cyc.jpg)
credits:
Adapted from Crawford and Hudson 1973
copyright terms:
COMET Standard Terms of Use
description:
Diurnal cycle of wind speed relative to height measured from a tower in Oklahoma City and averaged during June 1966 to May 1967.[Crawford and Hudson 1973]
|
credits:
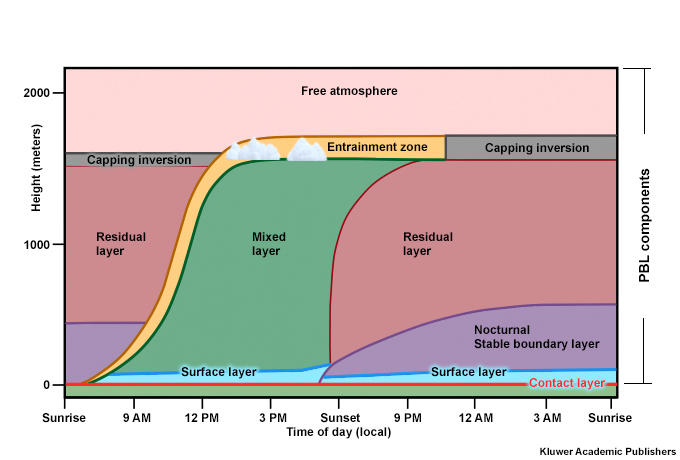
Kluwer Academic Publishers
copyright terms:
COMET Standard Terms of Use
description:
Graphic representation of components that can constitute the PBL over a diurnal cycle
|
credits:
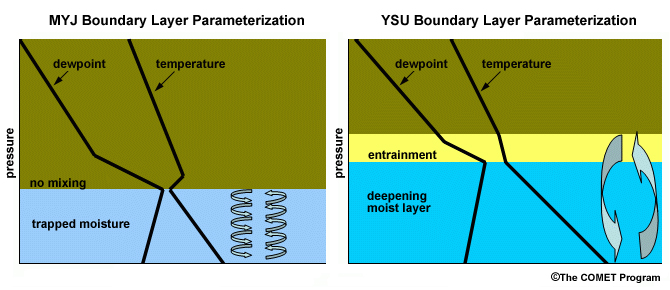
(c) The COMET Program
copyright terms:
COMET Standard Terms of Use
description:
Schematics depicting the MYJ and YSU boundary layer mixing parameterization processes.
|
![Graphs of the diurnal cycle of surface heat budget components over land - part of a question [USDA]](media/graphics/quest_sfc_budget_diurnal_a.jpg)
credits:
USDA
copyright terms:
COMET Standard Terms of Use
description:
Graphs of the diurnal cycle of surface heat budget components over land - part of a question [USDA]
|
![Graphs of the diurnal cycle of surface heat budget components over land - part of a question [USDA]](media/graphics/quest_sfc_budget_diurnal_b.jpg)
credits:
USDA
copyright terms:
COMET Standard Terms of Use
description:
Graphs of the diurnal cycle of surface heat budget components over land - part of a question [USDA]
|
|
credits:
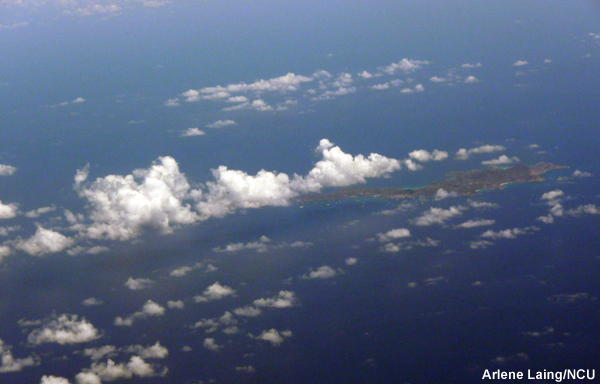
Arlene Laing/NCU
copyright terms:
COMET Standard Terms of Use
description:
Photograph of small island and clouds (Credit, Arlene Laing)
|
credits:
(c) The COMET Program
copyright terms:
COMET Standard Terms of Use
description:
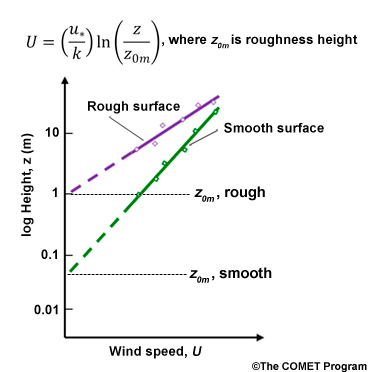
Logarithmic wind profiles for rough and smooth surfaces, the roughness heights are identified where the lines cross zero.
|
![Evaluation of the diurnal cycle of precipitation, surface thermodynamics, and surface fluxes from observations in Amazonia [Betts et al. 2002, JGR]](media/graphics/sfc_flux_diurnal_cycle.jpg)
credits:
Betts et al. 2002
copyright terms:
COMET Standard Terms of Use
description:
Evaluation of the diurnal cycle of precipitation, surface thermodynamics, and surface fluxes from observations in Amazonia [Betts et al. 2002, JGR]
|
![Surface Latent Heat Flux during (upper) January and (lower) July [From Atlas of Surface Marine Data, NOAA/NODC, DaSilva et al. 1994]](media/graphics/sfc_lh_seasonal.jpg)
credits:
DaSilva et al. 1994
copyright terms:
COMET Standard Terms of Use
description:
Surface Latent Heat Flux during (upper) January and (lower) July [From Atlas of Surface Marine Data, NOAA/NODC, DaSilva et al. 1994]
|
credits:
(C)The COMET Program
copyright terms:
COMET Standard Terms of Use
description:
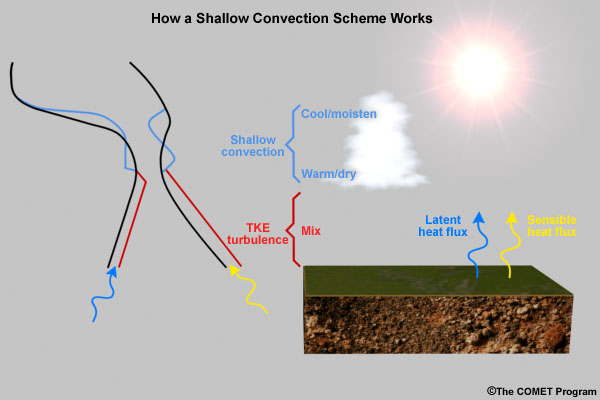
This is a cartoon of how shallow convection schemes work. On the right are the physical processes involved: sensible and latent heat fluxes from the earth's surface serve to create and then heat and moisten the planetary boundary layer (PBL) through mechanical turbulence driven by vertical wind shear and buoyant eddies driven by horizontal differences in temperature and moisture. Numerical Weather Prediction (NWP) models either assume a vertical profile of mixing or directly calculate Turbulent Kinetic Energy (TKE) to determine the depth of the PBL. At the top of the PBL, either the PBL scheme is extended into the layers above the PBL to vent heat and moisture into the free atmosphere, or a separate shallow convection parameterization is employed. The shallow convection scheme emulates the effect of non-precipitating cumulus clouds by moistening and cooling layers near the tops of these non-precipitating model cumulus clouds, and warming and drying the layers near the bases of these clouds.
The left side illustrates the effects on the temperature and moisture in the PBL and the adjacent layers above it. Initial temperature and dewpoint profiles are in black. During the day, sensible and latent heat from the surface increase the temperature and dewpoint of the PBL, shifting both profiles to the right. At the top of the PBL, shallow convection acts to warm and dry the adjacent layers to the PBL top, shifting the temperature profile further right and the dewpoint profile to the left, essentially capping the PBL. Meanwhile, near the top of the model-determined shallow cumulus clouds, air is cooling and moistening, shifting the temperature curve left and the dewpoint curve right. This creates another inversion at the top of the shallow cumulus layer.
|
credits:
(C)The COMET Program
copyright terms:
COMET Standard Terms of Use
description:
Schematic showing changes in the surface energy budget components (sensible heat, latent heat, solar radiation and longwave radiation) and surface-to-air interactions (convection/turbulence) as soil moisture changes from dry to wet conditions (left to right).
|
credits:
(c) The COMET Program
copyright terms:
COMET Standard Terms of Use
description:
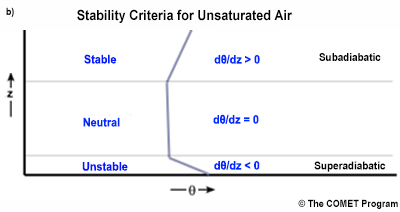
Stability criteria for unsaturated air based on the vertical gradient of the potential temperature, ?.
|
credits:
Pennell and LeMone 1974
copyright terms:
COMET Standard Terms of Use
description:
Vertical profiles of the standard deviations of u',v',and w' as a function of height for cloudy regions over the tropical Atlantic. The sampling times are not adequate to establish profiles above cloud base (Reprinted from Pennell and LeMone 1974 with permission of the AMS)
|
![Climatological frequency of ordinary stratocumulus during daytime from (top) Jun - Aug and (bottom) Dec Feb. Contour interval is 5%. Shading indicates frequency above 10% (light) and 20% (dark).[Norris 1998, AMS]](media/graphics/strato_cu_distrib.jpg)
credits:
Norris 1998
copyright terms:
COMET Standard Terms of Use
description:
Climatological frequency of ordinary stratocumulus during daytime from (top) Jun - Aug and (bottom) Dec Feb. Contour interval is 5%. Shading indicates frequency above 10% (light) and 20% (dark).[Norris 1998, AMS]
|
credits:
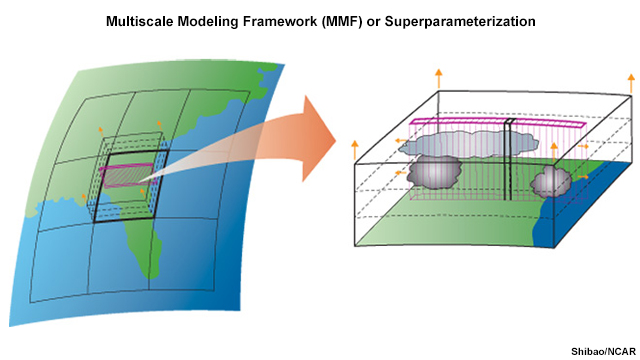
Shibao/NCAR
copyright terms:
COMET Standard Terms of Use
description:
Schematic showing how a cloud-system resolving model (CSRM) is embedded within a global model for superparameterization (Shibao, NCAR based on information from CMMAP).
|
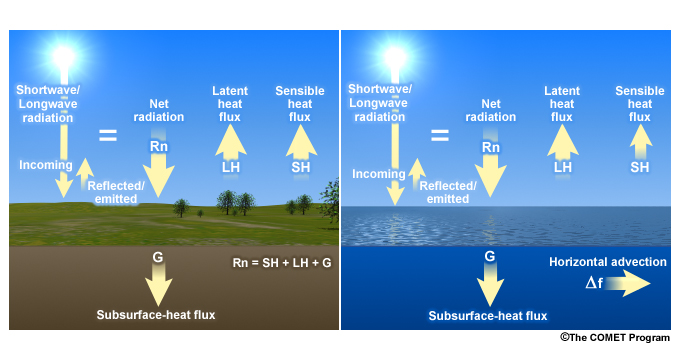
credits:
The COMET Program
copyright terms:
COMET Standard Terms of Use
description:
Surface energy budget components for ocean and land areas.
|
credits:
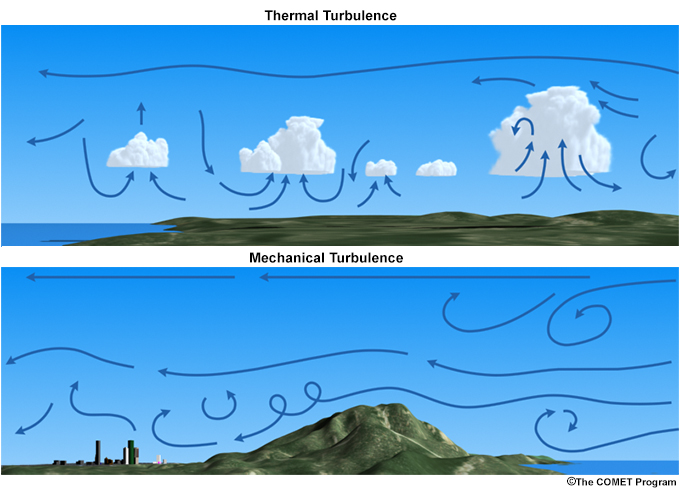
(c) The COMET Program
copyright terms:
COMET Standard Terms of Use
description:
Conceptual figures showing mechanical and thermal (convective) turbulence.
|
credits:
Patton NCAR/ The COMET Program
copyright terms:
COMET Standard Terms of Use
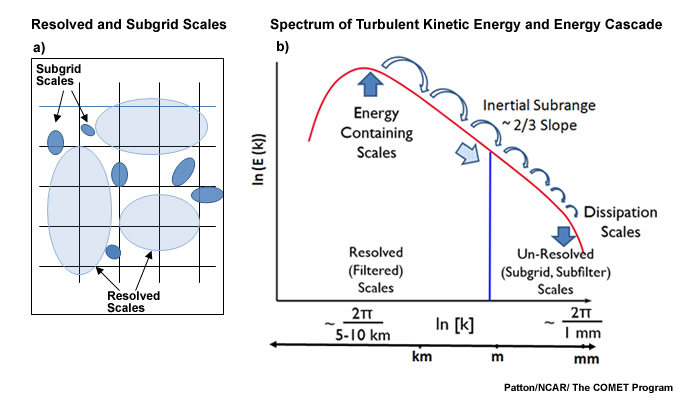
description:
(left) Schematic of the physical differences between resolved and sub-grid structures and (right) spectrum of turbulent kinetic energy and the energy cascade. The blue line marks the delimiting line between the LES resolved scale and the sub-filtered scale. (Patton/NCAR)
|
![(left) Height of the trade wind inversion base over the Atlantic, from observations during the 1925-27 Meteor I expedition (von Ficker 1936) (right) Height of the base of the trade wind inversion over the Caribbean for April [Schubert et al. 1995, based on observations from Von Ficker (1936) and Gutnick (1958)]](media/graphics/trade_wind_inv_base_clim.jpg)
credits:
Schubert et al. 1995
copyright terms:
COMET Standard Terms of Use
description:
(left) Height of the trade wind inversion base over the Atlantic, from observations during the 1925-27 Meteor I expedition (von Ficker 1936) (right) Height of the base of the trade wind inversion over the Caribbean for April [Schubert et al. 1995, based on observations from Von Ficker (1936) and Gutnick (1958)]
|
![Schematic of vertical profile of the trade wind inversion, from west to east across the tropical oceans based on field observations [Schubert et al. 1995]](media/graphics/trade_wind_inv_obs_concept.jpg)
credits:
Schubert et al. 1995
copyright terms:
COMET Standard Terms of Use
description:
Schematic of vertical profile of the trade wind inversion, from west to east across the tropical oceans based on field observations [Schubert et al. 1995]
|
credits:
Mechoso et al. 2014
copyright terms:
COMET Standard Terms of Use
description:
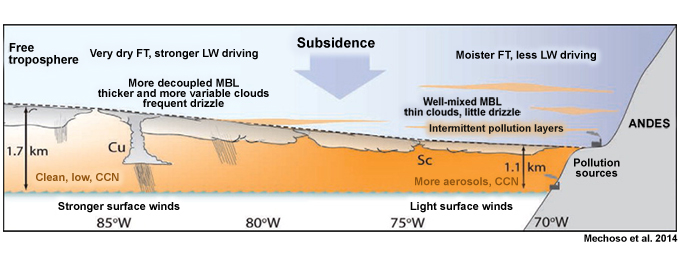
Conceptual model of the stratocumulus topped boundary layer transition to deeper cumulus layer and changes in the aerosol (cloud condensation nuclei, CCN), marine stratocumulus (Sc)/cumulus (Cu), and precipitation along 20°S over the tropical southeast Pacific (Mechoso et al. 2014)
|
credits:
Augstein et al. 1973
copyright terms:
COMET Standard Terms of Use
description:
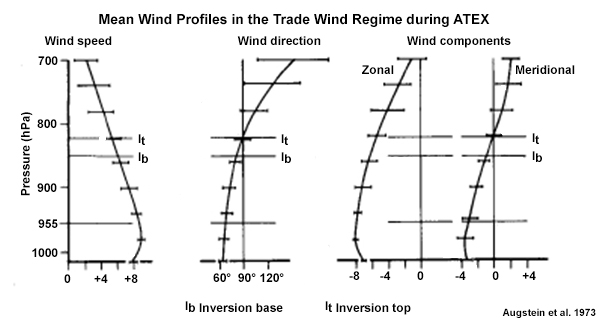
Vertical profile of mean wind speed, direction and wind components during ATEX period. Ib denotes the bottom of the inversion while It marks the top of the inversion. The bars indicate the standard deviation of the averaging done between Feb 7-12, 1969 (Augstein et al. 1973)
|
credits:
Grindinger 1992
copyright terms:
COMET Standard Terms of Use
description:
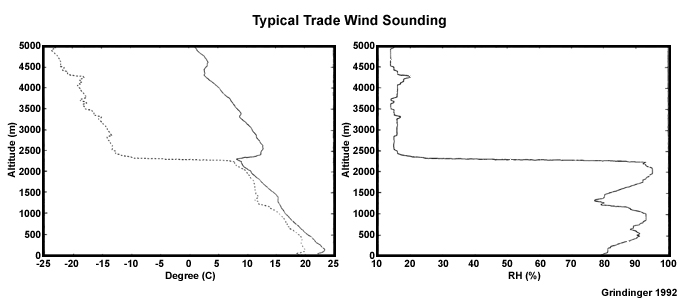
Typical trade wind regime sounding with inversion, measured at Hilo, Hawaii during summer 1991.
|
credits:
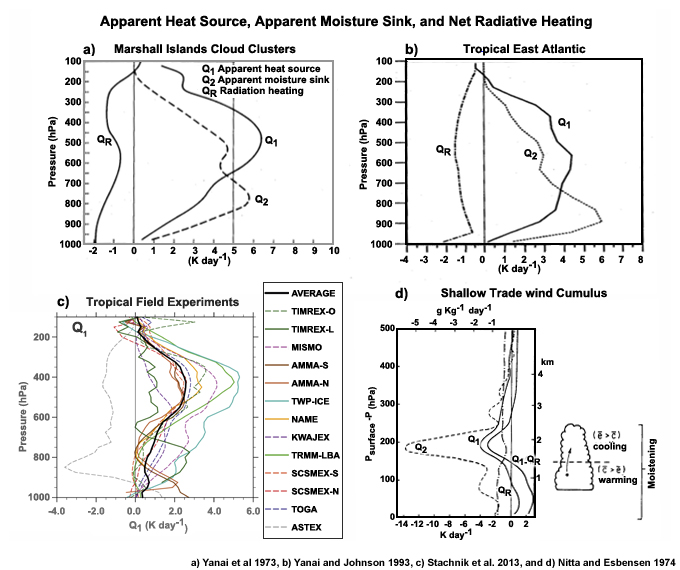
Yanai et al 1973, Yanai and Johnson 1993, Stachnik et al. 2013, Nitta and Esbensen 1974
copyright terms:
COMET Standard Terms of Use
description:
Apparent heat source, moisture sink, and radiative heating profiles for deep convection in the Tropical Pacific (Yanai et al. 1973), Tropical Atlantic (Yanai and Johnson 1993), various regions of the tropics (Stachnik et al. 2013), and shallow convection (Nitta and Esbensen 1974).
|
credits:
NCAR
copyright terms:
COMET Standard Terms of Use
description:
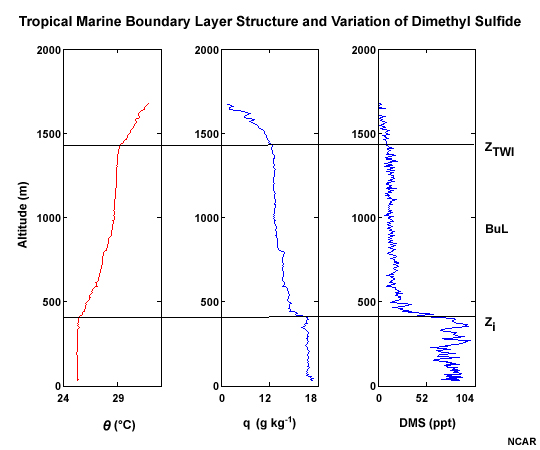
Thermodynamic structure and typical variation of dimethyl sulfide (DMS) in the tropical marine boundary layer and overlying buffer layer. zi is the mean height of the weak MBL inversion and zTWI denotes the stronger trade wind inversion aloft. Horizontal axes are potential temperature, water vapor, and DMS respectively.(NCAR/MMM)
|
credits:
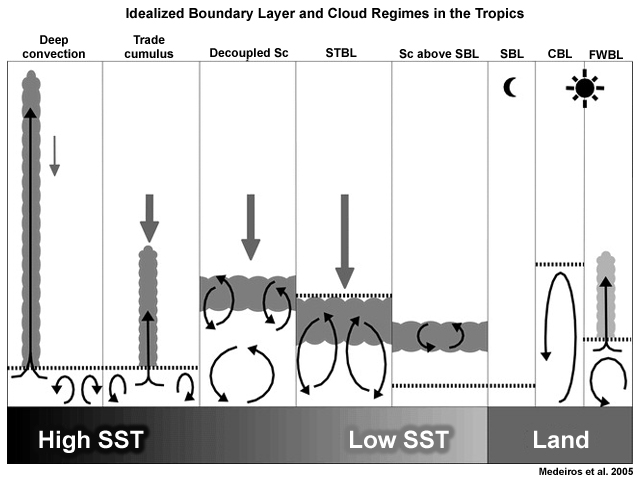
Medeiros et al. 2005
copyright terms:
COMET Standard Terms of Use
description:
Schematics of several idealized ABL regimes and associated free atmosphere and cloud layers. From left to right: deep convection, trade wind cumulus (Cu), stratocumulus (Sc) decoupled from the sub-cloud layer, stratocumulus-topped boundary layer (STBL), stratocumulus overlying a stable boundary layer (SBL), two clear boundary layers (convective and stable), and a fair-weather cumulus boundary layer (FWBL) with a convective sub-cloud layer and a cumulus cloud layer (Medeiros et al. 2005)
|
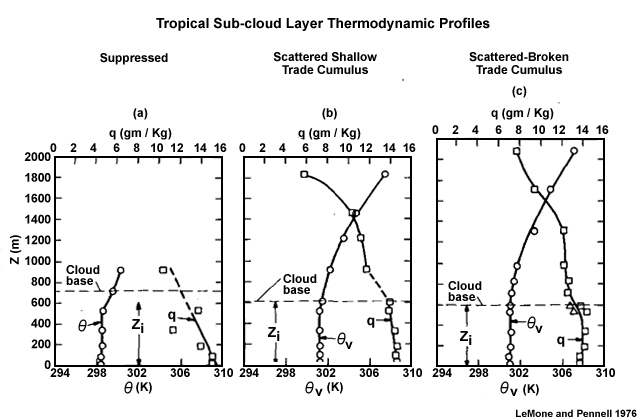
credits:
LeMone and Pennell 1976
copyright terms:
COMET Standard Terms of Use
description:
Mean virtual potential temperature and mixing ratio profiles for (a) suppressed region with almost no clouds (b) scattered shallow trade cumulus and (c) scattered to broken trade cumulus (LeMone and Pennell 1976)
|
credits:
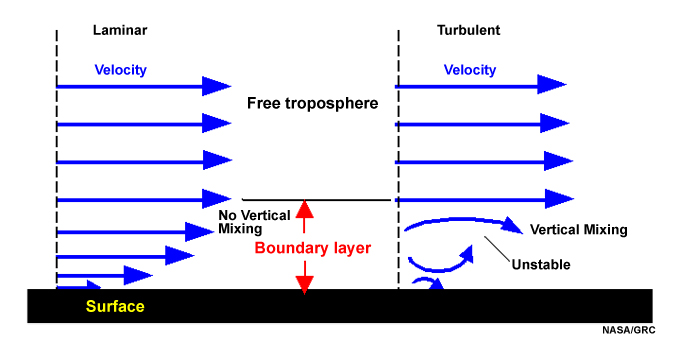
NASA/GRC
copyright terms:
COMET Standard Terms of Use
description:
Conceptual figures showing laminar and turbulent flow above a boundary.
|
|
credits:
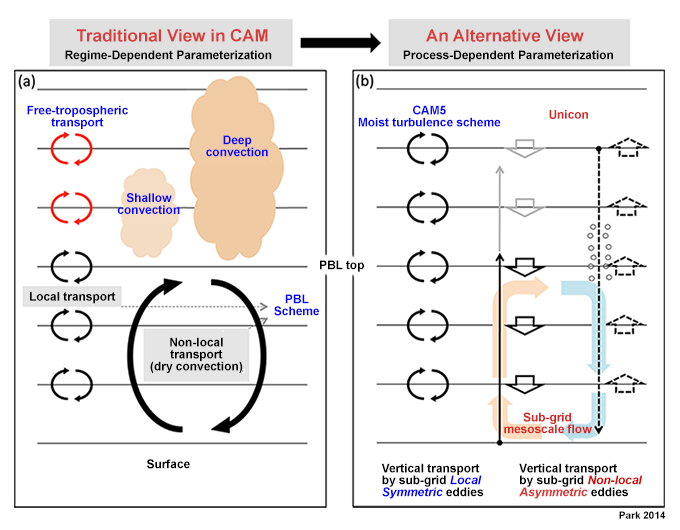
Park 2014
copyright terms:
COMET Standard Terms of Use
description:
Vertical transport from sub-grid process in (a) the traditional configuration in CAM where subgrid ABL transport is done by the ABL scheme and local transport above the ABL is independent of the ABL scheme and depended on the local Richardson number. Non-local transport is done by shallow and deep convection schemes. (b) The approach adopted by UNICON with CAM5. The alternative approach has local transport is by a CAM moist turbulence scheme for all layers. Non-local transport is done by UNICON, including sub-grid convective updrafts from the surface (starts out unsaturated but becomes saturated above the LCL (thin upward-pointing solid arrow with black (dry) and gray (saturated) colors, with compensating subsidence depicted by thick downward-pointing solid arrow). Convectively generated sub-grid downdrafts can penetrate the ABL (thin downward-pointing dashed arrow) when subject to sufficient cooling from evaporation of convective precipitation. The compensating upward motion, driven by the cool downdrafts, is marked by thick upward-pointing dashed arrows. Black horizontal lines denote the model interfaces in each plot. (Park 2014, JAS)
|

credits:
Dickinson 1984
copyright terms:
COMET Standard Terms of Use
description:
Conceptual figures showing processes at the interface of the atmosphere and the vegetated land surface
|
credits:
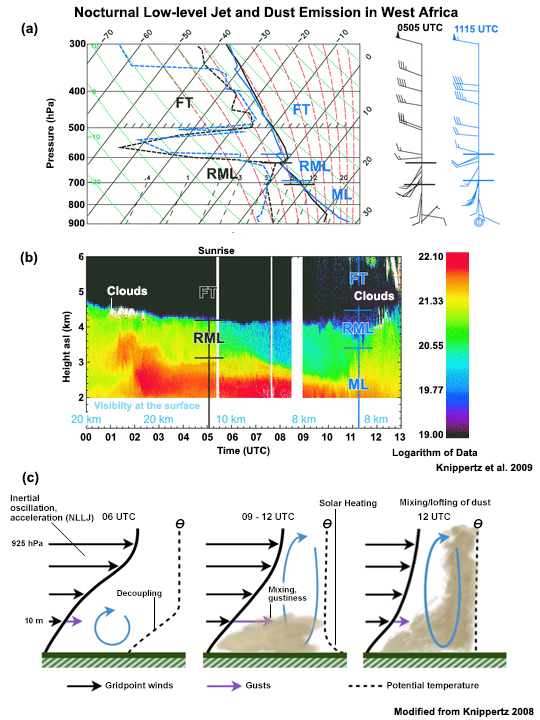
Panels (a) and (b) are Knippertz et al. 2009, Panel (c) Modified from Knippertz 2008
copyright terms:
COMET Standard Terms of Use
description:
Nocturnal LLJ and momentum transport contribution to gustiness and vertical mixing of Saharan dust during the morning. Panels (a) and (b) are from Knippertz et al. 2008, Tellus A. Panel (c) is courtesy of Peter Knippertz.
|
credits:
Modified from Knippertz (2008)
copyright terms:
COMET Standard Terms of Use
description:
Nocturnal LLJ and momentum transport contribution to gustiness and vertical mixing of Saharan dust during the morning. Courtesy of Peter Knippertz.
|
credits:
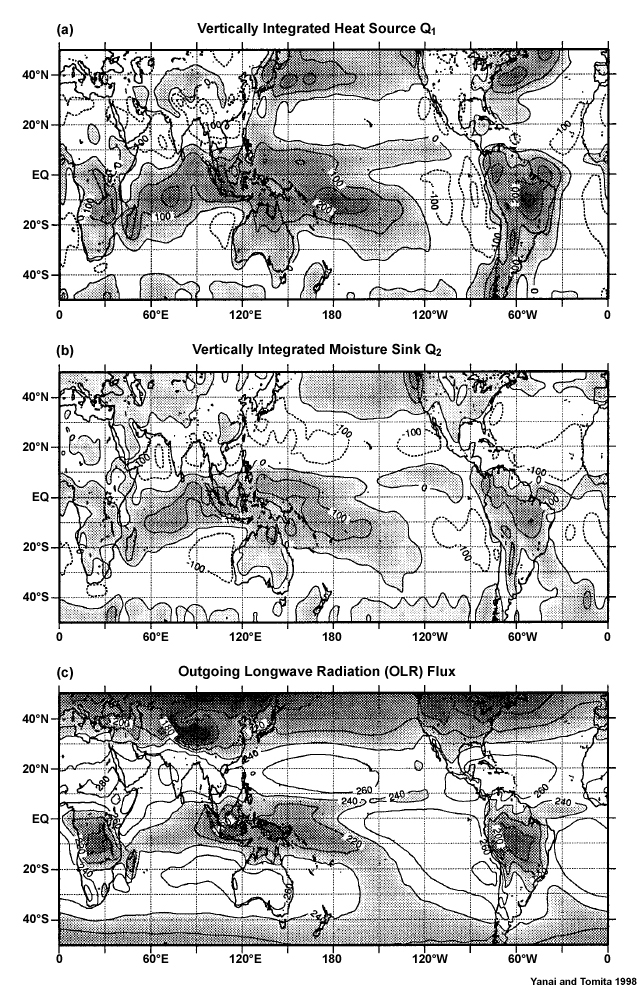
Yanai and Tomita 1998
copyright terms:
COMET Standard Terms of Use
description:
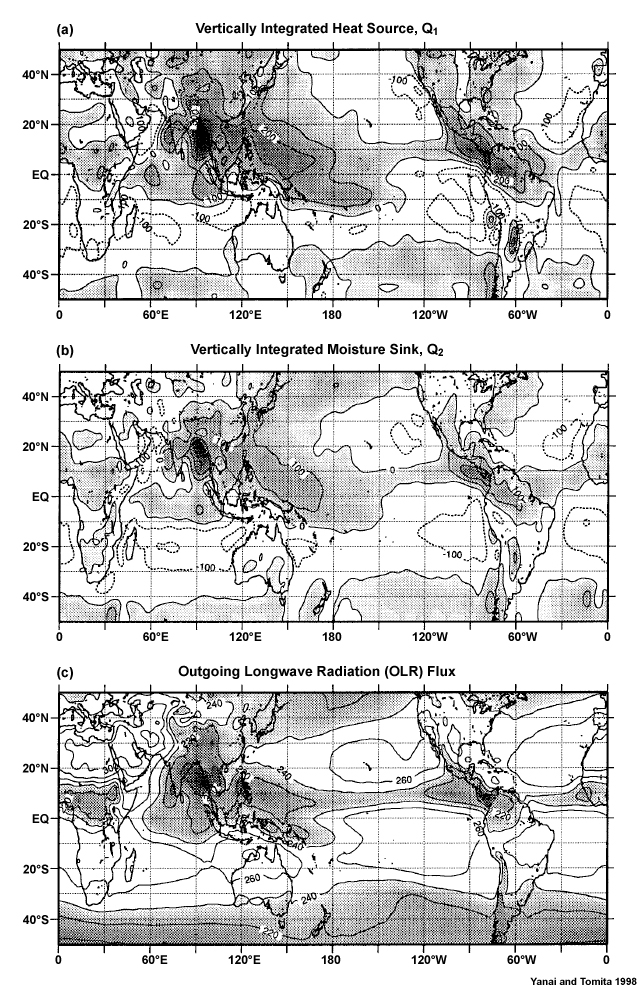
Global distributions of the 15-yr mean (198094) (a) vertically integrated heat source ; (b) vertically integrated moisture sink ; and (c) OLR flux, QR (units: W m-2) for northern winter (DecemberFebruary). (Yanai and Tomita 1998)
|
credits:
Yanai and Tomita 1998
copyright terms:
COMET Standard Terms of Use
description:
Global distributions of the 15-yr mean (198094) (a) vertically integrated heat source ; (b) vertically integrated moisture sink ; and (c) OLR flux, QR (units: W m-2) for northern summer (JuneAugust). (Yanai and Tomita 1998)
|
credits:
LeMone 1983
copyright terms:
COMET Standard Terms of Use
description:
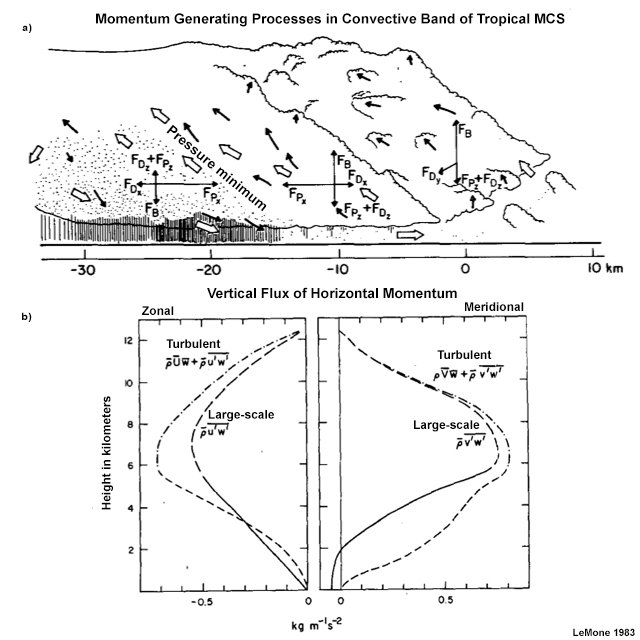
(a) Conceptual diagram of momentum generating processes in the leading convective band of a squall line. FP, FB, and FD are forces on an air parcel due to mesoscale pressure gradient, buoyancy, and drag, respectively. Horizontal and vertical components are identified by subscripts x and z, respectively. (b) Profiles of vertical flux of horizontal momentum by the convective line (? ?(u' w' ) ?and ? ?(v' w' ) ?, solid and dashed lines) and the large-scale flow (? ?U ?w ? and ? ?V ?w ?, dashed and dot-dashed lines) in a 140 km plane perpendicular to the squall line depicted in (a). (LeMone 1983)
|
credits:
Data courtesy NOAA/The COMET Program
copyright terms:
COMET Standard Terms of Use
description:
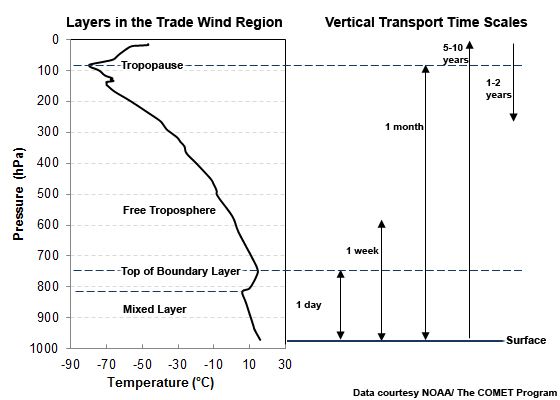
Layers of the trade wind region and mean time scales for vertical transport in those layers.
|
credits:
NOAA/PNNL
copyright terms:
COMET Standard Terms of Use
description:
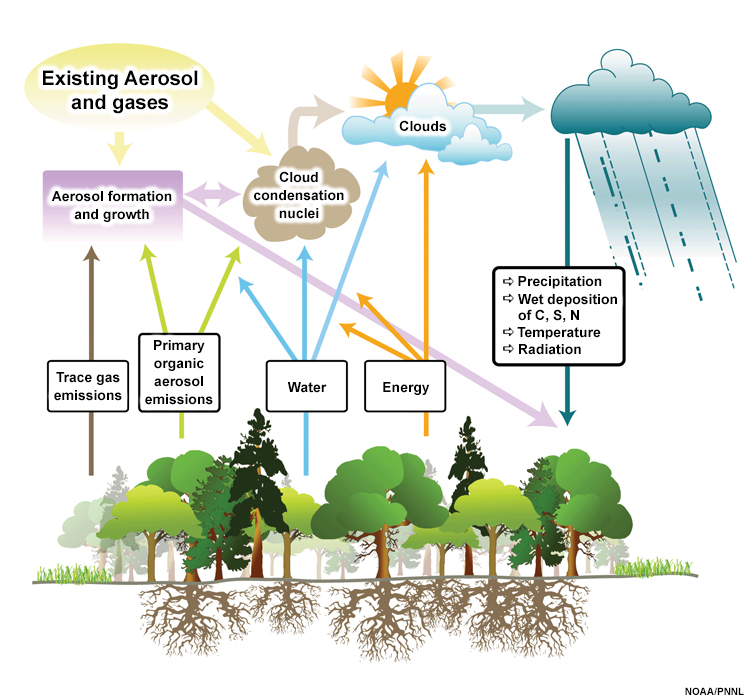
Schematic of major atmospheric processes with trace gases and biogenic aerosols (PNNL).
|