Introduction
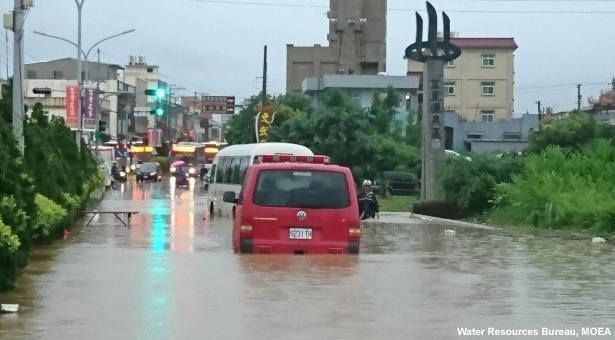
Flooding due to a Mei-Yu precipitation event on June 1, 2017.
The COMET lesson Mei-Yu Front, Part 1: Ingredients for Heavy Precipitation and the Forecast Process in Taiwan discusses the ingredients for heavy Mei-Yu precipitation and the two types of Mei-Yu precipitation events across Taiwan. A Type-1 event is characterized by linear convection near the Mei-Yu front that produces heavy rain in the plains and mountainous areas of Taiwan. A Type-2 event is characterized by orographically-induced convection that produces heavy rain mostly in the mountainous areas of Taiwan. In this lesson, we will learn how to use satellite and radar observations and model guidance to determine the short-term trend in the Mei-Yu front’s movement and associated convective intensity. These techniques can be applied during both Type-1 and Type-2 Mei-Yu precipitation events.
It is highly recommended that students review the COMET lessons “Satellite Feature Identification: Inferring Three Dimensions from Water Vapour Imagery” and "Satellite Feature Identification: Conveyor Belts" before attempting this lesson. Let’s begin by discussing the factors that impact the movement and convective intensity of the Mei-Yu front.
Factors Affecting Mei-Yu Front Movement and Convective Intensity
Question
A Mei-Yu front has been stationary for the past 12 hours, but has started to move south. What could be causing the front to move south? Choose the best answer.
The correct answer is a.
Low-level cold air advection behind the front could contribute to the southward movement of the Mei-Yu front. Atmospheric research studies of the Mei-Yu front have found that the front’s movement may be influenced by horizontal temperature advection and/or frontogenesis. Let’s look at each one of these factors in more detail.
Frontal Movement Influenced By Horizontal Temperature Advection
Mei-Yu front systems are usually very shallow and their movement is often driven by low-level temperature advection perpendicular to the front. Mei-Yu fronts, driven by the cold airflow behind, generally move slowly southward or southeastward. The fronts may slow down, become stationary, or retreat north depending on how strong the horizontal temperature advection is on either side of the front. For example, cold airflow behind a Mei-Yu front will likely drive the front south. However, if the cold airflow behind the front weakens or turns nearly parallel to the front, the front may slow down or become stationary. If southerly flow ahead of a Mei-Yu front becomes stronger than the northerly flow behind, the front is likely to move north. For example, barrier jets can bring strong southerly flow that can affect the front’s movement.
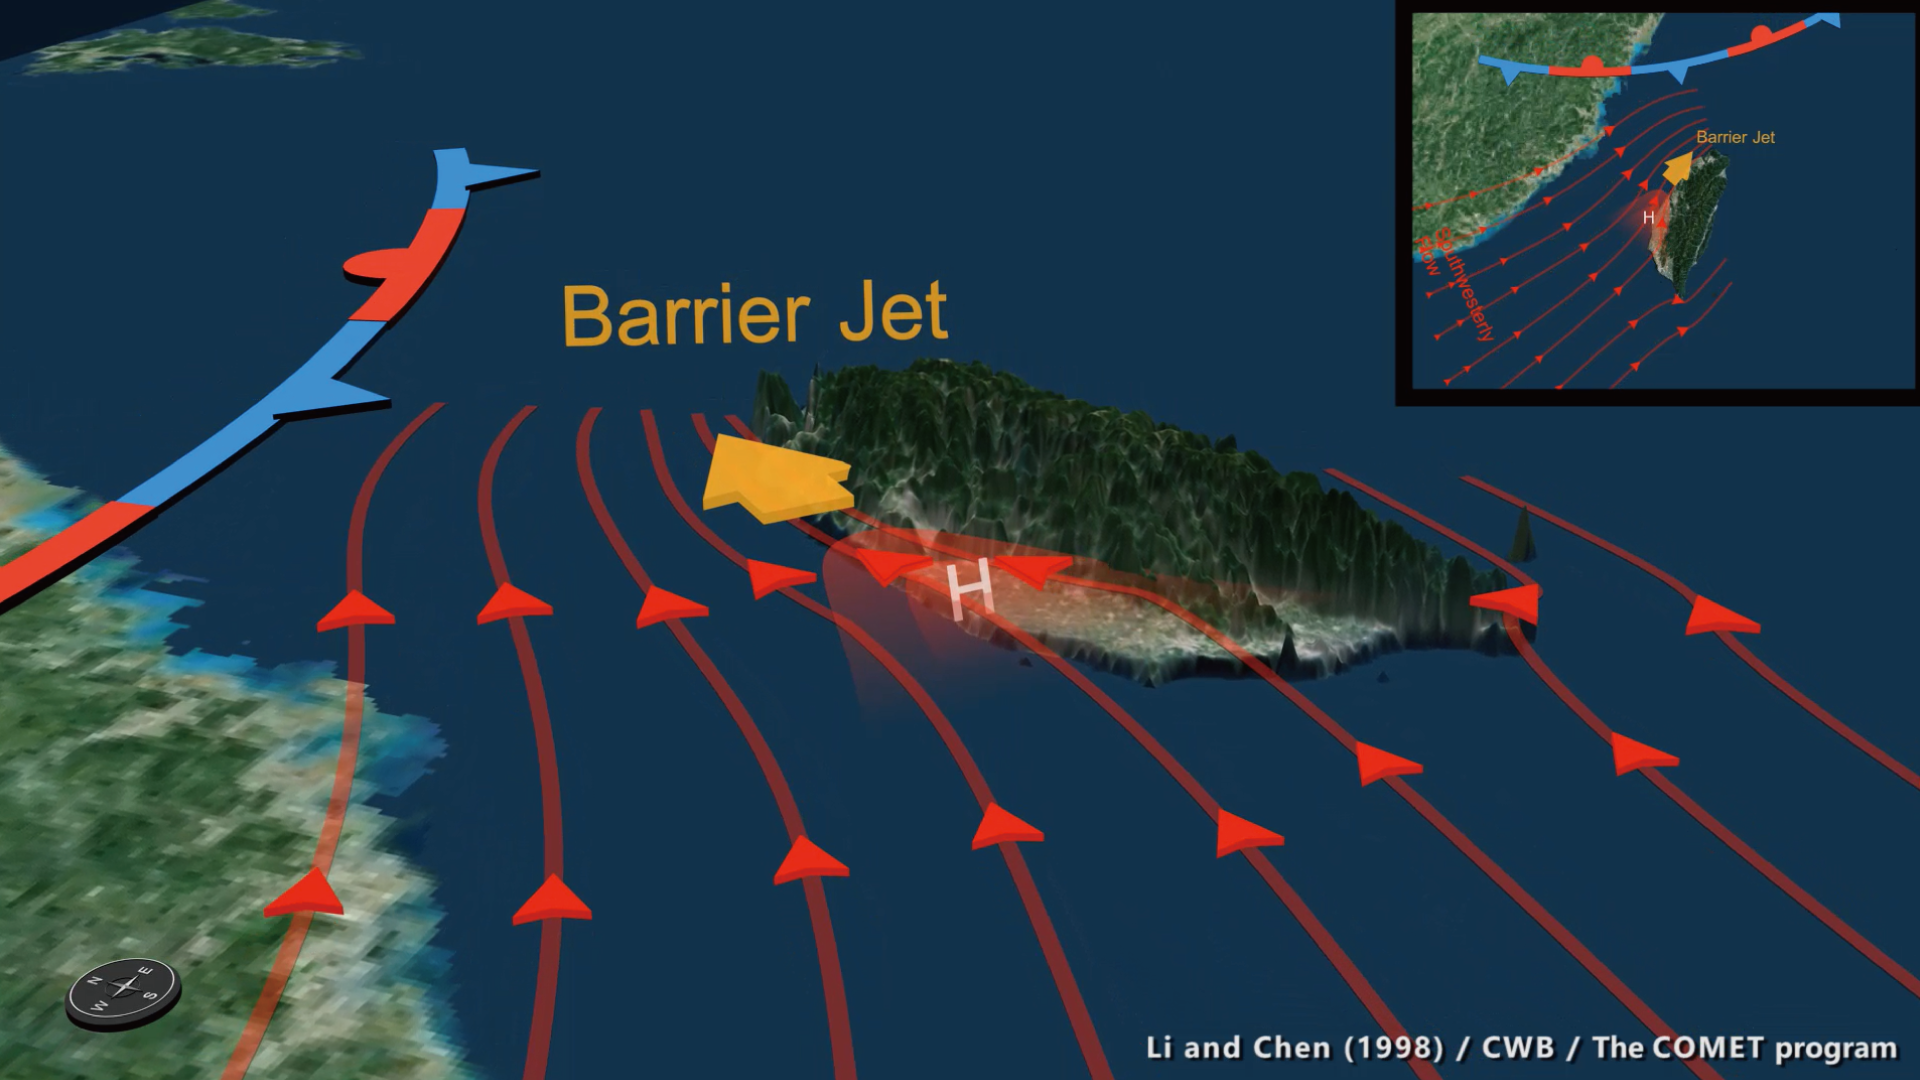
A conceptual animation showing the formation of the barrier jet. Streamlines with red arrows indicate southwesterly flow associated with a low-level jet, the bold arrow indicates the barrier jet, and the stationary front represents the Mei-Yu front. As the front approaches Taiwan from the north, the front usually splits into two branches (one to the east of Taiwan and one to the west) due to the island’s topography. Animation inspired by Figures 6 and 10 in Li and Chen (1998).
A southwesterly low-level jet (LLJ; winds exceeding 25 kts) often forms to the south of the Mei-Yu front during the Mei-Yu season. As the southwesterly flow approaches Taiwan and is blocked by the Central Mountain Range, an orographically-induced high pressure ridge develops on the windward side of the mountains. The high pressure contributes to a strong pressure gradient force (pointing northward) that allows the deflected flow to accelerate northward along the western coast, resulting in a barrier jet over northwestern Taiwan. This barrier jet can push against the Mei-Yu front, and prevent the front from migrating southward or cause the front to retreat north. The barrier jet also transports warm, moist air northward that can enhance convergence along portions of the front, and intensify convection along and near those areas.
Frontal Movement Influenced By Frontogenesis
The animation below shows how Mei-Yu convection occuring ahead of the Mei-Yu front can affect its frontal movement. If organized convection develops ahead of the Mei-Yu front, persistent latent heat release will lower atmospheric pressure and enhance convergence and convection (as described by the Conditional Instability of the Second Kind, or CISK). The decrease in air pressure is compensated by an increase in the winds towards the convection from either side of the front, resulting in cyclogenesis. The combination of evaporative cooling beneath the convection and northerly flow advecting cooler air south results in the strongest thermal gradient being displaced further south. The original location of the deformation zone moves southward as well. The initial Mei-Yu front dissipates (frontolysis) and develops further south (frontogenesis). Frontogenesis occuring ahead of the Mei-Yu front tends to cause the front to move southward, whereas frontogenesis behind the front tends to result in frontal retreat.
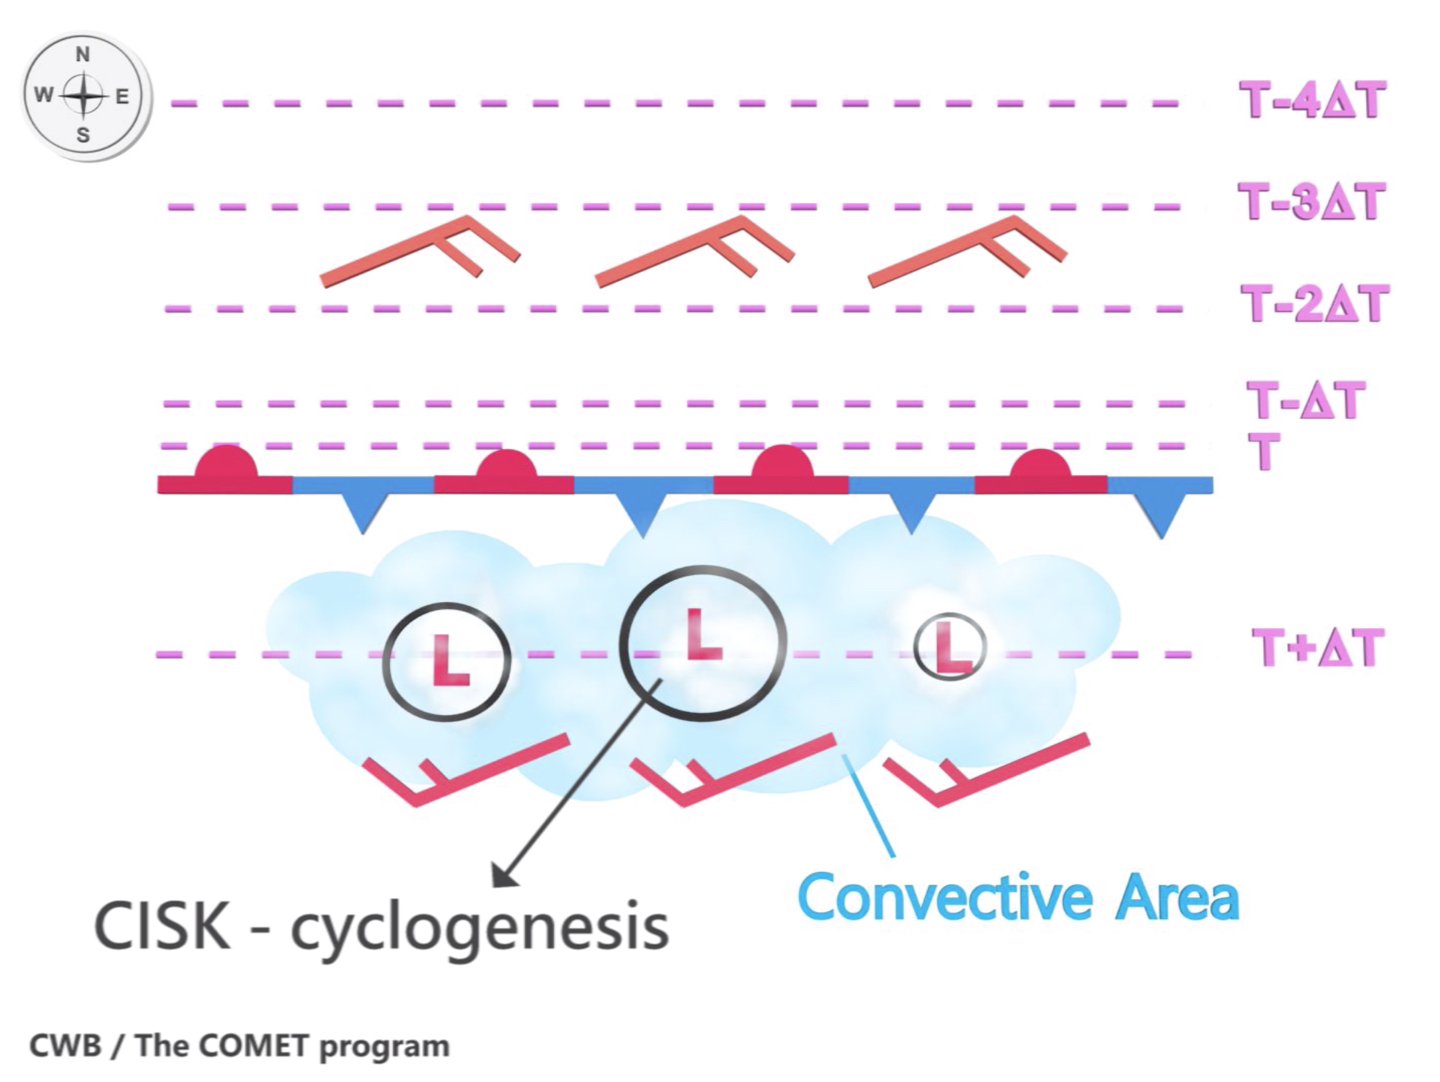
A conceptual animation (adapted from 陳, 2007) showing the roles of Mei-Yu convection, cyclogenesis, and frontogenesis in affecting the movement of the Mei-Yu front.
In the COMET lesson Mei-Yu Front, Part 1: Ingredients for Heavy Precipitation and the Forecast Process in Taiwan, we learned about the Mei-Yu forecast procedure. In the next section, we will briefly review it.
Mei-Yu Forecast Procedure
The graphic below shows the detailed steps of the Mei-Yu front forecast procedure in CWB. In this lesson, we are focusing on the 12-hour period prior to event impact or the nowcasting stage. During the nowcasting stage, forecasters learn how to use observations (for example, satellite and radar data) to understand where the model is inaccurately representing atmospheric features, and how to modify the forecast.
Question
Review the image below and place the steps used by CWB to forecast Mei-Yu precipitation in the correct order. Use the pull-down menu to match the description to the step it represents.
Timeline of the CWB Mei-Yu front forecast procedure during the decision-making phase of a Mei-Yu event, ranging from long-range to short-range before event impact.
The correct answers are highlighted above.
We will explore a Mei-Yu event by using:
- NWP guidance and the Mei-Yu Front Checklist to analyze the 3D structure of the atmosphere, and identify the precipitation pattern associated with the Mei-Yu front. For more information on how the checklist was used in this step, review the COMET lesson Mei-Yu Front, Part 1: Ingredients for Heavy Precipitation and the Forecast Process in Taiwan.
- Observations to analyze the Mei-Yu front and other weather systems that may affect it.
- Observations and NWP guidance to identify trends in the frontal movement and associated convective intensity. Then, use these findings to adjust the NWP model forecast.
- QPF guidance to determine the possible time period and area of significant rainfall.
Mei-Yu Case Study
Mei-Yu Case Study » 01 June 18 UTC: Determine Mei-Yu Type
It is 18 UTC on June 1 and you are predicting the type of Mei-Yu precipitation event you expect in 6 hours. By interpreting the CWB-WRF model forecast (initialized 12 UTC on June 1 at 15-km resolution) for 18 UTC June 1 and 00 UTC June 2, you have determined that:
- At the surface, the Mei-Yu front is located offshore from northern Taiwan.
- At 850 hPa, the position of the shear line is close to the surface front. A region of high theta-e air is in place offshore of the North Area, yielding a convectively unstable area south of the front.
- The southwesterly LLJ ahead of the 850 hPa shear line is very strong (the maximum wind speed is up to 40 kts), resulting in strong positive horizontal shear vorticity between the LLJ and the shear line.
- The low-level (1000-850 hPa) moisture flux product shows that there is a strong flux of moisture over the North Taiwan Strait/North Taiwan Offshore and convergence near the frontal zone, providing favorable conditions for severe convective development.
- At 500 hPa, a short wave trough passed 120 E. The strong dipole vorticity signatures over the North Taiwan Offshore suggests convective development along and near the front.
- Diffluence at 200 hPa (especially when aligned with the right-entrance region of the upper-level jet streak) provides favorable conditions for lift over the North Taiwan Offshore.
- Based on the model forecast wind profile in Taipei, low-level vertical wind shear remains strong (40-50 kts) between 18 UTC June 1 and 06 UTC June 2. Strong low-level vertical wind shear is favorable for the maintenance of a back-building MCS (BB MCS).
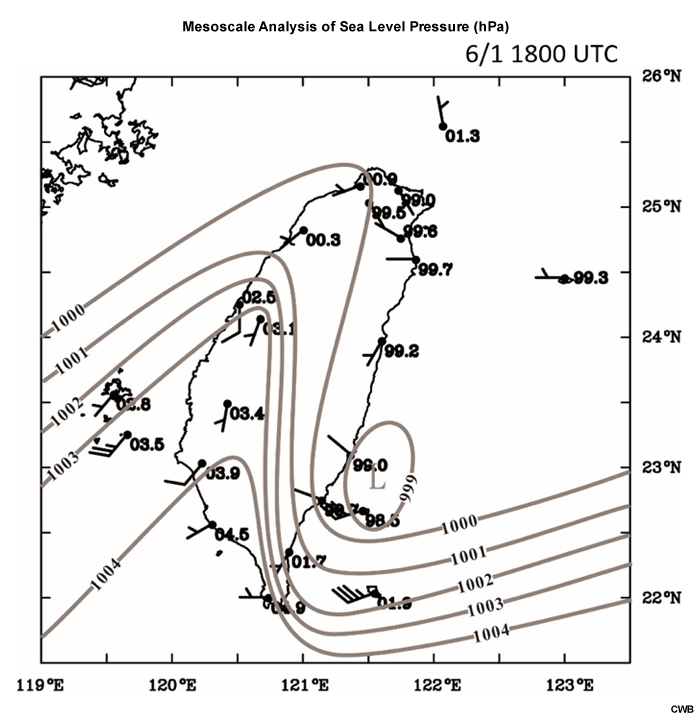
MSLP/Sfc Wind/850hPa T
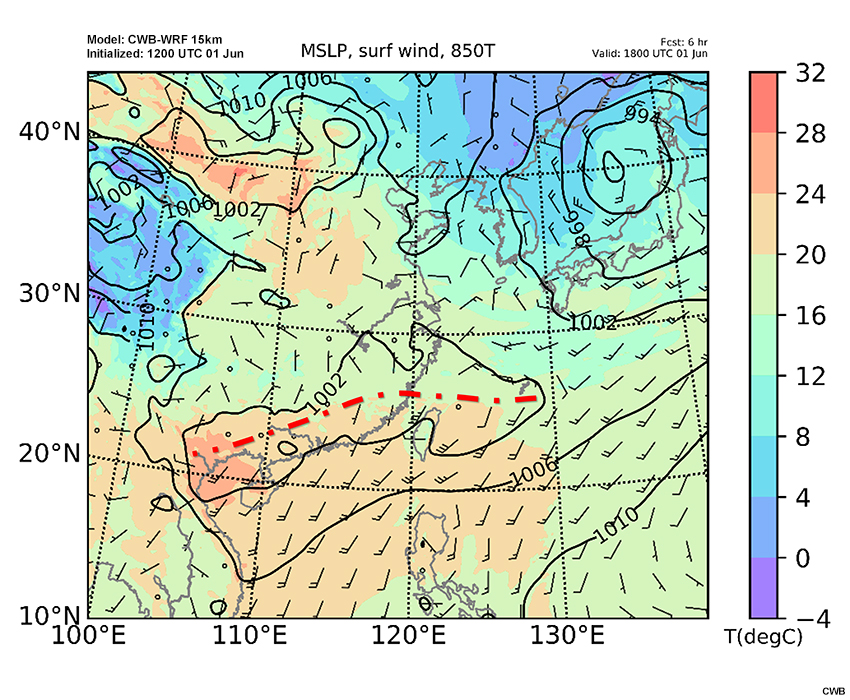
CWB-WRF model forecasts of mean sea level pressure (hPa, contour), surface wind barbs (a full barb is 10 kts) and 850 hPa temperature (℃, shaded) valid at 18 UTC June 1 and 00 UTC June 2. The red dash-dot line indicates the shear line at the surface.
1000-700hPa θe Lapse Rate/850hPa θe & Wind
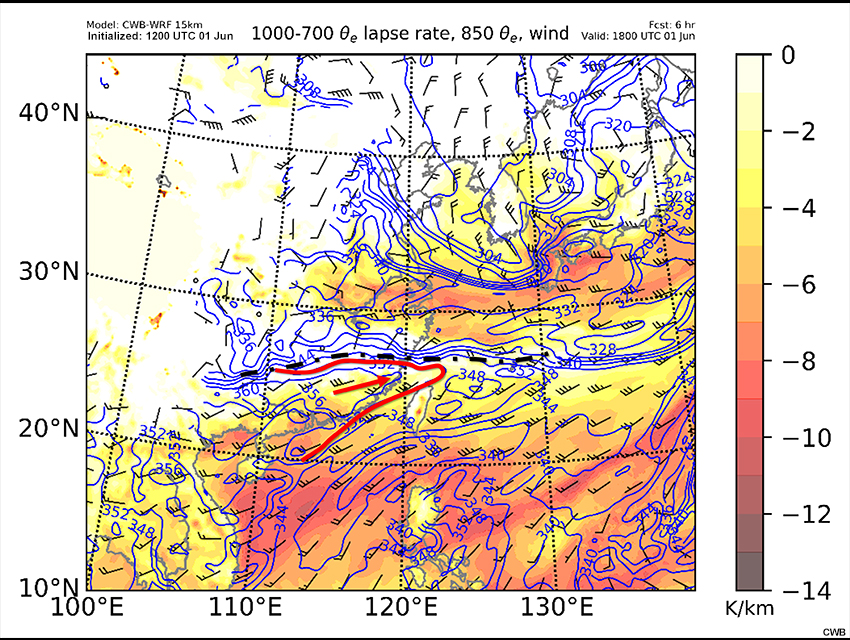
CWB-WRF model forecast of 1000-700 hPa theta-e lapse rate (shaded), 850 hPa wind barbs (a full barb is 10 kts) and theta-e (K, contour) valid at 18 UTC June 1 and 00 UTC June 2. The black dash-dot line indicates the 850 hPa shear line. The red line and red arrow represent the axis of high theta-e.
1000-850hPa Moisture Flux
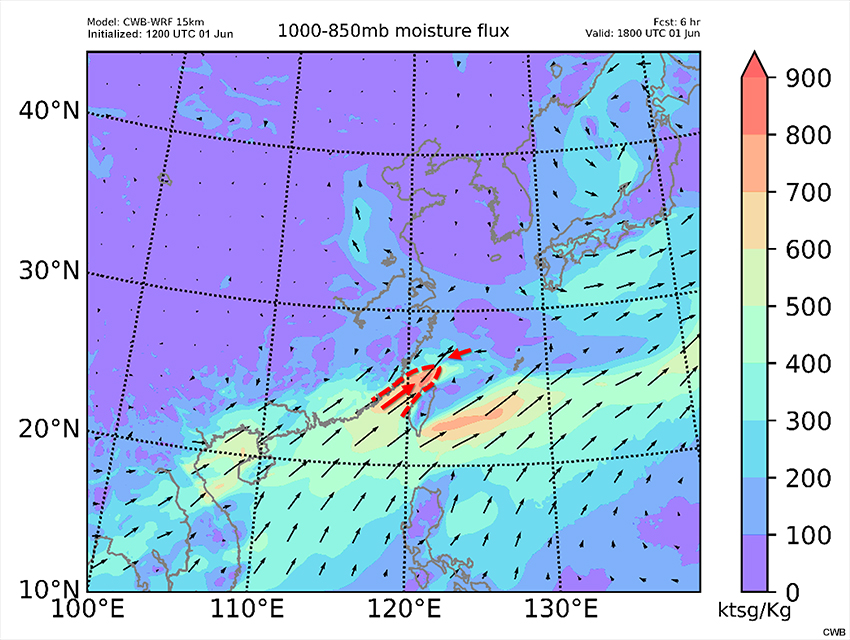
CWB-WRF model forecast of 1000-850 hPa moisture flux and moisture flux vectors (kts*g/Kg, shaded and arrows) valid at 18 UTC June 1 and 00 UTC June 2. The red dashed line outlines an area of strong moisture flux and the red arrows indicate convergence.
500hPa Vorticity, Heights, Wind
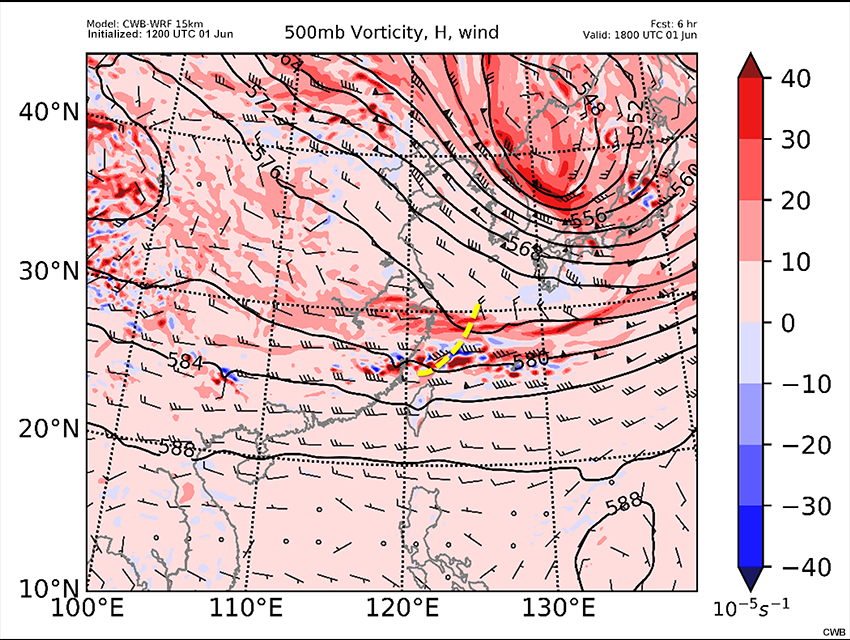
CWB-WRF model forecast of 500 hPa heights (gpm, contour), wind barbs (a full barb is 10 kts) and vorticity (10^-5s^-1, shaded) valid at 18 UTC June 1 and 00 UTC June 2. The yellow dashed line outlines the trough axis.
200hPa Winds
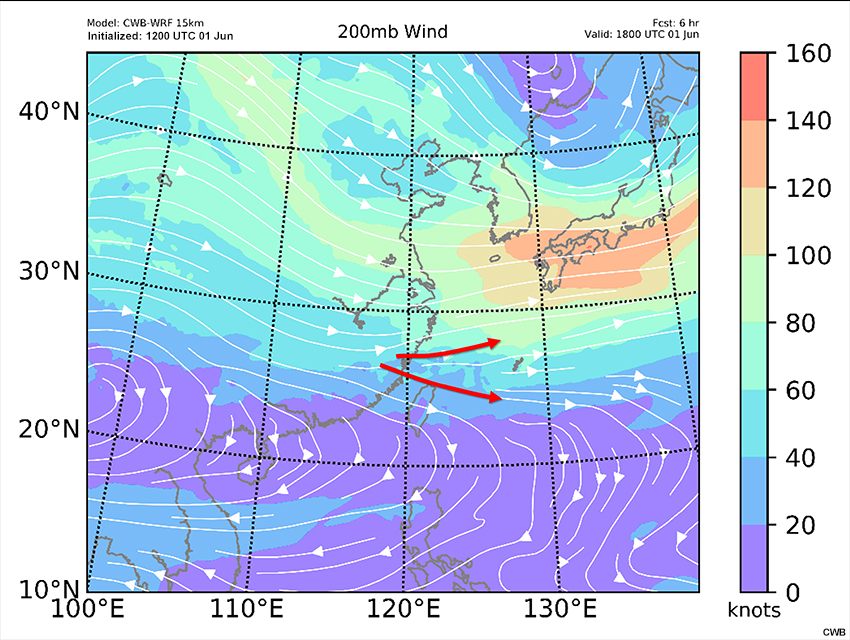
CWB-WRF model forecast of 200 hPa wind speed (kts, shaded) and streamlines valid at 18 UTC June 1 and 00 UTC June 2. The red arrows highlight where significant diffluence is.
Model Wind Profile
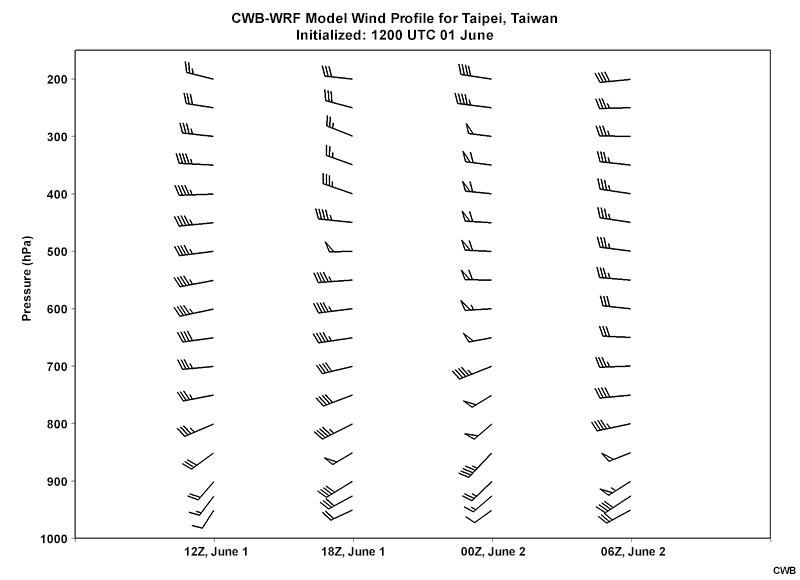
Time-height cross section of the CWB-WRF model forecast wind (a full barb is 10 kts) at the Taipei station from 12 UTC June 1 to 06 UTC June 2.
Question
Review the CWB-WRF model guidance in the tabs above. Based on the model forecasts, what type of Mei-Yu precipitation event is most likely to happen in the next 6 hours (between 18 UTC June 1 and 00 UTC June 2)? Choose the best answer.
The correct answer is a.
This scenario is most likely to become a Type-1 Mei-Yu precipitation event with linear convection along the front. The model suggests that the Mei-Yu front will approach Taiwan and could produce heavy rainfall over northern Taiwan. For more information on how to determine the type of Mei-Yu event, review the previous COMET lesson Mei-Yu Front, Part 1: Ingredients for Heavy Precipitation and the Forecast Process in Taiwan.
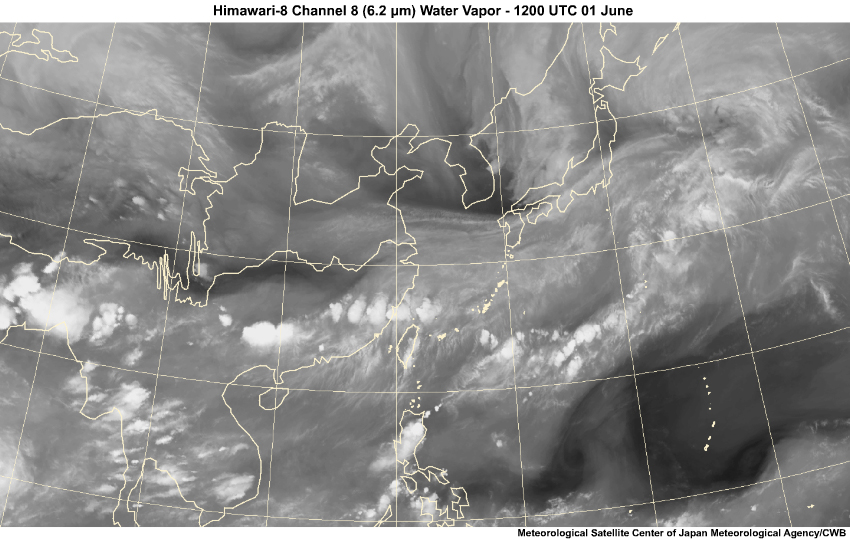
Mei-Yu Case Study » Water Vapor Satellite Imagery Application
One of the most useful types of satellite imagery is water vapor, as it can help forecasters gain a three-dimensional picture of the atmosphere. The water vapor satellite imagery (6.5 µm) below is showing a three-dimensional isosurface of 1 mm of water vapor as viewed from the satellite. The water vapor isosurface shows the brightness temperature where the satellite sensor indicated approximately 1 mm of water vapor. This happens in the atmosphere between 250 and 700 hPa.
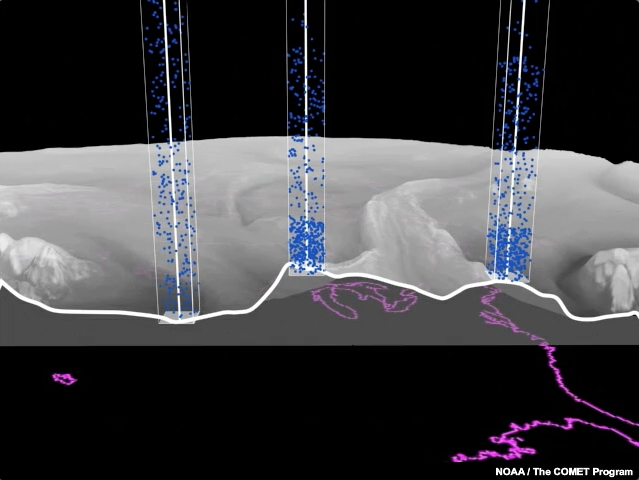
A video of how water vapor imagery is made from the perspective of the satellite.
The first step in interpreting water vapor imagery in three dimensions is to identify the highest and lowest regions. Areas that are "darker" can be interpreted as lower in the atmosphere as their brightness temperatures are warmer. When viewing water vapor loops, areas “getting darker” indicate sinking motion (i.e., descending cool and dry air) and areas “getting whiter” indicate rising motion (i.e., rising warm and moist air). Therefore, we can use water vapor satellite imagery to see how air is transported from one place to another in the atmosphere, such as in conveyor belts.
There are three types of conveyor belts as defined by Carlson (1980):
- Warm conveyor belt (WCB)
- Cold conveyor belt (CCB)
- Dry conveyor belt (DCB)
Typically, only the warm and dry conveyor belts can be seen on water vapor imagery as the cold conveyor belt is beneath the moisture plume/cloud shield of the warm conveyor belt.
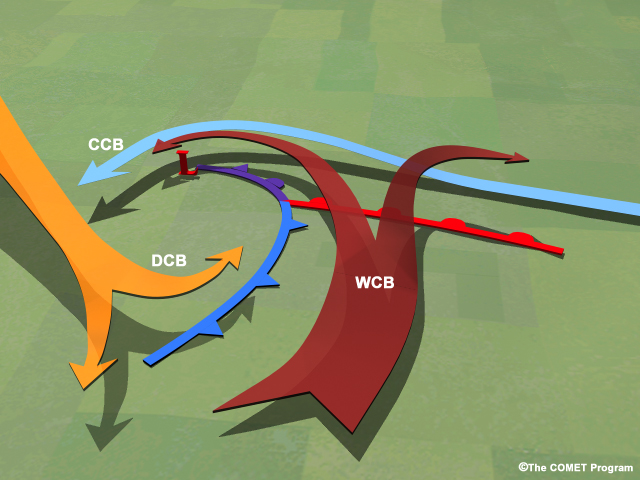
Conceptual model of conveyor belts associated with a mid-latitude cyclone.
Note that the Mei-Yu front is a weak baroclinic system. Therefore, using water vapor satellite imagery to interpret how upper-level atmospheric features influence low-level features may be different from the conceptual model above. In the next section, we will adopt some of the techniques in using water vapor satellite imagery to analyze the characteristics of the Mei-Yu event.
Mei-Yu Case Study » 01 June 18 UTC: Determine Amount and Duration
Over the past 6 hours, the Mei-Yu front has moved southward and the Mei-Yu convection has moved toward the North Area of Taiwan (see water vapor satellite loop below). It is time to review the latest observations and model guidance to do your precipitation forecast. You will prepare a forecast for the amount and duration of precipitation across the North Area.
Question
Review the water vapor satellite loop above. On the water vapor satellite image below, identify the following features that could play a role in the Mei-Yu precipitation event:
- use the yellow pen to draw a dashed-line identifying the trough axis
- use the red pen to draw arrows identifying the WCB
- use the blue pen to draw arrows identifying the DCB
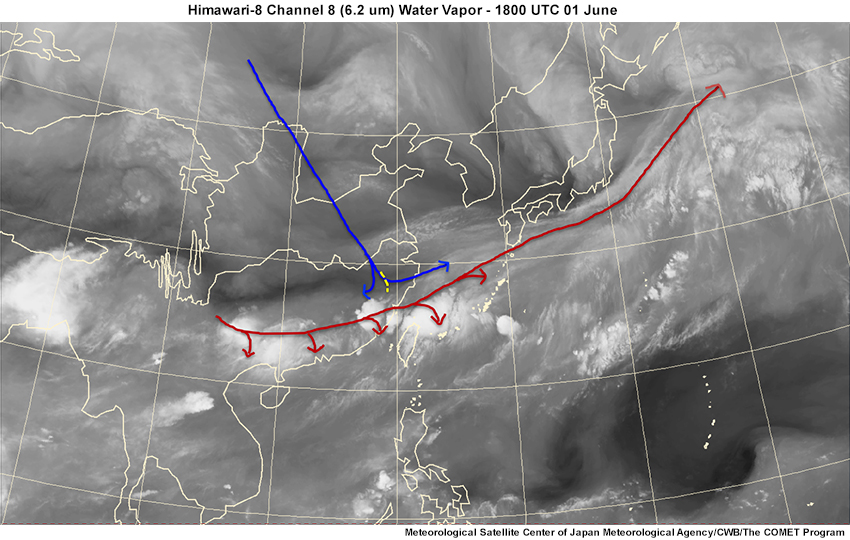
A forecaster’s analysis of the trough axis, DCB and WCB is shown on the water vapor satellite image above. The image shows an expansive DCB (blue arrows) over southern China that is oriented from northwest to southeast. We could infer that the DCB is advecting mid- to upper-level dry air into the convection zone within the WCB (red arrows). We could also infer that the DCB would continue to move southeast and advect dry air into the mid- and lower-levels of the atmosphere. The dry air entrainment into the mid-levels above the convection area may increase the convective instability. In general, this DCB may help create an environment favorable for convective development.
Based on the satellite observations, the trough closest to Taiwan is moving southeast and bringing cooler air south towards Taiwan, which may be helping the Mei-Yu front move south. Since water vapor satellite imagery can only provide information from the mid- to upper-atmosphere (between 250 and 700 hPa), we also need to analyze the characteristics of the lower atmosphere. The NWP guidance at 850 hPa shows weak cold air advection behind the front near Taiwan, which could be helping the Mei-Yu front move southward.
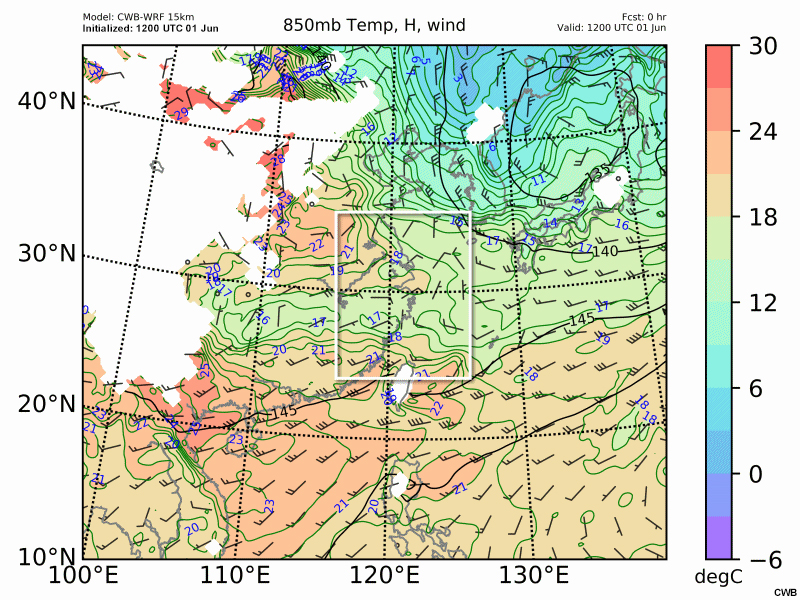
850 hPa temperature (℃, shaded), geopotential height (gpm, contour) and wind barbs (kts) from 12 UTC June 1 to 00 UTC June 2.
Next, we will analyze the radar reflectivity and low-level wind field characteristics.
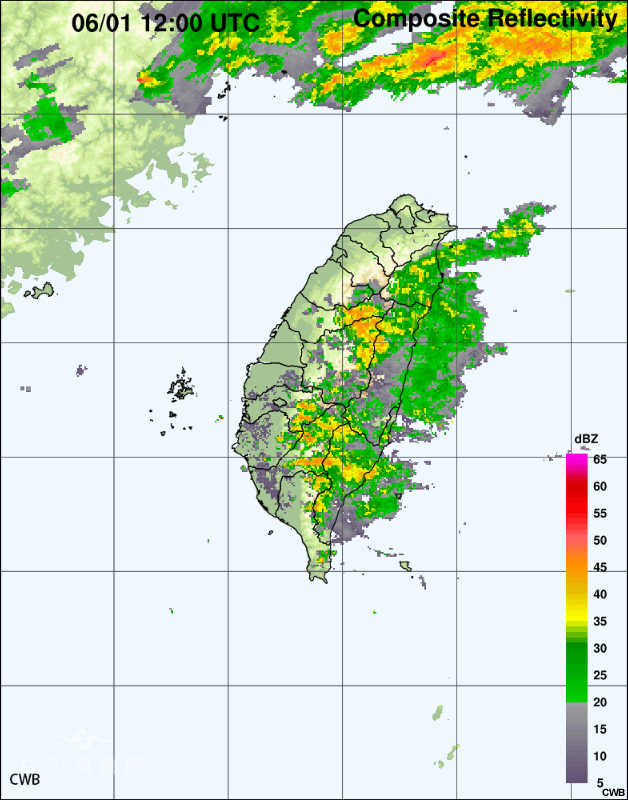
The radar loop above shows that convection associated with the Mei-Yu front is moving southward towards the North Area of Taiwan. Recall that the CWB-WRF model forecast predicted a strong southwesterly LLJ (up to 40 kts at 850 hPa) over northern Taiwan between 18 UTC on June 1 and 00 UTC June 2. The model guidance suggests that a barrier jet could form and affect the movement of the front. Let's assess the radar observations to determine the presence of a barrier jet and, if there is one, how strong it is.
Question 1 of 3
Radial velocities (0.5 degree) across the North Area of Taiwan from the National Central University (CU) radar at 1805 UTC June 1 is shown below. Radial velocities in blue indicate flow moving towards the radar, and radial velocities in red indicate flow moving away from the radar. On the radar velocity image:
- use the black pen to draw a dashed-line identifying the convergence line
- use the red pen to draw arrows identifying the barrier jet
You can view the radar reflectivity loop above to help in your analysis.
Compare your drawing to the expert one above.
Question 2 of 3
What is the strength of the barrier jet? Choose the best answer.
The correct answer is c.
Continue to the next question.
Question 3 of 3
Based on your analysis of the NWP guidance and observations, how will the Mei-Yu front and its associated convection behave in the next 6 hours (between 18 UTC June 1 and 00 UTC June 2)? Choose the best answer.
The correct answer is d.
The radar velocity observations show a very strong barrier jet (~20-30 m/s or ~40-60 kts), which may slow down or stall the Mei-Yu front’s migration southward. Back-building convection associated with the Mei-Yu front may enhance as a result of the barrier jet’s role in increasing atmospheric instability. In addition, we know that the model is predicting low-level vertical wind shear to remain strong in the next 12 hours. This suggests that the shear environment will continue to support BB MCS.
It is important to note that the radar may be limited by its observational capacity. In the case of limited radar data, a forecaster can do a surface analysis to determine the presence of a strong pressure gradient over the northwestern region of Taiwan that may induce a barrier jet.
Recall that our Type 1 Mei-Yu precipitation event exhibits back-building (hereafter BB) convection along the Mei-Yu front. If you are not familiar with this type of convective system, please review the information below.
Multicell Thunderstorm
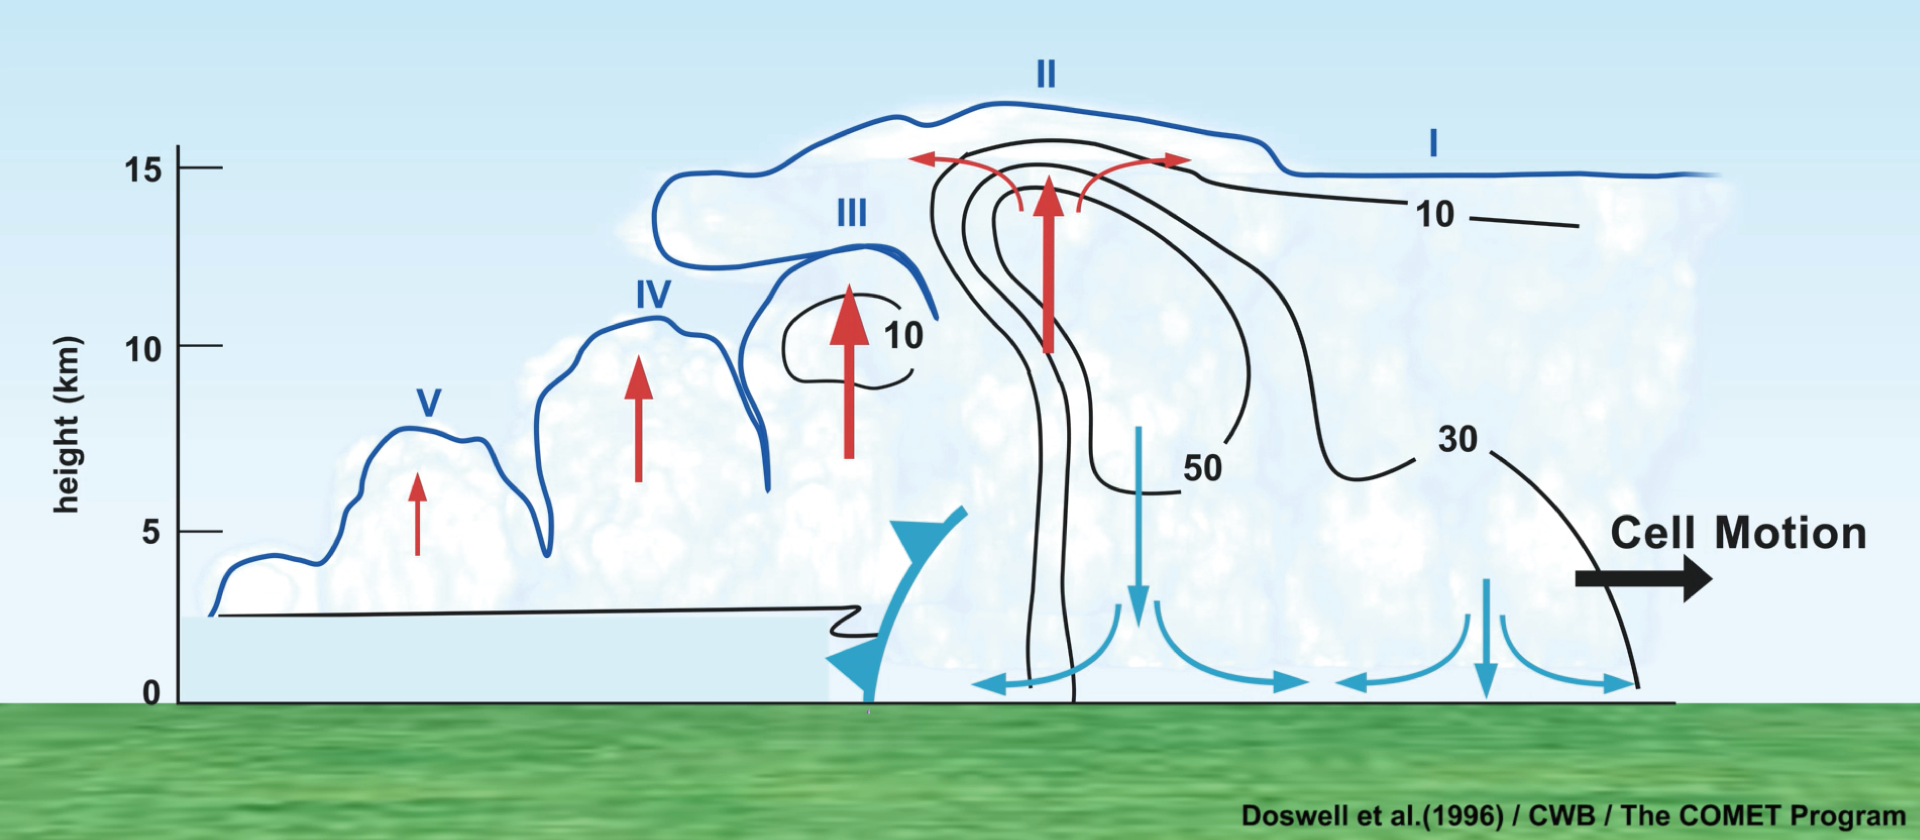
A conceptual animation showing three stages in the evolution of a multicell thunderstorm system. Cells are labeled with Roman numerals (I, II, III, etc.); red and blue arrows indicate the updrafts and downdrafts, and divergence at the storm top and the surface associated with each cell; the frontal symbol indicates the low-level outflow boundary; the cell motion is indicated by the black arrow; and black lines show radar reflectivity and are labeled in dBZ. Animation inspired by Figure 7 in Doswell et al. (1996).
Backbuilding MCS
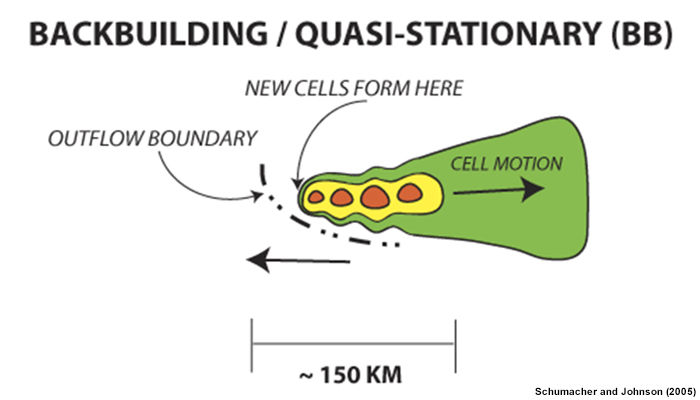
Schematic diagram of the radar-observed features of a BB MCS. Contours (and shading) represent approximate radar reflectivity values of 20, 40, and 50 dBZ. The dash–dot line represents an outflow boundary. The length scale at the bottom is approximate and can vary substantially, especially for BB systems, depending on the number of mature convective cells present at a given time. From Schumacher and Johnson (2005).
The initiation and maintenance of BB MCSs mainly rely on mesoscale and storm-scale processes, specifically the lifting provided by storm-generated outflow boundaries. A BB MCS occurs when thunderstorms repeatedly develop upstream of their predecessors and travel over the same area, while the overall convective system seems to remain nearly stationary. The repeated passage of thunderstorms leads to large local rainfall amounts.
MCSs in the tropics usually have weak or straight-line mid-level shear profiles. Most of the vertical wind shear in these environments is found in the low-levels (often generated by a low-level jet). The low-to-mid-troposphere shear is a major factor in the line orientation of an MCS (see image below). Leading-stratiform and parallel-stratiform MCSs are significant in the monsoon areas of southeast Asia, where they occur along the Mei-Yu front. These two linear MCS types move more slowly and exhibit back-building or training of storm cells. For more information, please see the COMET lesson Tropical Mesoscale Convective Systems.
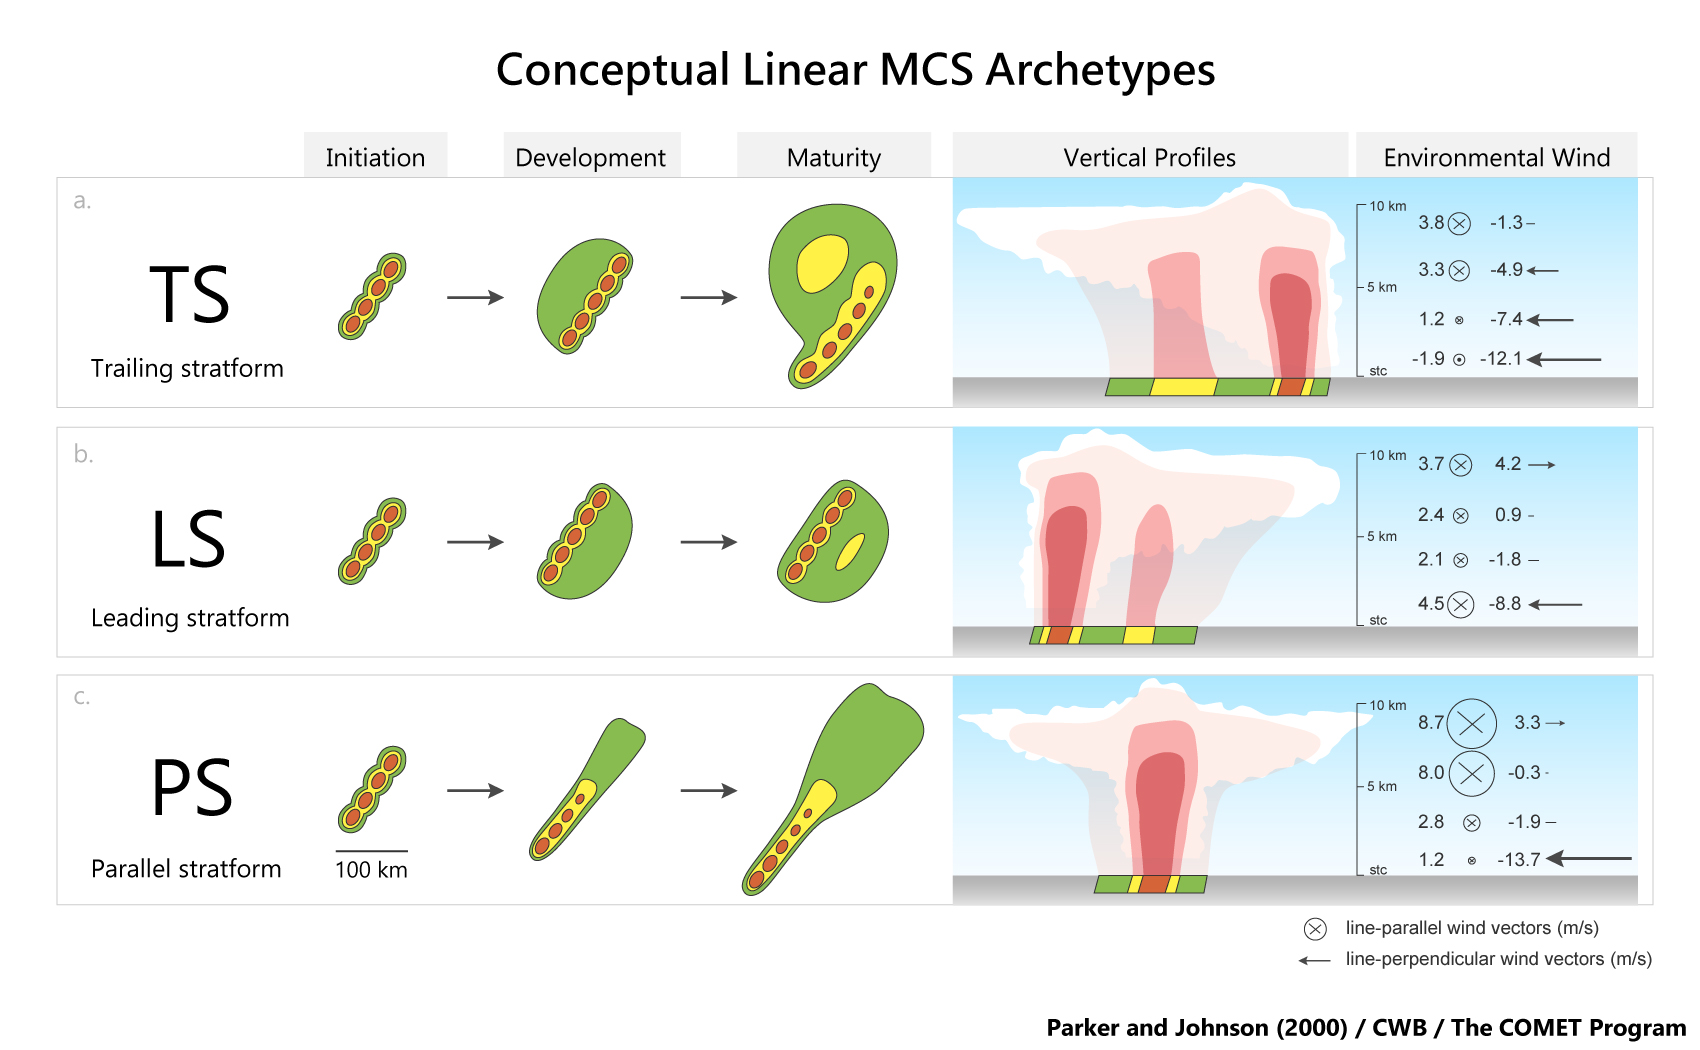
A schematic of three linear MCS archetypes described in Parker and Johnson (2000). The left side of the figure shows the idealized radar reflectivity patterns for each of the three linear MCS types. Levels of shading roughly correspond to 20, 40, and 50 dBZ. The right side shows the vertical profiles of layer-mean storm-relative pre-MCS winds for linear MCS types. Wind vectors are depicted as line-parallel (X) and line-perpendicular (→) components in m/s. Layers depicted are 0–1, 2–4, 5–8, and 9–10 km. Graphic inspired by Figures 4 and 12 in Parker and Johnson (2000).
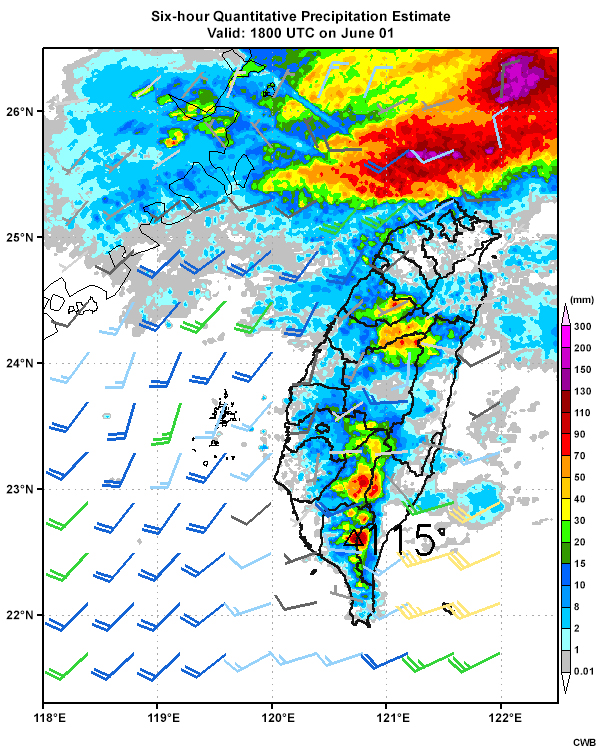
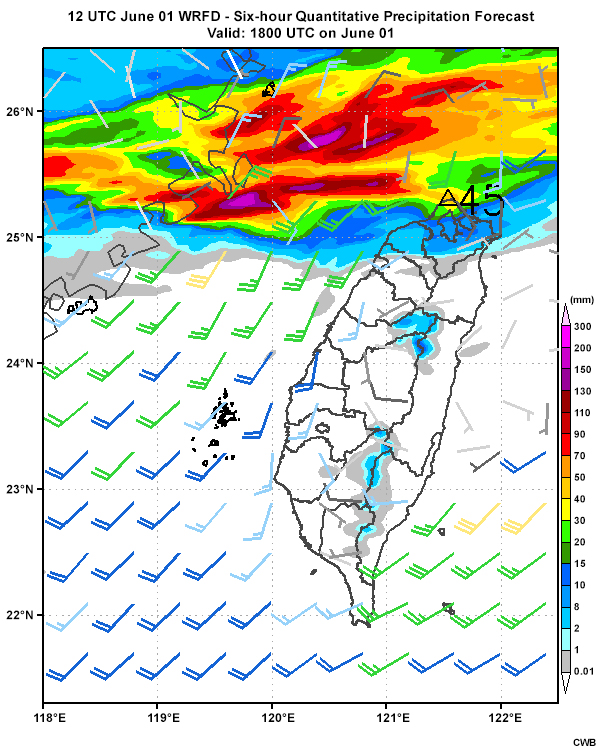
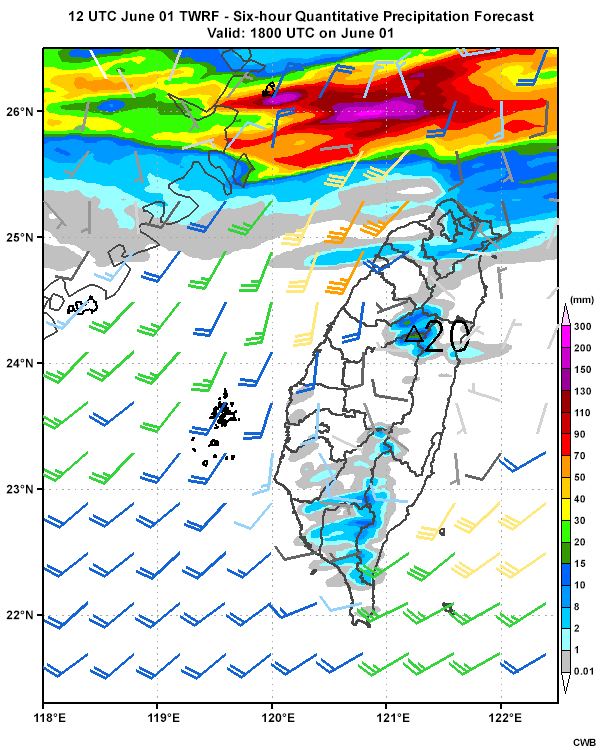
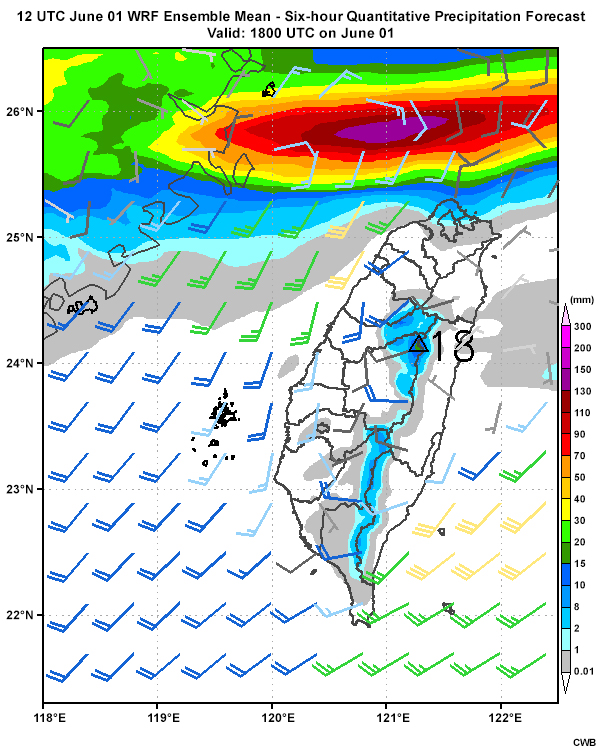
Based on your weather analysis and how you expect the Mei-Yu front to behave in the next 6 hours, let’s apply what you have learned to the model precipitation forecasts. Please review the latest model QPF guidance and answer the questions below. Pay special attention to predictions for significant rainfall (greater than 100 mm/6 hr) across the North Area of Taiwan. The 6-hr QPE is provided to compare with the first 6-hr QPF of each model.
WRFD
TWRF
WRF Ensemble
Mei-Yu Case Study » What Happened?
According to FloodList, “Huge amounts of rainfall in parts of Taiwan on 02 June resulted in major flooding and mudslides in northern areas of the country. Some areas of New Taipei City recorded more than 600 mm of rain in under 12 hours. According to the Central Weather Bureau, over 100 locations in the country recorded more than 230 mm of rain between early 02 June and early 03 June, 2017.”
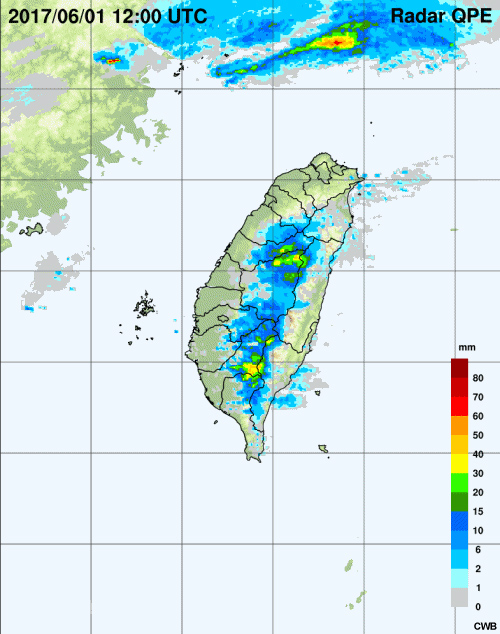
The radar QPE loop above shows back-building convection associated with the Mei-Yu front quickly approaching the northern coast of Taiwan on June 1. Then, the front became nearly stationary for about 8 hours (between 18 UTC June 1 and 02 UTC June 2), with an hourly rainfall rate of more than 80 mm during this period.
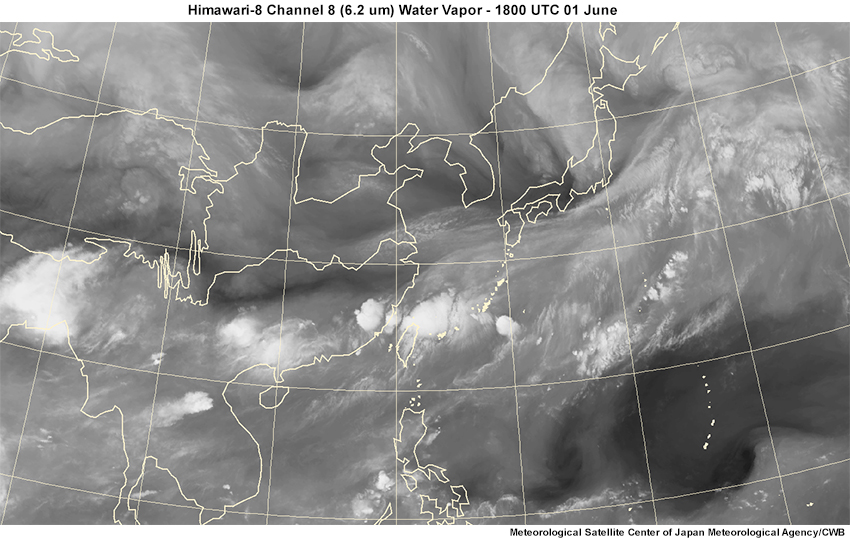
In the water vapor satellite imagery loop above, we can observe that our trough of interest has weakened, which could contribute to the slow down of the front’s migration southward because of the decreased influence from the trough.
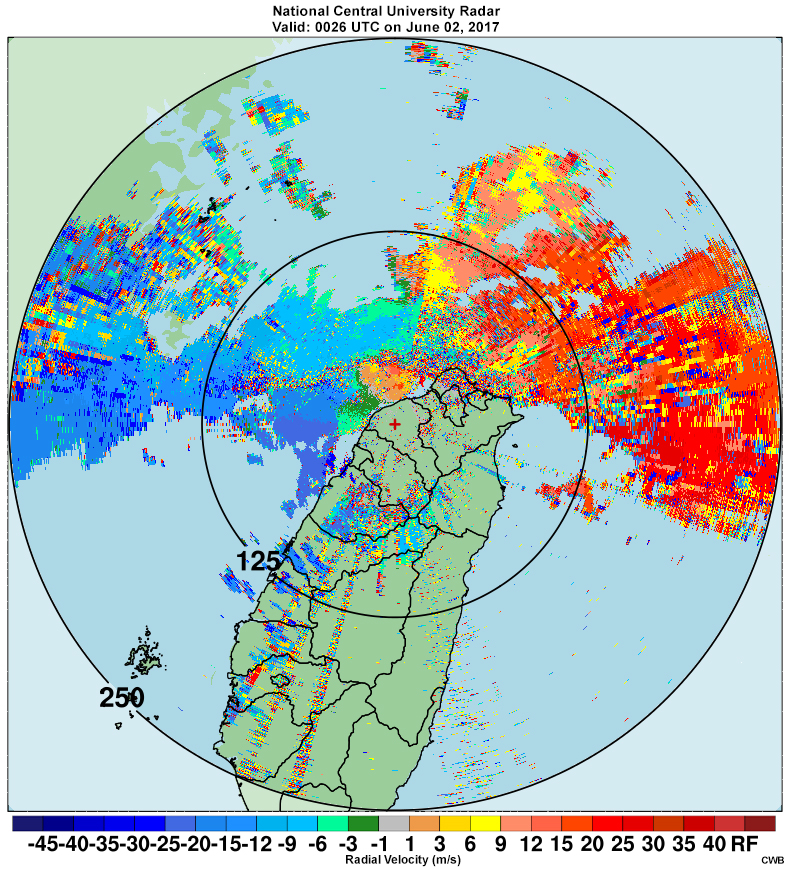
Between 18 UTC June 1 and 00 UTC June 2, the barrier jet remained strong, which slows down the front from moving south as well.
Summary
In this lesson we reviewed the Mei-Yu forecast procedure introduced in the COMET lesson Mei-Yu Front, Part 1: Ingredients for Heavy Precipitation and the Forecast Process in Taiwan, and the factors that affect the movement of the Mei-Yu front and its associated convection. These factors include cold and warm air advection, convective latent heat release near the Mei-Yu front, and the mesoscale barrier jet induced by Taiwan’s terrain.
The lesson focused on the nowcasting stage (0-6 hours) for a Mei-Yu event, and we began with using NWP guidance to determine the Mei-Yu event type and location of the Mei-Yu front. Next, satellite and radar observations were used to study current environmental conditions and determine the weather features that may impact the movement and convective intensity of the Mei-Yu front. Based on our weather analysis of the observations and NWP guidance, we determined the timing and amount of Mei-Yu precipitation across the North Area of Taiwan.
Learners could apply the analysis techniques from this lesson to forecast the Mei-Yu event type as well as the timing and intensity of precipitation associated with the Mei-Yu front. The techniques could increase the confidence with which forecasters make these determinations.
References
Research Publications:
陳泰然,2007:最近之梅雨研究回顧。大氣科學,35,(4),261-286。
Carlson, Toby N., 1980: Airflow Through Midlatitude Cyclones and the Comma Cloud Pattern. Mon. Wea. Rev., 108, 149-1509, https://doi.org/10.1175/1520-0493(1980)108<1498:ATMCAT>2.0.CO;2
Chen, G.T., C. Wang, and L. Lin, 2006: A Diagnostic Study of a Retreating Mei-Yu Front and the Accompanying Low-Level Jet Formation and Intensification. Mon. Wea. Rev., 134, 874–896, https://doi.org/10.1175/MWR3099.1
Doswell, C.A., H.E. Brooks, and R.A. Maddox, 1996: Flash Flood Forecasting: An Ingredients-Based Methodology. Wea. Forecasting, 11, 560–581, https://doi.org/10.1175/1520-0434(1996)011<0560:FFFAIB>2.0.CO;2
Li, J. and Y. Chen, 1998: Barrier Jets during TAMEX. Mon. Wea. Rev., 126, 959–971, https://doi.org/10.1175/1520-0493(1998)126<0959:BJDT>2.0.CO;2
Parker, M.D. and R.H. Johnson, 2000: Organizational Modes of Midlatitude Mesoscale Convective Systems. Mon. Wea. Rev., 128, 3413–3436, https://doi.org/10.1175/1520-0493(2001)129<3413:OMOMMC>2.0.CO;2
Schumacher, R.S. and R.H. Johnson, 2005: Organization and Environmental Properties of Extreme-Rain-Producing Mesoscale Convective Systems. Mon. Wea. Rev., 133,961–976, https://doi.org/10.1175/MWR2899.1
Wang, C., G. Tai-Jen Chen, and K. Ho, 2016: A Diagnostic Case Study of Mei-Yu Frontal Retreat and Associated Low Development near Taiwan. Mon. Wea. Rev., 144,2327–2349, https://doi.org/10.1175/MWR-D-15-0391.1
Yeh, H. and G.T. Chen, 2004: Case Study of an Unusually Heavy Rain Event over Eastern Taiwan during the Mei-Yu Season. Mon. Wea. Rev., 132, 320–337, https://doi.org/10.1175/1520-0493(2004)132<0320:CSOAUH>2.0.CO;2
COMET MetEd Lessons:
Contributors
COMET Sponsors
MetEd and the COMET® Program are a part of the University Corporation for Atmospheric Research's (UCAR's) Community Programs (UCP) and are sponsored by
- NOAA's National Weather Service
(NWS)
with additional funding by: - Bureau of Meteorology of Australia (BoM)
- Bureau of Reclamation, United States Department of the Interior
- European Organisation for the Exploitation of Meteorological Satellites (EUMETSAT)
- Meteorological Service of Canada (MSC)
- NOAA National Environmental Satellite, Data and Information Service (NESDIS)
- NOAA's National Geodetic Survey (NGS)
- National Science Foundation (NSF)
- Naval Meteorology and Oceanography Command (NMOC)
- U.S. Army Corps of Engineers (USACE)
To learn more about us, please visit the COMET website.
Project Contributors
Project Lead
- Tsvetomir Ross-Lazarov — UCAR/COMET
Instructional Design
- Tsvetomir Ross-Lazarov — UCAR/COMET
- Vanessa Vincente, Meteorologist — UCAR/COMET
Principle Science Advisors
- 呂國臣 (Dr. Kuo-Chen Lu), Director — CWB/Weather Forecast Center
- 劉人瑋 (Jen-Wei Liu), Section Chief — CWB/Weather Forecast Center
- 游政谷(Dr. Cheng-Ku Yu), Professor — NTU/Department of Atmospheric Sciences
- 林哲佑 (Dr. Che-Yu Lin), Post-Doc — NTU/Department of Atmospheric Sciences
- Vanessa Vincente, Meteorologist — UCAR/COMET
- Dr. Rich Jeffries, Meteorologist — UCAR/COMET
- 李茂正(Mao-Cheng Lee), Research Assistant — CWB/Weather Forecast Center
Science Advisors
- 林伯東 (Po-Tung, Lin), Associate Technical Specialist — CWB/Weather Forecast Center
- 鍾志廷 (Jr-Ting Jung), Research Assistant — NTU/Department of Atmospheric Sciences
- 羅章碩(Jhang-Shuo Luo), Research Assistant — NTU/Department of Atmospheric Sciences
Graphics/Animations
- 張家瑜 (Chia-Yu Chang), Junior Technical Specialist, Central Weather Bureau/Weather Forecast Center
- Steve Deyo — UCAR/COMET
Multimedia Authoring/Interface Design
- Gary Pacheco — UCAR/COMET
Program Oversight
- Tsvetomir Ross-Lazarov — UCAR/COMET
COMET Staff, December 2019
Director's Office
- Dr. Elizabeth Mulvihill Page, Director
- Tim Alberta, Assistant Director Operations and IT
- Dr. Paul Kucera, Assistant Director International Programs
- Dr. Wendy Gram, Implementation Manager
Business Administration
- Lorrie Alberta, Administrator
- Auliya McCauley-Hartner, Administrative Assistant
- Tara Torres, Program Coordinator
IT Services
- Bob Bubon, Systems Administrator
- Joshua Hepp, Student Assistant
- Joey Rener, Software Engineer
- Malte Winkler, Software Engineer
Instructional Services
- Dr. Alan Bol, Instructional Designer/Scientist
- Tony Mancus, Instructional Designer
- Sarah Ross-Lazarov, Instructional Designer
- Tsvetomir Ross-Lazarov, Instructional Designer
International Programs
- David Russi, Translations Coordinator
- Martin Steinson, Project Manager
Production and Media Services
- Steve Deyo, Graphic and 3D Designer
- Jordan Goodridge, Student Assistant
- Dolores Kiessling, Software Engineer
- Gary Pacheco, Web Designer and Developer
Science Group
- Dr. William Bua, Meteorologist
- Patrick Dills, Meteorologist
- Bryan Guarente, Instructional Designer/Meteorologist
- Matthew Kelsch, Hydrometeorologist
- Andrea Smith, Meteorologist
- Amy Stevermer, Scientist/Instructional Designer
- Vanessa Vincente, Meteorologist