Introduction
The Mei-Yu front develops between spring and summer when warm, humid air from the Southwest Monsoon meets the cool, dry air from the weakening Northeast Monsoon. Since neither of the two air masses is strong enough to replace the other, the boundary between them remains stationery and leads to continuous rainfall. This stationary boundary is called the Mei-Yu front. In Taiwan, the weather phenomena associated with the Mei-Yu front is known as the “Mei-Yu”, which means “plum rains” in Mandarin.
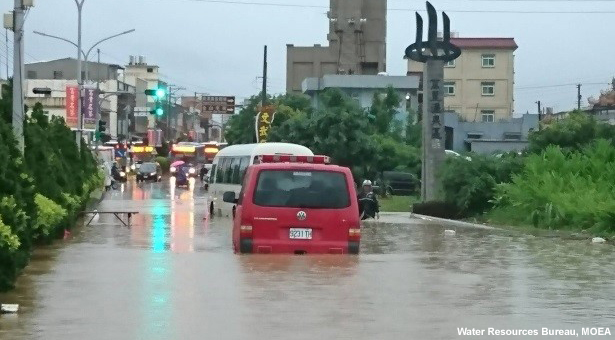
Flooding due to a Mei-Yu front event on June 1, 2017.
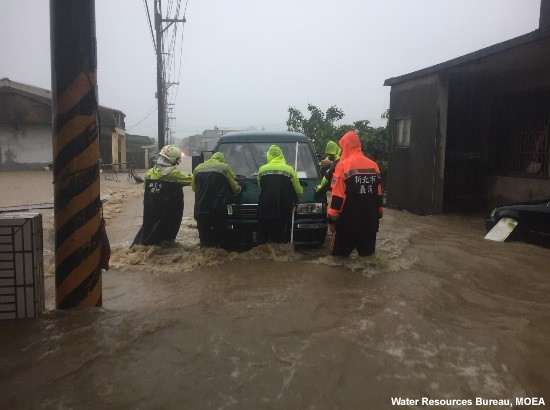
Flooding due to a Mei-Yu front event on June 1, 2017.
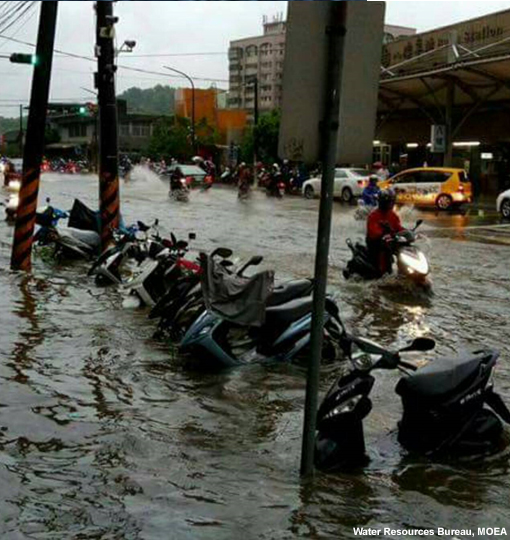
Flooding due to a Mei-Yu front event on June 1, 2017.
Heavy rainfall during the Mei-Yu season (May through June) can cause various disasters such as flash floods and landslides. In Taiwan, the heavy rainfall associated with the Mei-Yu front is the second leading weather disaster following typhoons. The “612 Floods” in 2005 is the costliest Mei-Yu disaster that led to 13 fatalities and more than NTD $2.1 billion in property damage. The “609 Floods” in 2006 resulted in more than 700 mm of rain in the mountainous areas of southwestern Taiwan, where the Alishan Station recorded 811.5 mm in one day!
Introduction » Onset of the Mei-Yu Season
The onset of the Mei-Yu season signifies the beginning of Taiwan’s rainy season. Hung and Hsu (2008) concluded that the start of the Mei-Yu season in Taiwan typically follows the onset of the East Asian summer monsoon, when large-scale flow transports moisture northward from the tropics.
The figure below compares the moisture transport before and after the monsoon onset over East Asia. Before the monsoon onset, moisture transport is rather weak across the North Indian Ocean and the South China Sea (SCS). After the monsoon onset, moisture is carried from the Southern Hemisphere along the eastern African coast, eastward across the Indian and Indochina peninsulas, and then northeastward towards Taiwan. This meandering atmospheric river brings tropical moisture towards East Asia. If Central Weather Bureau (CWB) forecasters observe southwesterly flow that is strong and abundant in moisture, the CWB will broadcast the term “Southwesterly Flow” to warn people of the heavy rainfall potential across Taiwan.
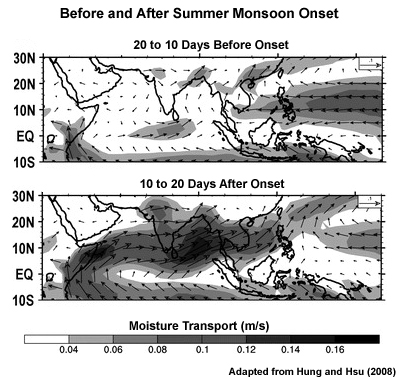
Composites of 11-day mean moisture transport at 850 hPa before (top) and after (bottom) the East Asian summer monsoon onset. Moisture transport is shown in vector and contour shading, where longer vectors and darker shades indicate stronger moisture transport. Figure is adapted from Hung and Hsu (2008).
The East Asian monsoon onset depends mostly on the upper-level circulation pattern responsible for the large-scale transport of low-level moisture. The animation below illustrates the atmospheric environment of the monsoon onset over East Asia. Low-level warm, moist air traveling east across the North Indian Ocean supports convection over East Asia. Above the Tibetan Plateau (about 200 hPa), northeasterly flow on the south side of an upper-level high transports air away from the convection and across the equator, where the air sinks due to the presence of subtropical high pressure systems. The self-sustaining, large-scale circulation system of the East Asian summer monsoon makes conditions favorable for convection across Taiwan.
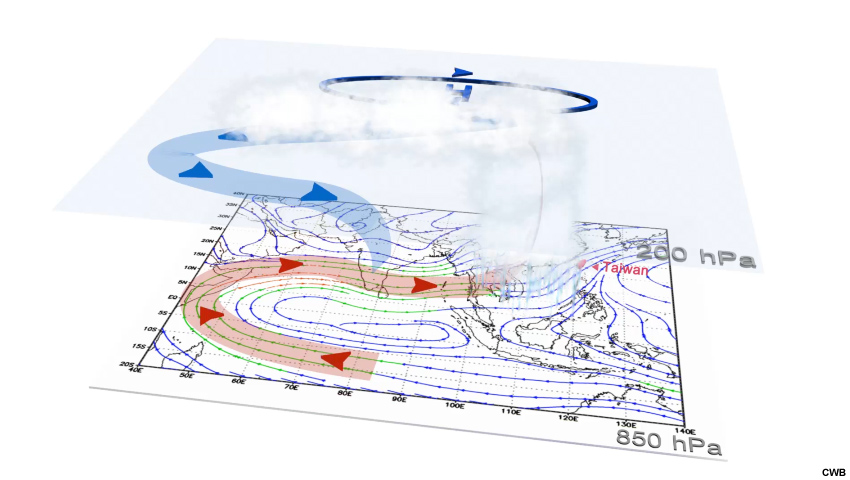
A conceptual animation showing the 3-dimensional circulation of the East Asian summer monsoon. The red arrow represents a low-level jet entraining warm, humid air. The blue arrow represents the northeasterly flow on the south side of an upper-level high.
Characteristics of the Mei-Yu Front over Taiwan
Taiwan is an island that is 394 km long and 140 km wide, and one-third of the island is covered by mountains. The peaks of the north-south oriented Central Mountain Range (CMR) span between 1500 m and 3900 m. In CWB's Mei-Yu forecast procedure, the island is divided into four forecast regions: the North, Central, South and East Areas (see map below). The first three regions comprise western Taiwan, where 90% of the population lives. Therefore, rainfall impacts are more significant in western Taiwan than in the East Area. In the CWB, forecasters need to determine whether heavy Mei-Yu rain will fall over the mountainous areas or plains of Taiwan, and also in which forecast regions.
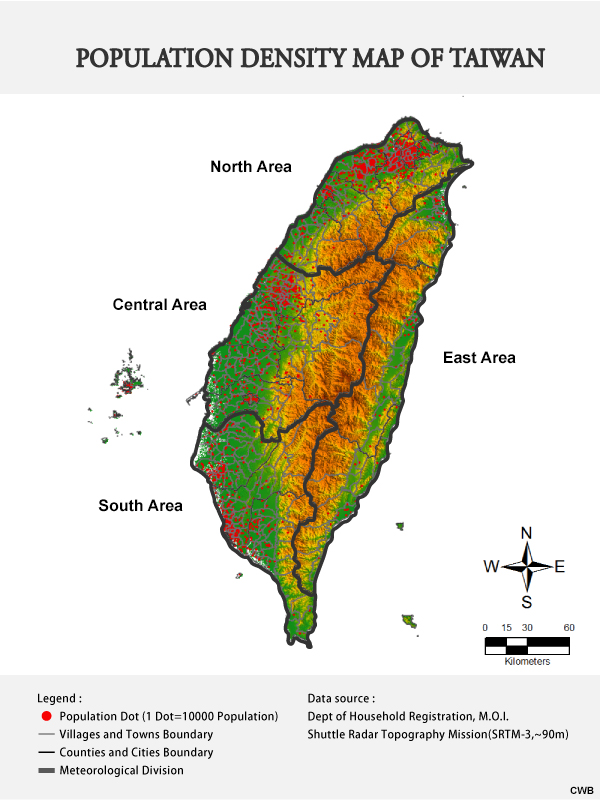
Population density map of Taiwan. Mountainous areas (above 500 meters) are signified by the brown area in the figure.
The Mei-Yu front that impacts Taiwan has unique characteristics. As shown in the surface analysis below, while the front itself is a synoptic-scale feature, mesoscale features exist near the front (convective cells and mesoscale convective systems, or MCSs). From a planetary point of view, the “Southwesterly Flow” that interacts with the front is just one piece of the Asian Monsoon system. The Mei-Yu front combines atmospheric phenomena at multiple scales, which poses a great challenge in forecasting precipitation across Taiwan.
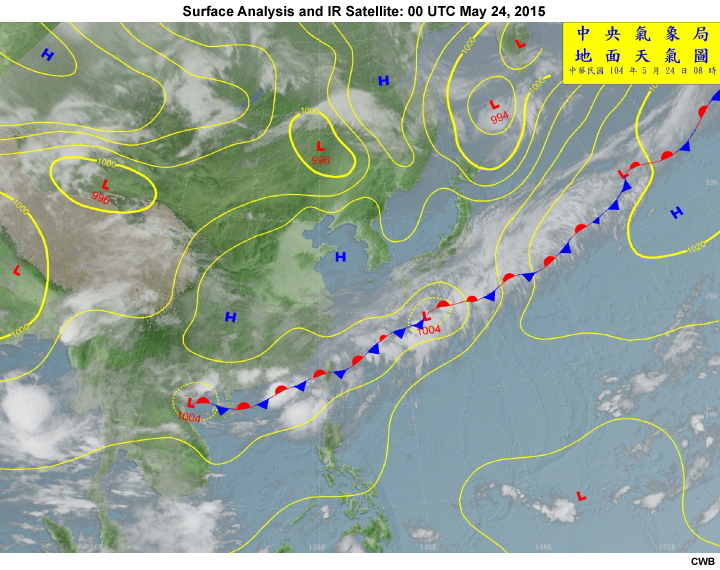
Surface analysis chart and infrared satellite imagery at 00 UTC on May 24th, 2015.
What is the difference between a Mei-Yu front and a cold front? In mature frontal systems, a cold front is tilted towards the northwest (i.e. in the direction of colder air) with altitude. Across the front, the temperature gradient is apparent (a feature of baroclinity) more often than the moisture gradient. The Mei-Yu front is similarly baroclinic, but with a weaker temperature gradient (a feature of barotropy) and a stronger moisture gradient. Also, the front is tilted less towards the northwest with altitude, and is often accompanied by heavy rain and a low-level jet (LLJ). Occasionally, barotropic instability is present with the Mei-Yu front.
Frontal Features |
Midlatitude Cold Front |
Mei-Yu Front |
|
Temperature Gradient |
Apparent |
Not apparent |
Slope |
Tilt towards colder air |
Tilt less towards colder air |
|
Moisture Gradient |
Small |
Very large |
Wind Field Ahead of the Surface Front |
Weak wind speed ahead of the surface front |
Warm and moist air from the Southwest Monsoon, usually accompanied by LLJ |
Convective Instability Ahead of the Surface Front |
Usually weak |
Usually significant |
Speed of Frontal Movement |
Usually faster |
Usually slower |
The effective issuance of heavy rain advisories becomes more likely as CWB forecasters increase their understanding on the structure of the Mei-Yu front. In this module, we will focus on the precipitation patterns related to the Mei-Yu front that are known to produce heavy rainfall over Taiwan. Let’s start by exploring the complex structure of the Mei-Yu front.
Characteristics of the Mei-Yu Front over Taiwan» 3-Dimensional Structure of the Mei-Yu Front
The climatology of precipitation during Taiwan’s Mei-Yu season has been studied quite extensively since the Taiwan Area Mesoscale Experiment (TAMEX) field campaign in 1987 (Kuo and Chen, 1990) and the establishment of a dense rain gauge network by CWB in 1993 (Hsu, 1998). Research conducted by Chen (2004) suggested six favorable conditions for the development of MCSs associated with the Mei-Yu front:
- low-level warm air advection,
- low-level convergence produced by the Mei-Yu front or frontal low,
- low-level jets,
- short-wave troughs at low- to mid-levels,
- diffluence or speed divergence at mid- to upper-levels, and
- potential instability.
Today, identifying these features and their contribution to heavy rain is part of the CWB operational forecast procedure (Wang et al., 2012). The conceptual animation below shows the atmospheric environment conducive for heavy rainfall over Taiwan during the Mei-Yu season.
Conceptual animation of the atmospheric environment conducive for heavy rainfall over Taiwan during the Mei-Yu season.
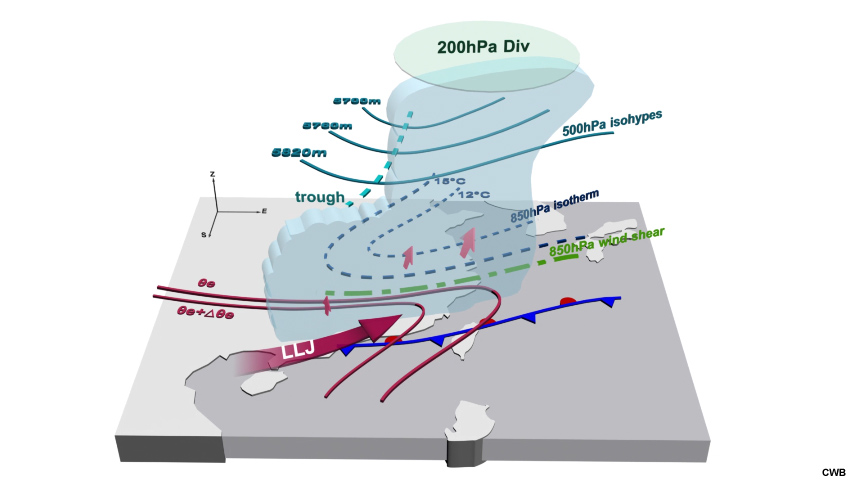
The conceptual animation below shows the typical atmospheric characteristics of a Mei-Yu front in a three-dimensional space. Let’s explore these characteristics from the surface to the top of the atmosphere.
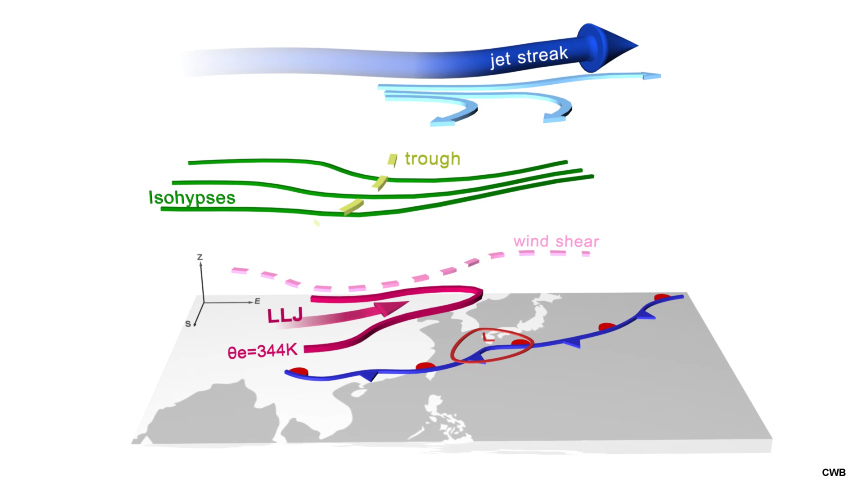
Conceptual animation illustrating the atmospheric characteristics of the Mei-Yu front at different levels, valid at 0000 UTC on May 24, 2015.
- Surface
- A stationary front passes over Taiwan or is in its vicinity.
- Mesolows may form in the vicinity of Taiwan. Chen (1992) concluded that there is a positive correlation between the frequency of heavy rain events (rainfall <50 mm per day) and mesolow presence. Note that this mesolow is either a stationary low due to the terrain effect near Taiwan (Wang and Chen, 2002), or a local mesolow along with the front, rather than the synoptic-scale low (extratropical cyclone) as shown in the animation.
- Low-Level (925-850 hPa)
- In operations, CWB forecasters often use 850 hPa (about 1500 m above the surface) to see how Taiwan's terrain affects the atmospheric flow.
- Convergence along a shear line can trigger convection.
- A LLJ carrying warm, moist air can lead to significant precipitation in central and southern Taiwan when it encounters Taiwan’s terrain.
- CWB forecasters identify a LLJ when the 850 hPa southwesterly winds exceed 25 kts near Taiwan.
- The positive feedback between a LLJ, latent heat release, and mesolow development helps to reinforce flow over the CMR and contribute to orographic precipitation (Wang and Chen, 2002). This nonlinear mechanism is similar to the conditional instability of the second kind (CISK; Chen et al. 2003).
- The temporal and spatial scales of a LLJ are smaller than the “Southwesterly Flow”.
- Warm, moist air provides an environment conducive to convective instability.
- Mid-Level(700-500 hPa)
- The area downstream of a trough is favorable for ascent.
- Upper-Level (300-200 hPa)
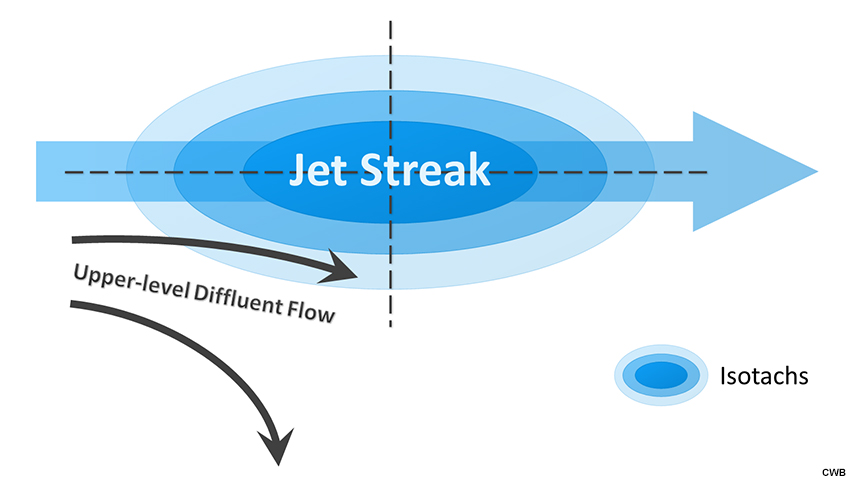
- Generally, distinct diffluent flow over the right-entrance region of an upper-level jet streak can also result in an area of upper-level divergence.
If these features synchronize well, convection will be supported. Forecasters are interested in where the strongest convection is likely to occur. To learn how to identify potential areas favorable for intense convection, let’s explore the main atmospheric lifting processes that can make the environment favorable for convection and see what roles they play in the Mei-Yu front.
Characteristics of the Mei-Yu Front over Taiwan » Lifting Mechanisms Favorable for Convective Development
The main atmospheric lifting processes that lead to cloud formation and convection during a Mei-Yu event are the following:
Frontal Lift
Frontal lift is the collision of two air masses with different temperature and moisture characteristics, where warm air rises over cool air. Typically, convective clouds form to the south of a Mei-Yu front, especially during severe Mei-Yu events.
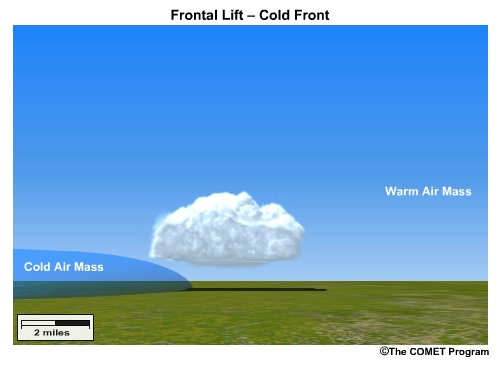
An animation of the frontal lifting process where warm, moist air is forced upward as it encounters the cold air mass.
Question
Use the drawing tool to identify the location of the Mei-Yu front (red pen) and outline areas favorable for convection (purple pen) based on the water vapor satellite image with surface observations.
Water vapor satellite imagery and surface observations for frontal lift question.
| Tool: | Tool Size: | Color: |
|---|---|---|
|
|
Compare your drawing to the expert one.
Convective Instability
CWB forecasters often use the theta-E lapse rate to determine the convective instability of the environment. Warmer temperatures and greater moisture increase the value of theta-E. When theta-E decreases with height, the atmospheric layer is convectively unstable. Although CWB forecasters need to determine how theta-E changes with height in different atmospheric layers, the forecasters usually check the value at 850 hPa (lower layer). Climatology for this region suggests that a theta-E value higher than 344 K suggests an environment with high convective instability between low and mid-levels.
To identify an area of high theta-e values, we can use total precipitable water (TPW) data. Since atmospheric water vapor is mostly concentrated below 700 hPa, higher TPW values could roughly suggest the presence of higher theta-e values in the lower levels of the atmosphere.
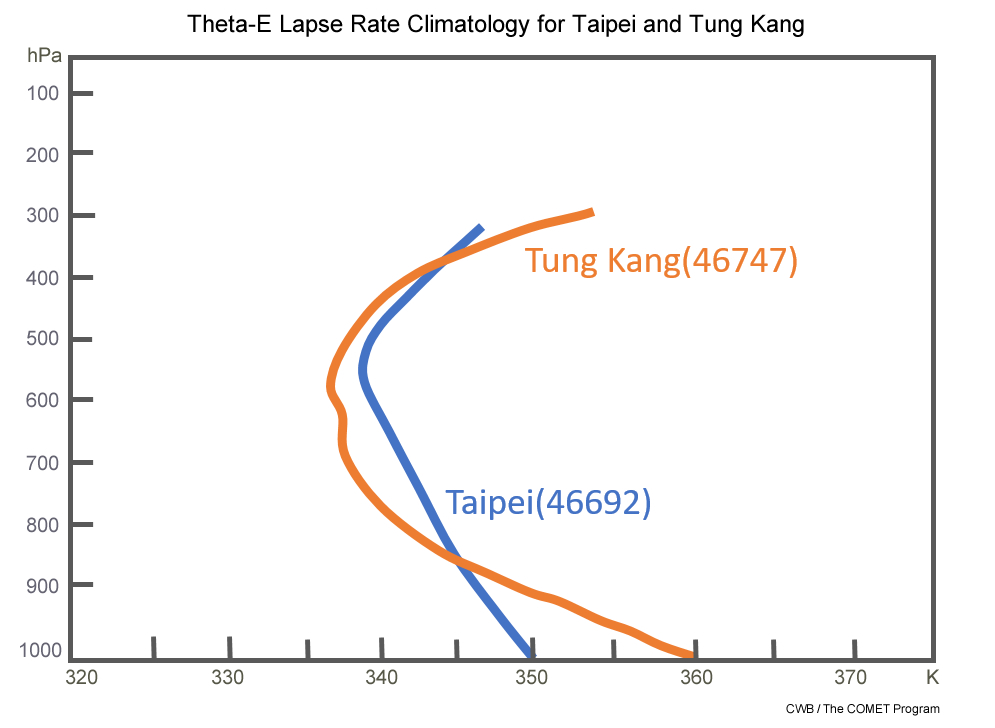
The climatology of the Taipei and Tung Kang (Southwest Taiwan)’s theta-E lapse rate. (Adapt from Chen and Chi, 1978)
Question
Use the drawing tool to outline areas of high potential instability based on the 850 hPa model analysis (red pen).
Model analysis of 850 hPa winds (a full barb is 10 kts) and equivalent potential temperature (K, shaded and contoured in yellow at 4-K intervals) for convective instability and orographic lift question.
| Tool: | Tool Size: | Color: |
|---|---|---|
|
|
Compare your drawing to the expert one.
Question
Use the drawing tool to outline areas of high potential instability based on the TPW image (blue pen).
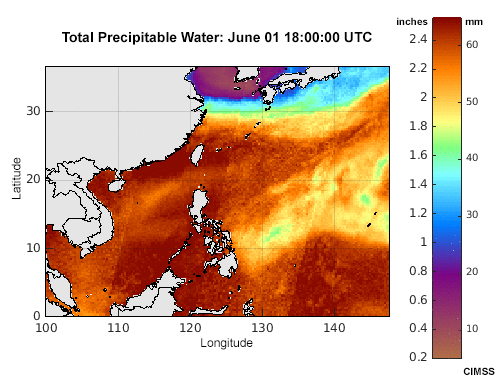
Total precipitable water (inches, mm) for high potential instability question.
| Tool: | Tool Size: | Color: |
|---|---|---|
|
|
Compare your drawing to the expert one.
Orographic Lift
Orographic lift is the upward deflection of air after colliding with a mountain barrier. As the air mass hits the rising terrain, it is forced to move over the terrain. In the case of a Mei-Yu event, warm and moist southwesterly flow encounters the CMR to produce heavy rainfall over western Taiwan.
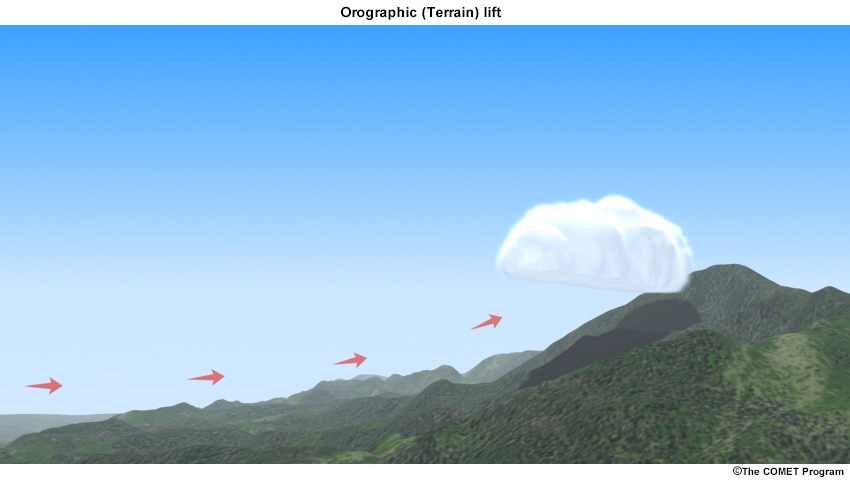
An animation of the orographic lifting process where warm, moist air is forced upward as it encounters terrain.
Question
Use the drawing tool to outline areas favorable for convection (black pen) due to orographic lift based on the 850 hPa model analysis.
Model analysis of 850 hPa winds (a full barb is 10 kts) and equivalent potential temperature (K, shaded and contoured in yellow at 4-K intervals) for convective instability and orographic lift question.
| Tool: | Tool Size: | Color: |
|---|---|---|
|
|
Compare your drawing to the expert one.
Upper-level Divergence
Upper-level divergence can be an important ingredient for the development or maintenance of convection.
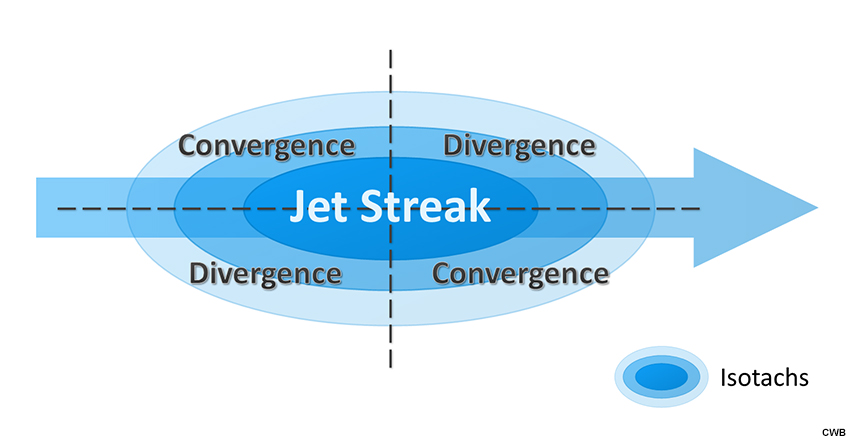
A diagram showing areas of divergence and convergence associated with the entrance and exit regions of an idealized upper-level jet streak.
Areas of upper-level divergence are often associated with an upper-level jet streak (divergence usually occurs in the right-entrance and left-exit regions) and/or upper-level diffluent wind flow. In operations, CWB forecasters often observe that strong convection is better connected to the area of distinct upper-level diffluent flow (defined by the angle in the spread of the wind vectors to be greater than 45˚) than the right-entrance region of a jet streak. Occasionally, forecasters find distinct upper-level diffluent flow aligning with the right-entrance region of the jet streak, which can produce enhanced lift and favorable conditions for convection.
Question
On the 200 hPa model analysis, use the drawing tool to draw arrows that indicate distinct upper-level diffluent wind flow (yellow pen) and associated divergence area (red pen) near Taiwan.
Model analysis of 200 hPa streamlines and wind speed (kts, shaded, scale at upper left) for upper-level diffluence question.
| Tool: | Tool Size: | Color: |
|---|---|---|
|
|
Compare your drawing to the expert one.
Low-level Jet Lift
Positive shear vorticity is present on the left side of a westerly LLJ, and an area of speed convergence is found downstream of the LLJ core. Both factors, in addition to the advection of warm, moist air by the LLJ, will create an environment favorable for convection.
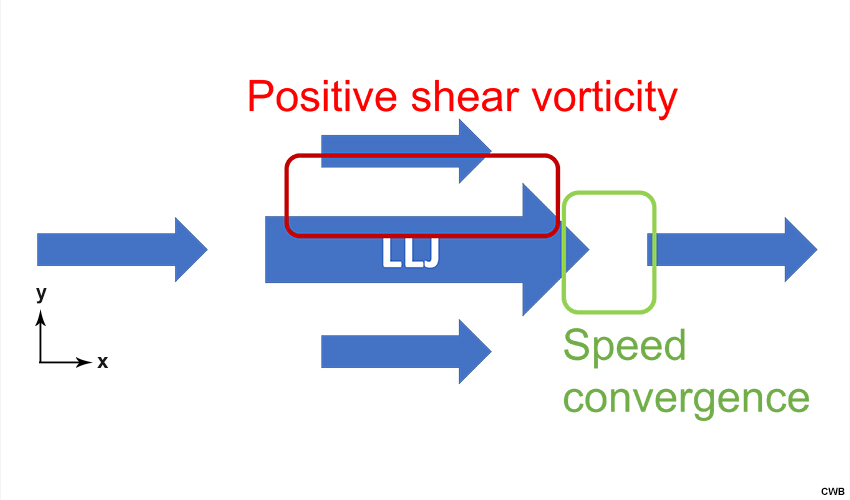
Conceptual diagram of the positive shear vorticity and speed convergence associated with a low-level jet (LLJ).In this diagram, “x” is in the direction of the LLJ.
Question
Use the drawing tool to draw arrows that indicate a LLJ near Taiwan (black pen), and outline areas of positive shear vorticity (red pen) and speed convergence (white pen) that are favorable for convection on the 850 hPa model analysis.
Model analysis of 850 hPa streamlines and wind speed (kts, shaded and contoured in yellow at 5-kts intervals) for low-level jet lift question.
| Tool: | Tool Size: | Color: |
|---|---|---|
|
|
Compare your drawing to the expert one.
Question
Based on what you have learned above, outline the area throughout the atmosphere that is most favorable for precipitation development.
A conceptual image of the atmospheric environment conducive for heavy rainfall over Taiwan during the Mei-Yu season.
| Tool: | Tool Size: | Color: |
|---|---|---|
|
|
Review the animation below and compare it to your drawing.
Conceptual animation illustrating the atmospheric characteristics of the Mei-Yu front at different levels, valid at 0000 UTC on May 24, 2015.
Mei-Yu Forecast Procedure in Taiwan
The Mei-Yu forecast procedure in Taiwan can be described by the following four steps:
- Use satellite and radar to analyze the Mei-Yu front and the mesoscale convective systems (MCSs) associated with it.
- Use NWP model guidance and the Mei-Yu Front Checklist to analyze the 3D structure of the atmosphere, and identify the Mei-Yu precipitation pattern associated with the front.
- Use NWP model guidance to identify trends in the movement of the surface front.
- Use QPF guidance to determine the possible time period and area of torrential rainfall.
The graphic below shows the detailed steps of the forecast procedure during the Mei-Yu season:
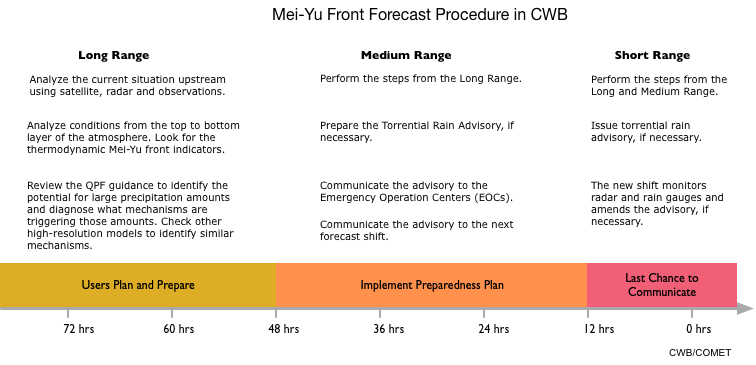
Timeline of the short-term forecasting procedure during the Mei-Yu season.
- Analyze the current situation in the upstream using satellite data, radar, and soundings to find the presence and location of synoptic-scale features (e.g. surface front) and MCSs.
- Analyze conditions from the top to bottom layer of the atmosphere. Look for the thermodynamic indicators of the Mei-Yu front using the Mei-Yu Checklist such as the LLJ, high 850 hPa theta-e values, mid-level trough, upper-level jet and diffluent flow. These indicators help forecasters predict what will happen when the front approaches Taiwan. Then, compare the synoptic-scale observations to their depiction in the model analysis.
- Review the QPF guidance to identify the potential for large precipitation amounts and diagnose what mechanisms are triggering those amounts. Check other high-resolution models to identify similar mechanisms.
- Prepare the Torrential Rain Advisory, if necessary.
- Communicate the advisory to the Emergency Operation Centers (EOCs).
- Communicate the advisory to the next forecast shift.
- Issue torrential rain advisory, if necessary.
- The new shift monitors radar and rain gauges and amends the advisory, if necessary.
In this module, we will focus on the first two steps in the procedure. The rest will be covered in a future module.
Mei-Yu Forecast Process in Taiwan » The Mei-Yu Checklist
Since 1997, CWB uses a checklist based on the work of Shieh (1996) to evaluate the synoptic environment and to assist with 12–48-hour heavy rainfall forecasts during the Mei-Yu season. The checklist currently contains a total of 20 items categorized into nine groups (Wang et al. 2012). Forecasters check for the items based on numerical model forecasts valid for a 12-hour period. As present in the NWP guidance, the possibility of heavy rain in a 12-hour period increases as more items are marked. Currently, CWB uses a threshold of 14 marked items to indicate a high chance for heavy rainfall events.
CWB’s Mei-Yu Checklist
(All items are inside the domain of 15–30˚N, 110–127˚E.)
|
Checklist Items |
Obj |
12h |
24h |
36h |
|
(a) Surface Mei-Yu Front |
||||
|
||||
|
||||
|
||||
|
(b) Humidity |
||||
|
||||
|
||||
|
||||
|
(c) LLJ (between 18˚-26˚N and 115˚-125˚E.) |
||||
|
||||
|
||||
|
||||
|
||||
|
(d) Temperature |
||||
|
||||
|
||||
|
(e) Shearline (between 22˚-28˚N and 114˚-127˚E) |
||||
|
||||
|
(f) Sub-synoptic system (along the coast of southeastern China or in northern SCS, east of 114˚E) |
||||
|
||||
|
||||
|
(g) Pressure (near Taiwan) |
||||
|
||||
|
||||
|
(h) Upper-level wind |
||||
|
||||
|
||||
|
(i) Stability |
||||
|
||||
|
Total Checks |
||||
Question
Review the model forecasts and text information below. Use the Mei-Yu Checklist to determine the potential for severe precipitation across Taiwan and answer the questions below.
You are working on a potential Mei-Yu front precipitation event using CWB’s Mei-Yu Checklist. The objective analysis time is at 1200 UTC on June 13. The forecast is for 36 hours in 12-hour intervals. Within a domain between 15˚-30˚N and 110˚-127˚E, you have determined the following conditions:
- the 850 hPa dew point is over 15℃ from 0-36h,
- the difference between the temperature and the dewpoint at 700 hPa is 2℃ from 12-36h, and
- the K-Index is higher than 35 from 12-24h.
Please use the Mei-Yu Checklist to confirm the other items based on the NWP model guidance below.
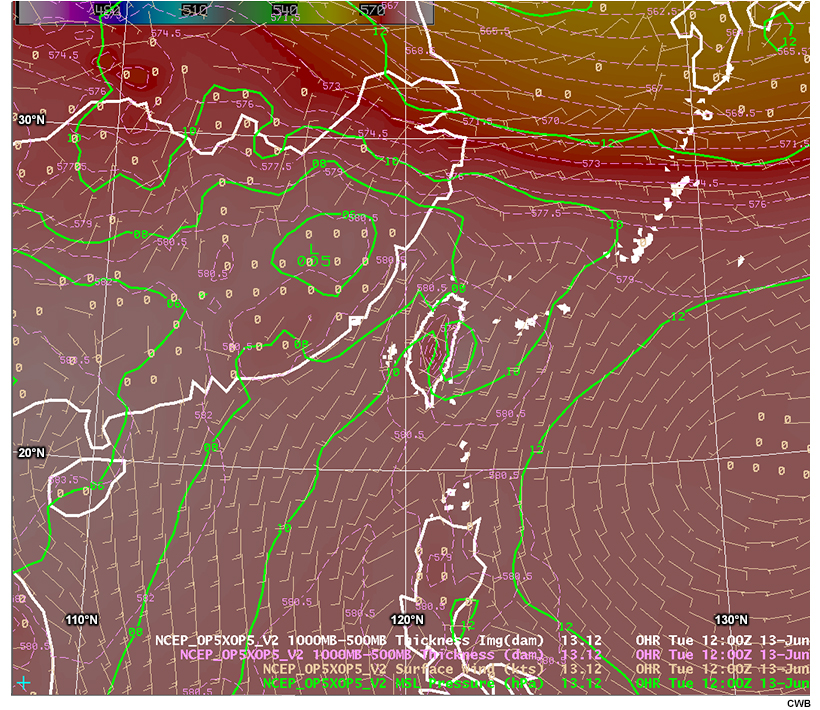
Loop of model forecast for surface wind (a full barb is 10 kts), mean sea level pressure (hPa, contoured in green at 2 hPa intervals), and 1000-500 hPa thickness (dam, shaded and contoured in pink-dashed line at intervals of 1.5 dam).
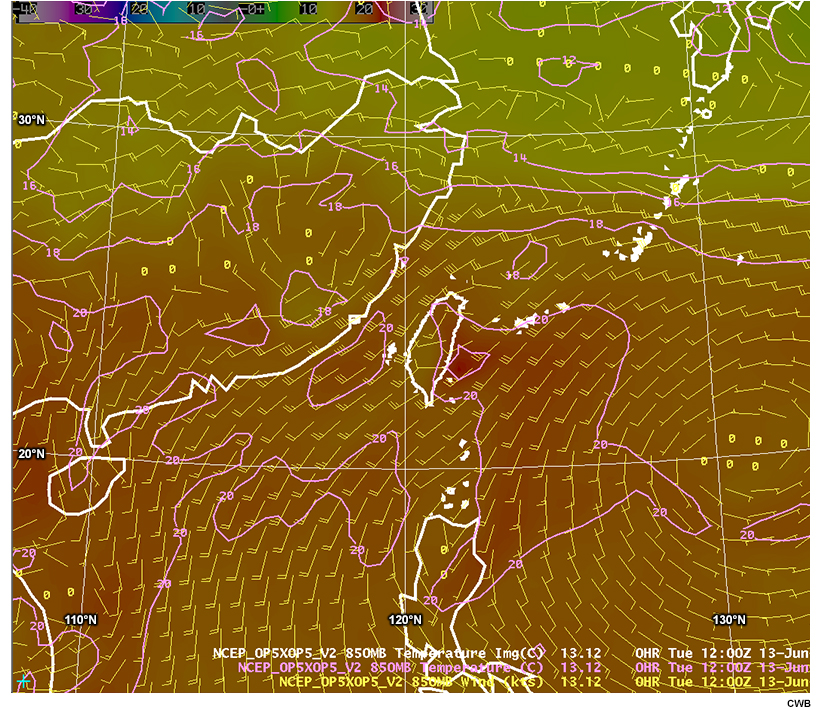
Loop of model forecast for 850 hPa winds (a full barb is 10 kts) and temperature (℃, shaded and contoured in pink at intervals of 2℃).
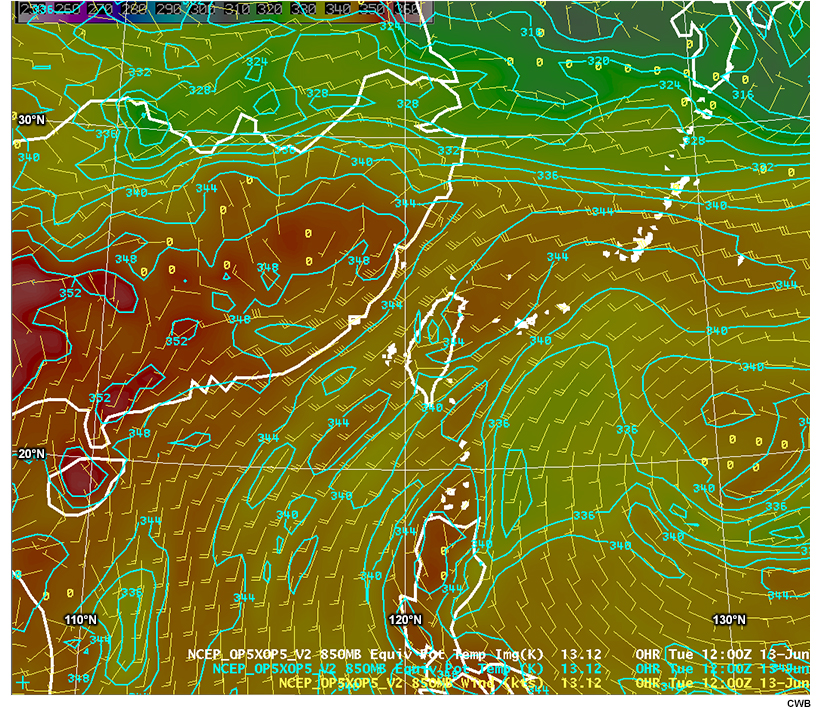
Loop of model forecast for 850 hPa winds (a full barb is 10 kts) and equivalent potential temperature (K, shaded and contoured in blue at 4-K intervals).
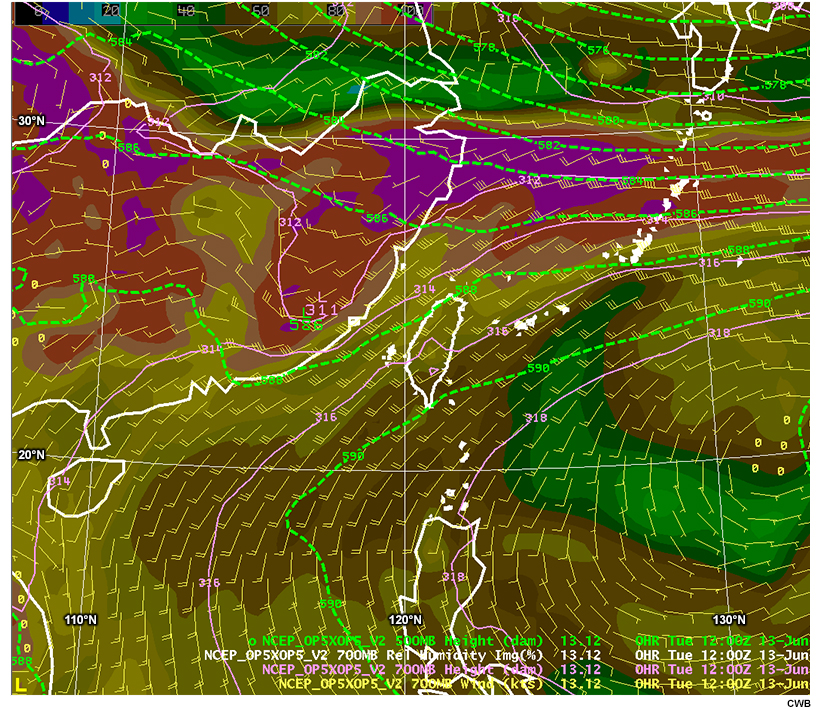
Loop of model forecast for 700 hPa wind (a full barb is 10 kts), relative humidity (%, shaded), geopotential height (dam, contoured in pink at 2-dam intervals), and 500 hPa geopotential height (dam, contoured in green-dashed line at 2-dam intervals).
Loop of model forecast for 200 hPa streamline and wind speed (kts, shaded, scale at upper left).
CWB’s Mei-Yu Checklist
(All items inside the domain of 15–30˚N, 110–127˚E.)
|
Checklist Items |
Obj |
12h |
24h |
36h |
|
(a) Surface Mei-Yu Front |
||||
|
||||
|
||||
|
||||
(b) Humidity |
||||
|
||||
|
||||
|
||||
|
(c) LLJ (between 18˚-26˚N and 115˚-125˚E.) |
||||
|
||||
|
||||
|
||||
|
||||
|
(d) Temperature |
||||
|
||||
|
||||
|
(e) Shearline (between 22˚-28˚N and 114˚-127˚E) |
||||
|
||||
|
(f) Sub-synoptic system (along the coast of southeastern China or in northern SCS, east of 114˚E) |
||||
|
||||
|
||||
|
(g) Pressure (near Taiwan) |
||||
|
||||
|
||||
|
(h) Upper-level wind |
||||
|
||||
|
||||
|
(i) Stability |
||||
|
||||
|
Total Checks |
0 |
0 |
0 |
0 |
Question
Based on your assessment of the model analysis and forecast and Mei-Yu Checklist, when is the potential for severe precipitation across Taiwan?
There should be 14 items checked in the 12-hour column, and 13 items checked in the 24-hour column. Therefore, forecasters need to be aware of the potential for severe precipitation between 00 UTC June 14 and 00 UTC June 15.
Mei-Yu Forecast Process in Taiwan » Four Main Factors for Severe Precipitation
Although there are many factors that contribute to heavy rain during the Mei-Yu season, CWB forecasters focus on several key elements based on their past forecast experience: the location of the surface front, low-level jet, low-level theta-e values and axis, and distinct upper-level diffluence (to detect area of divergence). The first three provide the main thermodynamic processes for convection and are key to determining the Mei-Yu precipitation pattern. Upper-level divergence associated with distinct upper-level diffluent flow results in lift. When these features synchronize well, heavy precipitation is likely. For more information on the significance of the checklist parameters to different basins in Taiwan, see Wang et al. (2012). Next, we will learn about the two main Mei-Yu precipitation patterns and the various forecast factors in each pattern.
Types of Mei-Yu Precipitation Patterns
Type-1
The 6-hour radar composite reflectivity animation and accumulated rainfall of a “Type-1” Mei-Yu precipitation event are shown in the tabs below. A strong “Type-1” event shows a linear convective system near the surface front that is producing extremely heavy rainfall (possibly exceeding 100 mm per hour). The linear convective system may persist for several hours.
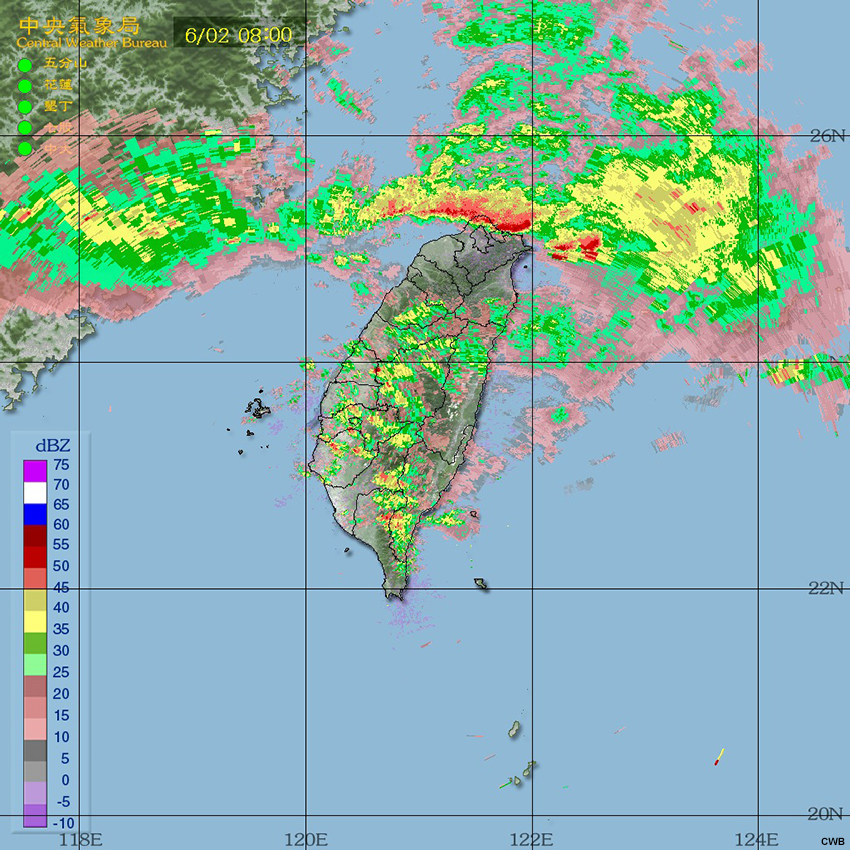
Composite Reflectivity
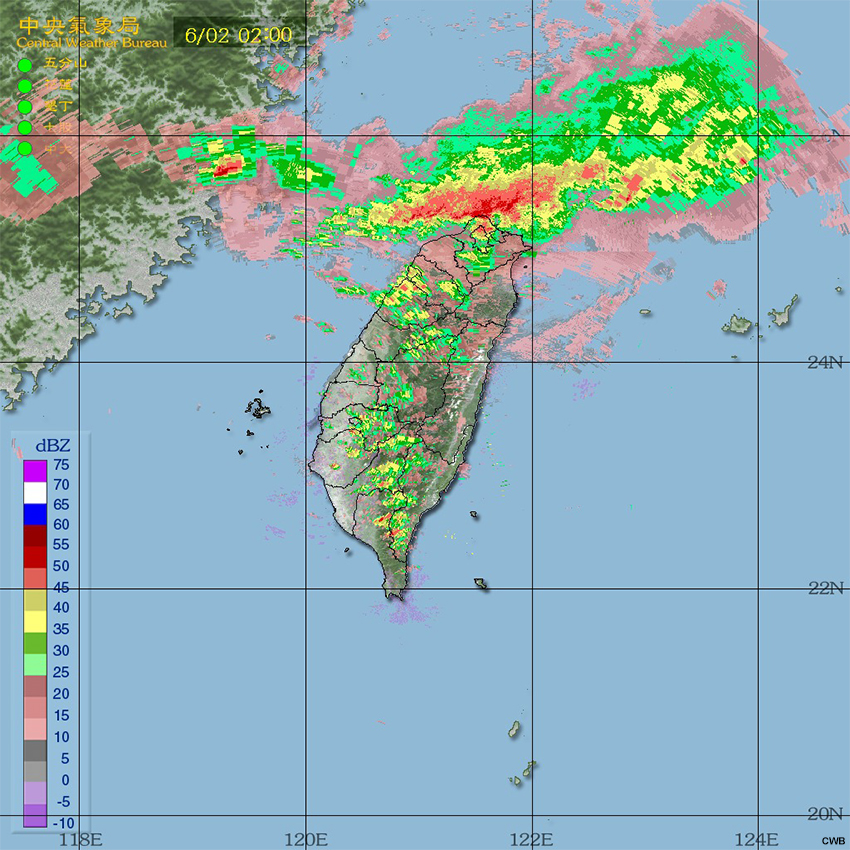
Radar composite reflectivity loop of a Type-1 Mei-Yu case from 18 UTC June 1 to 00 UTC June 2 (02:00 LT to 08:00 LT June 2).
Accumulated Rainfall
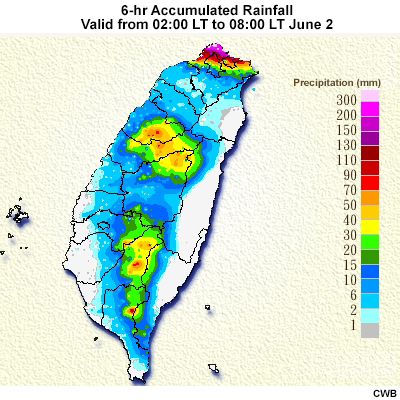
6-hour accumulated rainfall of a Type-1 Mei-Yu case from 18 UTC June 1 to 00 UTC June 2 (02:00 to 08:00 LT June 2).
Taiwan Population
Population density map of Taiwan. Mountainous areas (above 500 meters) are signified by the brown area in the figure.
Review the composite radar reflectivity loop and rainfall accumulation map above, and answer the questions below.
Question 1 of 3
What is the most probable position of the surface front? Select the best answer.
Continue to next question.
Question 2 of 3
How will you describe the southwesterly wind ahead of the surface front? Select the best answer.
Continue to next question.
Question 3 of 3
What are the main lifting mechanisms for a Type-1 event? Select all that apply.
The correct answers are highlighted above. In a Type-1 event, the main lifting mechanisms are frontal lifting and positive wind shear vorticity induced by the LLJ. The LLJ is often strong and its axis is very close to the low-level wind shear line. When the positive wind shear vorticity on the left side of the LLJ is very large, conditions are favorable for the development of a linear convective system.
The linear convective system usually appears along or just ahead of the surface front, and will follow the front’s movement. Because a Type-1 event does not require orographic lifting, Taiwan’s plains are at risk of experiencing heavy rain and flooding. Although thermal lift (induced by high convective instability, or high low-level theta-e) is one of the factors that can produce Mei-Yu precipitation, it is not the main lifting mechanism for a linear convective system.
Type-2
The 6-hour composite radar reflectivity animation and accumulated rainfall of a “Type-2” Mei-Yu precipitation event are shown in the tabs below.
Composite Reflectivity
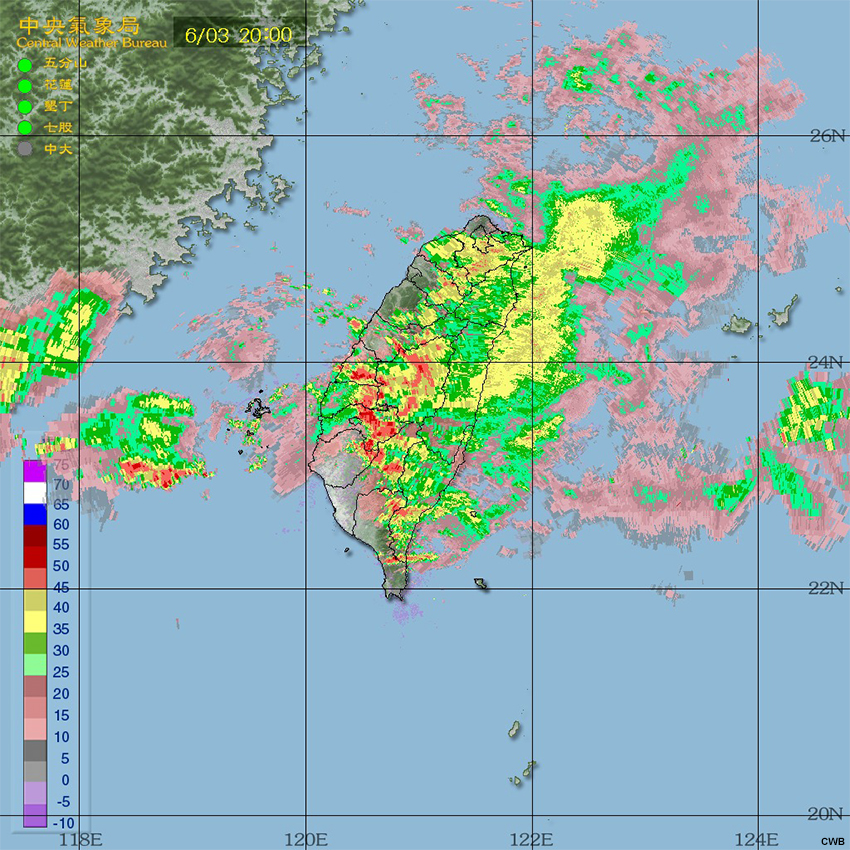
Radar composite reflectivity loop of a Type-2 Mei-Yu case from 12 UTC June 3 to 18 UTC June 3 (20:00 LT June 3 to 02:00 LT June 4).
Accumulated Rainfall
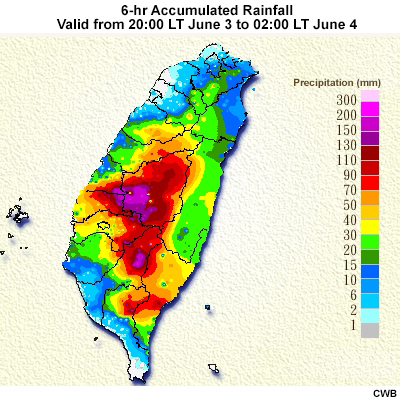
6-hour accumulated rainfall of a Type-2 Mei-Yu case from 12 UTC June 3 to 18 UTC June 3 (20:00 LT June 3 to 02:00 LT June 4).
Taiwan Population
Population density map of Taiwan. Mountainous areas (above 500 meters) are signified by the brown area in the figure.
Review the composite radar reflectivity loop and rainfall accumulation map above, and answer the questions below.
Question 1 of 3
What is the most probable position of the surface front? Select the best answer.
Continue to next question.
Question 2 of 3
How will you describe the southwesterly wind ahead of the surface front? Select the best answer.
Continue to next question.
Question 3 of 3
What are the main lifting mechanisms for a Type-2 event? Select all that apply.
The correct answers are highlighted above. The main lifting mechanism for a “Type-2” event is orographic lifting (strong southwesterly winds lifted by the CMR). A Type-2 event is likely in the Central and South Area of Taiwan when moderate to strong southwest winds in the low- to mid-levels of the atmosphere carry warm, moist air (suggested by high theta-e values) towards the island. Mountainous areas in the Central and South Area of Taiwan are at greatest risk to a Type-2 event. A LLJ may not be present or even if it was, the axis pointing towards the mountains may not be clearly discernible. During a Type-2 event, the daily rainfall often exceeds 200 mm and such extreme rainfall could persist for several days.
Type-1+2
Often times, Type-1 and Type-2 events occur simultaneously. The 6-hour composite radar reflectivity animation and accumulated rainfall of a “Type-1+2” Mei-Yu precipitation event are shown below.
Composite radar reflectivity loop of a Type-1+2 Mei-Yu case from 00 UTC (08:00 LT) June 2 to 06 UTC (14:00 LT) June 2.
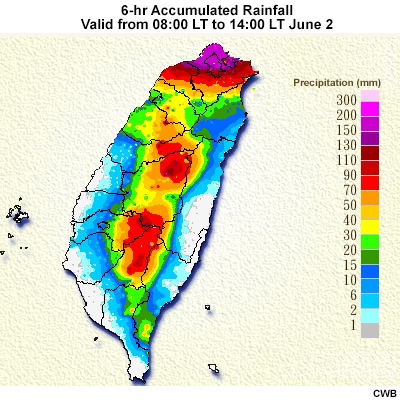
6-hour accumulated rainfall of a Type-1+2 Mei-Yu case from 00 UTC (08:00 LT) June 2 to 06 UTC (14:00 LT) June 2.
Determine the Mei-Yu Precipitation Pattern
Meteorologists try to compose a three-dimensional structure of the atmosphere using observations and numerical model maps at standard pressure levels. In order to forecast the Mei-Yu precipitation pattern and the areas at risk of precipitation, we need to review surface analyses, satellite data, observations, and NWP guidance to identify the areas of rising motion. Consider the following steps:
- Identify the location of the surface front
- Determine the moisture availability with low-level theta-e
- Identify the presence and orientation of the LLJ
- Identify the presence of upper-level divergence (associated with diffluent flow)
- Determine the Mei-Yu precipitation pattern and locations at risk for heavy rainfall
Next, we are going to practice these steps using model analysis to identify the four main Mei-Yu parameters (surface front, low-level jet, low-level theta-e values and axis, and upper-level diffluence) and their ascent areas during past Mei-Yu events. Also, we will analyze the Mei-Yu precipitation patterns in 6-hour intervals (00, 06, 12, and 18 UTC). If a heavy-rain event occurred during the 00-06 UTC time frame, we will analyze the weather conditions at 00 UTC for the upcoming heavy-rain event.
Determine the Mei-Yu Precipitation Pattern » Case 1
Determine the Mei-Yu Precipitation Pattern » Case 1 » Location of the Front
Model Surface and 850 mb Analysis
Question
Use the drawing tool below to identify the location of the surface front (black pen) and frontal lifting areas (white pen) on the model analysis map.
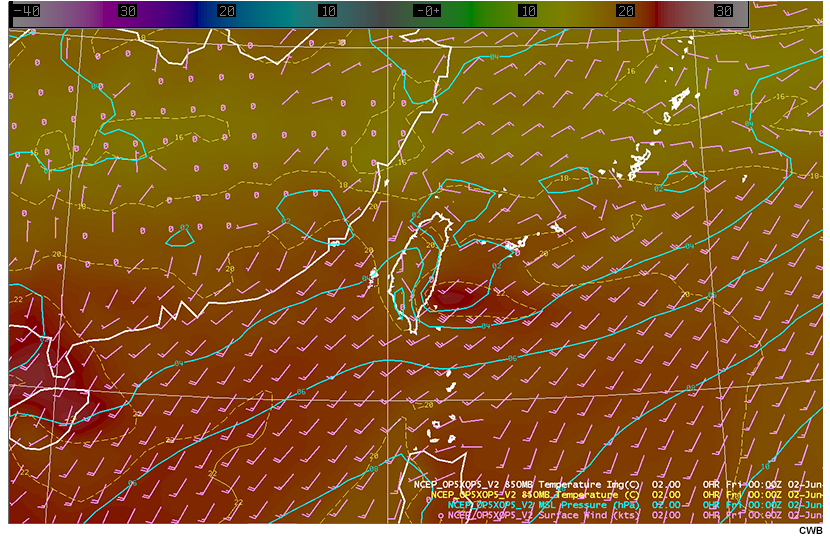
Model analysis of mean sea level pressure (hPa, contoured in blue at 2 hPa intervals), surface winds (a full barb is 10 kts), and 850 hPa temperature (℃, shaded and contoured in yellow-dashed line at intervals of 2℃) at 18 UTC on June 1.
| Tool: | Tool Size: | Color: |
|---|---|---|
|
|
Compare your drawing to the expert one.
Water Vapor and Surface Observations
Question
Use the drawing tool below to identify the location of the surface front (black pen) and frontal lifting areas (white pen) on the water vapor satellite image with surface observations.
Water vapor satellite imagery and surface observations at 18 UTC on June 1.
| Tool: | Tool Size: | Color: |
|---|---|---|
|
|
Compare your drawing to the expert one.
Question
Compare the model analysis to observations. Based on your findings, how will you adjust the location of the surface front in the model analysis?
The correct answer is displayed above. The observations show that the front is located offshore from North Taiwan. Convection often occurs to the south of the Mei-Yu front as shown in the satellite image. The front’s position in the model analysis aligns well with the observations.
Determine the Mei-Yu Precipitation Pattern » Case 1 » Moisture Availability
Model 850 hPa Theta-e
Question
Use the drawing tool below to identify the shear line (black pen) and outline contours of 348 K (white pen), 352 K (orange pen), and 356 K (red pen) on the 850 hPa model analysis map.
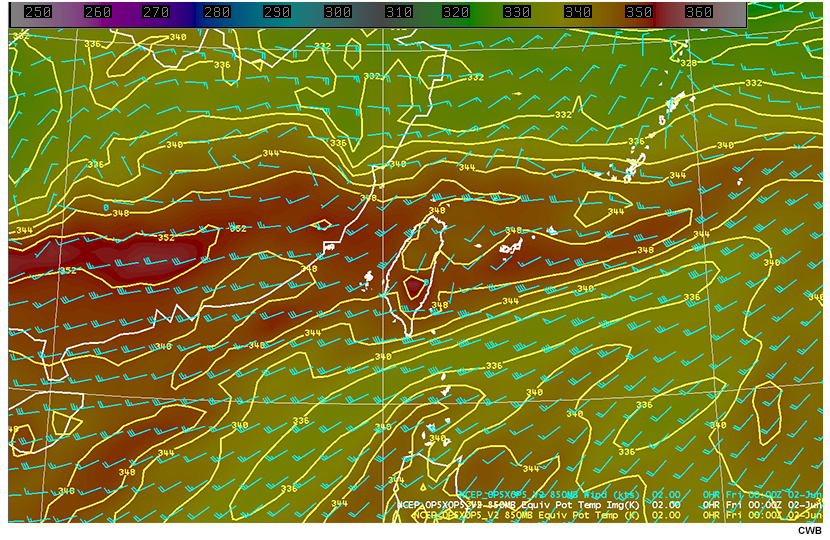
Model analysis of 850 hPa winds (a full barb is 10 kts) and equivalent potential temperature (K, shaded and contoured in yellow at 4-K intervals) at 18 UTC on June 1.
| Tool: | Tool Size: | Color: |
|---|---|---|
|
|
The correct answers are displayed above. Based on the 850 hPa model analysis, we found that:
- The position of the 850 hPa shear line is close to the surface front.
- The axis of high theta-e points to the offshore region of the North Area.
TPW Obs
Question
Compare the 850 hPa model analysis to TPW. Based on your findings, how will you adjust the model analysis?
The TPW product indicates more moisture in the area from the SCS to the South Taiwan Strait than what is depicted by the model. This suggests that below 850 hPa, more moisture could be transported from the SCS to Taiwan than what is captured by the model.
Determine the Mei-Yu Precipitation Pattern » Case 1 » Presence and Orientation of the LLJ
Question
Use the drawing tool below to identify the low-level jets (orange pen), positive shear vorticity areas (red pen) and speed convergence areas (white pen) on the 850 hPa model analysis map.
Model analysis of 850 hPa streamline and wind speed (kts, shaded and contoured in yellow at 5-kts intervals) at 18 UTC on June 1.
| Tool: | Tool Size: | Color: |
|---|---|---|
|
|
The correct answers are displayed above. Based on the model analysis, the LLJ that is north of Taiwan is just south of the shear line and is very strong (the maximum 850 hPa wind speed is up to 40 knots), resulting in strong positive shear vorticity between the LLJ and the shear line.
Question
Compare the 850 hPa model analysis (above) to wind observations (below). Based on your findings, how will you adjust the model analysis?
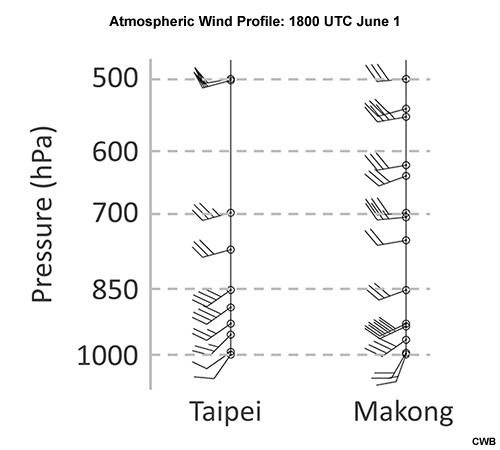
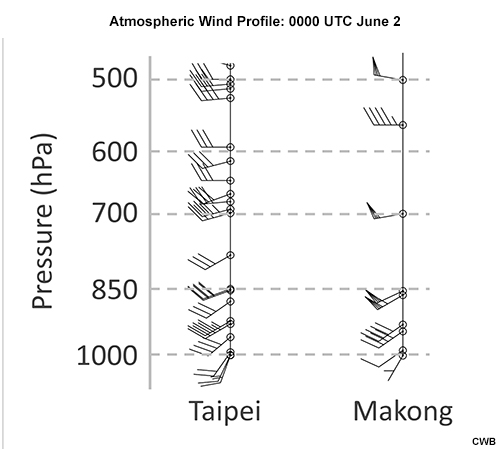
Atmospheric wind profile (a full barb is 10 kts) for Taipei and Makong at 1800 UTC on June 1.
The 850 hPa wind speed in Taipei and Makong are 40 kts and 30 kts respectively. The model analysis values are similar to what is observed.
Determine the Mei-Yu Precipitation Pattern » Case 1 » Upper Level Divergence
Question
Use the drawing tool below to draw arrows identifying the distinct diffluence (yellow pen) and outline the associated upper-level divergence area (red pen) on the 200 hPa model analysis map.
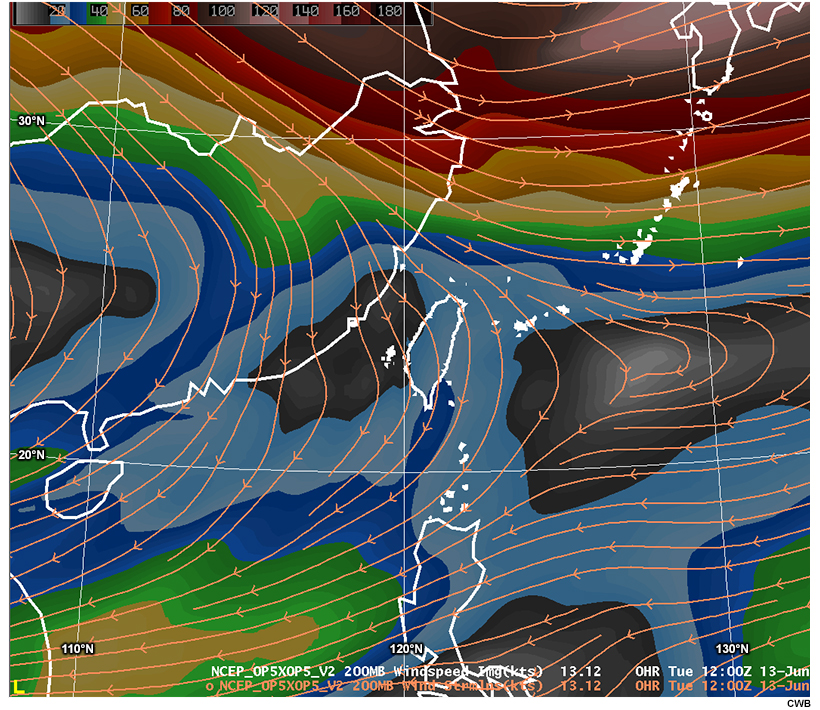
Model analysis of 200 hPa streamlines and wind speed (kts, shaded, scale at upper left) at 18 UTC on June 1.
| Tool: | Tool Size: | Color: |
|---|---|---|
|
|
The correct answers are displayed above. The 200-hPa diffluence, which in this case aligns with the right-entrance region of the upper-level jet streak, resulted in lift over the North Taiwan Strait (the angle of diffluence was up to 45 degrees).
Determine the Mei-Yu Precipitation Pattern » Case 1 » Determine the Locations at Risk of Heavy Rainfall
Model Analysis - Surface
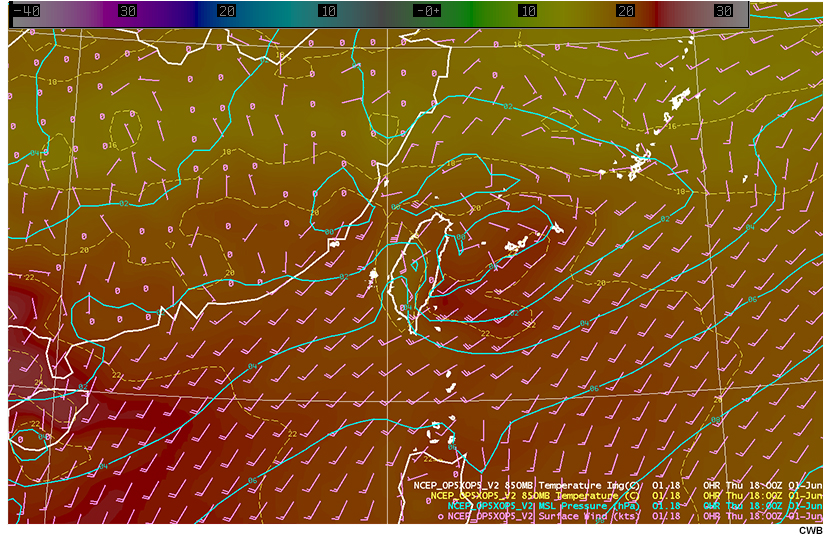
Model analysis of 850 hPa temperature (C), mean sea level pressure (hPa), and surface wind (kts) at 18 Z on June 1, 2017.
Model Analysis - 850 hPa Theta-E
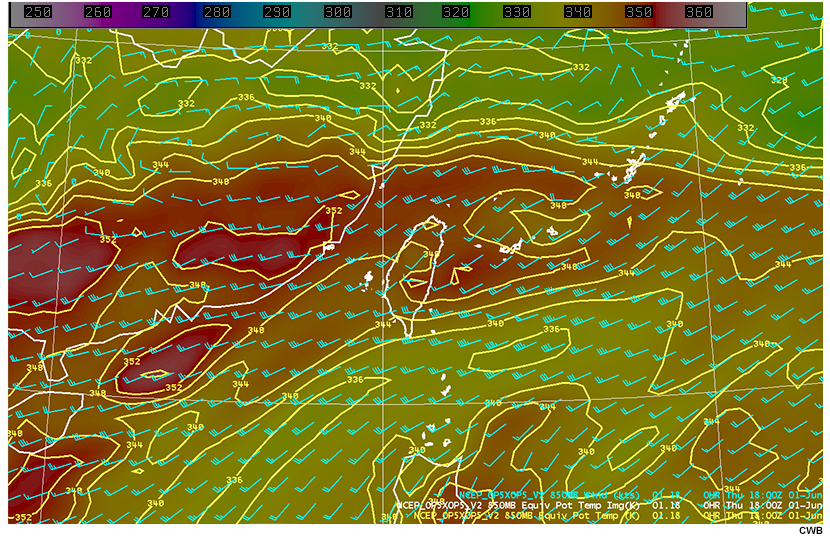
Model analysis of 850 hPa winds (kts) and equivalent potential temperature (K) at 18 Z on June 1, 2017.
Model Analysis - 850 hPa Winds
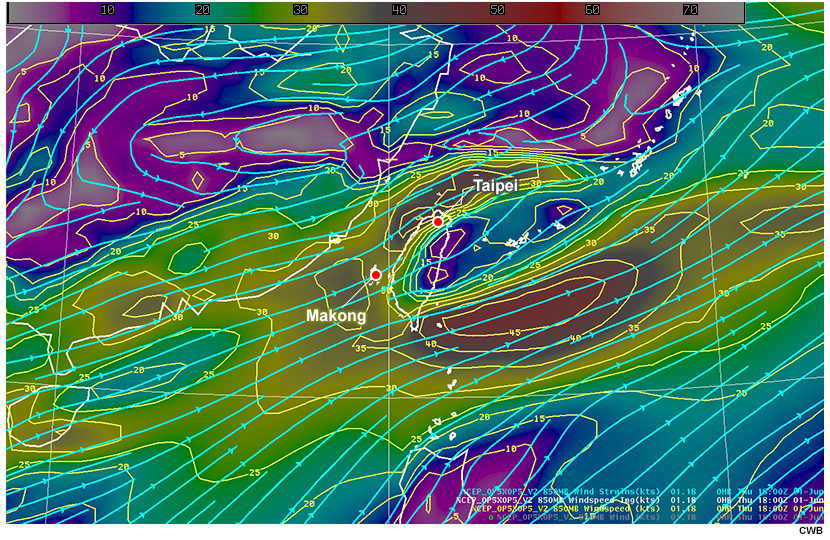
Model analysis of 850 hPa streamlines (kts) and wind speed (kts) at 18 Z on June 1, 2017.
Model Analysis - 200 hPa
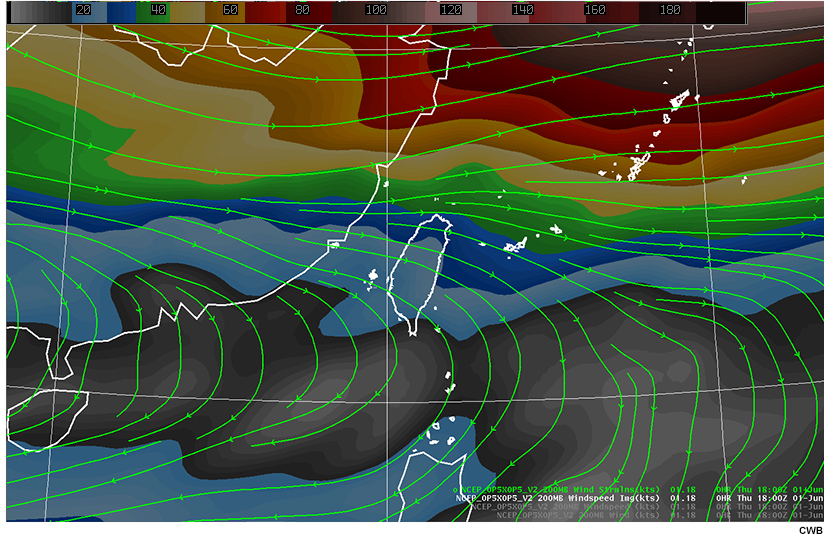
Model analysis of 200 hPa streamlines (kts) and wind speed (kts) at 18 Z on June 1, 2017.
Question 1 of 3
What forcing mechanisms are operating in this case? Select all that apply.
Continue to next question.
Question 2 of 3
Based on your findings, which precipitation pattern is likely to occur?
Continue to next question.
Question 3 of 3
Based on your findings, select the area(s) which is/are more likely to receive extremely heavy rain in the next 6 hours?
The correct answers are displayed above. Based on the model analysis and comparing it to the observations, all of the above features indicate a high potential for a strong Type-1 precipitation event.
With the possibility of a Type-1 event, you should be aware of the surface front’s movement and changes in its strength. If it maintains its current strength and moves to the North Area in the next 6 hours, it will likely bring extremely heavy rain to northern Taiwan.
The 6-hour composite radar reflectivity loop and accumulated rainfall observations are shown below. Both show data for the six-hour period after the model analysis timestamp.
Composite radar reflectivity loop of a Type-1 Mei-Yu case from 18 UTC June 1 to 00 UTC June 2 (02:00 LT to 08:00 LT June 2).
6-hour accumulated rainfall from 18 UTC June 1 to 00 UTC June 2 (02:00 LT to 08:00 LT June 2).
Determine the Locations at Risk of Heavy Rainfall » Case 2
Determine the Locations at Risk of Heavy Rainfall » Case 2 » Location of the Front
Model Surface and 850 mb Analysis
Question
Use the drawing tool below to identify the location of the surface front (black pen) and frontal lifting areas (white pen) on the model analysis map.
Model analysis of mean sea level pressure (hPa, contoured in blue at 2 hPa intervals), surface winds (a full barb is 10 kts), and 850 hPa temperature (℃, shaded and contoured in yellow-dashed line at intervals of 2℃) at 00 UTC on June 2.
| Tool: | Tool Size: | Color: |
|---|---|---|
|
|
Compare your drawing to the expert one.
Water Vapor and Surface Observations
Question
Use the drawing tool below to identify the location of the surface front (black pen) and frontal lifting areas (white pen) on the water vapor satellite image with surface observations.
Water vapor satellite imagery and surface observations at 00 UTC on June 2.
| Tool: | Tool Size: | Color: |
|---|---|---|
|
|
Compare your drawing to the expert one.
Question
Compare the model analysis to observations. Based on your findings, how will you adjust the location of the surface front in the model analysis?
The correct answer is displayed above. Based on the model analysis, the surface front is located offshore from North Taiwan, and broken into two parts due to Taiwan’s terrain. The front’s position in the model analysis aligns well with the observations.
Determine the Mei-Yu Precipitation Pattern » Case 2 » Moisture Availability
Model 850 hPa Theta-e
Question
Use the drawing tool below to identify the shear line (black pen) and outline contours of 348 K (white pen), 352 K (orange pen), and 356 K (red pen) on the 850 hPa model analysis map.
Model analysis of 850 hPa winds (a full barb is 10 kts) and equivalent potential temperature (K, shaded and contoured in yellow at 4-K intervals) at 00 UTC on June 2.
| Tool: | Tool Size: | Color: |
|---|---|---|
|
|
The correct answers are displayed above. Based on the 850 hPa model analysis, we found that:
- The 850 hPa shear line is located just north of the surface front.
- Two axes of high theta-e point to Taiwan and the offshore region of the North Area.
TPW Obs
Loop of total precipitable water (inches, mm) from 18 UTC on June 1 to 00 UTC on June 2.
Question
Compare the 850 hPa model analysis to TPW. Based on your findings, how will you adjust the model analysis?
The TPW product indicates more moisture in the area from the SCS to the South Taiwan Strait than what is depicted by the model. This suggests that below 850 hPa, more moisture could be transported from the SCS to Taiwan than what is captured by the model.
Determine the Mei-Yu Precipitation Pattern » Case 2 » Presence and Orientation of the LLJ
What we know so far:
Question
Use the drawing tool below to draw arrows identifying the low-level jets (orange pen), and outline areas of positive shear vorticity (red pen) and speed convergence (white pen) on the 850 hPa model analysis map.
Model analysis of 850 hPa streamline and wind speed (kts, shaded and contoured in yellow at 5-kts intervals) at 00 UTC on June 2.
| Tool: | Tool Size: | Color: |
|---|---|---|
|
|
The correct answers are displayed above. Based on the model analysis, the LLJ that is north of Taiwan is just south of the shear line and is very strong (the maximum 850 hPa wind speed is about 40 knots), resulting in strong positive shear vorticity between the LLJ and the shear line.
Question
Compare the 850 hPa model analysis (above) to wind observations (below). Based on your findings, how will you adjust the model analysis?
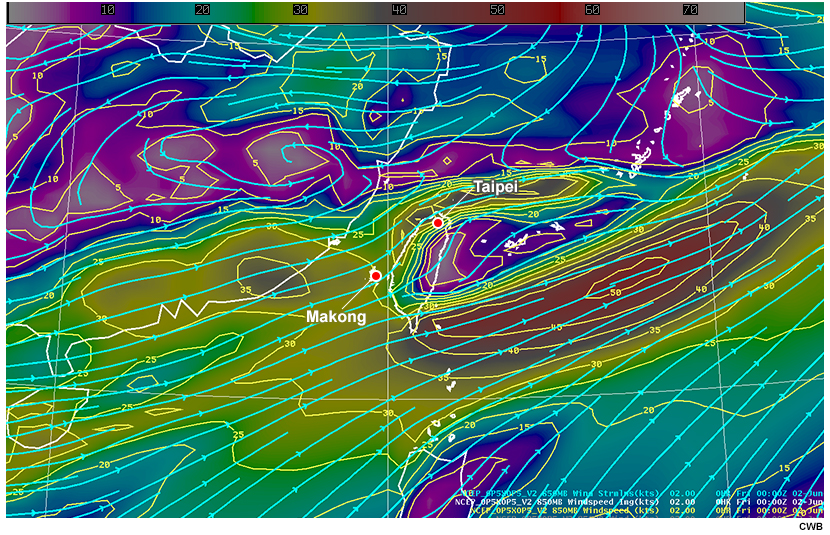
Atmospheric wind profile (a full barb is 10 kts) for Taipei and Makong at 0000 UTC on June 2.
The correct answer is displayed above. The 850 hPa wind speed in Taipei and Makong are 50 kts and 30 kts respectively. The strength of the model winds needs to increase over northern Taiwan.
Determine the Mei-Yu Precipitation Pattern » Case 2 » Upper Level Divergence
What we know so far:
Question
Use the drawing tool below to draw arrows identifying the distinct diffluence (yellow pen) and outline the associated upper-level divergence area (red pen) on the 200 hPa model analysis map.
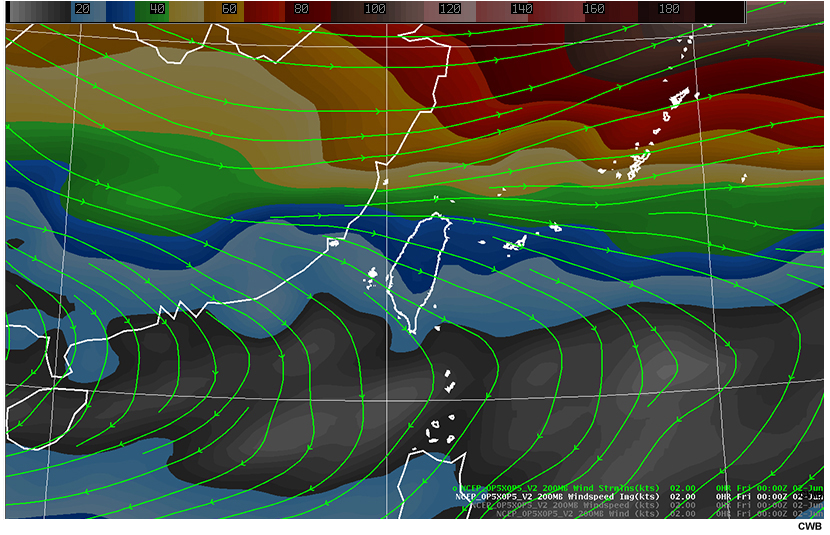
Model analysis of 200 hPa streamlines and wind speed (kts, shaded, scale at upper left) at 00 UTC on June 2.
| Tool: | Tool Size: | Color: |
|---|---|---|
|
|
The correct answers are displayed above. The 200-hPa diffluence, which in this case aligns with the right-entrance region of the upper-level jet streak, resulted in lift over the North Taiwan Strait (the angle of diffluence was up to 45 degrees).
Determine the Mei-Yu Precipitation Pattern » Case 2 » Determine the Locations at Risk of Heavy Rainfall
What we know so far:
Model Analysis - Surface
Model analysis of 850 hPa temperature (C), mean sea level pressure (hPa), and surface wind (kts) at 00 Z on June 2, 2017.
Model Analysis - 850 hPa Theta-E
Model analysis of 850 hPa winds (kts) and equivalent potential temperature (K) at 00 Z on June 2, 2017.
Model Analysis - 850 hPa Winds
Model analysis of 850 hPa streamlines (kts) and wind speed (kts) at 00 Z on June 2, 2017.
Model Analysis - 200 hPa
Model analysis of 200 hPa streamlines (kts) and wind speed (kts) at 00 Z on June 2, 2017.
Question 1 of 3
What forcing mechanisms are operating in this case? Select all that apply.
Continue to the next question.
Question 2 of 3
Based on your findings, which precipitation pattern is likely to occur?
Continue to the next question.
Question 3 of 3
Based on your findings, select the area(s) which is/are more likely to receive extremely heavy rain in the next 6 hours.
The correct answers are displayed above. Based on the model analysis and comparing it to the observations, the features are similar to a Type-1 precipitation event. However, in this case, the surface front is closer to the North Area. Also, the area of high theta-e covers all of Taiwan (the high theta-e area in the previous case only covered the North Area). Based on these findings, both Type-1 and Type-2 precipitation events could occur in the next 6 hours.
The 6-hour composite radar reflectivity loop and accumulated rainfall observations are shown below. Both show data for the six-hour period after the model analysis timestamp.
Composite radar reflectivity loop of a Type-1+2 Mei-Yu case from 00 UTC (08:00 LT) June 2 to 06 UTC (14:00 LT) June 2.
6-hour accumulated rainfall of a Type-1+2 Mei-Yu case from 00 UTC (08:00 LT) June 2 to 06 UTC (14:00 LT) June 2.
Summary
This module introduced learners to the impacts, climatology, 3D structure, and precipitation patterns produced by the Mei-Yu front over Taiwan. The front is a complex weather system with important features operating at different temporal and spatial resolutions. The module included a conceptual understanding of the Mei-Yu front and an overview of CWB's precipitation forecast procedure. Future modules will discuss the QPF guidance that forecasters can use to predict the Mei-Yu front event.
The four main parameters that influence the distribution and intensity of precipitation during a Mei-Yu event are: the location of the surface front, the strength and axis orientation of the LLJ, the strength of the low-level theta-e values, and the strength of the upper-level diffluence.
There are two basic Mei-Yu front precipitation patterns. The Type-1 pattern results in a severe linear convective system near the front. The Type-2 pattern produces precipitation over central and southern Taiwan (mostly in the mountains) due to the warm, moist southwesterly flow which is lifted by the mountains. The Type-1+2 combines both Type-1 and Type-2 precipitation patterns. Learners worked through several exercises to identify the synoptic and mesoscale features important for a Mei-Yu event, diagnosed the type of precipitation pattern and identified areas that could be impacted. With practice, forecasters will be able to increase their confidence in identifying Mei-Yu features and forecasting its precipitation impacts across Taiwan.
You have reached the end of the lesson. Please complete the quiz and share your feedback with us via the user survey.
References
謝信良 (1996)。嘉南地區定量降水預報整合計畫─總計畫(二)。國科會防災研究報告NSC85-2621-P-052-002,161 頁。
Chen, G. T. -J. (1992): Mesoscale features observed in the Taiwan Mei-Yu season. Journal of the Meteorological Society of Japan. Ser. 2, 70(1B), 497-516.
Chen, G. T. -J. (2004): Research on the phenomena of meiyu during the past quarter century: An overview. East Asian Monsoon, C. P. Chang, Ed., World Scientific Series on Meteorology of East Asia, Vol. 2, World Scientific, 357–403.
Chen, C., Tao, W. -K., Lin, P. -L., Lai, G. S., Tseng, S. -F., & Wang, T. -C. C. (1998): The intensification of the low-level jet during the development of mesoscale convective systems on a Mei-Yu front. Monthly weather review, 126(2), 349-371.
Chen, G. T. -J., Wang, C. -C., & Lin, L. -F. (2006): A diagnostic study of a retreating Mei-Yu front and the accompanying low-level jet formation and intensification. Monthly weather review, 134(3), 874-896.
Chen, G. T. -J., Wang, C. -C., & Liu, S. C. S. (2003). Potential vorticity diagnostics of a Mei-Yu front case. Monthly weather review, 131(11), 2680-2696.
Hsu, J. (1998): ARMTS up and running in Taiwan. Väisälä News, 146, 24–26.
Hung, C. -W., & Hsu, H. -H. (2008): The first transition of the Asian summer monsoon, intraseasonal oscillation, and Taiwan Mei-Yu. Journal of Climate, 21(7), 1552-1568.
Kuo, Y. -H., & Chen, G. T. -J. (1990): The Taiwan area mesoscale experiment (TAMEX): An overview. Bulletin of the American Meteorological Society, 71(4), 488-503.
Shieh, S. -L. (1996): The integrated study on quantitative forecast of precipitation in Chia-Nan Area-Project Office (2) (in Chinese). National Science Council Tech. Rep. NSC-85-2621-P- 052-002, 161 pp.
Wang, C. and G.T. Chen, 2002: Case Study of the Leeside Mesolow and Mesocyclone in TAMEX. Mon. Wea. Rev., 130, 2572–2592.
Wang, C. -C., Kung, C. -Y., Lee, C. -S., & Tai-Jen Chen, G. (2012): Development and evaluation of Mei-Yu season quantitative precipitation forecasts in Taiwan river basins based on a conceptual climatology model. Weather and Forecasting, 27(3), 586-607.
Product Tutorial on TPW Content Products - EUMeTrain (2014)
Jet Streak Circulations - MetEd (2005)
S-290 Unit 6: Atmospheric Stability - MetEd (2010)
Contributors
COMET Sponsors
MetEd and the COMET® Program are a part of the University Corporation for Atmospheric Research's (UCAR's) Community Programs (UCP) and are sponsored by NOAA's National Weather Service (NWS) with additional funding by:
- Bureau of Meteorology of Australia (BoM)
- Bureau of Reclamation, United States Department of the Interior
- European Organisation for the Exploitation of Meteorological Satellites (EUMETSAT)
- Meteorological Service of Canada (MSC)
- NOAA's National Environmental Satellite, Data and Information Service (NESDIS)
- NOAA's National Geodetic Survey (NGS)
- National Science Foundation (NSF)
- Naval Meteorology and Oceanography Command (NMOC)
- U.S. Army Corps of Engineers (USACE)
To learn more about us, please visit the COMET website.
Project Contributors
Project Lead
- Tsvetomir Ross-Lazarov — UCAR/COMET
Instructional Design
- Tsvetomir Ross-Lazarov — UCAR/COMET
Principal Science Advisors
- 呂國臣 (Dr. Kuo-Chen Lu), Director — CWB/Weather Forecast Center
- 黃椿喜 (Dr. Treng-shi Huang), Section Chief — CWB/Weather Forecast Center
- 林秉煜 (Ping-Yu Lin), Section Chief — CWB/Weather Forecast Center
- 劉人瑋 (Jen-Wei Liu), Associate Technical Specialist — CWB/Weather Forecast Center
- Dr. Rich Jeffries, Meteorologist — UCAR/COMET
- Vanessa Vincente, Meteorologist — UCAR/COMET
Science Advisors
- 張心華 (Hsin-Hua Chang), Associate Technical Specialist, CWB/Weather Forecast Center
- 游政谷(Dr. Cheng-Ku Yu), Professor — NTU/Department of Atmospheric Sciences
- 陳泰然 (Dr. George Tai-Jen Chen), CHAIR/EMERITUS, National Taiwan University/Atmospheric Science
- 王重傑 (Chung-Chieh Wang), Professor, National Taiwan Normal University/Department of Earth Sciences
- 李茂正(Mao-Cheng Lee), Research Assistant — CWB/Weather Forecast Center
- 林伯東 (Po-Tung, Lin), Associate Technical Specialist — CWB/Weather Forecast Center
- 劉宇其 (Yu-Chi Liu), Associate Technical Specialist — CWB/Weather Forecast Center
Program Oversight
- Tsvetomir Ross-Lazarov — UCAR/COMET
Graphics/Animations
- Steve Deyo — UCAR/COMET
- 張家瑜 (Chia-Yu Chang), Junior Technical Specialist, Central Weather Bureau/Weather Forecast Center
Multimedia Authoring/Interface Design
- Gary Pacheco — UCAR/COMET
COMET Staff, March 2018
Director's Office
- Dr. Elizabeth Mulvihill Page, Director
- Tim Alberta, Assistant Director Operations and IT
- Paul Kucera, Assistant Director International Programs
Business Administration
- Lorrie Alberta, Administrator
- Tara Torres, Program Coordinator
IT Services
- Bob Bubon, Systems Administrator
- Joshua Hepp, Student Assistant
- Joey Rener, Software Engineer
- Malte Winkler, Software Engineer
Instructional Services
- Dr. Alan Bol, Scientist/Instructional Designer
- Tsvetomir Ross-Lazarov, Instructional Designer
International Programs
- Rosario Alfaro Ocampo, Translator/Meteorologist
- Bruce Muller, Project Manager
- David Russi, Translations Coordinator
- Martin Steinson, Project Manager
Production and Media Services
- Steve Deyo, Graphic and 3D Designer
- Dolores Kiessling, Software Engineer
- Gary Pacheco, Web Designer and Developer
- Sylvia Quesada, Production Assistant
Science Group
- Dr. William Bua, Meteorologist
- Patrick Dills, Meteorologist
- Bryan Guarente, Instructional Designer/Meteorologist
- Matthew Kelsch, Hydrometeorologist
- Erin Regan, Student Assistant
- Andrea Smith, Meteorologist
- Amy Stevermer, Meteorologist
- Vanessa Vincente, Meteorologist