Media Gallery
Media elements used in this module are protected by a variety of copyright licenses. Please use the "copyright terms" link associated with each item below for more information.
Description:
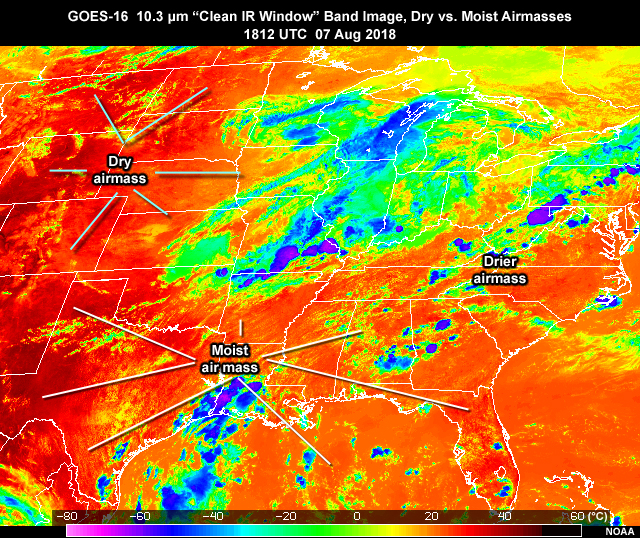
GOES-16 ABI 10.3 micrometer clean longwave IR window band image over central and eastern U.S. showing dry vs. moist airmasses during midday on August 7, 2018
File Name:
abi_103ir_airmass_07aug18_g16.jpg
Credits:
NOAA
Copyright Terms:
COMET Standard Terms of Use
Description:
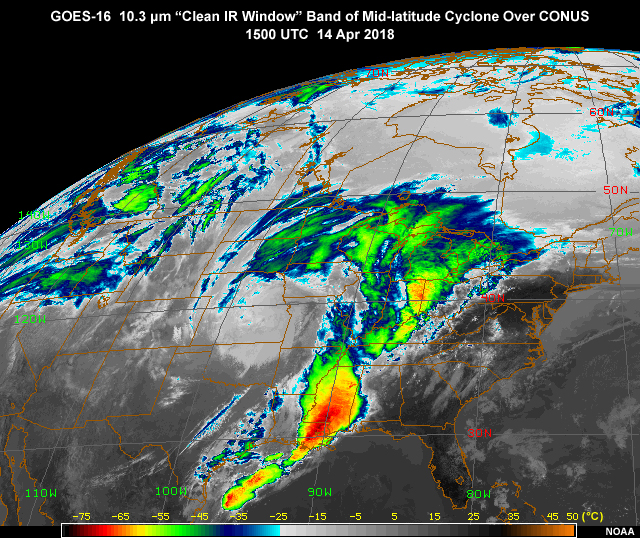
GOES-16 ABI 10.3 micrometer "clean IR window" band image over CONUS region highlighting springtime cyclone over CONUS on April 14, 2018
File Name:
abi_103ir_cyclone_14apr18_g16.jpg
Credits:
NOAA
Copyright Terms:
COMET Standard Terms of Use
Description:
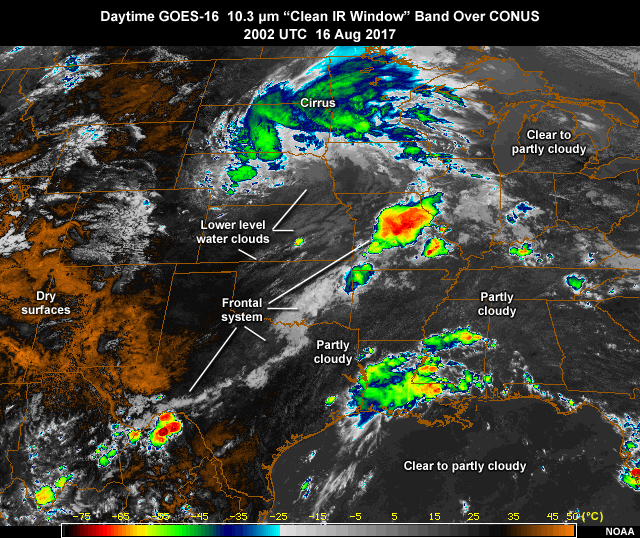
GOES-16 ABI daytime 10.3 micrometer "clean longwave IR window" band image over CONUS region highlighting daytime surfaces in both dry and moist airmass conditions on August 16, 2017
File Name:
abi_103ir_sfcs_16aug17_g16.jpg
Credits:
NOAA
Copyright Terms:
COMET Standard Terms of Use
Description:
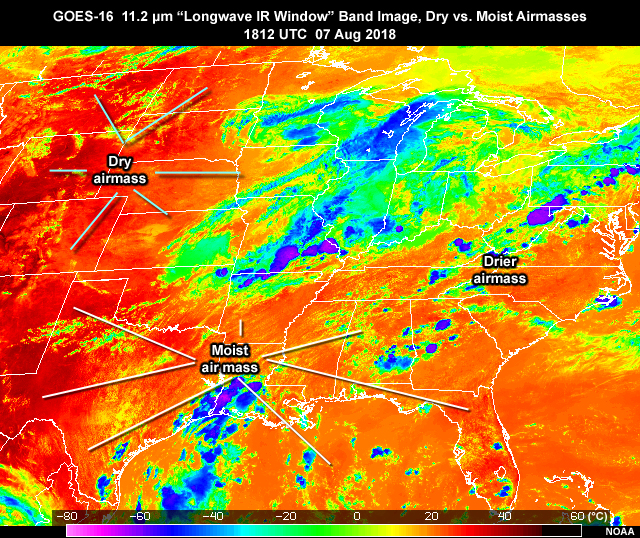
GOES-16 ABI 11.2 micrometer longwave IR window band image over central and eastern U.S. showing dry vs. moist airmasses during midday on August 7, 2018
File Name:
abi_112ir_airmass_07aug18_g16.jpg
Credits:
NOAA
Copyright Terms:
COMET Standard Terms of Use
Description:
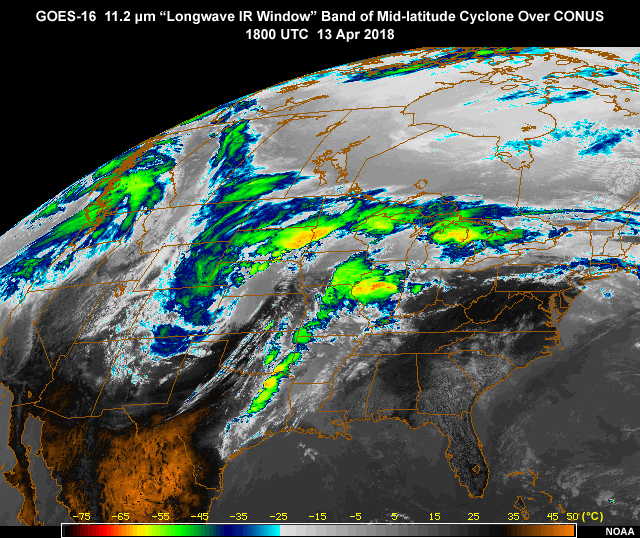
GOES-16 ABI 11.2 micrometer longwave IR window band image over CONUS showing a mid-latitude cyclone during early afternoon on April 13, 2018
File Name:
abi_112ir_cyclone_13apr18_g16.jpg
Credits:
NOAA
Copyright Terms:
COMET Standard Terms of Use
Description:
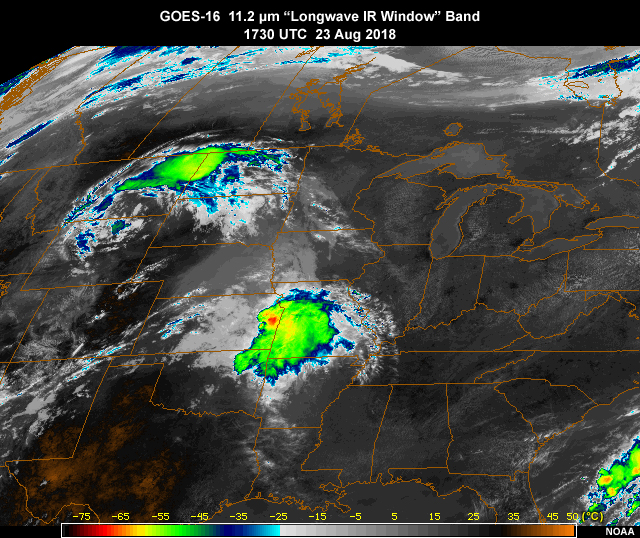
GOES-16 ABI 11.2 micrometer longwave IR window band image over U.S. showing a cyclone and convection during midday on August 23, 2018
File Name:
abi_112ir_cyclone_23aug18_g16.jpg
Credits:
NOAA
Copyright Terms:
COMET Standard Terms of Use
Description:
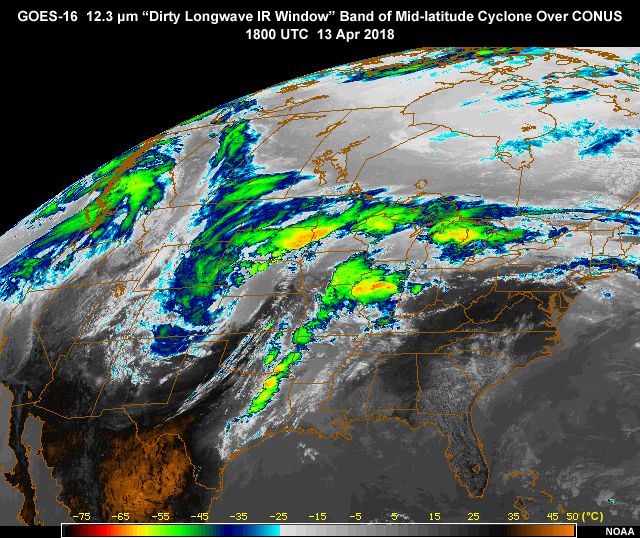
GOES-16 ABI 12.3 micrometer dirty longwave IR window band image over CONUS showing a mid-latitude cyclone during midday on April 13, 2018
File Name:
abi_123ir_cyclone_13apr18_g16.jpg
Credits:
NOAA
Copyright Terms:
COMET Standard Terms of Use
Description:
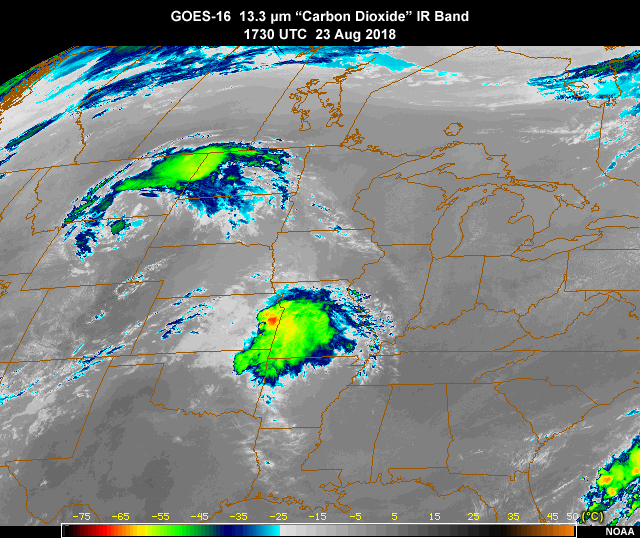
GOES-16 ABI 13.3 micrometer longwave IR window band image over U.S. showing a cyclone and convection during midday on August 23, 2018
File Name:
abi_133ir_cyclone_23aug18_g16.jpg
Credits:
NOAA
Copyright Terms:
COMET Standard Terms of Use
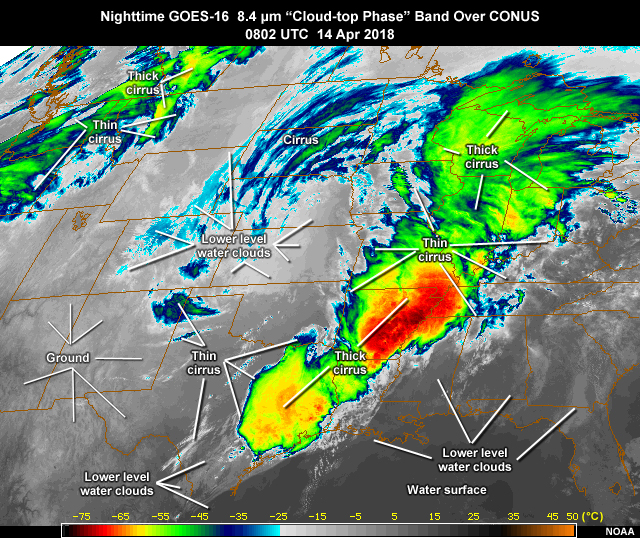
Description:
GOES-16 nighttime ABI 8.4 micrometer "cloud-top phase" band image over CONUS region highlighting nighttime surface, water and ice cloud differences on April 14, 2016
File Name:
abi_84ir_ntcloud_14apr18_g16.jpg
Credits:
NOAA
Copyright Terms:
COMET Standard Terms of Use
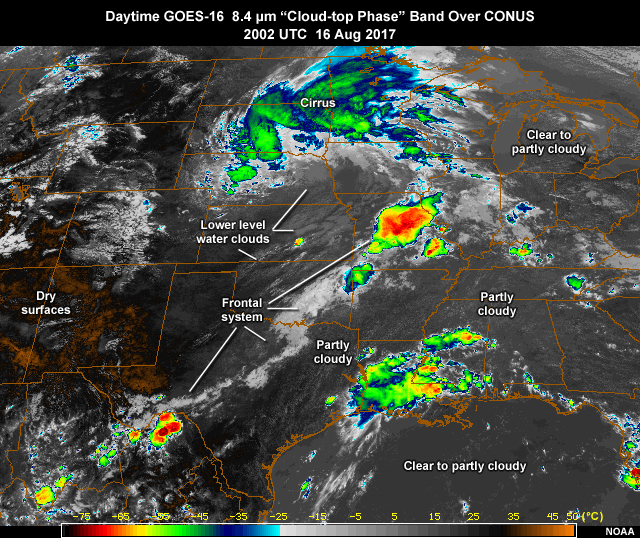
Description:
GOES-16 ABI daytime 8.4 micrometer "cloud-top phase" band image over CONUS region highlighting daytime surfaces in both dry and moist airmass conditions on August 16, 2017
File Name:
abi_84ir_sfcs_16aug17_g16.jpg
Credits:
NOAA
Copyright Terms:
COMET Standard Terms of Use
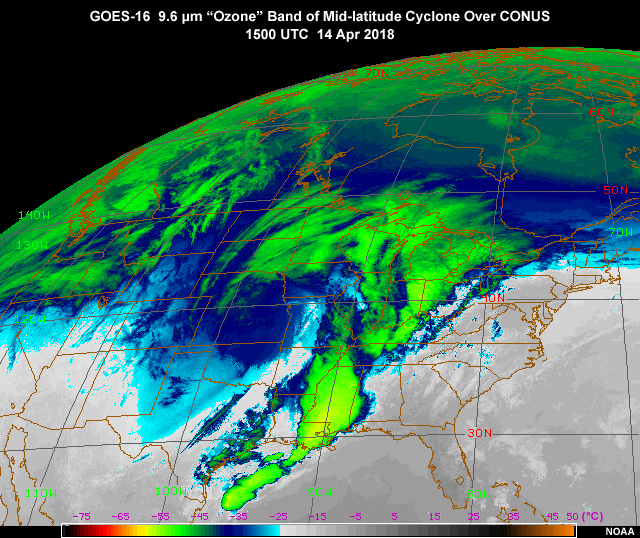
Description:
GOES-16 ABI 9.6 micrometer "ozone" band image over CONUS region highlighting springtime cyclone over CONUS on April 14, 2018
File Name:
abi_96ir_cyclone_14apr18_g16.jpg
Credits:
NOAA
Copyright Terms:
COMET Standard Terms of Use
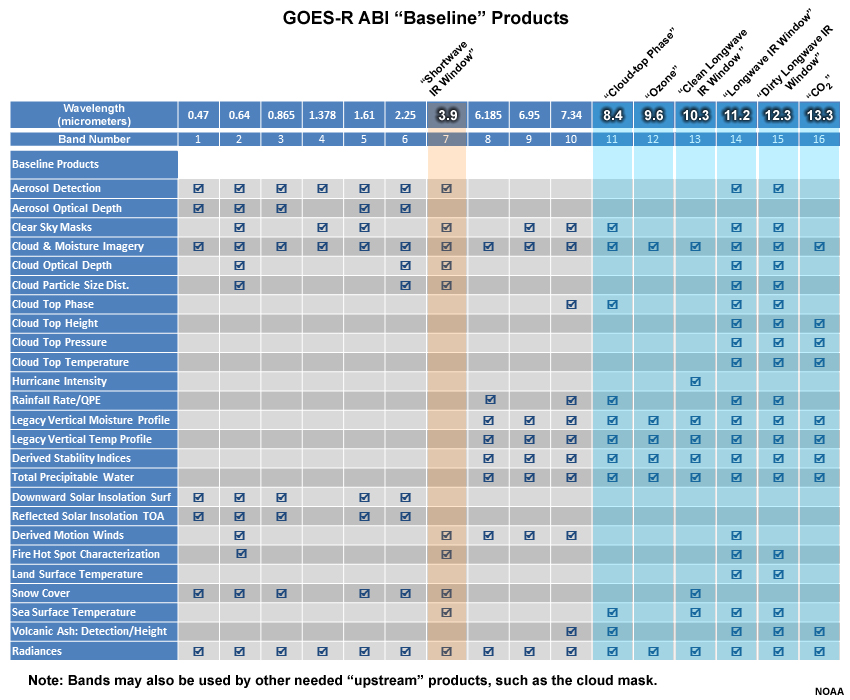
Description:
Table of GOES-R ABI "Baseline" products highlighting seven of the infrared bands not including the three water vapor bands
File Name:
abi_bands_vs_products_baseline_ir.jpg
Credits:
NOAA
Copyright Terms:
COMET Standard Terms of Use
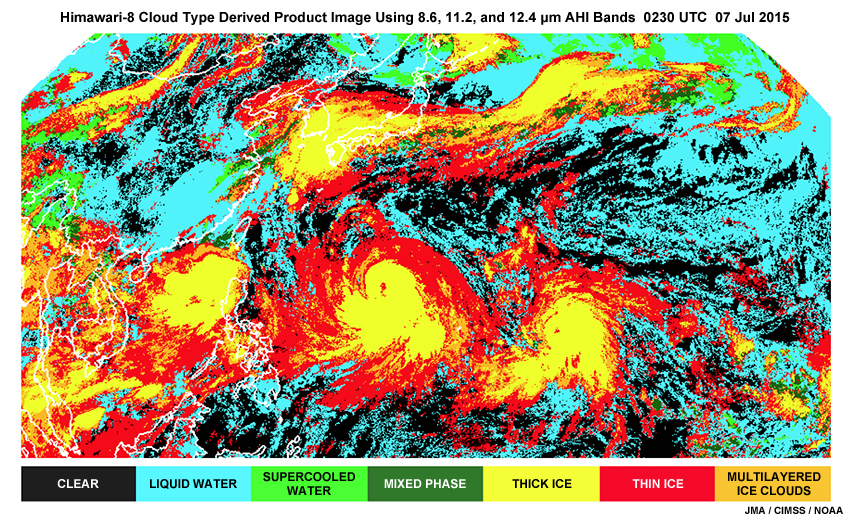
Description:
Sample GOES-R like cloud type derived product image made from Himawari-8 8.6, 11.2, and 12.4 micrometer IR bands at 0230 UTC on 7 July, 2015
File Name:
abi_cloud_top_phase_product.jpg
Credits:
JMA / CIMSS / NOAA
Copyright Terms:
COMET Standard Terms of Use
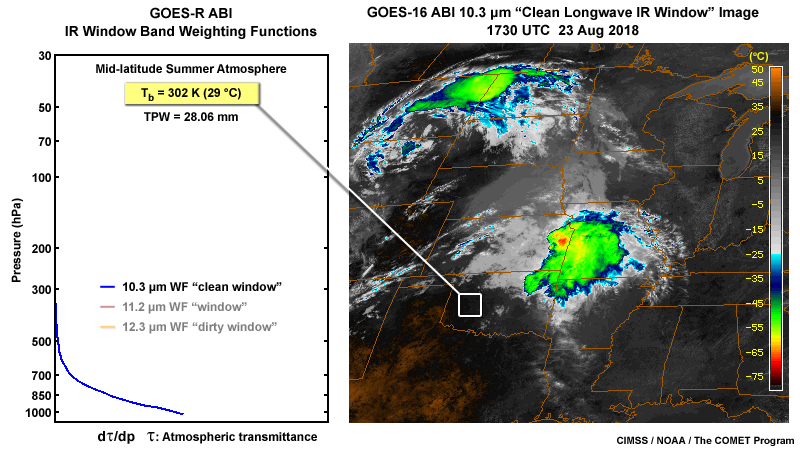
Description:
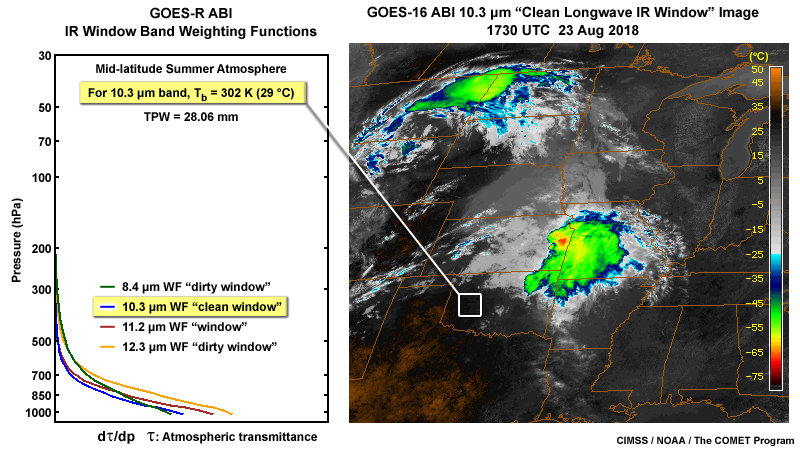
2-panel of an ABI 10.3 micrometer weighting function and a GOES-16 ABI 10.3 micrometer clean IR window band image over Central U.S. showing a late summer cyclone and airmass differences on August 23, 2018
File Name:
abi_dir_airmass_23aug18_g16_1.jpg
Credits:
CIMSS / NOAA / The COMET Program
Copyright Terms:
COMET Standard Terms of Use
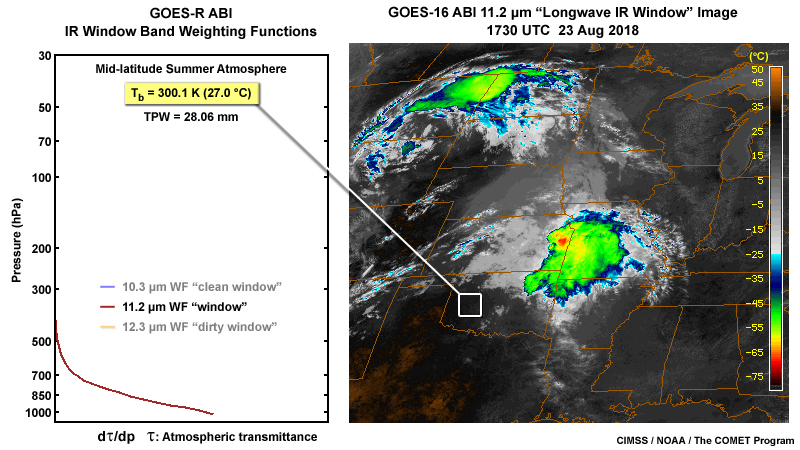
Description:
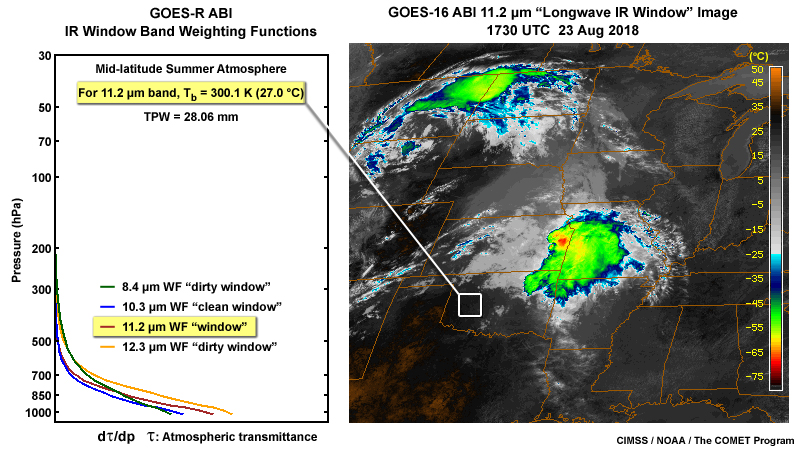
2-panel of an ABI 11.2 micrometer weighting function and a GOES-16 ABI 11.2 micrometer IR window band image over Central U.S. showing a late summer cyclone and airmass differences on August 23, 2018
File Name:
abi_dir_airmass_23aug18_g16_2.jpg
Credits:
CIMSS / NOAA / The COMET Program
Copyright Terms:
COMET Standard Terms of Use
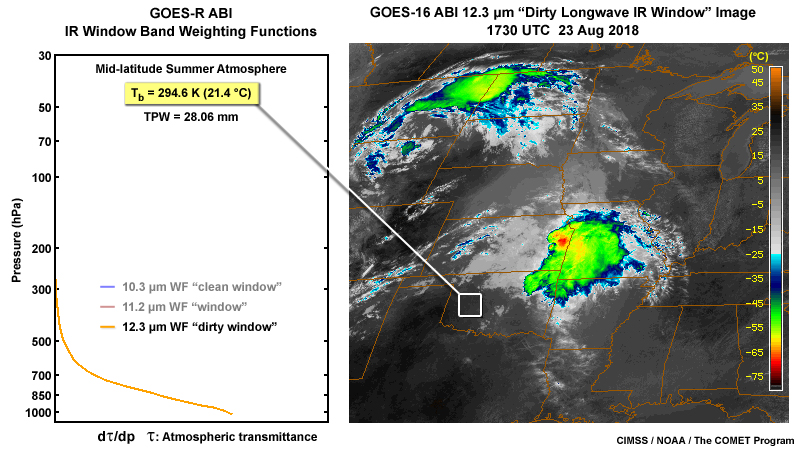
Description:
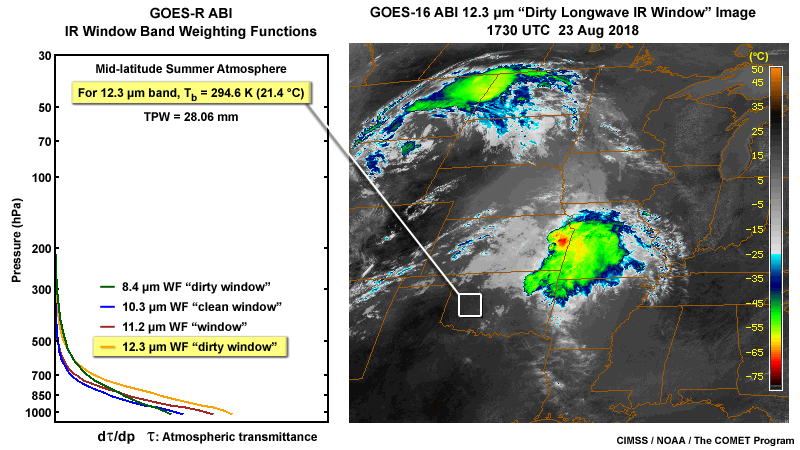
2-panel of an ABI 12.3 micrometer weighting function and a GOES-16 ABI 12.3 micrometer dirty IR window band image over Central U.S. showing a late summer cyclone and airmass differences on August 23, 2018
File Name:
abi_dir_airmass_23aug18_g16_3.jpg
Credits:
CIMSS / NOAA / The COMET Program
Copyright Terms:
COMET Standard Terms of Use
Description:
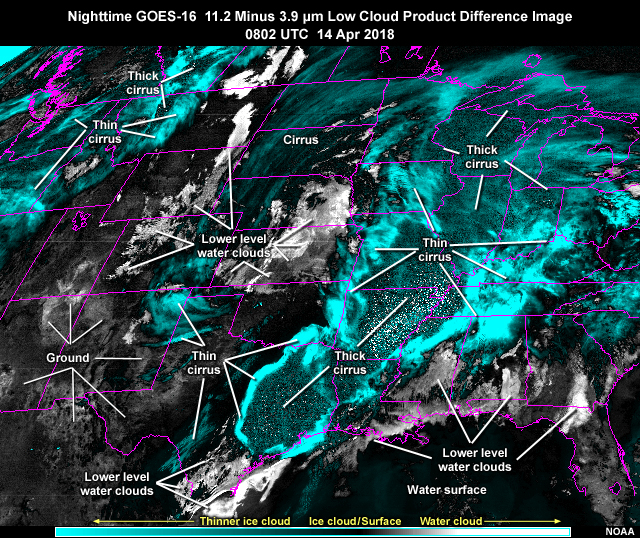
GOES-16 nighttime ABI 11.2 micrometer "longwave IR window" band image over CONUS region highlighting nighttime water and ice cloud differences on April 14, 2016
File Name:
abi_fogprod_ntcloud_14apr18_g16.jpg
Credits:
NOAA
Copyright Terms:
COMET Standard Terms of Use
Description:
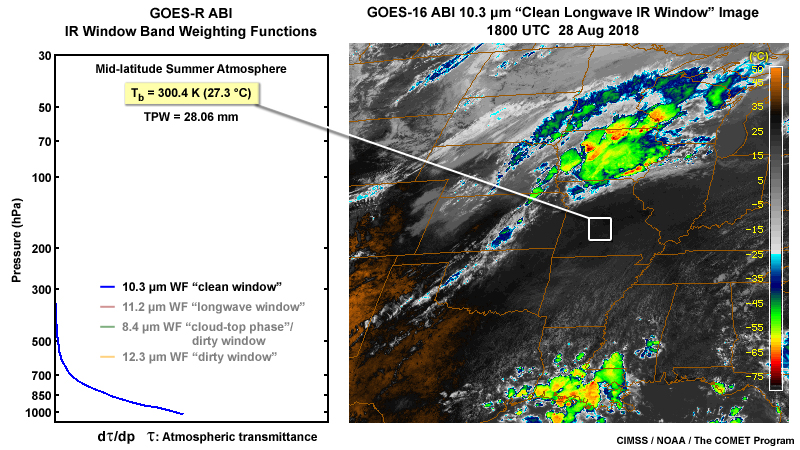
2-panel of an ABI 10.3 micrometer weighting function and a GOES-16 ABI 10.3 micrometer clean IR window band image over the central U.S. on August 28, 2018
File Name:
abi_ir_airmass_28aug18_g16_1.jpg
Credits:
CIMSS / NOAA / The COMET Program
Copyright Terms:
COMET Standard Terms of Use
Description:
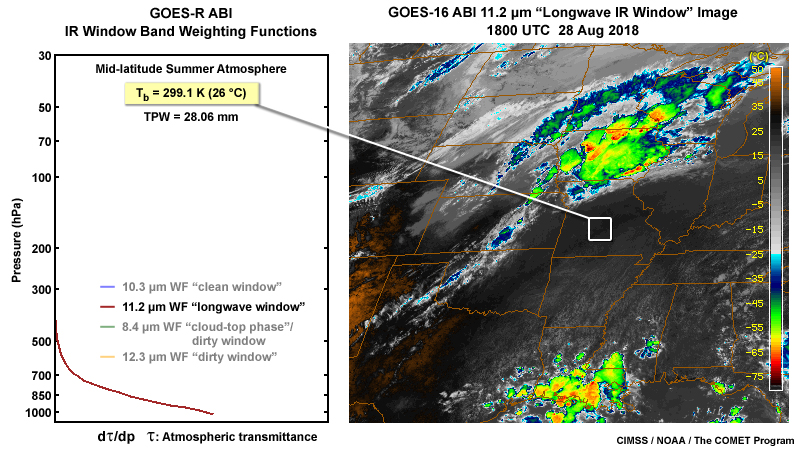
2-panel of an ABI 11.2 micrometer weighting function and a GOES-16 ABI 11,2 micrometer longwave IR window band image over the central U.S. on August 28, 2018
File Name:
abi_ir_airmass_28aug18_g16_2.jpg
Credits:
CIMSS / NOAA / The COMET Program
Copyright Terms:
COMET Standard Terms of Use
Description:
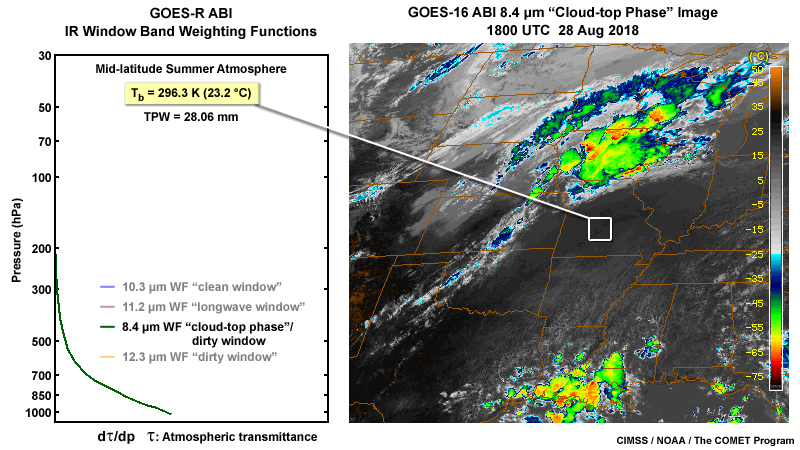
2-panel of an ABI 8.4 micrometer weighting function and a GOES-16 ABI 8.4 micrometer cloud-top phase IR band image over the central U.S. on August 28, 2018
File Name:
abi_ir_airmass_28aug18_g16_3.jpg
Credits:
CIMSS / NOAA / The COMET Program
Copyright Terms:
COMET Standard Terms of Use
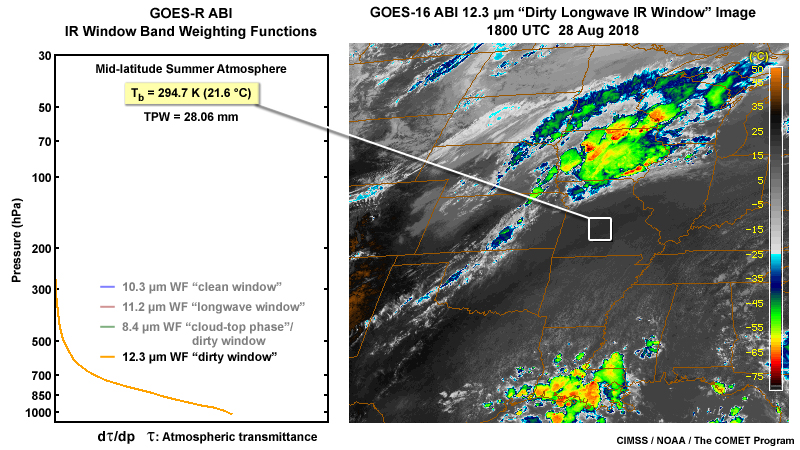
Description:
2-panel of an ABI 12.3 micrometer weighting function and a GOES-16 ABI 12.3 micrometer dirty longwave IR window band image over the central U.S. on August 28, 2018
File Name:
abi_ir_airmass_28aug18_g16_4.jpg
Credits:
CIMSS / NOAA / The COMET Program
Copyright Terms:
COMET Standard Terms of Use
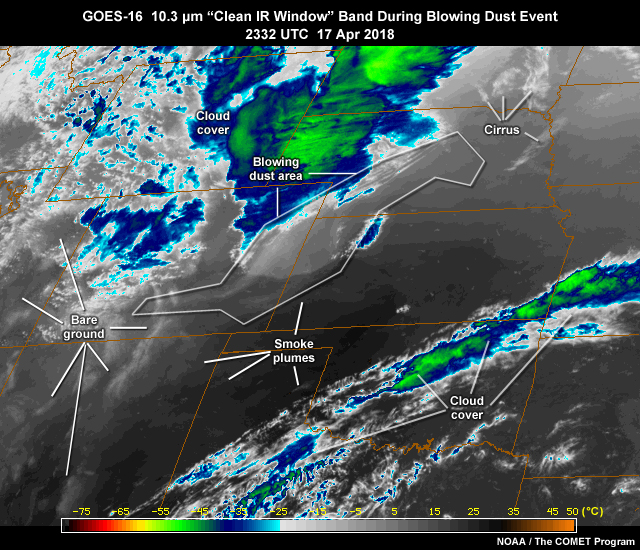
Description:
GOES-16 ABI 10.3 micrometer clean longwave IR window band image showing blowing dust event over the U.S. High Plains associated with a developing springtime cyclone over the Central Rocky Mountain region on April 17, 2018
File Name:
abi_ir_dust_17apr18_g16_1.jpg
Credits:
NOAA / The COMET Program
Copyright Terms:
COMET Standard Terms of Use

Description:
GOES-16 ABI 11.2 micrometer clean longwave IR window band image showing blowing dust event over the U.S. High Plains associated with a developing springtime cyclone over the Central Rocky Mountain region on April 17, 2018
File Name:
abi_ir_dust_17apr18_g16_2.jpg
Credits:
NOAA / The COMET Program
Copyright Terms:
COMET Standard Terms of Use
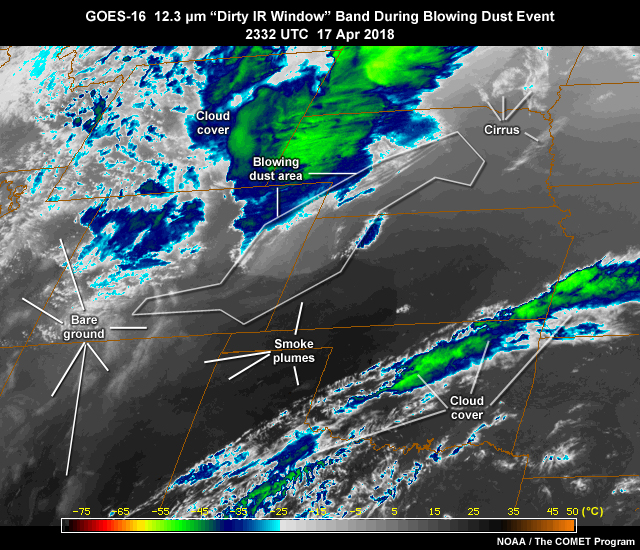
Description:
GOES-16 ABI 12.3 micrometer dirty longwave IR window band image showing blowing dust event over the U.S. High Plains associated with a developing springtime cyclone over the Central Rocky Mountain region on April 17, 2018
File Name:
abi_ir_dust_17apr18_g16_3.jpg
Credits:
NOAA / The COMET Program
Copyright Terms:
COMET Standard Terms of Use
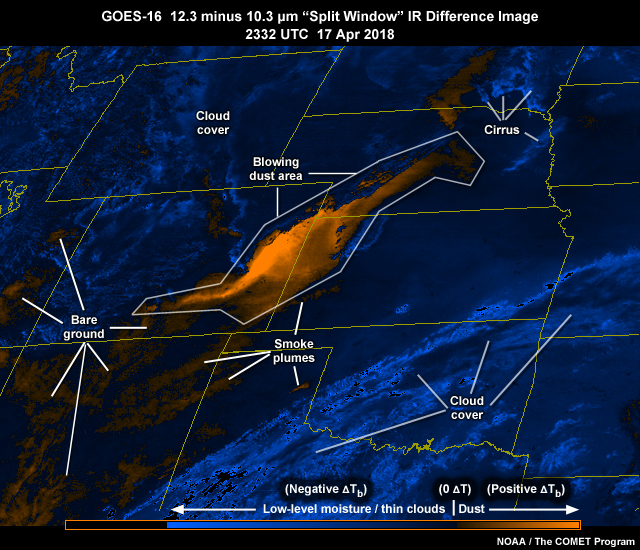
Description:
GOES-16 ABI 12.3 minus 10.3 micrometer split window IR band difference image highlighting blowing dust event over the U.S. High Plains associated with a developing springtime cyclone over the Central Rocky Mountain region on April 17, 2018
File Name:
abi_ir_dust_17apr18_g16_4.jpg
Credits:
NOAA / The COMET Program
Copyright Terms:
COMET Standard Terms of Use
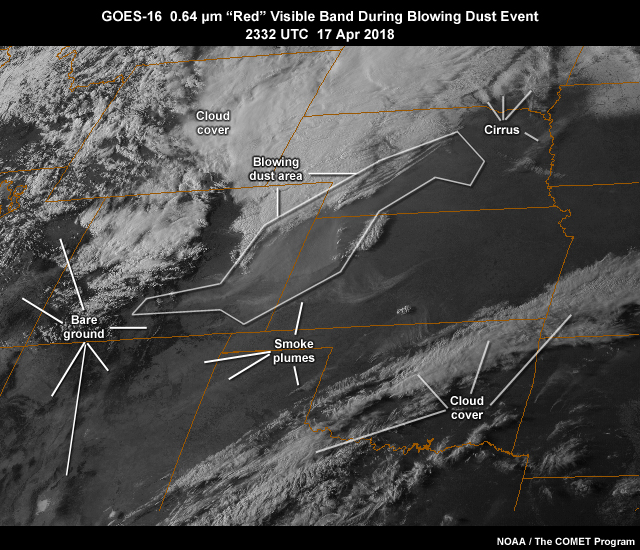
Description:
GOES-16 ABI 0.64 micrometer "red" visible band image showing blowing dust event over the U.S. High Plains associated with a developing springtime cyclone over the Central Rocky Mountain region on April 17, 2018
File Name:
abi_ir_dust_17apr18_g16_5.jpg
Credits:
NOAA / The COMET Program
Copyright Terms:
COMET Standard Terms of Use
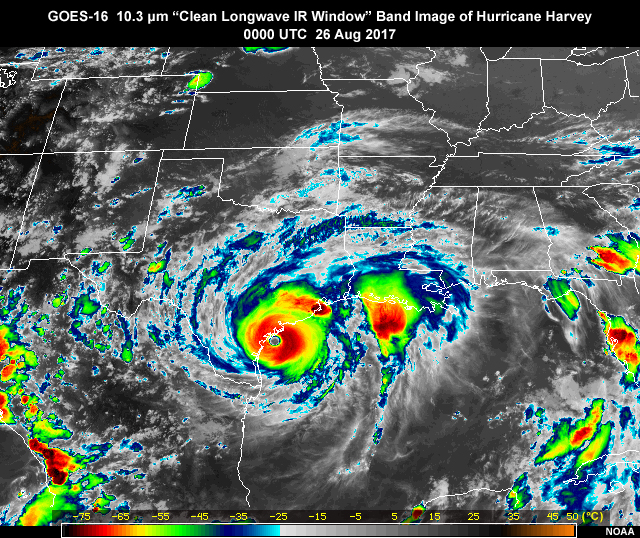
Description:
GOES-16 ABI 10.3 micrometer clean longwave IR window band image over the U.S. Gulf Coast region showing hurricane Harvey on August 26, 2017
File Name:
abi_ir_tc_26aug17_g16_1.jpg
Credits:
NOAA
Copyright Terms:
COMET Standard Terms of Use
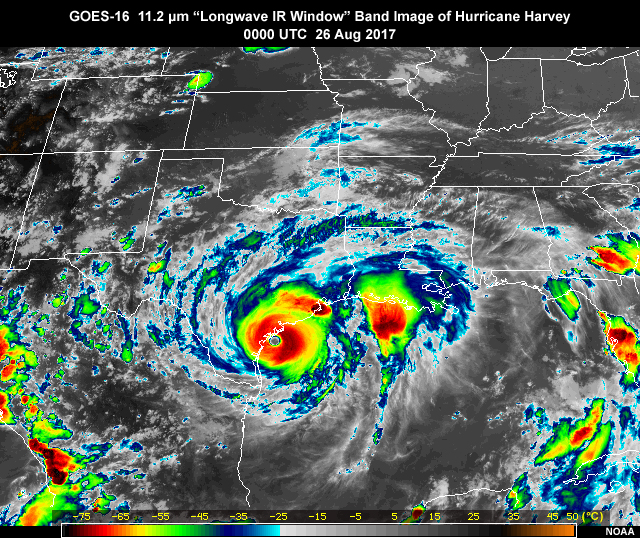
Description:
GOES-16 ABI 11.2 micrometer clean longwave IR window band image over the U.S. Gulf Coast region showing hurricane Harvey on August 26, 2017
File Name:
abi_ir_tc_26aug17_g16_2.jpg
Credits:
NOAA
Copyright Terms:
COMET Standard Terms of Use
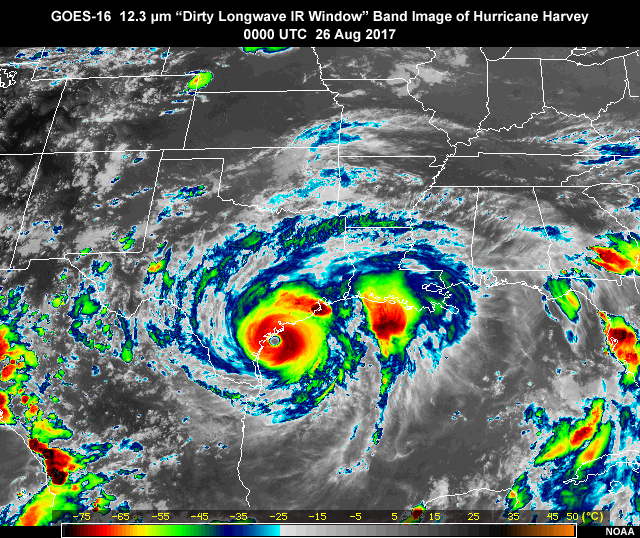
Description:
GOES-16 ABI 12.3 micrometer clean longwave IR window band image over the U.S. Gulf Coast region showing hurricane Harvey on August 26, 2017
File Name:
abi_ir_tc_26aug17_g16_3.jpg
Credits:
NOAA
Copyright Terms:
COMET Standard Terms of Use
Description:
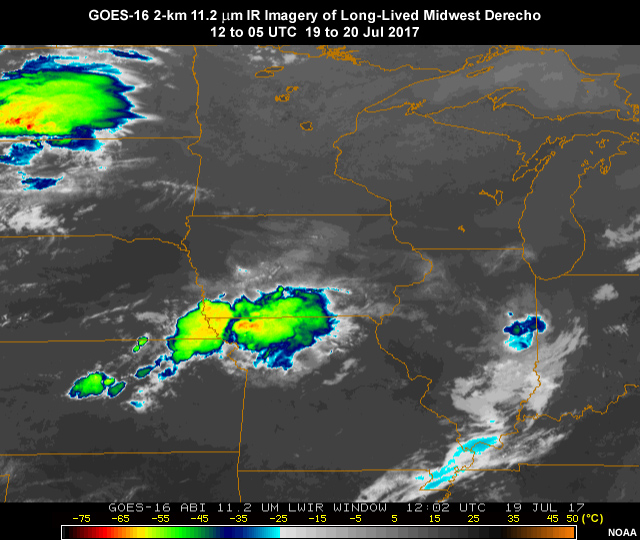
GOES-16 ABI 11.2 micrometer longwave infrared window band animation showing a long-lived MCS derecho moving across the Upper Midwest on 19 to 20 July, 2017
File Name:
abi_ir14_convn_19jul17_g16_ani.mp4
Credits:
NOAA
Copyright Terms:
COMET Standard Terms of Use
Description:
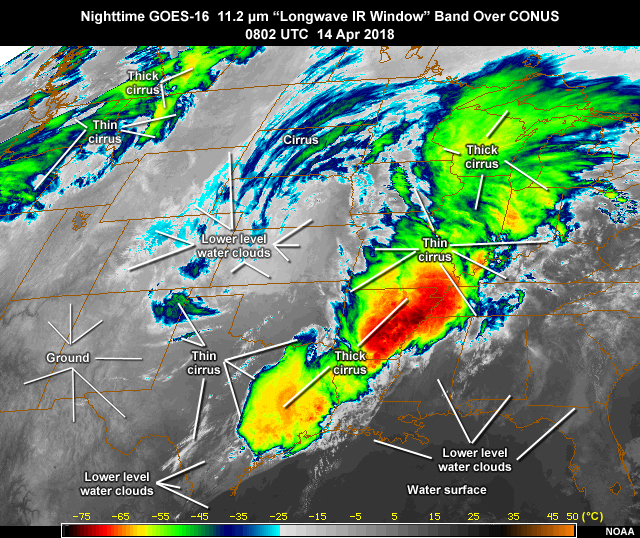
GOES-16 nighttime ABI 11.2 micrometer "longwave IR window" band image over CONUS region highlighting nighttime water and ice cloud differences on April 14, 2016
File Name:
abi_lwir_ntcloud_14apr18_g16.jpg
Credits:
NOAA
Copyright Terms:
COMET Standard Terms of Use
Description:
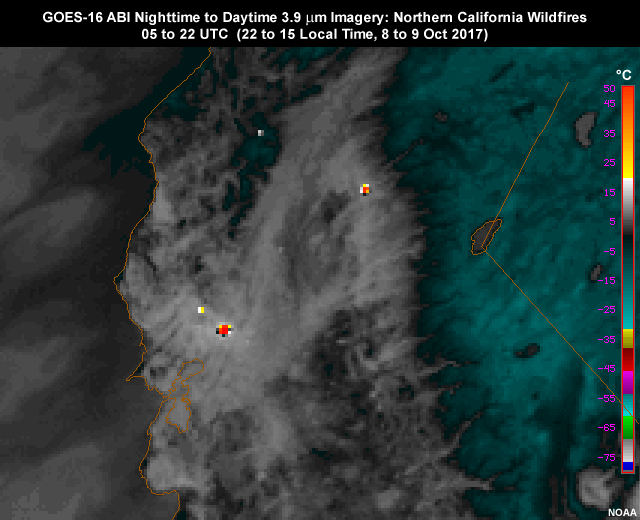
GOES-16 ABI 3.9 micrometer shortwave IR imagery animation showing nighttime to daytime hot spots for several large northern California wildfires on October 8 to 9, 2017
File Name:
abi_swir_fire_g16_ani.mp4
Credits:
NOAA
Copyright Terms:
COMET Standard Terms of Use
Description:
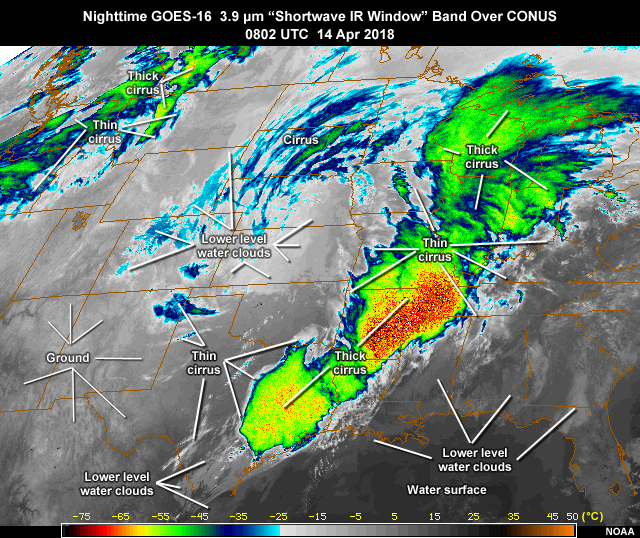
GOES-16 nighttime ABI 3.9 micrometer "shortwave IR window" band image over CONUS region highlighting nighttime water and ice cloud differences on April 14, 2016
File Name:
abi_swir_ntcloud_14apr18_g16.jpg
Credits:
NOAA
Copyright Terms:
COMET Standard Terms of Use
Description:
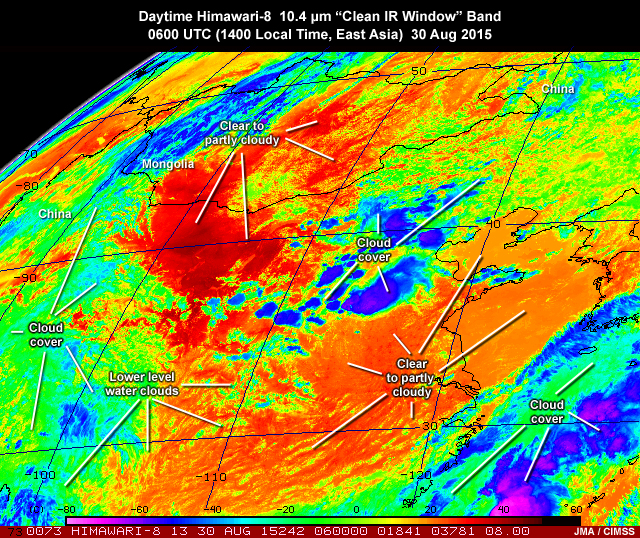
Himawari-8 nighttime AHI 10.3 micrometer clean longwave IR window band image over East Asia region highlighting low level moisture sensitivity on August 30, 2015
File Name:
ahi_103ir_airmass_30aug15.jpg
Credits:
JMA / CIMSS
Copyright Terms:
COMET Standard Terms of Use
Description:
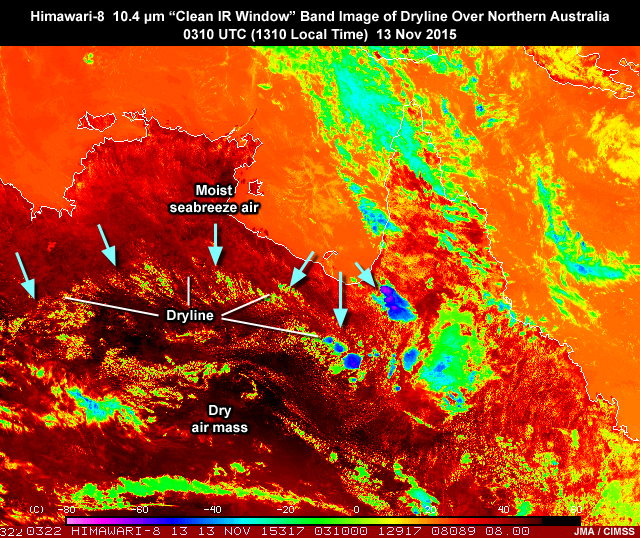
Himawari-8 AHI 10.3 micrometer clean longwave IR window band image over northern Australia showing convection developing along a west to east oriented dryline boundary during afternoon of November 13, 2015
File Name:
ahi_103ir_at_dryline_13nov15.jpg
Credits:
JMA / CIMSS
Copyright Terms:
COMET Standard Terms of Use
Description:
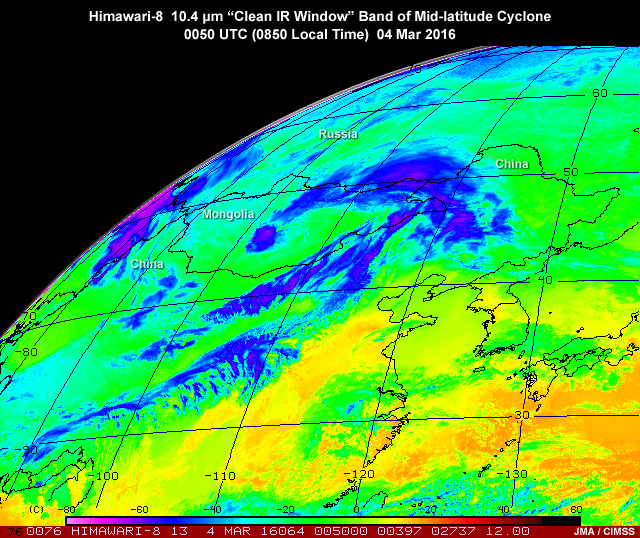
Himawari-8 nighttime AHI 10.3 micrometer clean longwave IR window band image over East Asia region showing a mid-latitude cyclone on March 4, 2016
File Name:
ahi_103ir_cyclone_04mar16.jpg
Credits:
JMA / CIMSS
Copyright Terms:
COMET Standard Terms of Use
Description:
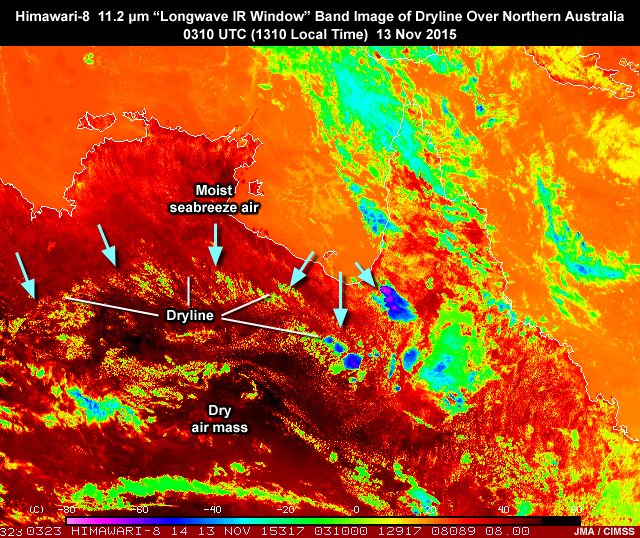
Himawari-8 AHI 11.2 micrometer clean longwave IR window band image over northern Australia showing convection developing along a west to east oriented dryline boundary during afternoon of November 13, 2015
File Name:
ahi_112ir_at_dryline_13nov15.jpg
Credits:
JMA / CIMSS
Copyright Terms:
COMET Standard Terms of Use
Description:
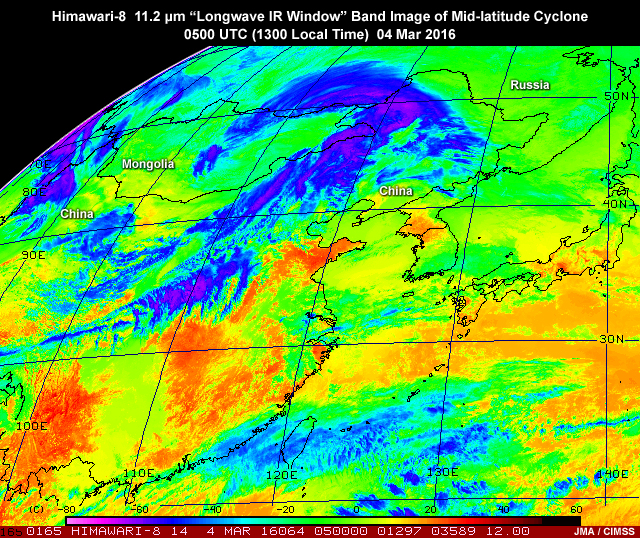
Himawari-8 AHI 11.2 micrometer longwave IR window band image over East Asia region showing a mid-latitude cyclone during early afternoon on March 4, 2016
File Name:
ahi_112ir_cyclone_05utc_04mar16.jpg
Credits:
JMA / CIMSS
Copyright Terms:
COMET Standard Terms of Use
Description:
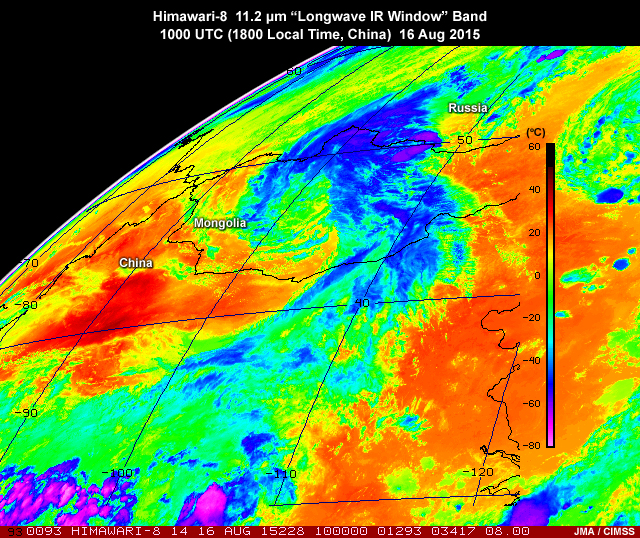
Himawari-8 AHI 11.2 micrometer clean longwave IR window band image over East Asia region showing a cyclone on August 16, 2015
File Name:
ahi_112ir_cyclone_16aug15.jpg
Credits:
JMA / CIMSS
Copyright Terms:
COMET Standard Terms of Use
Description:
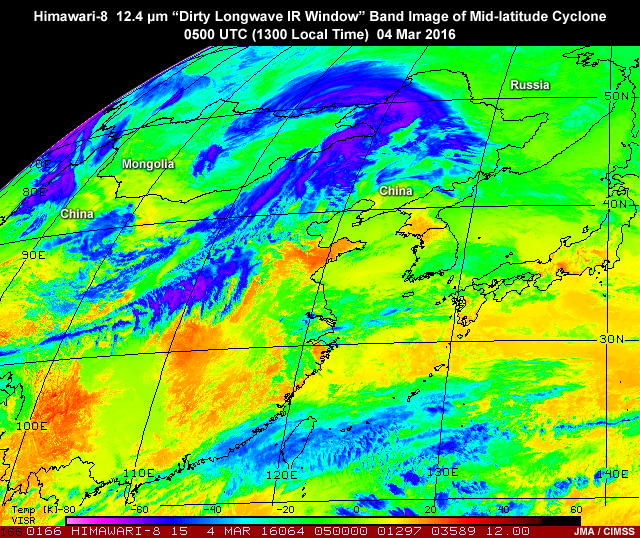
Himawari-8 AHI 12.4 micrometer dirty longwave IR window band image over East Asia region showing a mid-latitude cyclone during early afternoon on March 4, 2016
File Name:
ahi_124ir_cyclone_05utc_04mar16.jpg
Credits:
JMA / CIMSS
Copyright Terms:
COMET Standard Terms of Use
Description:
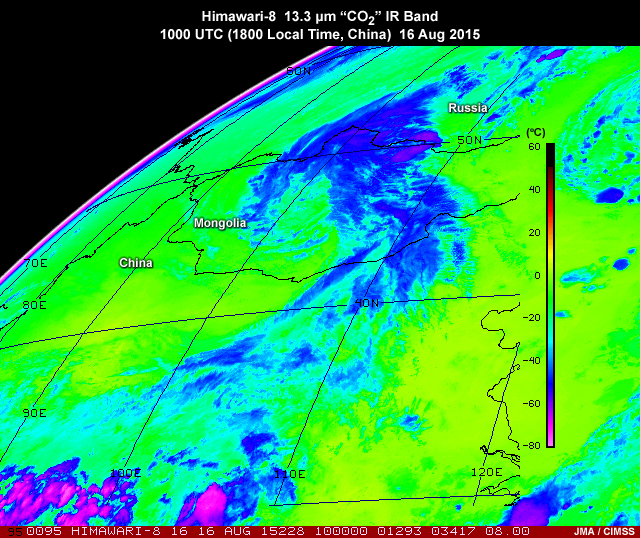
Himawari-8 AHI 13.3 micrometer clean longwave IR window band image over East Asia region showing a cyclone on August 16, 2015
File Name:
ahi_133ir_cyclone_16aug15.jpg
Credits:
JMA / CIMSS
Copyright Terms:
COMET Standard Terms of Use
Description:
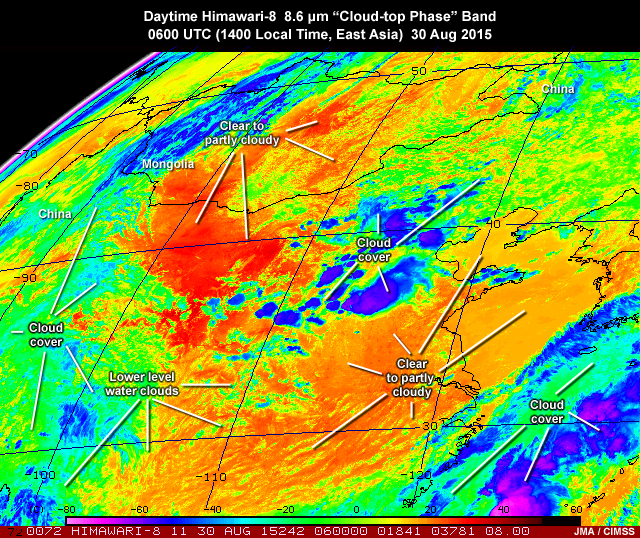
Himawari-8 nighttime AHI 8.6 micrometer shortwave IR window band image over East Asia region highlighting low level moisture sensitivity on August 30, 2015
File Name:
ahi_84ir_airmass_30aug15.jpg
Credits:
JMA / CIMSS
Copyright Terms:
COMET Standard Terms of Use
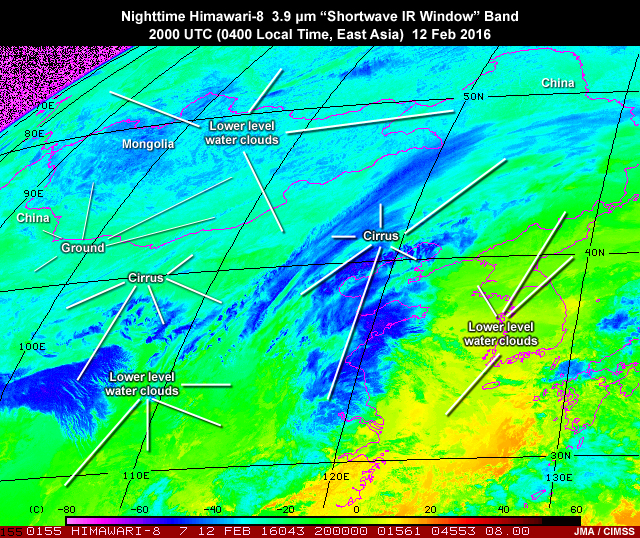
Description:
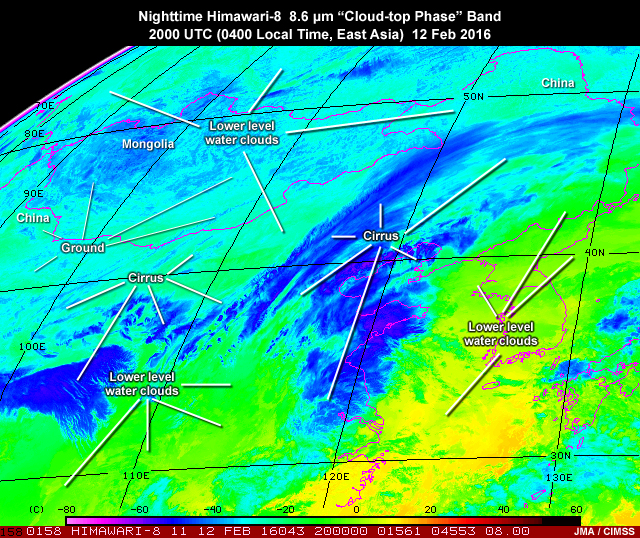
Himawari-8 nighttime AHI 8.6 micrometer "shortwave IR window" band image over East Asia region highlighting surface, water and ice cloud differences on February 12, 2016
File Name:
ahi_84ir_ntcloud_12feb16.jpg
Credits:
JMA / CIMSS
Copyright Terms:
COMET Standard Terms of Use
Description:
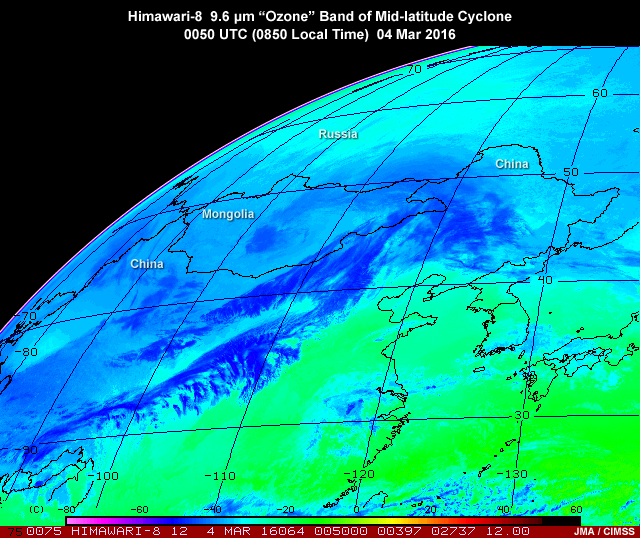
Himawari-8 nighttime AHI 9.6 micrometer ozone band image over East Asia region showing a mid-latitude cyclone on March 4, 2016
File Name:
ahi_96ir_cyclone_04mar16.jpg
Credits:
JMA / CIMSS
Copyright Terms:
COMET Standard Terms of Use

Description:
2-panel of an ABI 10.3 micrometer weighting function and a Himawari-8 AHI 10.4 micrometer clean IR window band image over East Asia region showing a late summer cyclone on August 16, 2015
File Name:
ahi_dir_airmass_16aug15_1.jpg
Credits:
JMA / CIMSS / The COMET Program
Copyright Terms:
COMET Standard Terms of Use
Description:
2-panel of an ABI 11.2 micrometer weighting function and a Himawari-8 AHI 11.2 micrometer IR window band image over East Asia region showing a late summer cyclone on August 16, 2015
File Name:
ahi_dir_airmass_16aug15_2.jpg
Credits:
JMA / CIMSS / The COMET Program
Copyright Terms:
COMET Standard Terms of Use
Description:
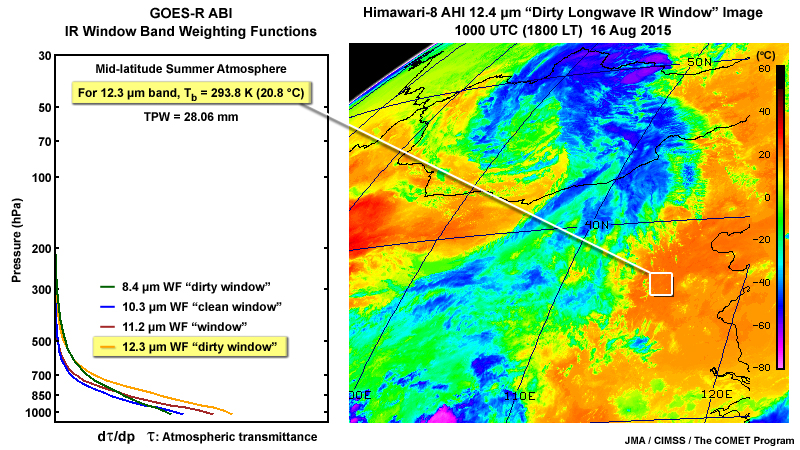
2-panel of an ABI 12.3 micrometer weighting function and a Himawari-8 AHI 12.4 micrometer IR window band image over East Asia region showing a late summer cyclone on August 16, 2015
File Name:
ahi_dir_airmass_16aug15_3.jpg
Credits:
JMA / CIMSS / The COMET Program
Copyright Terms:
COMET Standard Terms of Use
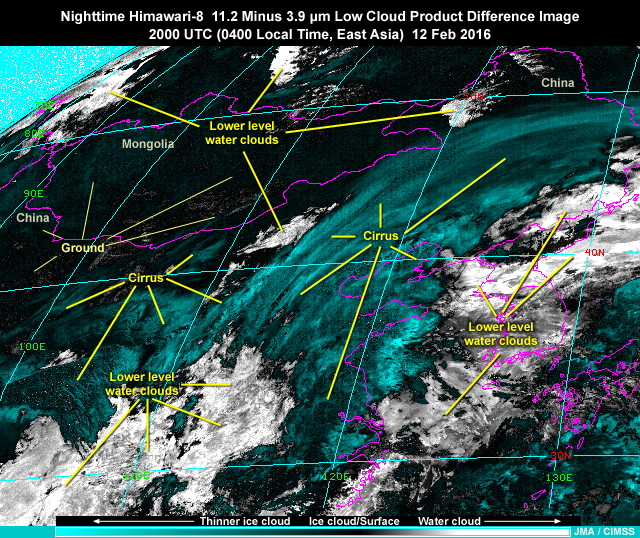
Description:
Himawari-8 nighttime AHI 11.2 minus 3.9 micrometer difference image over East Asia region highlighting water and ice cloud differences on February 12, 2016
File Name:
ahi_fogprod_ntcloud_12feb16.jpg
Credits:
JMA / CIMSS
Copyright Terms:
COMET Standard Terms of Use
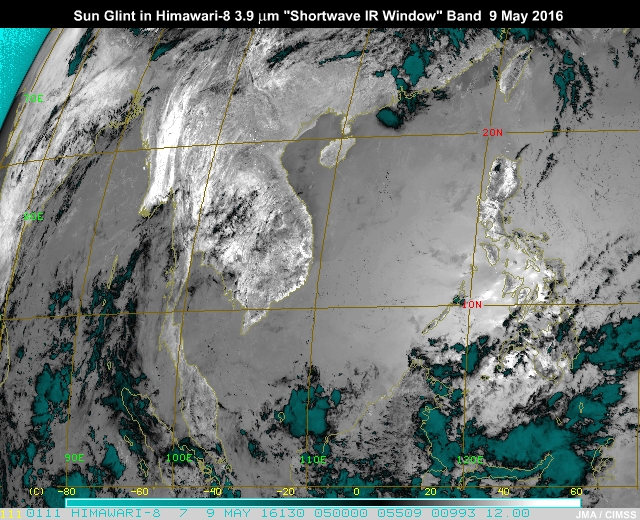
Description:
Sun glint pattern in AHI 3.9 micrometer band-6 near-infrared imagery traveling from east to west across South China Sea and Indian Ocean
File Name:
ahi_glint_swir_enh1_ani.mp4
Credits:
JMA / CIMSS
Copyright Terms:
COMET Standard Terms of Use
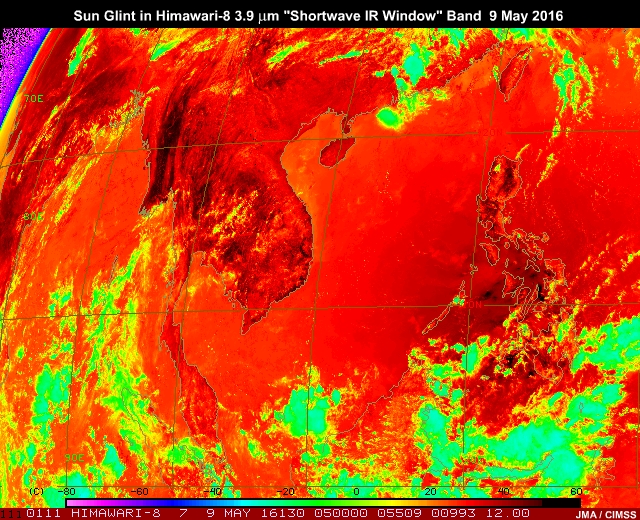
Description:
Sun glint pattern in AHI 3.9 micrometer band-6 near-infrared imagery traveling from east to west across South China Sea and Indian Ocean
File Name:
ahi_glint_swir_enh2_ani.mp4
Credits:
JMA / CIMSS
Copyright Terms:
COMET Standard Terms of Use
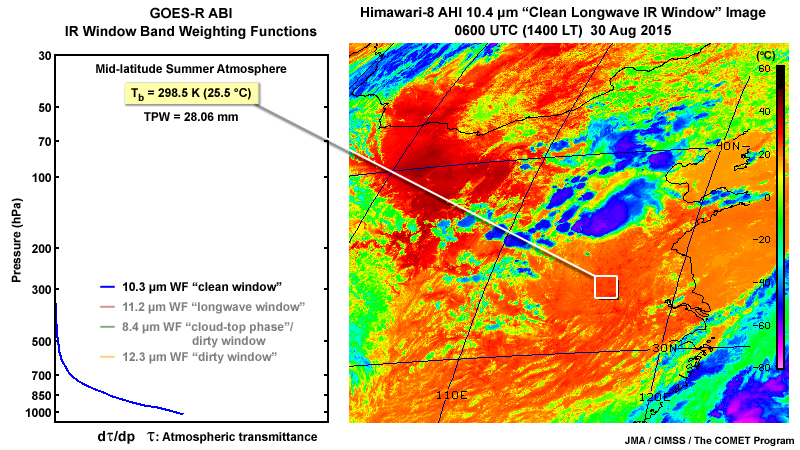
Description:
2-panel of an ABI 10.3 micrometer weighting function and a Himawari-8 AHI 10.4 micrometer clean IR window band image over East Asia region on August 30, 2015
File Name:
ahi_ir_airmass_30aug15_1.jpg
Credits:
JMA / CIMSS / The COMET Program
Copyright Terms:
COMET Standard Terms of Use
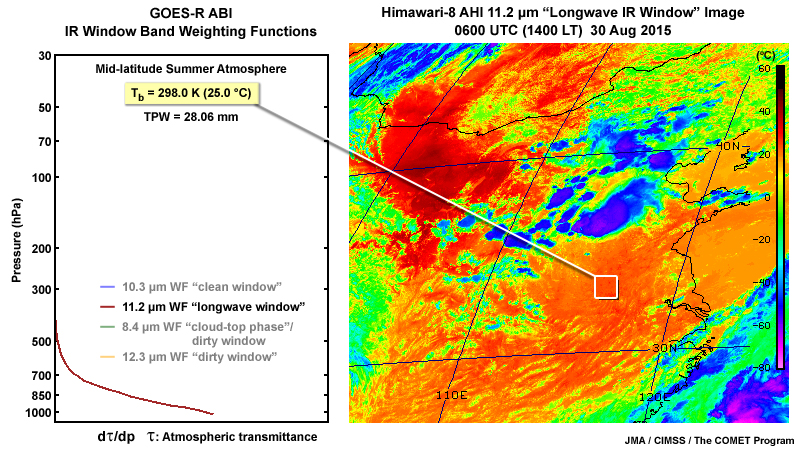
Description:
2-panel of an ABI 11.2 micrometer weighting function and a Himawari-8 AHI 11.2 micrometer IR window band image over East Asia region on August 30, 2015
File Name:
ahi_ir_airmass_30aug15_2.jpg
Credits:
JMA / CIMSS / The COMET Program
Copyright Terms:
COMET Standard Terms of Use
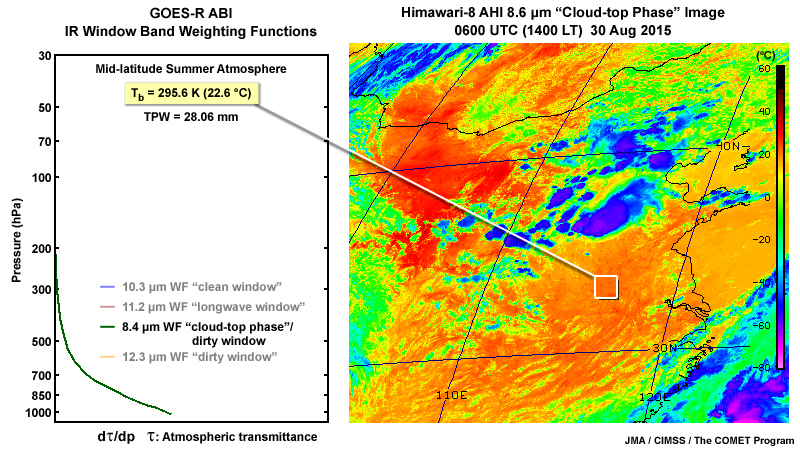
Description:
2-panel of an ABI 8.4 micrometer weighting function and a Himawari-8 AHI 8.4 micrometer Cloud-top Phase IR band image over East Asia region on August 30, 2015
File Name:
ahi_ir_airmass_30aug15_3.jpg
Credits:
JMA / CIMSS / The COMET Program
Copyright Terms:
COMET Standard Terms of Use
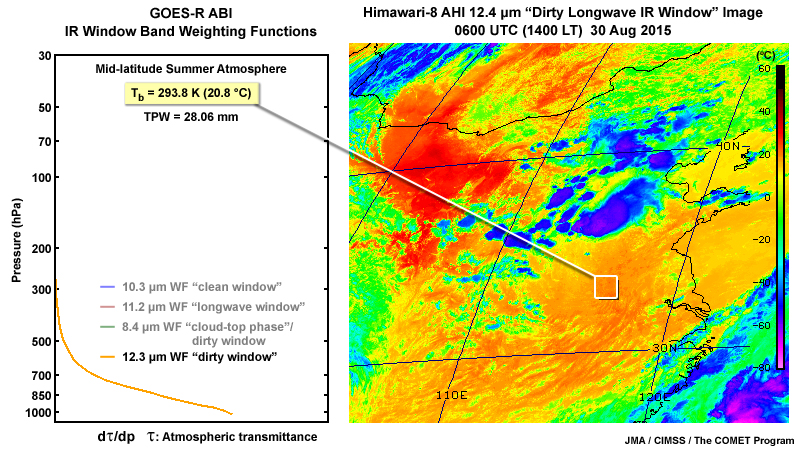
Description:
2-panel of an ABI 12.4 micrometer weighting function and a Himawari-8 AHI 12.4 micrometer dirty longwave IR window band image over East Asia region on August 30, 2015
File Name:
ahi_ir_airmass_30aug15_4.jpg
Credits:
JMA / CIMSS / The COMET Program
Copyright Terms:
COMET Standard Terms of Use
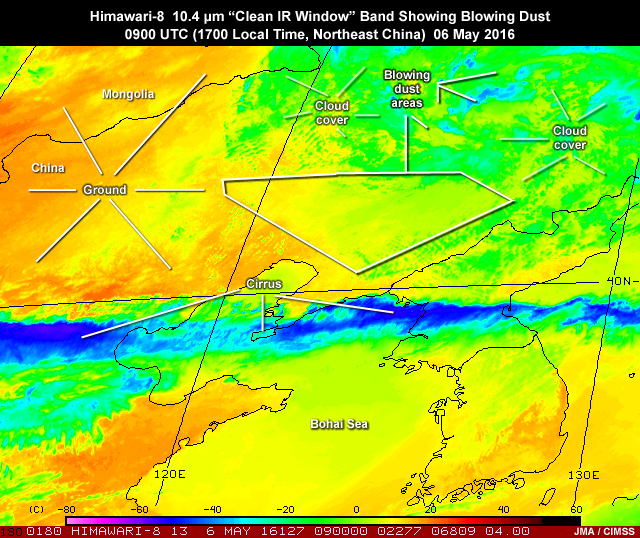
Description:
Himawari-8 AHI 10.4 micrometer clean longwave IR window band image over East Asia region highlighting blowing dust resulting from a mid-latitude cyclone on May 6, 2016
File Name:
ahi_ir_dust_06may16_1.jpg
Credits:
JMA / CIMSS
Copyright Terms:
COMET Standard Terms of Use
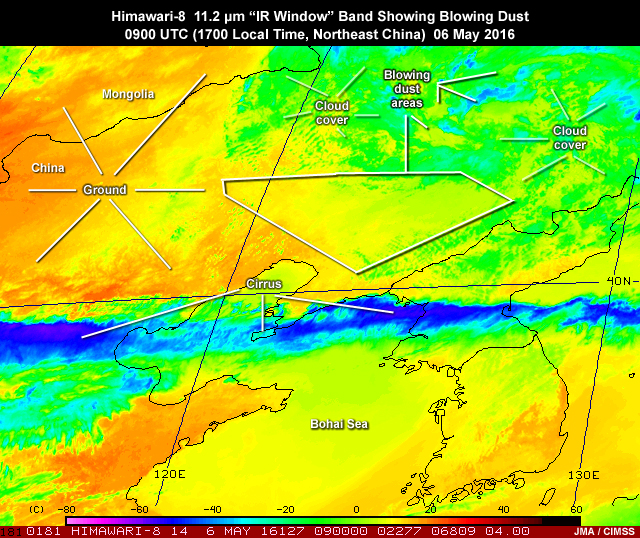
Description:
Himawari-8 AHI 11.2 micrometer longwave IR window band image over East Asia region highlighting blowing dust resulting from a mid-latitude cyclone on May 6, 2016
File Name:
ahi_ir_dust_06may16_2.jpg
Credits:
JMA / CIMSS
Copyright Terms:
COMET Standard Terms of Use
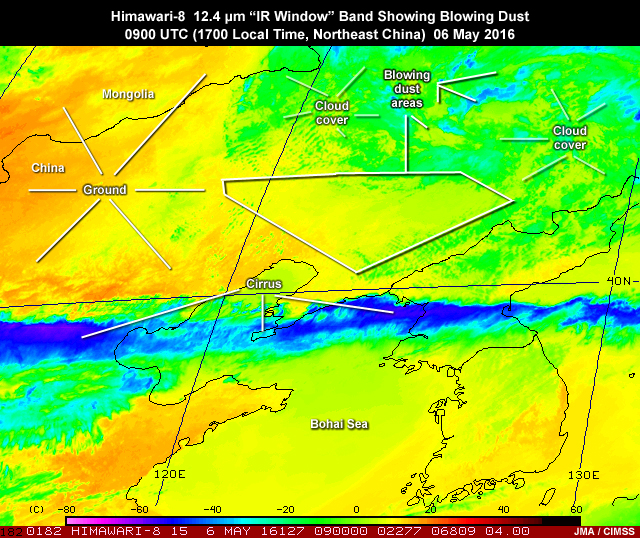
Description:
Himawari-8 AHI 12.4 micrometer dirty longwave IR window band image over East Asia region highlighting blowing dust resulting from a mid-latitude cyclone on May 6, 2016
File Name:
ahi_ir_dust_06may16_3.jpg
Credits:
JMA / CIMSS
Copyright Terms:
COMET Standard Terms of Use
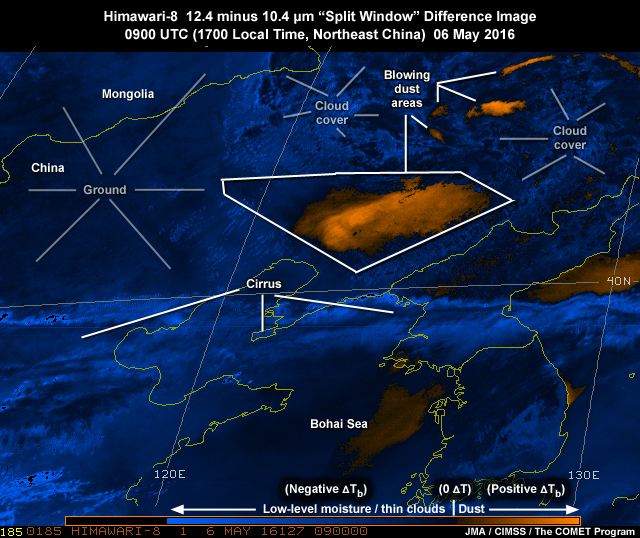
Description:
Himawari-8 AHI 12.4 minus 10.4 micrometer split IR window difference image over East Asia region highlighting blowing dust resulting from a mid-latitude cyclone on May 6, 2016
File Name:
ahi_ir_dust_06may16_4.jpg
Credits:
JMA / CIMSS / The COMET Program
Copyright Terms:
COMET Standard Terms of Use
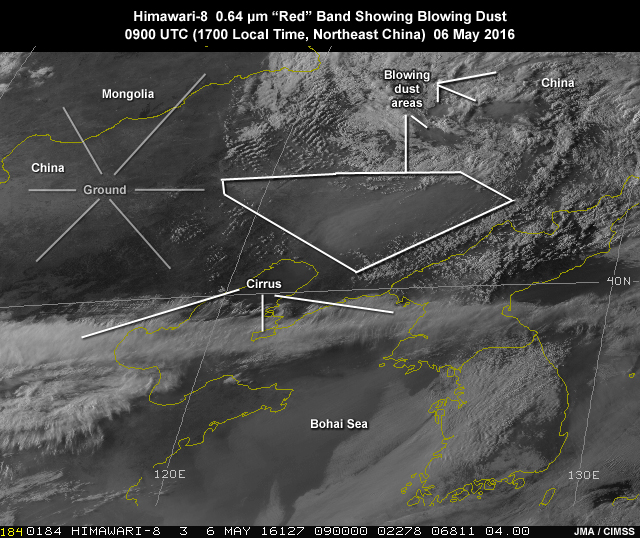
Description:
Himawari-8 AHI 0.64 red band visible image over East Asia region highlighting blowing dust resulting from a mid-latitude cyclone on May 6, 2016
File Name:
ahi_ir_dust_06may16_5.jpg
Credits:
JMA / CIMSS
Copyright Terms:
COMET Standard Terms of Use
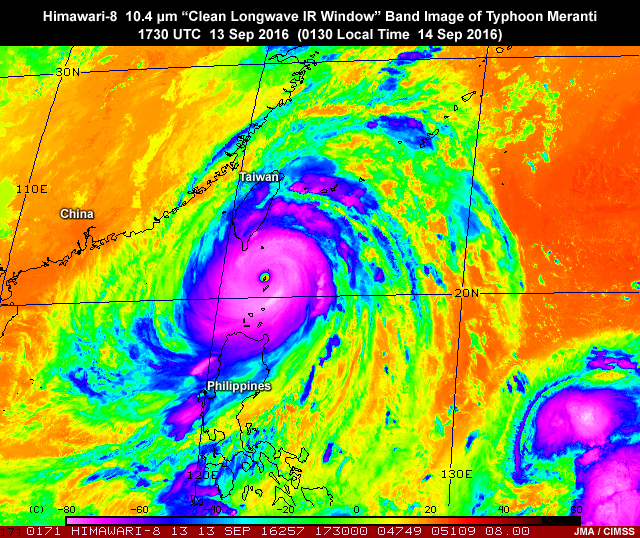
Description:
Himawari-8 AHI 10.4 micrometer clean longwave IR window band image over East Asia region of typhoon Meranti on September 13, 2016
File Name:
ahi_ir_tc_13sep16_1.jpg
Credits:
JMA / CIMSS
Copyright Terms:
COMET Standard Terms of Use
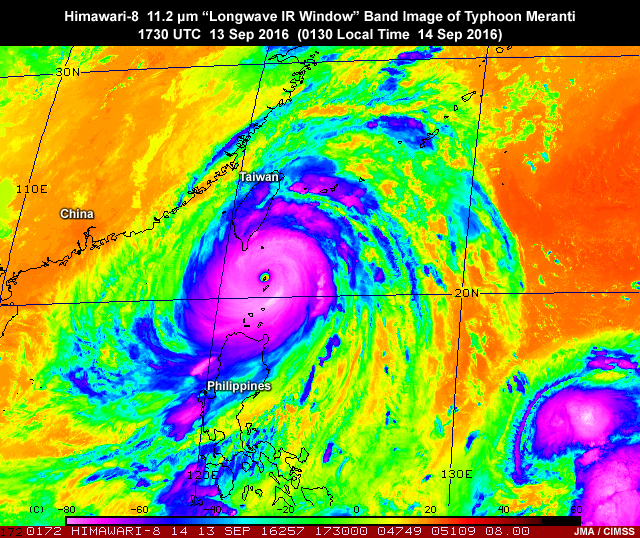
Description:
Himawari-8 AHI 11.2 micrometer longwave IR window band image over East Asia region of typhoon Meranti on September 13, 2016
File Name:
ahi_ir_tc_13sep16_2.jpg
Credits:
JMA / CIMSS
Copyright Terms:
COMET Standard Terms of Use
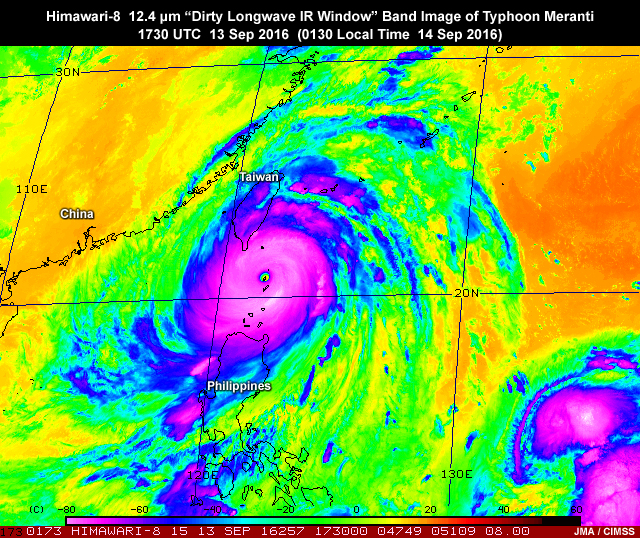
Description:
Himawari-8 AHI 12.4 micrometer dirty longwave IR window band image over East Asia region of typhoon Meranti on September 13, 2016
File Name:
ahi_ir_tc_13sep16_3.jpg
Credits:
JMA / CIMSS
Copyright Terms:
COMET Standard Terms of Use
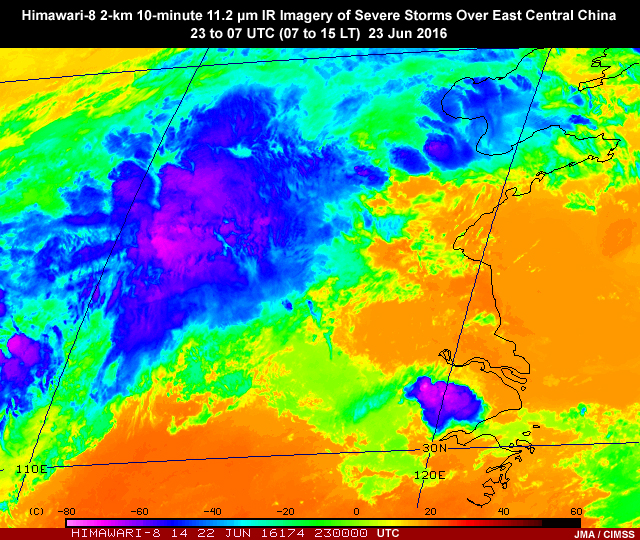
Description:
Himawari-8 AHI 11.2 micrometer longwave infrared window band animation showing deep convection leading up to a tornado event in eastern China on 23 June, 2016
File Name:
ahi_ir14_convn_23jun16_ani.mp4
Credits:
JMA / CIMSS
Copyright Terms:
COMET Standard Terms of Use
Description:
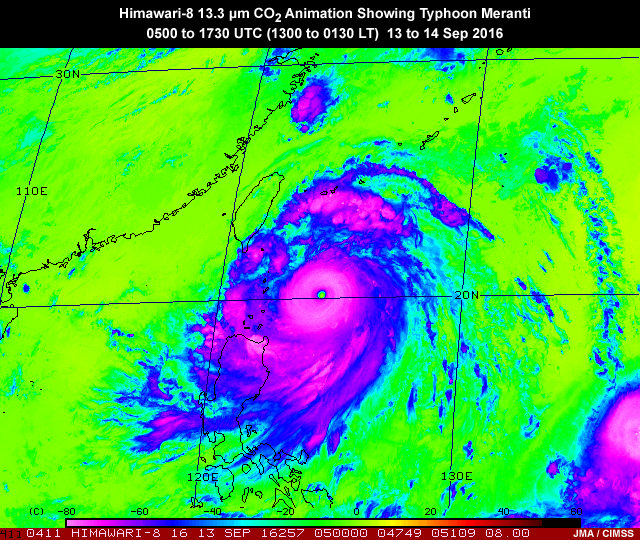
Himawari-8 AHI 13.3 micrometer carbon dioxide band animation showing typhoon Meranti over the western Pacific Ocean approaching China on September 16, 2016
File Name:
ahi_ir16_meranti_13sep16_ani.mp4
Credits:
JMA / CIMSS
Copyright Terms:
COMET Standard Terms of Use
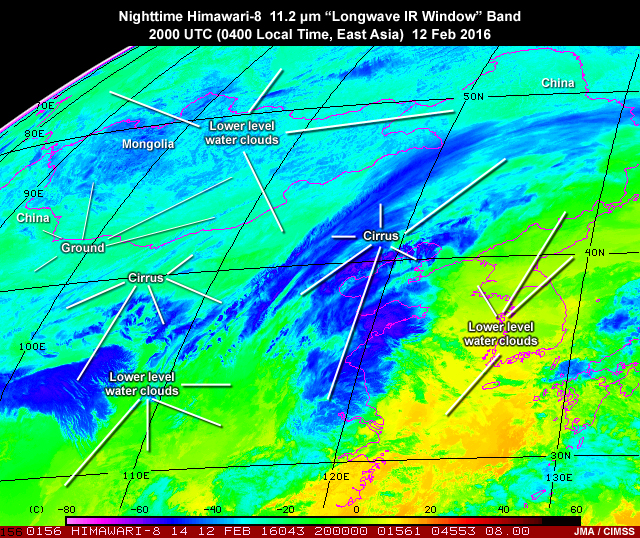
Description:
Himawari-8 nighttime AHI 11.2 micrometer "longwave IR window" band image over East Asia region highlighting water and ice cloud differences on February 12, 2016
File Name:
ahi_lwir_ntcloud_12feb16.jpg
Credits:
JMA / CIMSS
Copyright Terms:
COMET Standard Terms of Use
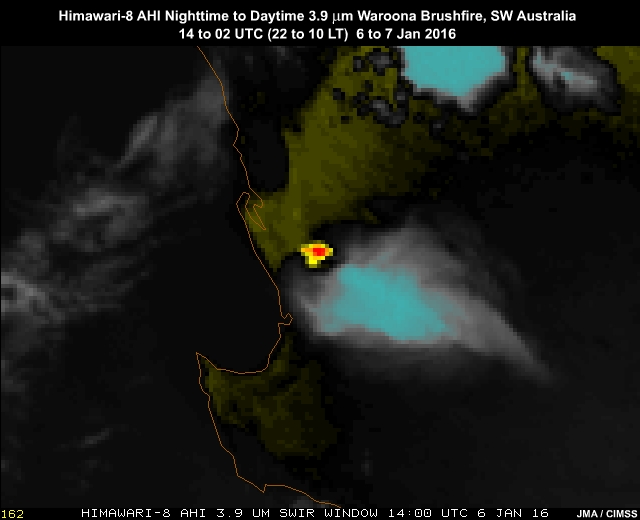
Description:
Himawari-8 AHI 3.9 micrometer shortwave IR imagery animation showing hot spots for a wildland fire burning in southwest Australia on January 6 to 7, 2016
File Name:
ahi_swir_fire_ani.mp4
Credits:
JMA / CIMSS
Copyright Terms:
COMET Standard Terms of Use
Description:
Himawari-8 nighttime AHI 3.9 micrometer "shortwave IR window" band image over East Asia region highlighting water and ice cloud differences on February 12, 2016
File Name:
ahi_swir_ntcloud_12feb16.jpg
Credits:
JMA / CIMSS
Copyright Terms:
COMET Standard Terms of Use
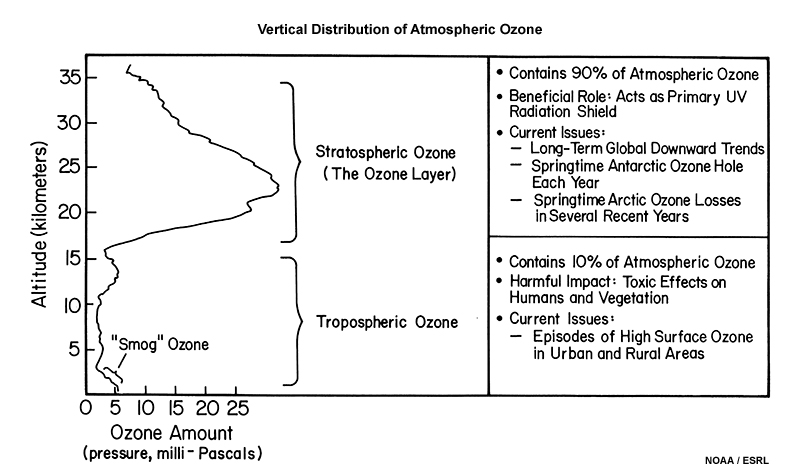
Description:
A standard atmospheric ozone profile
File Name:
atmos_ozone_profile_noaa.jpg
Credits:
NOAA / ESRL
Copyright Terms:
COMET Standard Terms of Use
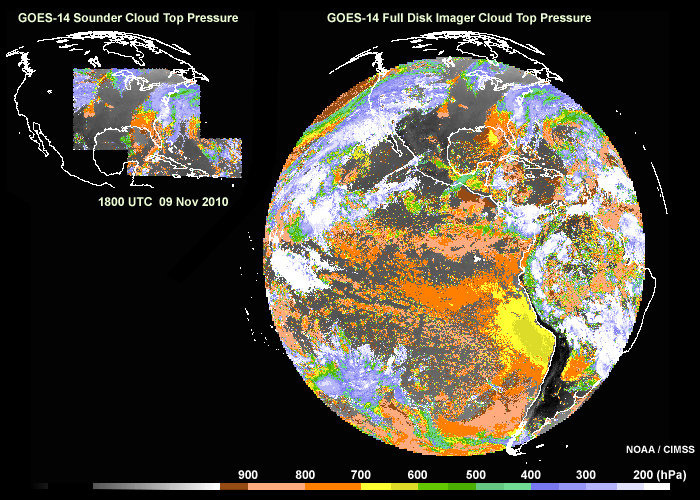
Description:
GOES-14 sounder and imager cloud top pressure products for November 9, 2010
File Name:
g14_sndr_imgr_ctp.jpg
Credits:
NOAA / CIMSS
Copyright Terms:
COMET Standard Terms of Use
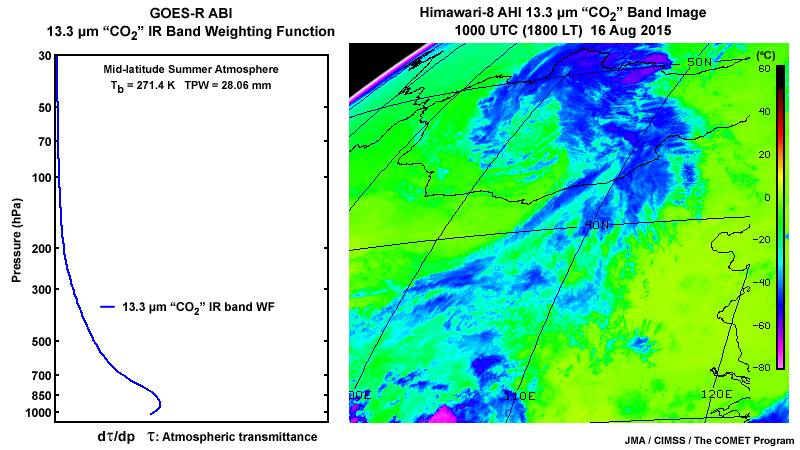
Description:
2-panel showing plot of a GOES-R ABI 13.3 "carbon dioxide" longwave infrared band weighting function for typical mid-latitude summertime conditions and a corresponding Himawari AHI image from August 16, 2015
File Name:
goesr_abi_133_wf_16aug15.jpg
Credits:
JMA / CIMSS / The COMET Program
Copyright Terms:
COMET Standard Terms of Use
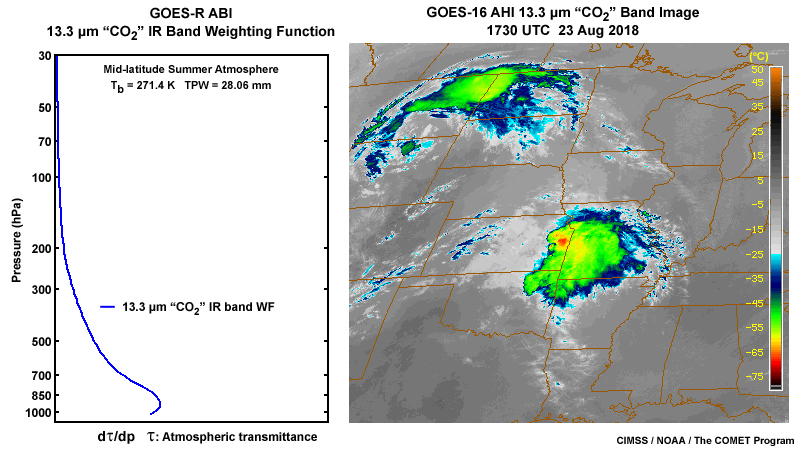
Description:
2-panel showing plot of a GOES-R ABI 13.3 carbon dioxide longwave infrared band weighting function for typical mid-latitude summertime conditions and a corresponding GOES-16 ABI image from August 23, 2018
File Name:
goesr_abi_133_wf_23aug18_g16.jpg
Credits:
CIMSS / NOAA / The COMET Program
Copyright Terms:
COMET Standard Terms of Use
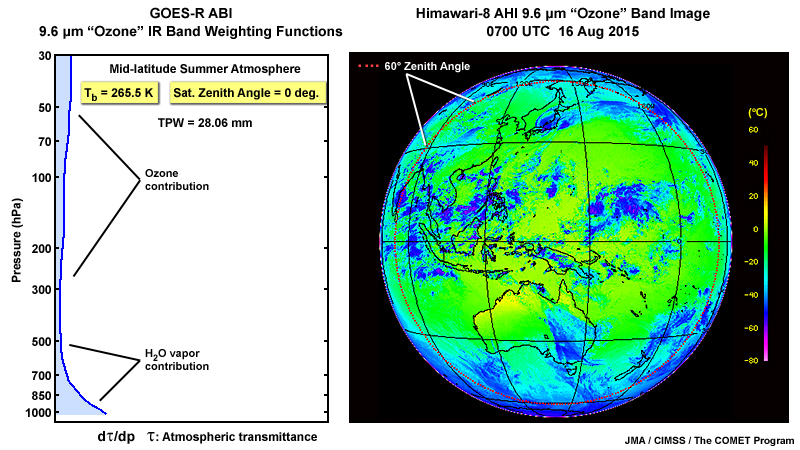
Description:
2-panel showing plot of a GOES-R ABI 9.6 "ozone" longwave infrared band weighting functions for a mid-latitude summertime atmosphere showing cooling as the satellite zenith (viewing) angles increase and a Himawari AHI full-disk image from September 20, 2016
File Name:
goesr_abi_96_wf_zen_ani.mp4
Credits:
JMA / CIMSS / The COMET Program
Copyright Terms:
COMET Standard Terms of Use
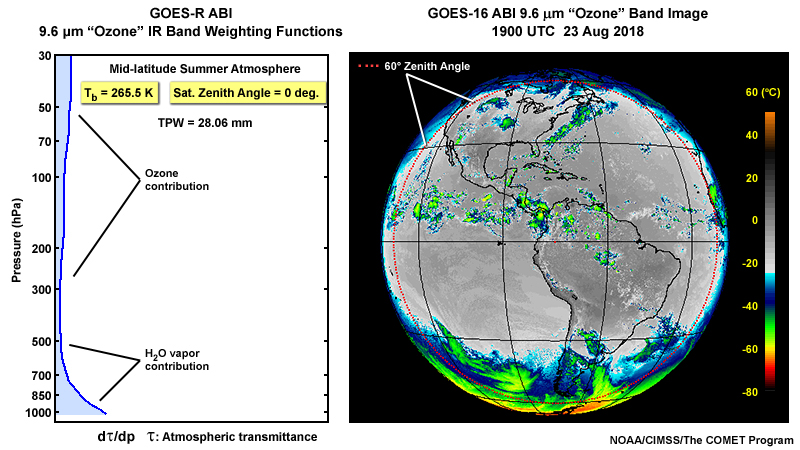
Description:
2-panel showing plot of a GOES-R ABI 9.6 "ozone" longwave infrared band weighting functions for a mid-latitude summertime atmosphere showing cooling as the satellite zenith (viewing) angles increase and a Himawari AHI full-disk image from August 23, 2018
File Name:
goesr_abi_96_wf_zen_g16_ani.mp4
Credits:
NOAA / CIMSS / The COMET Program
Copyright Terms:
COMET Standard Terms of Use
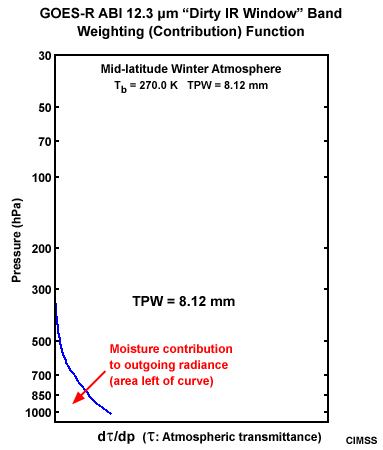
Description:
Plot of a GOES-R ABI 12.3 dirty longwave IR window band weighting function for a mid-latitude winter atmosphere
File Name:
goesr_abi_band15_wf_1.jpg
Credits:
CIMSS
Copyright Terms:
COMET Standard Terms of Use
Description:
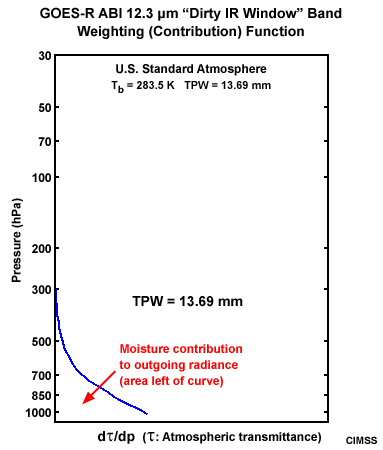
Plot of a GOES-R ABI 12.3 dirty longwave IR window band weighting function for a U.S. standard atmosphere
File Name:
goesr_abi_band15_wf_2.jpg
Credits:
CIMSS
Copyright Terms:
COMET Standard Terms of Use
Description:
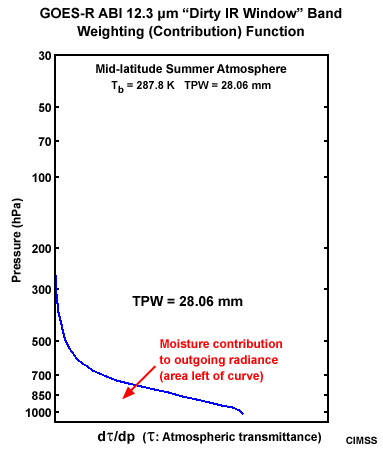
Plot of a GOES-R ABI 12.3 dirty longwave IR window band weighting function for a mid-latitude summer atmosphere
File Name:
goesr_abi_band15_wf_3.jpg
Credits:
CIMSS
Copyright Terms:
COMET Standard Terms of Use
Description:
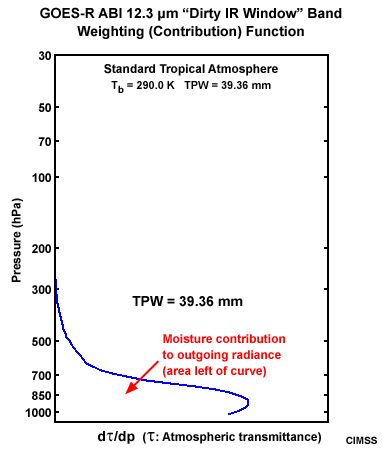
Plot of a GOES-R ABI 12.3 dirty longwave IR window band weighting function for a standard tropical atmosphere
File Name:
goesr_abi_band15_wf_4.jpg
Credits:
CIMSS
Copyright Terms:
COMET Standard Terms of Use
Description:
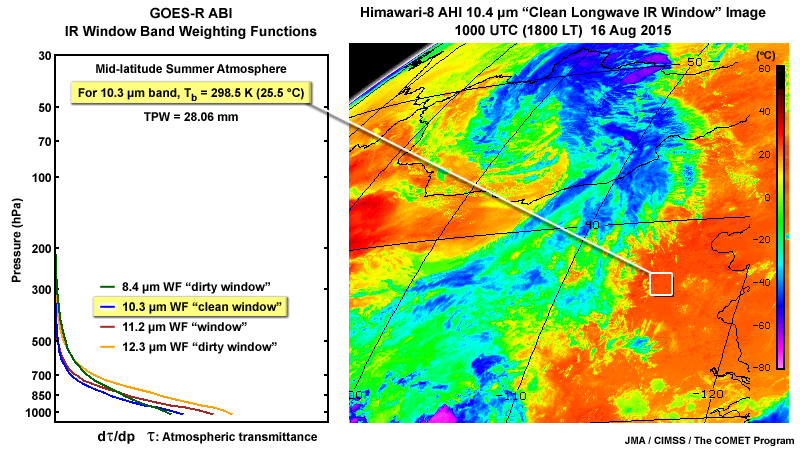
2-panel showing plot of a GOES-R ABI 10.3 "clean" longwave infrared window band weighting function for typical mid-latitude summertime conditions and a corresponding Himawari AHI image from August 16, 2015
File Name:
goesr_abi_irwin_wfs_103_16aug15.jpg
Credits:
JMA / CIMSS / The COMET Program
Copyright Terms:
COMET Standard Terms of Use
Description:
2-panel showing plot of a GOES-R ABI 10.3 "clean" longwave infrared window band weighting function for typical mid-latitude summertime midday conditions and a corresponding GOES-16 ABI 10.3 micrometer band image for August 23, 2018
File Name:
goesr_abi_irwin_wfs_103_23aug18_g16.jpg
Credits:
CIMSS / NOAA / The COMET Program
Copyright Terms:
COMET Standard Terms of Use

Description:
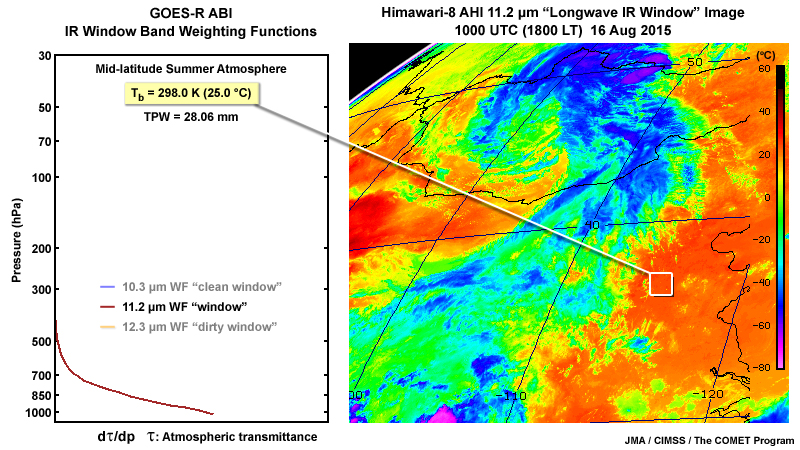
2-panel showing plot of a GOES-R ABI 11.2 longwave infrared window band weighting function for typical mid-latitude summertime conditions and a corresponding Himawari AHI image from August 16, 2015
File Name:
goesr_abi_irwin_wfs_112_16aug15.jpg
Credits:
JMA / CIMSS / The COMET Program
Copyright Terms:
COMET Standard Terms of Use
Description:
2-panel showing plot of a GOES-R ABI 11.2 longwave infrared window band weighting function for typical mid-latitude summertime midday conditions and a corresponding GOES-16 ABI 11.2 micrometer band image for August 23, 2018
File Name:
goesr_abi_irwin_wfs_112_23aug18_g16.jpg
Credits:
CIMSS / NOAA / The COMET Program
Copyright Terms:
COMET Standard Terms of Use
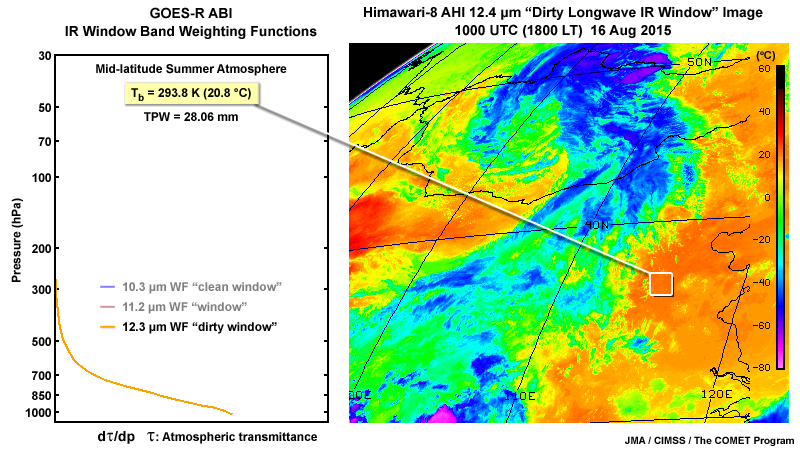
Description:
2-panel showing plot of a GOES-R ABI 12.3 micrometer weighting function for typical mid-latitude summertime conditions and a corresponding Himawari-8 AHI 12.4 micrometer dirty longwave IR window image from August 16, 2015
File Name:
goesr_abi_irwin_wfs_123_16aug15.jpg
Credits:
JMA / CIMSS / The COMET Program
Copyright Terms:
COMET Standard Terms of Use
Description:
2-panel showing plot of a GOES-R ABI 12.3 dirty longwave infrared window band weighting function for typical mid-latitude summertime midday conditions and a corresponding GOES-16 ABI 12.3 micrometer band image for August 23, 2018
File Name:
goesr_abi_irwin_wfs_123_23aug18_g16.jpg
Credits:
CIMSS / NOAA / The COMET Program
Copyright Terms:
COMET Standard Terms of Use
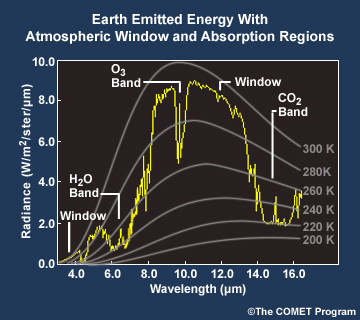
Description:
Plot showing Earth emitted energy curves with atmospheric window and absorption regions overlaid
File Name:
ir_emission_spectra.jpg
Credits:
©The COMET Program
Copyright Terms:
COMET Standard Terms of Use
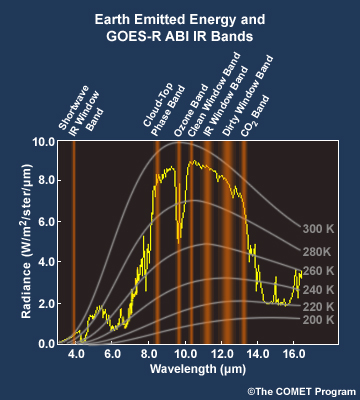
Description:
Plot showing Earth emitted energy curves with GOES-R ABI shortwave and longwave IR band locations overlaid
File Name:
ir_spectra_goesr_bands.jpg
Credits:
©The COMET Program
Copyright Terms:
COMET Standard Terms of Use
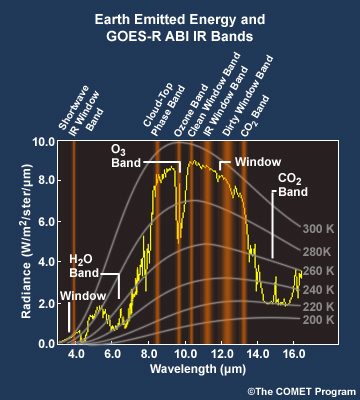
Description:
Plot showing Earth emitted energy curves with GOES-R ABI shortwave and longwave IR band locations and atmospheric window and absorption regions overlaid
File Name:
ir_spectra_goesr_bands_atm_bands.jpg
Credits:
©The COMET Program
Copyright Terms:
COMET Standard Terms of Use
Description:
Plot showing IR atmospheric transmittance for a representative atmosphere, GOES-R ABI IR band locations highlighting the 10.3 micrometer band, and major atmospheric absorption regions
File Name:
ir_trans_band_srfs_104_band.jpg
Credits:
CIMSS / The COMET Program
Copyright Terms:
COMET Standard Terms of Use
Description:
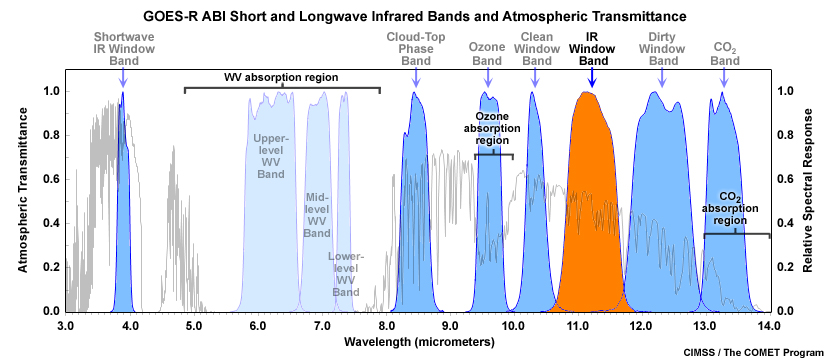
Plot showing IR atmospheric transmittance for a representative atmosphere, GOES-R ABI IR band locations highlighting the 11.2 micrometer band, and major atmospheric absorption regions
File Name:
ir_trans_band_srfs_112_band.jpg
Credits:
CIMSS / The COMET Program
Copyright Terms:
COMET Standard Terms of Use
Description:
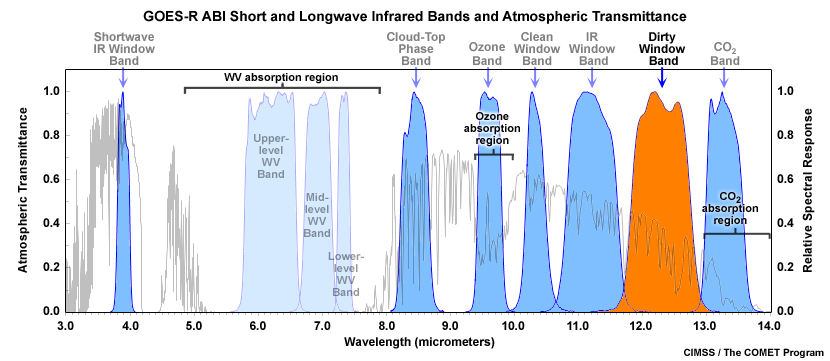
Plot showing IR atmospheric transmittance for a representative atmosphere, GOES-R ABI IR band locations highlighting the 12.3 micrometer band, and major atmospheric absorption regions
File Name:
ir_trans_band_srfs_123_band.jpg
Credits:
CIMSS / The COMET Program
Copyright Terms:
COMET Standard Terms of Use
Description:
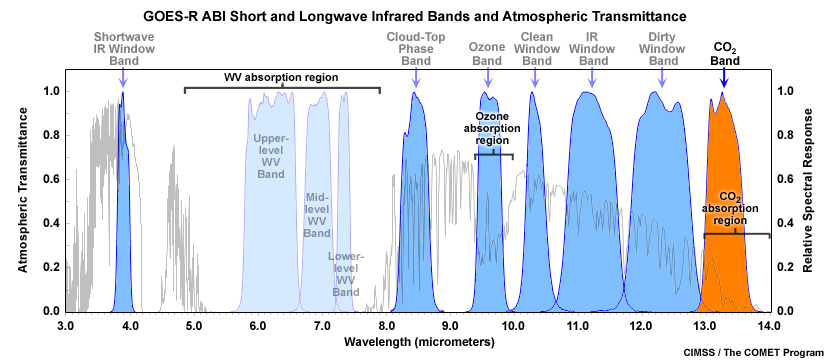
Plot showing IR atmospheric transmittance for a representative atmosphere, GOES-R ABI IR band locations highlighting the 13.3 micrometer band, and major atmospheric absorption regions
File Name:
ir_trans_band_srfs_133_band.jpg
Credits:
CIMSS / The COMET Program
Copyright Terms:
COMET Standard Terms of Use
Description:
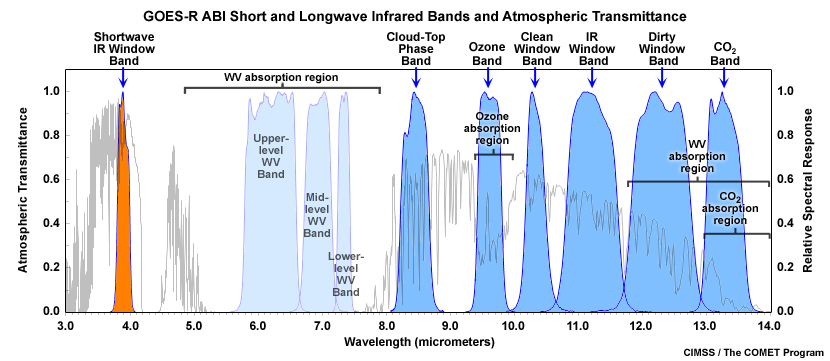
Plot showing IR atmospheric transmittance for a representative atmosphere, GOES-R ABI IR band locations highlighting the 3.9 shortwave IR micrometer band, and major atmospheric absorption regions
File Name:
ir_trans_band_srfs_39_band.jpg
Credits:
CIMSS / The COMET Program
Copyright Terms:
COMET Standard Terms of Use
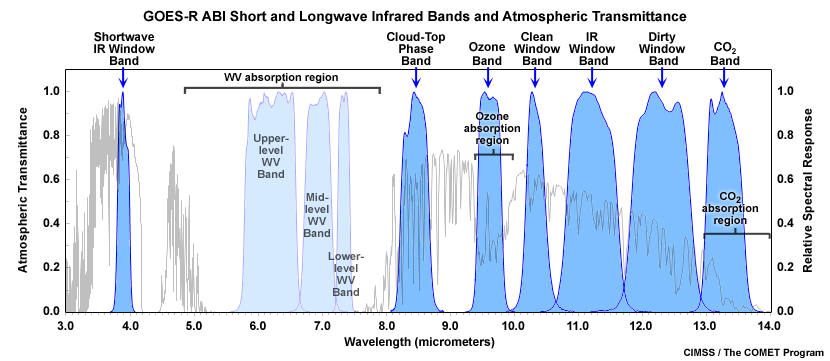
Description:
Plot showing IR atmospheric transmittance for a representative atmosphere, GOES-R ABI IR band locations highlighting the 8.4 micrometer band, and major atmospheric absorption regions
File Name:
ir_trans_band_srfs_84_band.jpg
Credits:
CIMSS / The COMET Program
Copyright Terms:
COMET Standard Terms of Use
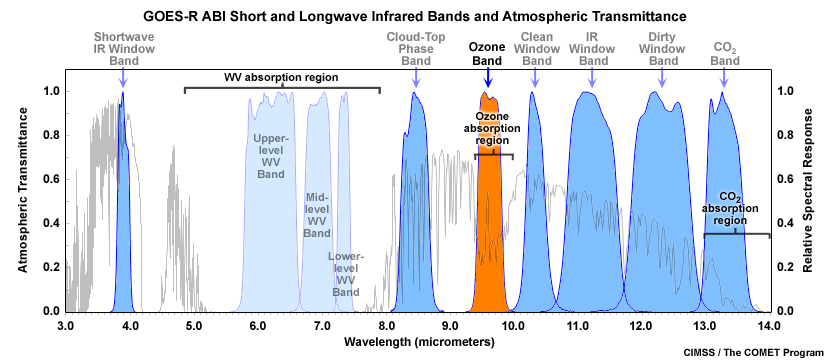
Description:
Plot showing IR atmospheric transmittance for a representative atmosphere, GOES-R ABI IR band locations highlighting the 9.6 micrometer band, and major atmospheric absorption regions
File Name:
ir_trans_band_srfs_96_band.jpg
Credits:
CIMSS / The COMET Program
Copyright Terms:
COMET Standard Terms of Use
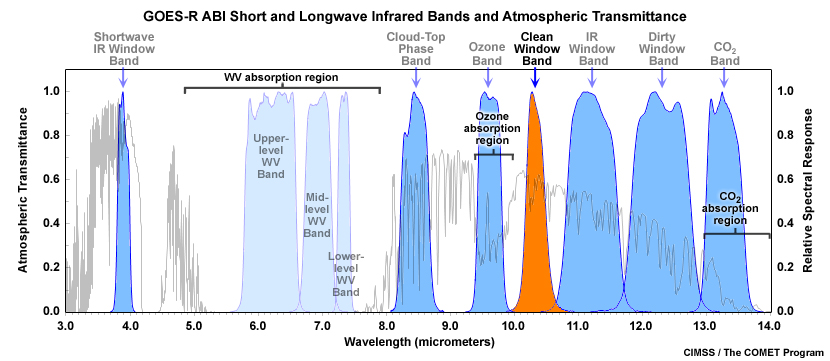
Description:
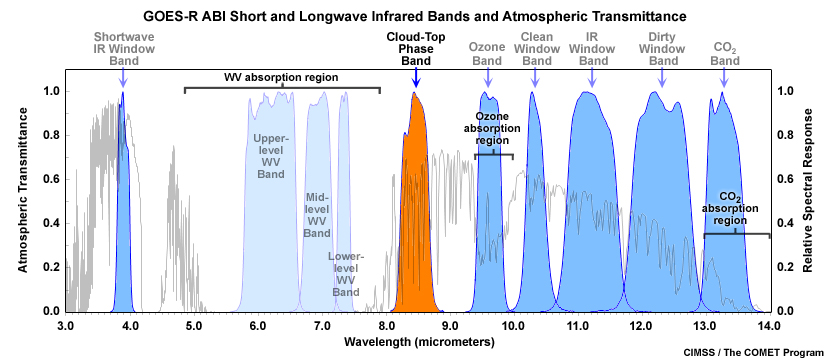
Plot showing IR atmospheric transmittance for a representative atmosphere, GOES-R ABI IR band locations, and major atmospheric absorption regions
File Name:
ir_trans_band_srfs_abs_regions.jpg
Credits:
CIMSS / The COMET Program
Copyright Terms:
COMET Standard Terms of Use
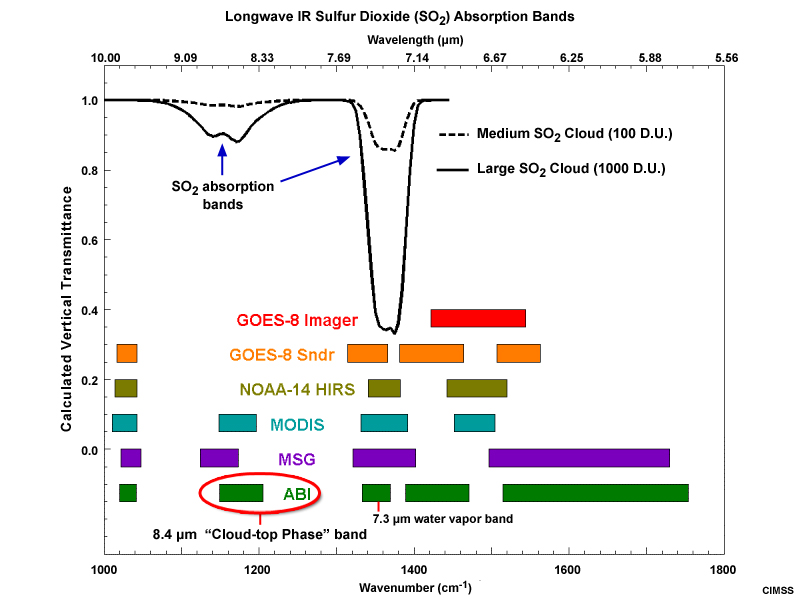
Description:
Plot showing sulfur dioxide absorption bands in the longwave infrared with various satellite instrument band locations
File Name:
lwir_so2_transmittance.jpg
Credits:
CIMSS
Copyright Terms:
COMET Standard Terms of Use
Description:
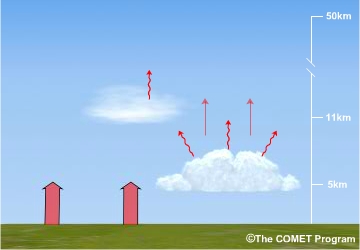
Generic conceptual animation showing Earth emitted longwave infrared radiation for ground clouds
File Name:
sm5cm100_ani.mp4
Credits:
©The COMET Program
Copyright Terms:
COMET Standard Terms of Use
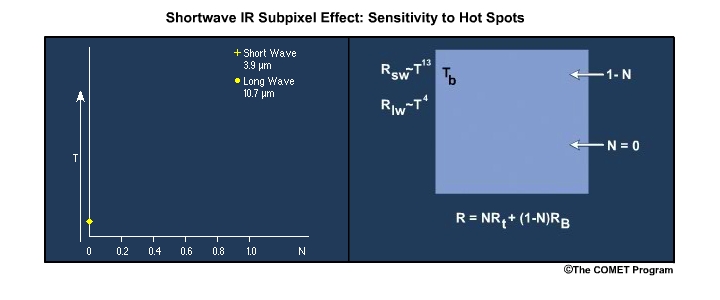
Description:
Animating illustrations explain the subpixel effect for the 3.9 micrometer infrared channel when hot targets such as fires partially fill a field of view.
File Name:
sm5cm40_ani.mp4
Credits:
©The COMET Program
Copyright Terms:
COMET Standard Terms of Use
Description:
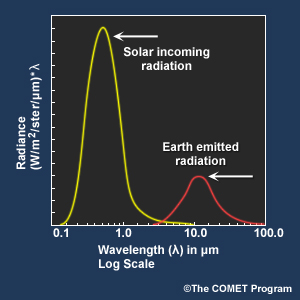
Plot showing both incoming solar and earth emitted Planck radiation curves
File Name:
sun_earth_planck_curves.jpg
Credits:
©The COMET Program
Copyright Terms:
COMET Standard Terms of Use
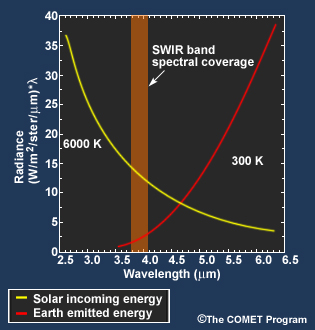
Description:
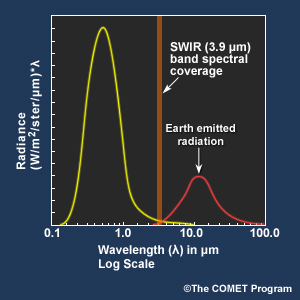
Plot showing both incoming solar and earth emitted Planck radiation curves with GOES-R ABI 3.9 micrometer shortwave infrared band coverage
File Name:
sun_earth_planck_curves_39band.jpg
Credits:
©The COMET Program
Copyright Terms:
COMET Standard Terms of Use
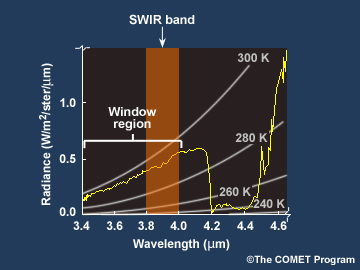
Description:
Plot showing both earth emitted Planck radiation curves zooming into the 3.9 micrometer window region with GOES-R ABI 3.9 micrometer shortwave infrared band coverage
File Name:
swir_band_earth_emission_zoom.jpg
Credits:
©The COMET Program
Copyright Terms:
COMET Standard Terms of Use
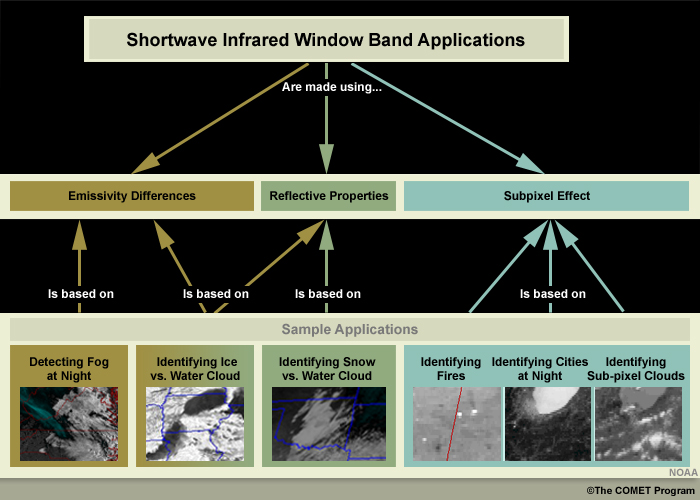
Description:
Concept map of shortwave infrared channel applications, showing what they are made from (emissivity differences, reflective properties, and subpixel effects) and sample applications, such as fog detection at night and identifying fires
File Name:
swir_cmap_new.jpg
Credits:
©The COMET Program
Copyright Terms:
COMET Standard Terms of Use
Description:
Plot showing both incoming solar and earth emitted Planck radiation curves zooming on the overlap region with GOES-R ABI 3.9 micrometer shortwave infrared band coverage
File Name:
swir_solar_earth_rad_cross_over.jpg
Credits:
©The COMET Program
Copyright Terms:
COMET Standard Terms of Use
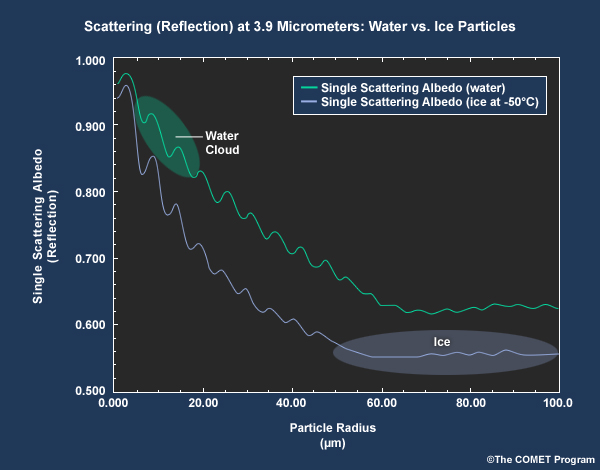
Description:
Plot of water vs. ice particle scattering as a function of particle radius at 3.9 micrometers highlighting the relatively high reflectance of water compared to ice
File Name:
swir_water_vs_ice_scattering.jpg
Credits:
©The COMET Program
Copyright Terms:
COMET Standard Terms of Use