About the GLM »
Introduction
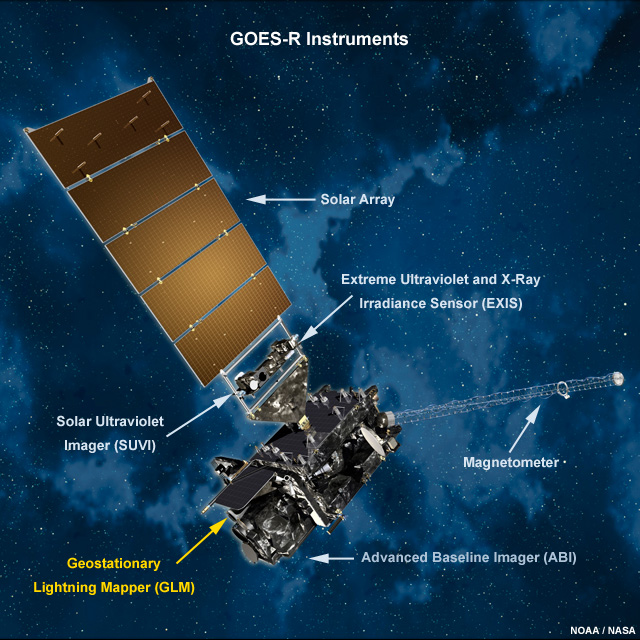
This lesson describes the need for real-time lightning information and the capabilities of the Geostationary Lightning Mapper (or GLM). GLM flies on board the new-generation GOES-R satellites as the first operational lightning detector in geostationary orbit.
Upon completion of the lesson, learners will be able to:
- Describe the GLM’s benefits and capabilities
- Describe the main components of the cloud-to-ground lightning flash life cycle
- Differentiate between how lightning is observed by space-based and ground-based detection systems
- Outline the process of converting GLM observations to a lightning flash product
- Describe how GLM observations will help improve situational awareness and support severe weather warning decisions
- Explain how GLM observations will improve warnings of impending lightning hazards
- Highlight other applications that will benefit from GLM observations
About the GLM »
Lightning Impacts
Lightning is one of the top three causes of weather related injuries and deaths in the United States, with dozens of people killed and hundreds more severely injured each year.
The costs to the private and civilian sectors are estimated to be in the billions annually.
The airline industry alone loses over an estimated two billion dollars each year in operating expenses due to thunderstorm related flight delays.
In addition, over 100,000 lightning related insurance claims are made in the United States each year.
Lightning strikes start over 20,000 fires in the U.S. every year, including structure and wildland fires.
Lightning also interferes with outdoor activities, injures and kills livestock, damages buildings, communications systems, power lines, wind turbines, and electrical systems.
Finally, lightning is a major regional source of nitrogen oxides and ozone, trace gases that affect air chemistry and air quality in the upper troposphere and play a role in the global climate.
About the GLM »
The Need for Lightning Information and the GLM
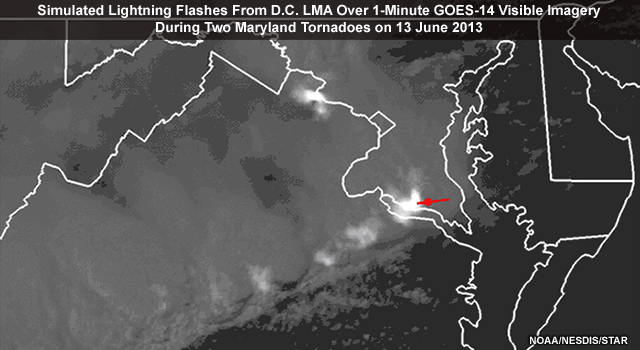
The frequency of lightning activity is closely linked to the intensity of thunderstorms. This makes it an important observation for monitoring the potential development of thunderstorm-related hazards such as hail, heavy rainfall, damaging winds, tornadoes, and fires.
Weather forecasters in the United States rely on several ground-based lightning observation networks for real-time monitoring of lightning activity.
Ground-based observations, however, are non-uniform and lightning networks undergo continuous modification. These factors helped motivate the GLM, which has relatively constant observational characteristics across the instrument's entire coverage area.
The complementary nature of high spatial resolution observations from ground networks and the GLM's high frequency sampling and broad spatial coverage, will allow for more detailed monitoring of lightning activity across large geographical regions, providing vital information to weather sensitive communities and industries, and important information for climate studies.
About the GLM »
GLM Benefits
The Geostationary Lightning Mapper on GOES-R through -U (GOES-16 to -19) will continuously measure all lightning activity (both intra–cloud and cloud–to–ground flashes, also known as ‘total lightning’) across most of the Western Hemisphere. It provides day and night observations in real time with near uniform thunderstorm-scale resolution from geostationary orbit. Note however, that while the GLM observes ‘total lightning’, it cannot natively distinguish between flash types.
The GLM will be a new and revolutionary tool for improved nowcasts and warnings of thunderstorms, lightning activity, hail, damaging winds, flash floods, and tornadoes.
More specifically, the continuous flow of lightning data from the GLM will assist with the following:
- Detecting, tracking, and monitoring of storm intensification
- Predicting the onset of tornadoes, hail, microbursts, and flash floods
- Providing warnings of cloud-to-ground lightning before it strikes
- Enhancing real-time hazardous weather information available to communities and emergency managers, which will improve preparation and response efficiency
About the GLM »
GLM Capabilities
GLM capabilities and data products include:
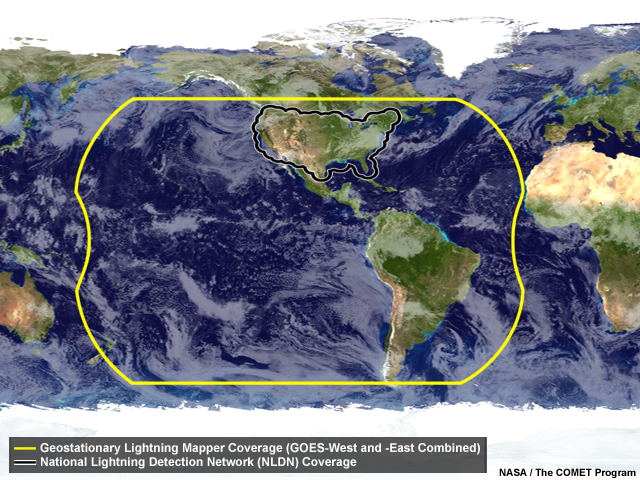
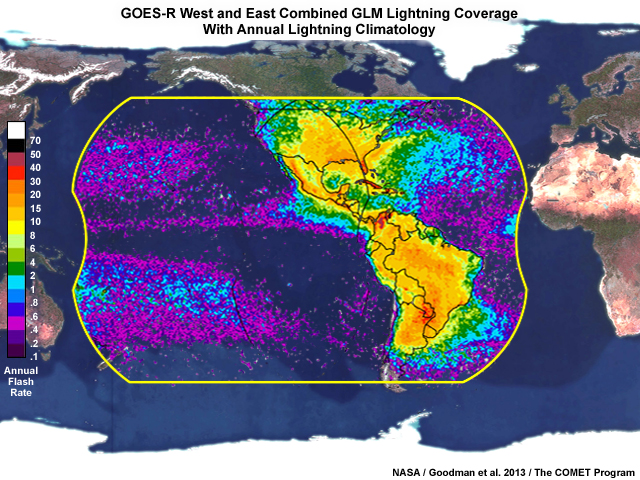
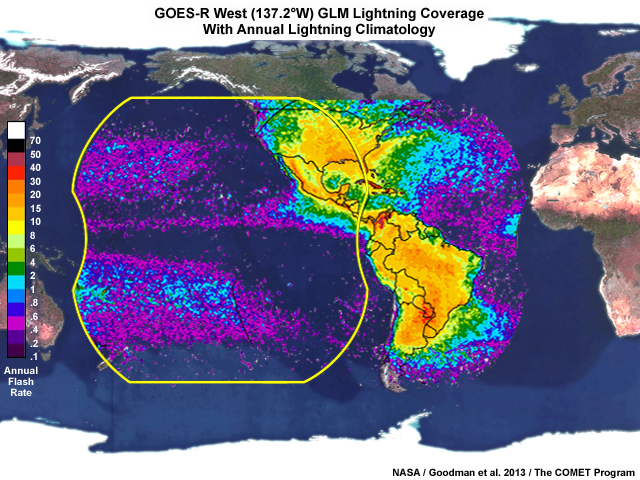
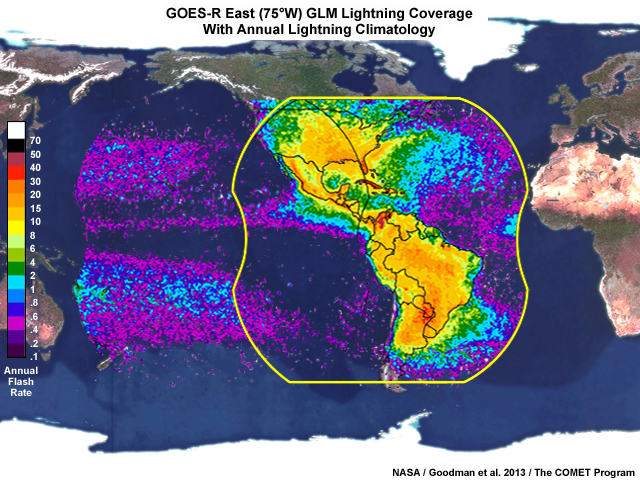
- Near full disk coverage for the continental U.S., Central and South America, and adjacent oceans from the combined GOES-R West and East constellation, the first such capability from geostationary orbit
Click the tabs to view GLM coverages for the operational GOES-R West and East locations.
- Continuous 24-hour coverage from geostationary orbit
- Measurements of total lightning activity (intra-cloud, inter-cloud, and cloud-to-ground flashes), but cannot natively distinguish between flash types
- 2 millisecond sampling and refresh rate
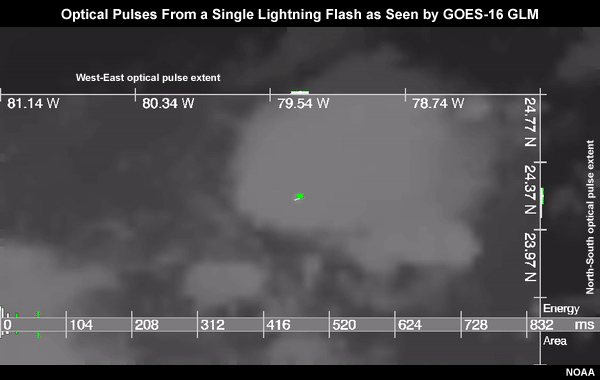
The animation shows the evolution of a single lightning flash as observed by the GOES-16 GLM. Areal extent and energy are shown for each of the flash's optical pulses as the flash travels through the associated thunderstorm anvil cloud (seen in the background).
- Level-2 data (events, groups, flashes) that arrives in 20-second data blocks with no more than a 20-second latency
- At least 70% detection efficiency during both day and night over the field of view, and a low 5% false detection rate
- Native spatial resolution from 8 km at nadir (directly below the satellite) above the equator, to 14 km at the edge of the field of view (near the edge of the coverage domain)
- Regarding gridded products initially developed for display in the NWS AWIPS visualization system
- They were developed to remap all 8-km GLM products to the ABI 2x2 km 'fixed grid' resolution
- The initial GLM gridded product is flash extent density, with other GLM products being evaluated for potential operational useage/implementation
- Gridded products arrive within one minute and include the previous minute of observations
About the GLM »
GLM Applications
About the GLM » GLM Applications »
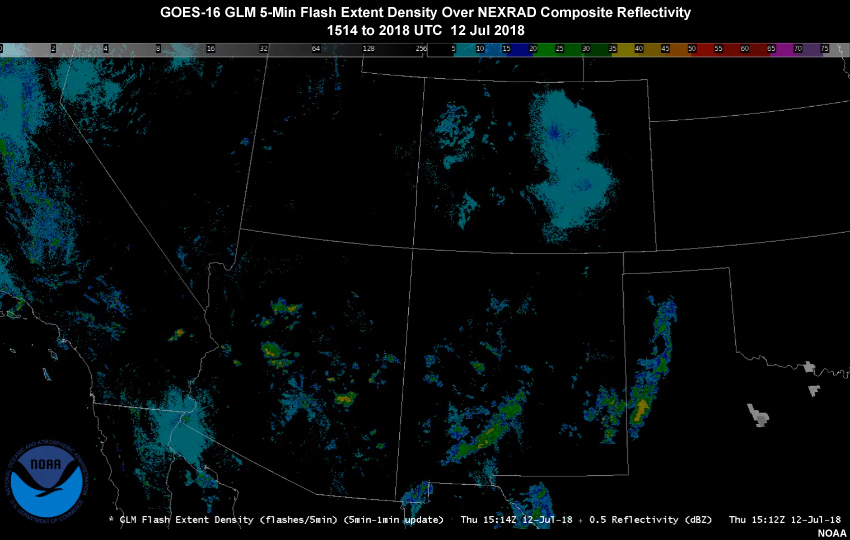
Convection
The GLM's continuous lightning monitoring capability will give forecasters a new tool for identifying, monitoring, and tracking developing thunderstorms 24 hours a day. GLM products will provide early indications of intensifying thunderstorms and related hazards. The GLM observations can also be used to help forecasters ‘triage’ their time among multiple storm cells. More electrically active cells may warrant more investigation by the forecaster.
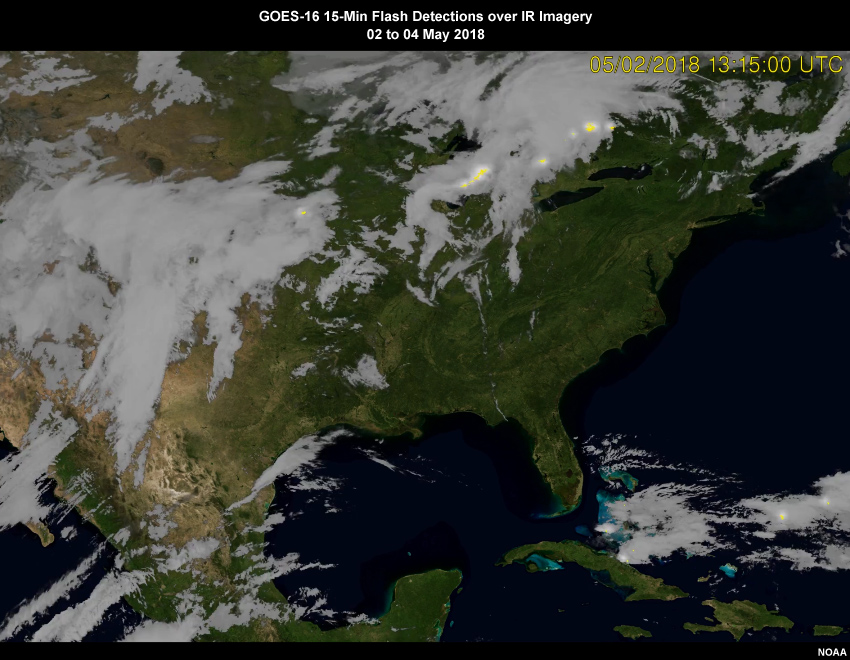
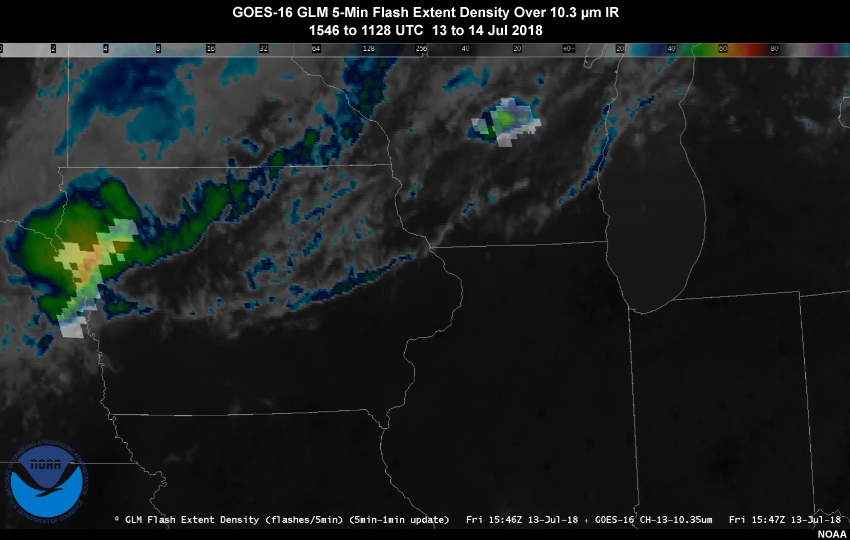
GLM data will be used in conjunction with infrared imagery from the GOES-R Advanced Baseline Imager (ABI) to identify rapidly cooling cloud tops associated with vigorous convective cloud development where the electrification process is beginning.
Scientists have demonstrated a strong correlation between trends in total lightning activity, the strength of thunderstorm updrafts and downdrafts, and the subsequent occurrence of severe weather and tornadoes. What exactly is the connection? A storm's intensification is a direct consequence of strong vertical motions that support cloud electrification in the cloud's mixed phase region. As updrafts and downdrafts intensify, water and ice hydrometeors collide more often. This increases electrification within the cloud, which supports the formation of lightning.
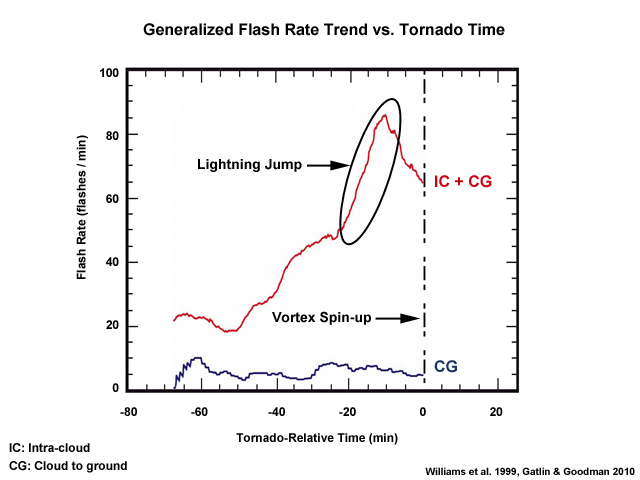
When researchers began examining trends in lightning activity within developing storms, they noticed that some storms with rapid increases in lightning subsequently produced severe weather. Further analysis has shown that this rapid and significant increase or "jump" in total lightning typically occurs over about 10 minutes and is associated with strengthening updrafts. Not all severe thunderstorms demonstrate a lightning jump, particularly low-topped convection, and not all storms with jumps produce severe weather. However, the mere presence of a lightning jump indicates the potential for severe weather to develop.
Studies of lightning jumps continue. These jumps show considerable promise in serving as a precursor signature and warning decision support tool for nowcasting the occurrence of tornadoes and other severe weather hazards, such as strong winds and large hail. Evaluations by forecasters using lightning mapping arrays have indicated that the presence of a lightning jump can help "tip the scales" for a forecaster on the fence whether to issue a warning or not. Additionally, forecasters have stated that a lack of observed lightning has been used in certain situations as guidance to not issue a warning. Ultimately, GLM observations will work best in conjunction with a forecaster's own experience and understanding of the local environment.
In complex terrain and areas with sparse radar and rain gauge coverage, the combination of GLM total lightning observations and ABI imagery will help locate thunderstorms and subjectively identify where heavy rainfall may be occurring.
In summary, GLM measurements are expected to play a significant role in monitoring lightning flash rates and trends for individual storm cells. When GLM observations are combined with those from ground-based lightning networks, radar, and trends in cloud top signatures from the GOES-R ABI, tornado warning lead times and nowcasts of other severe weather hazards are expected to improve.
For more information on the total lightning concept, total lightning networks, and potential applications for forecasting thunderstorm hazards, see the NASA SPoRT training module Total Lightning Training: Part 1 (http://weather.msfc.nasa.gov/sport/training/).
About the GLM » GLM Applications »
Early Warning of Lightning Ground Strike Hazards
About two thirds of lightning occurs within a cloud, with most of the rest striking the ground. Recall that the GLM measures both intra-cloud and cloud-to-ground lightning flashes, also known as total lightning, but will not distinguish between the two types.
Studies have shown that intra-cloud lightning typically precedes cloud-to-ground strikes, often by 5 to 10 minutes or more. This will allow the GLM to provide warnings of approaching cloud-to-ground lightning before it strikes.
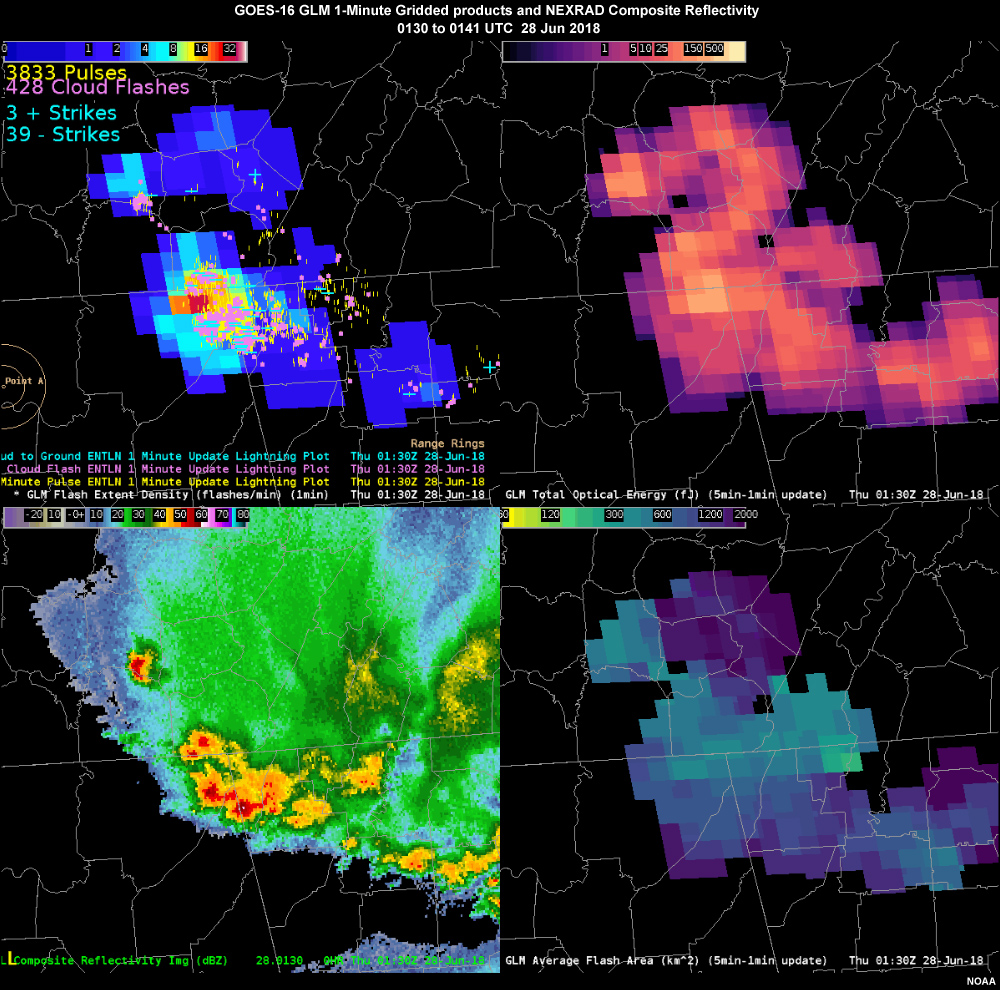
The animation highlights GLM detection of multiple anvil lightning flashes within the stratiform precipitation region to the north of a line of thunderstorms moving southward from Tennessee into Alabama and Georgia. Top left is ENTLN lighting data plotted over GLM Flash Extent Density, top right is GLM Total Optical Energy, bottom left is NEXRAD Composite Reflectivity, and bottom right is GLM Average Flash Area.
Here is testimony from one forecaster involved in the GOES-R Proving Ground at the NOAA Hazardous Weather Testbed:
"We saw several instances where the total lightning was picking up on storms before the AWIPS lightning [NLDN ground strikes] program picked up on them. One could see the utility of this in the future, bringing with it a potential for lightning statements and potentially lightning-based warnings."
GLM-based total lightning products could become important tools for lightning related decision support services where, for example, lightning proximity information is communicated to emergency managers concerned with public safety at large outdoor events.
About the GLM » GLM Applications »
Other Applications
Here is a sample of the many anticipated applications and advancements the GLM will support.
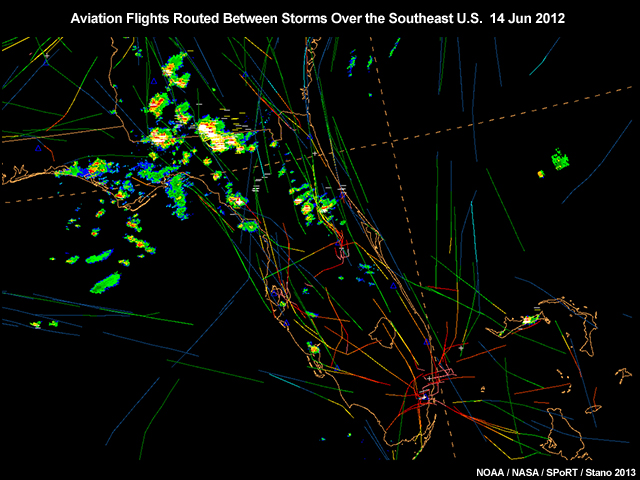
Aviation
- The GLM's expanded coverage will lead to significant improvements in airline routing around thunderstorms and assist with air traffic flow management, improving safety both in the air and on the ground, saving fuel, and reducing delays. This will be particularly important for oceanic routes.
Fires
- The GLM will enhance lightning detection and provide earlier indications of impending cloud-to-ground strikes in even the most remote areas, which will help reduce response times to any fires that may result.
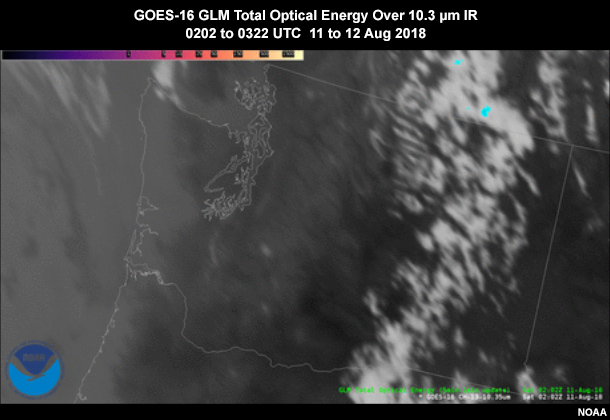
The animation shows GLM 5-minute total optical energy (TOE) associated with lightning flashes from thunderstorms over Washington during the afternoon and evening hours of August 11, 2018.

The animation highlights fires, some possibly resulting from lightning strikes. using the GOES-16 fire radiative power (FRP) product over Washington during the afternoon and evening of August 11, 2018. Recall that a lightning strike is a lightning flash that contacts either the ground or an object, such as a tree, in contact with the ground.
NWP
- The GLM will provide a significant new source of lightning data for modeling efforts across much of the Western Hemisphere. As data assimilation techniques and computing resources continue to improve, researchers expect further advances in storm forecasting resulting from the combined assimilation of GOES-R GLM and ABI observations.
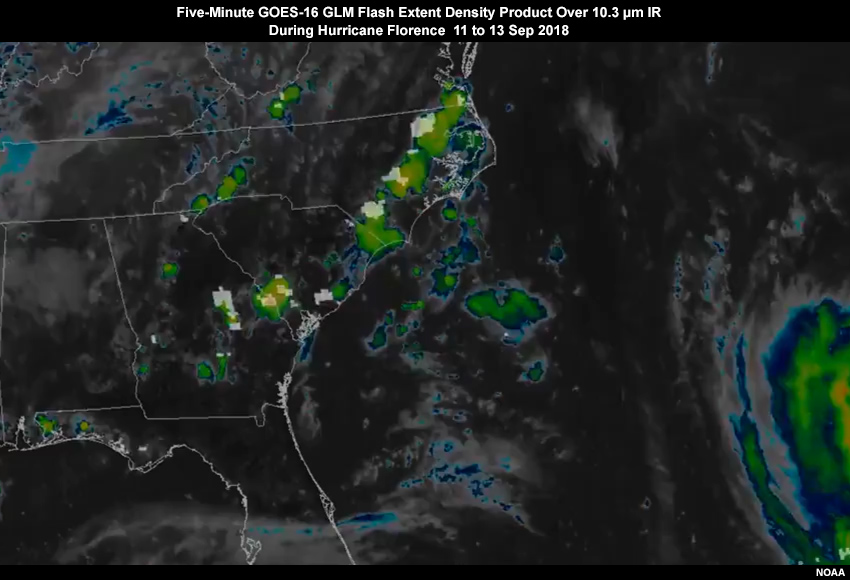
Tropical Cyclones
- Observations of lightning activity within tropical cyclones may give forecasters important clues for forecasting rapid intensity changes, both strengthening and weakening. Analyses and evaluations to determine how ground-based and GLM lightning observations may be applicable to cyclone analysis and forecasting are ongoing.
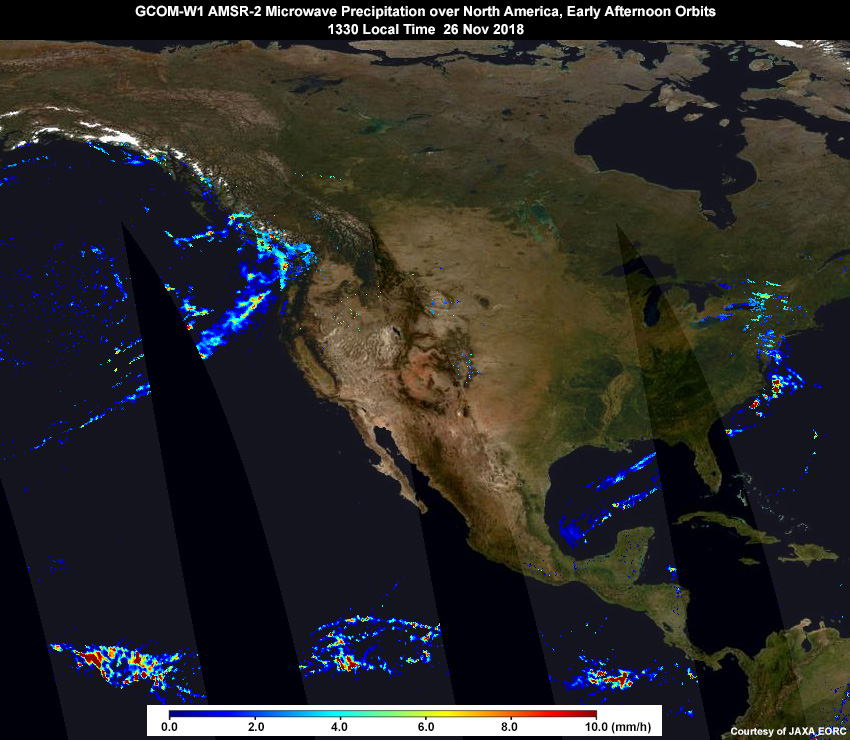
Quantitative Precipitation Estimation
- Simultaneous observations from GLM, ABI, space-based microwave, ground-based radar as well as in situ instruments will improve the depiction and nowcasting of real-time convective precipitation, improve flood advisories, and lead to a better understanding of regional precipitation characteristics and trends. This could be particularly useful in data-sparse areas.
Atmospheric Chemistry
- Observations show that lightning produces around 10 percent of Earth's atmospheric nitric oxide (NO) and nitrogen dioxide (NO2). GLM lightning observations will provide a new data source for monitoring atmospheric chemistry and improving air quality forecasts.
Observing Lightning »
Introduction
Most lightning is seen as a single bright flash of light that lasts less than half a second on average. But in fact, what we see is only one part of the lightning flash. This section provides a brief overview of the life cycle of a typical cloud-to-ground lightning flash and how it is detected by ground and space-based instruments. This should give you a better appreciation of the complexity of the phenomenon and the engineering required to detect it.
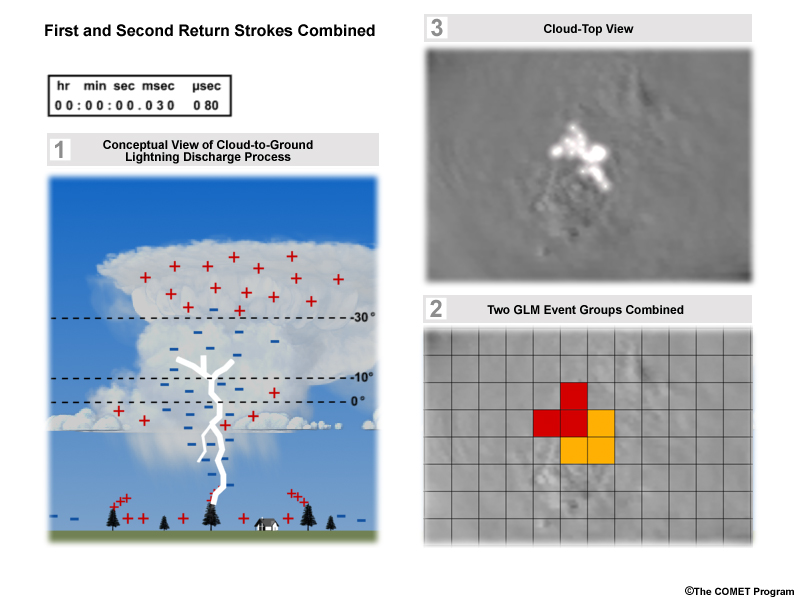
The flash overview discussion revolves around an animated visualization, which provides different perspectives of a typical cloud-to-ground flash.
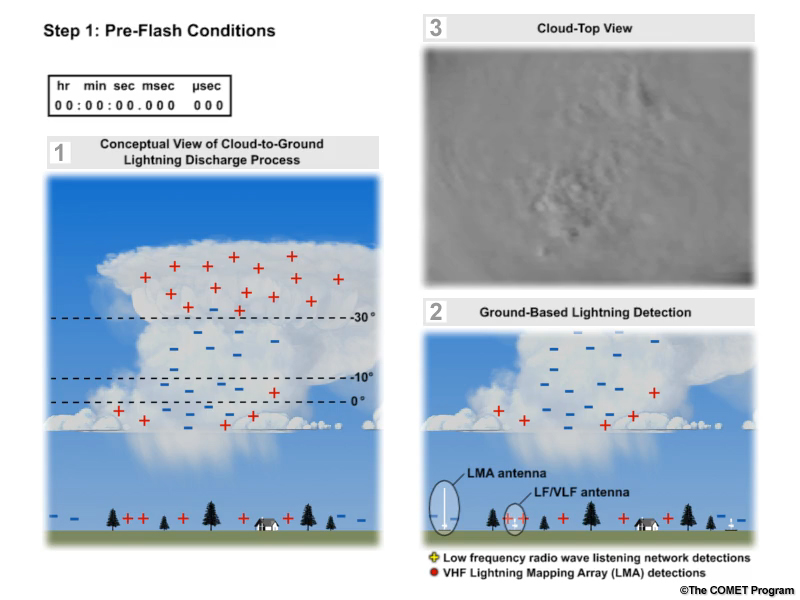
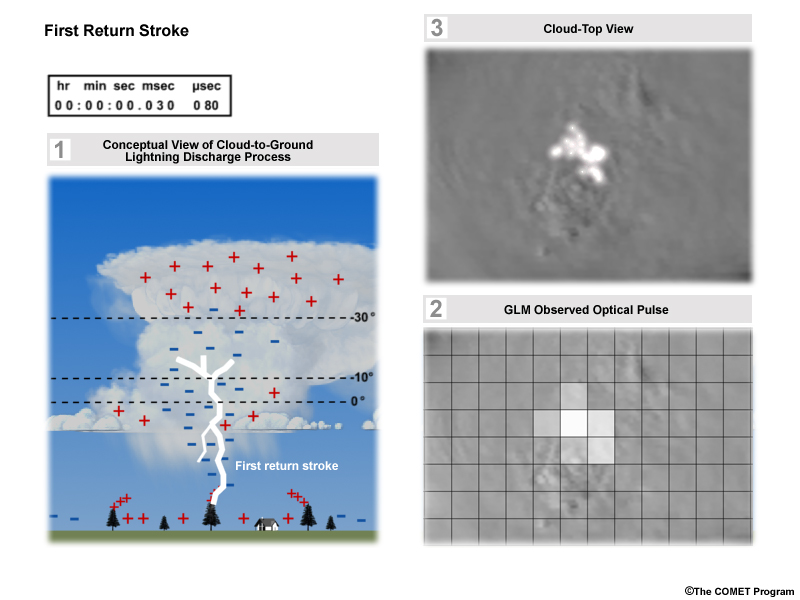
The panel on the left (1) provides a conceptual view of the lightning discharge process within a thunderstorm cloud. The lower right panel (2) shows the structure of the lightning flash as seen by two ground-based radio wave detection systems: very high radio-frequency (VHF) detecting lightning mappers such as the Lightning Mapping Array (LMA), and a more conventional low frequency radio wave detection network that reports the strike's ground location. The upper right panel (3) shows a cloud-top view as seen by someone flying over the storm.
Following the flash overview, we'll examine how the GLM will see the optical pulses generated by the flash, and how the pulses will be grouped into a GLM “flash.” This will form the basis for many of the products available to users.
Before going to the visualization, let's review some basic information about lightning on the next page.
Observing Lightning »
What is Lightning?
Lightning is an electrical discharge between regions of opposite charges within a thunderstorm cloud (called intra-cloud lightning), or between opposite charges in the cloud and on the ground (called cloud-to-ground lightning).
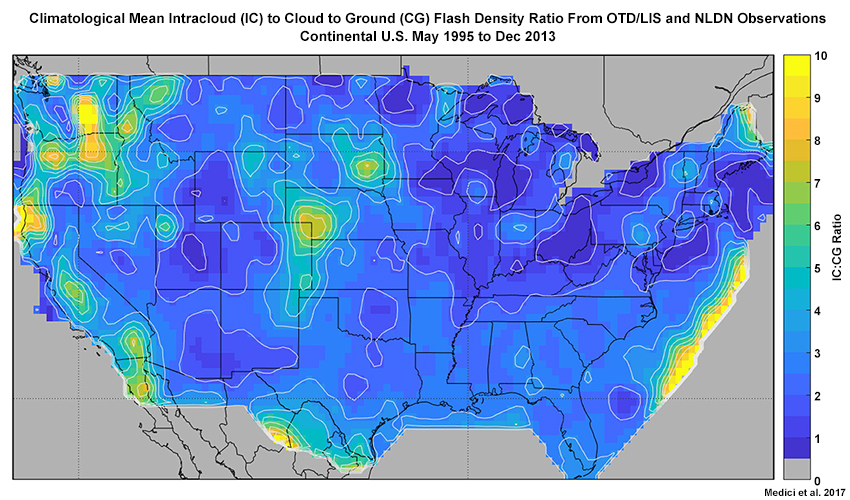
When averaged around the world, nearly three quarters of all lightning flashes are intra-cloud, although that number can be as high as 99% in some storms. Most of the remaining one quarter is made up of cloud-to-ground flashes.
An average cloud-to-ground lightning strike consists of 3 to 4 return strokes, each of which lasts about 60 millionths of one second. The return stroke is the very bright visible flash associated with the rapid discharge of electricity that has accumulated in the cloud.
Cloud-to-ground lightning is either negative or positive depending on the charge that moves from the cloud to the ground. In negative flashes, the cloud’s main charge center is negatively charged and the ground is positively charged. The reverse is true for positive flashes.
Studies have shown that 80 to 90% of all thunderstorms begin with intra-cloud flashes, and that they often precede the first cloud-to-ground strike by 5 to 10 minutes or more. Since the GLM will detect both types of flashes, it will be able to identify when a thunderstorm has actually begun and provide early warnings of potential cloud-to-ground flashes.
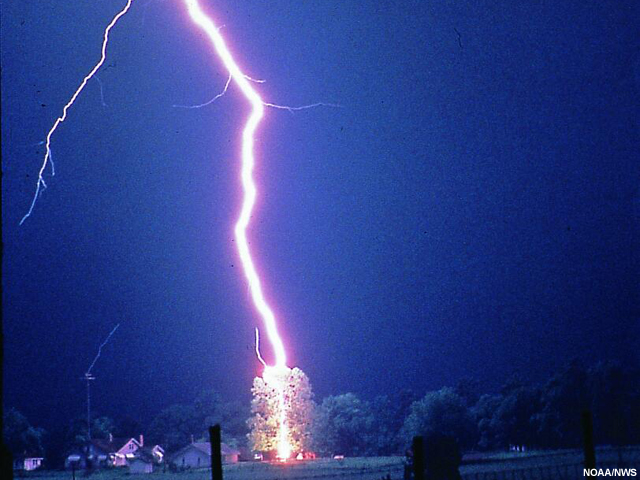
Each cloud-to-ground lightning flash consists of one or more "leaders" followed by one or more "return strokes." The leader is the initial step in the lightning flash. It establishes the conductive channel that the electrical discharge (return stroke) will take.
Once a charged leader makes a connection with the ground, the return stroke occurs. The return stroke is simply the rapid discharge of electricity that has accumulated on the leader. It's this discharge that we see as the bright flash of lightning.
Intra-cloud lightning flashes work essentially the same way except that the stepped leader establishes a conductive channel or path between oppositely charged regions within the cloud, such that no connection is made with the ground.
Observing Lightning »
Lightning Flash Overview
This narrated animation gives an overview of a typical cloud-to-ground lightning flash. Summary highlights of each step are included below.
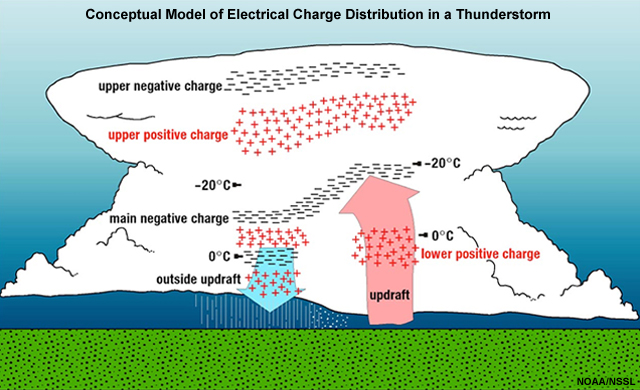
Step 1: Pre-Flash Conditions
- Charges are separated into negative and positive charged regions within the cloud, and the ground below the cloud becomes positively charged.
Step 2: A Stepped Leader Forms
- As charge difference between cloud and ground becomes too large, negative charges move toward the positively charged ground, emerging from the bottom of the cloud as a stepped leader. LMAs can "see" stepped leaders as very high frequency radio signals whereas the optical pulses are not bright enough to be detected by the GLM.
Step 3: Upward Streamers Form
- As negative charges approach ground objects, air above taller objects becomes positively charged and an upward streamer forms. The small optical pulses generated by streamers are too weak to be detected by the GLM, and the LMA misses CG streamers since they fall below the detection network's line of sight.
Step 4: Return Stroke
- A stepped leader makes contact with one of the upward developing upward positive streamers, the lightning channel is completed, and the return stroke begins. The bright optical pulse can be detected by the GLM, strong radio waves are detectable by all forms of ground-based networks, intense heating of the air generates thunder, and nitrogen oxides are formed.
Step 5: Dart Leader
- If sufficient charge buildup remains, another negatively charged leader, called the "dart leader", starts moving toward the ground. Like the stepped leader, the dart leader is not bright enough for the GLM to see. The LMA however sees the dart leader, but the low frequency ground network does not.
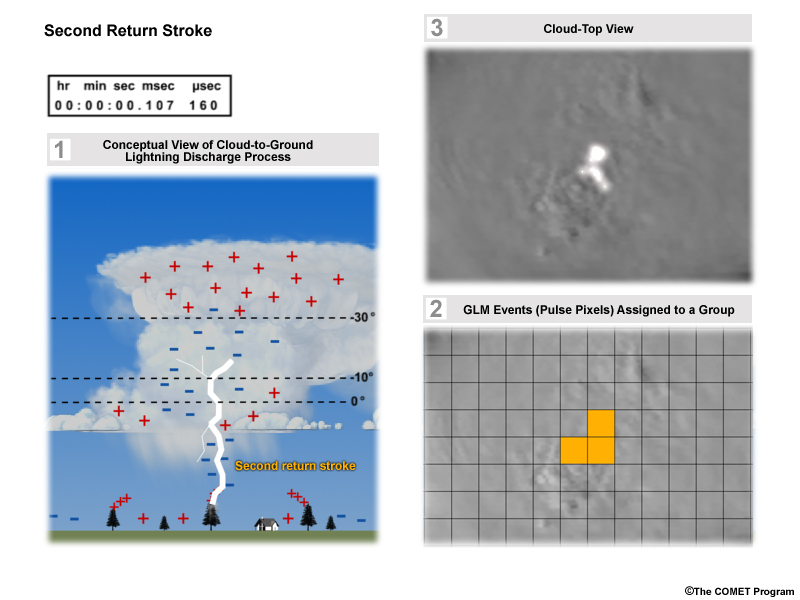
Step 6: Second Return Stroke
- Another return stroke takes place when the dart leader reaches the ground. While subsequent return strokes are dimmer, their optical pulses are bright enough for the GLM to see. As with the first return stroke, all ground-based networks detect the second return stroke.
Step 7: Successive Dart Leaders and Return Strokes
- The cycle of dart leaders and return strokes repeats three to four times on average, as long as sufficient charge buildup remains, which typically lasts about 100 to 200 milliseconds. The GLM's fast two millisecond update rate is well suited to capture optical pulses generated by the more energetic discharges (return strokes) during a flash.
More in-depth discussions of each step can be found in the COMET lesson, GOES-R GLM: Introduction to the Geostationary Lightning Mapper.
Observing Lightning »
Questions
Answer the questions about cloud-to-ground lightning flashes. When you are finished, go to the next section to see how GLM observations will be processed into a form suitable for producing a variety of products.
Question 1 of 3
When averaged around the world, what fraction of lightning is intra-cloud (IC) vs. cloud-to-ground (CG)? (Choose the best answer.)
The correct answer is A.
About three quarters of all lightning flashes are intra-cloud, although that number can be as high as 99% in some storms. Most of the remaining one quarter is composed of cloud-to-ground flashes. Lightning occasionally passes through clear air between charge centers in two separate thunderstorms ("inter-cloud lightning").
Question 2 of 3
How long is the average lighting flash life cycle? (Choose ethe best answer)
The correct answer is C.
The flash life cycle continues as long as sufficient charge buildup remains, which typically lasts about 100 to 200 milliseconds.
Question 3 of 3
The GLM is sensitive to which of the following properties associated with a lightning flash? (Choose the best answer)
The correct answer is B.
The GLM was engineered to be sensitive to optical pulses produced during a flash's return stroke. These optical pulses are generally strong enough at cloud top to be detected by the GLM's sensitive near-infrared optical detector.
Observing Lightning »
Producing GLM Flashes
Observing Lightning » Producing GLM Flashes »
GLM Detection
The GLM will sample a large scene every two milliseconds and classify the detection of each optical pulse in an 8-km grid box (or pixel) as a single event. But pulses often spread out horizontally and lightning flashes typically have multiple return strokes. This has led researchers to establish a set of spatial and temporal criteria for assembling related events and assigning them to a single flash.
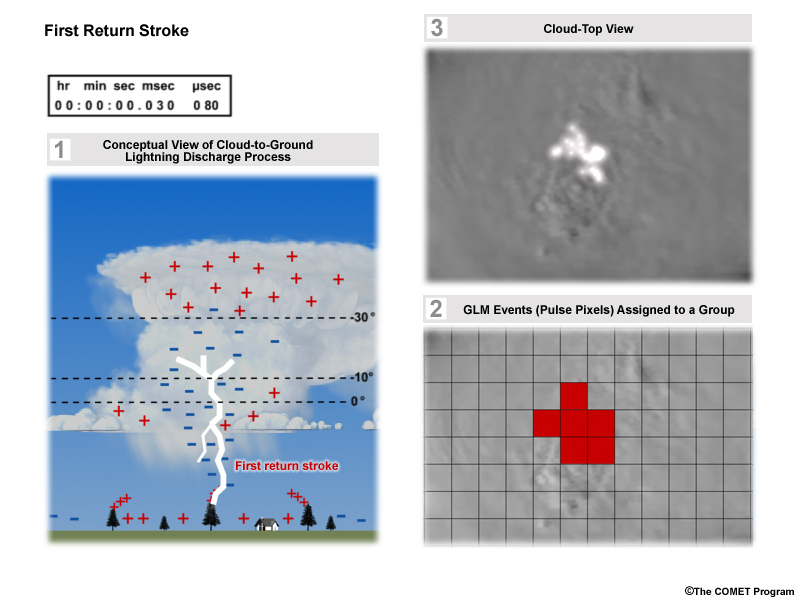
The following image sequence gives a general idea of how individual optical pulses appear for a given flash, and how processing defines them as part of a single lightning flash.
The first step is illustrated in the two image pairs below. Events that occur simultaneously and in adjacent pixels are assigned to a single group (the red pixels for the first group associated with the first return stroke, and the orange pixels for the second group associated with the second return stroke). Lightning flashes with multiple pulses are put into multiple groups. Use the slider to see the images in each group.

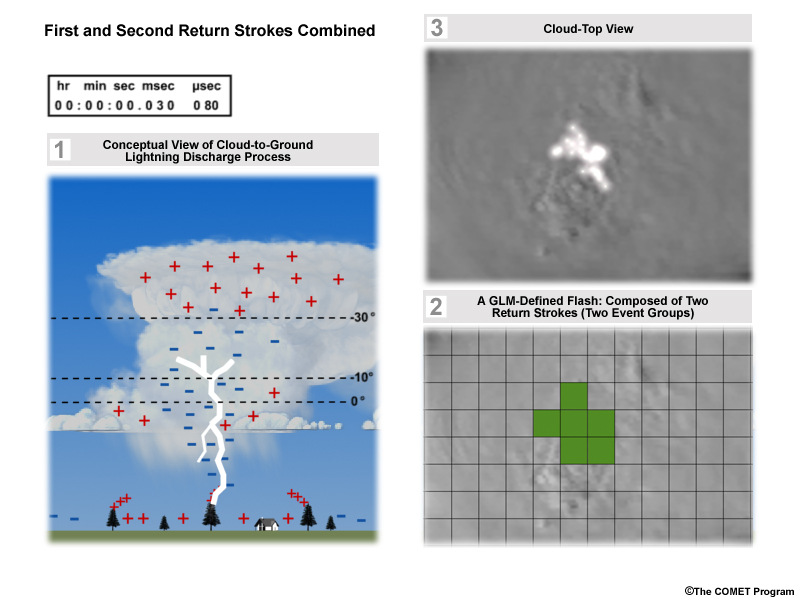
Next, these groups are aggregated into a single GLM flash (the green pixels in the image pair below) if they occur within 330 milliseconds and 16.5 km of each other. Given GLM’s 8- to 14-km spatial resolution, this means that any two groups will belong to a single flash if they are adjacent to or within two pixels of each other.
To summarize, the process that goes from detecting individual optical pulses to defining a flash is as follows:
- The GLM observes individual optical pulses as ‘events’ every two milliseconds
- Events are assembled into ‘groups’ when multiple events occur simultaneously and in adjacent pixels
- Processing organizes ‘groups’ into a GLM flash if they occur within 16.5 km and 330 milliseconds of each other
Once defined, GLM flashes become part of a streaming dataset that updates every 20 seconds.
Observing Lightning » Producing GLM Flashes »
From GLM Flashes to Products
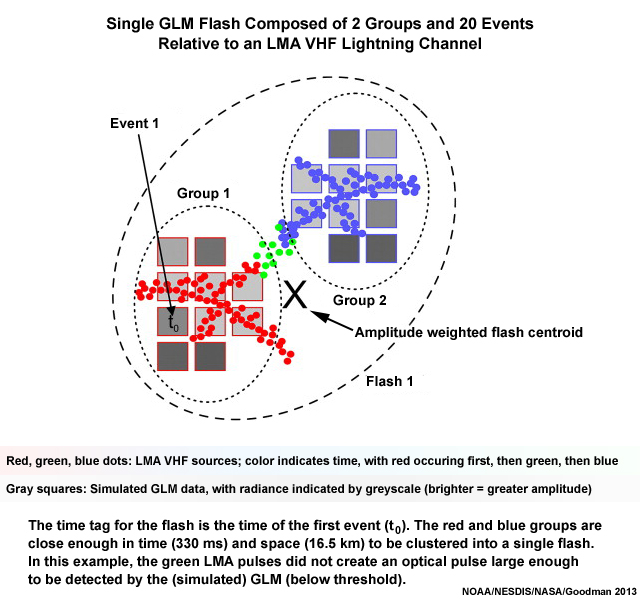
This graphic compares a single simulated GLM flash composed of two groups and twenty events (the gray squares), to pulses detected by an LMA (the colored dots). The dots are individual LMA detections (often called sources) occurring at different times. The red detections occur first, the green next, and the blue last. The brighter squares indicate a more intense optical pulse as detected by the GLM. The “X” shows the location of the resulting GLM flash after spatial and temporal criteria have been applied to the events and groups.
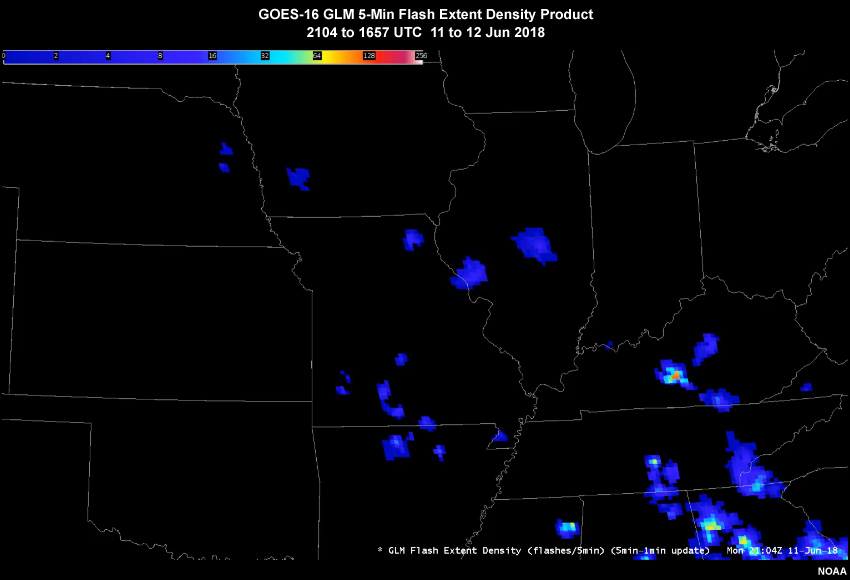
GLM flash detections will be used to create derived products. One that will be of particular interest to forecasters is the Flash Extent Density product. It shows how many GLM flash detections occur in an 8-km grid box.
For AWIPS users, the final display will likely offer some flexibility. The 20-second GLM updates may be too rapid to provide accurate trend information, while a 5-minute period may be too long, resulting in missed changes in activity. Previous work with LMAs used a 2-minute binning period successfully. Again, this will likely be configurable in AWIPS to suite the forecaster's needs.
The product will help identify the most active thunderstorm cores. Trends in the product will highlight storms that are rapidly intensifying and may produce severe weather. In addition, it will show where intra-cloud lightning is occurring, which is often a precursor to potential cloud-to-ground strike activity.
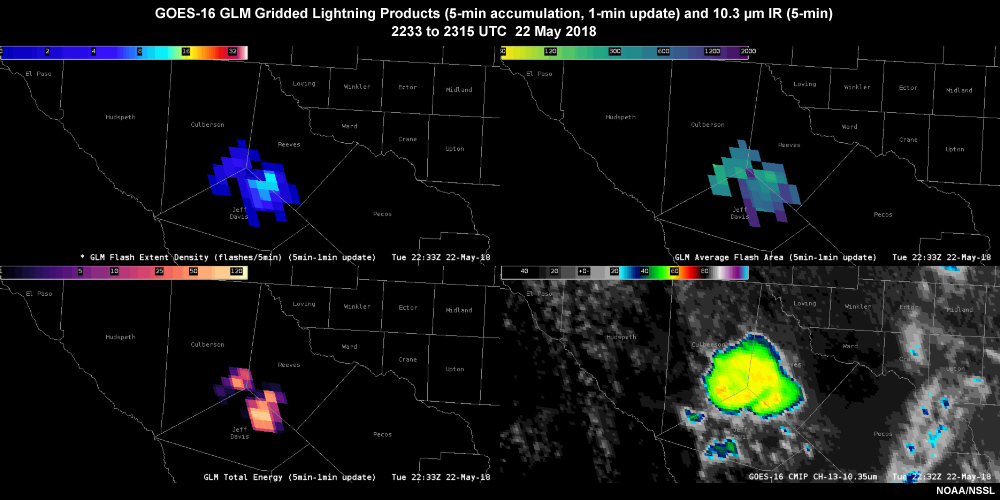
The animation shows three GLM gridded products and GOES-16 10.3 micrometer imagery, used by forecasters to help diagnose the development and decay of convective storms during potentially severe events, and to provide additional input during the warning decision-making process. Top left is Flash Extent Density (FED), top right is Average Flash Area (AFA), bottom left is Total Optical Energy (TOE), and bottom right is GOES-16 IR imagery.
Summary
The GLM offers the following capabilities:
- Continuous 24-hour monitoring of total lightning activity at a hemispheric scale, including most of the Americas and adjacent oceans
- Spatial resolution from 8 km at nadir (directly below the satellite) along the equator to 14 km at the edge of the field of view (near the edge of the coverage domain)
- High refresh rate (2 milliseconds), high detection efficiency (> 70%), and low false alarm rate (~5%)
- 20-second product latency from time of observation to user availability
- Observations of total lightning activity (includes intra-cloud, inter-cloud, and cloud-to-ground lightning flashes), but cannot distinguish between the different flash types
GLM observations will be used to:
- Enhance situational awareness. Combining GLM observations with those from other observing systems, such as radar, ground-based lightning detection, and satellite imagers, will improve our ability to determine which storms are strengthening or weakening.
- Improve local thunderstorm forecasts and warnings of impending lightning strike hazards.
- Improve warning decision confidence for severe weather hazards such as hail, flooding, tornadoes, and strong winds.
- Improve support for aviation safety and efficiency.
- Enhance early warning of potential lightning-induced fires.
- Provide additional decision support for weather-sensitive interests and industries, outdoor events, and recreational activities.
- Improve quantitative precipitation estimates for hydrology, water resources, agriculture, weather forecasting, and climatology.
- Improve tropical cyclone forecasts.
- Provide new observations for atmospheric chemistry and improve air quality forecasts.
- Provide new data for studies of regional climate and climate change.
You have reached the end of the lesson. Please complete the quiz and share your feedback with us via the user survey.
Resources
Internet Resources
- CIRA/RAMMB/VISIT SHyMet: Satellite Foundational Course for GOES-R/16 (SatFC-G), http://rammb.cira.colostate.edu/training/shymet/satfc-g_intro.asp (includes links to all SatFC-G training modules)
- Official GOES-R Program Site, http://www.goes-r.gov/
- GOES-R Training Overview, http://www.goes-r.gov/users/training.html
- GOES-R GLM Instrument Page, http://www.goes-r.gov/spacesegment/glm.html
- GOES-R: Benefits of Next-Generation Environmental Monitoring, http://www.meted.ucar.edu/training_module.php?id=509
- GOES-R ABI: Next Generation Satellite Imaging, http://www.meted.ucar.edu/training_module.php?id=987
- GOES-R Program: Outreach Materials, http://www.goes-r.gov/education/outreach.html
(Updated regularly, the site links to resources illustrating the GOES-R mission, products, and services including fact sheets, bookmarks, posters, brochure, and calendars.) - GOES-R Proving Ground Page, http://www.goes-r.gov/users/proving-ground.html
- GOES-R Documentation Page, http://www.goes-r.gov/resources/docs.html
- GOES-R Scientific Publications, http://www.goes-r.gov/resources/Scipubs/index.html
- GOES and POES Conferences and Meetings, http://www.goes-r.gov/users/conf-mtgs.html
- NASA Marshall Space Flight Center Lightning & Atmospheric Electricity Research at the GHCC Home Page, http://thunder.msfc.nasa.gov/index.html
- NASA Marshall Space Flight Center Lightning & Atmospheric Electricity Research at the GHCC, Dataset Information, http://thunder.msfc.nasa.gov/data/lisbrowse.html
- NASA Marshall Space Flight Center Lightning & Atmospheric Electricity Research at the GHCC, Dataset Descriptions and Ordering Information, http://thunder.msfc.nasa.gov/data/#GRIDDED_DATA
- NASA SPoRT Total Lightning and Pseudo Geostationary Lightning Mapper Products Training Resources, http://weather.msfc.nasa.gov/sport/training/
- NASA SPoRT Pseudo Geostationary Lightning Mapper (PGLM) Products, http://weather.msfc.nasa.gov/sport/goesrpg/pglm.html/
- The New Mexico Tech 3D Lightning Mapping Array, http://lightning.nmt.edu/nmt_lms/
- UW CIMSS Satellite blog and GOES-R, http://cimss.ssec.wisc.edu/goes/blog/archives/category/goes-r
- VISIT: SHyMet for Forecasters: GOES-R 101 Training Session, http://rammb.cira.colostate.edu/training/shymet/forecaster_goesr101.asp
References
GOES-R
- Goodman, S.J., J.J. Gurka, M. DeMaria, T.J. Schmit, A. Mostek, G. Jedlovec, C. Stewart, W. Feltz, J. Gerth, R. Brummer, S. Miller, B. Reed, and R.R. Reynolds, 2012: The GOES-R Proving Ground: Accelerating user readiness for the next-generation geostationary environmental satellite system. Bull. Amer. Meteor. Soc., 93, 1029-1040.
- Goodman, S. J., R. J. Blakeslee, W. J. Koshak, D. Mach, J. C. Bailey, L. D. Carey, D. E. Buechler, C. D. Schultz, M. Bateman, E. McCaul, and G. Stano, 2013: The GOES-R Geostationary Lightning Mapper. Atmos. Res., 125–126, 34-49.
- Goodman, S. J., T. J. Schmit, J. Daniels, W. Denig, and K. Metcalf, 2018: GOES: Past, present, and future. Comprehensive Remote Sensing, 1 , 119 149.
- Schmit, T.J., M.M. Gunshor, W.P. Menzel, J.J. Gurka, J. Li, and S. Bachmeier, 2005: Introducing the next-generation advanced baseline imager on GOES-R. Bull. Amer. Meteor. Soc., 86, 1079-1096.
- Additional GOES-R and GOES Related Scientific Publications and other documentation (available on the GOES-R Program Site):
Publications: http://www.goes-r.gov/resources/Scipubs/index.html, Documentation: http://www.goes-r.gov/resources/docs.html
Satellite and Ground-Based Lightning Detection
- Albrecht, T. I., S. J. Goodman, D. E. Buechler, R. J. Blakeslee, and H. J. Christian, 2016: Where are the lightning hotspots on Earth?. Bull. Amer. Meteor. Soc., 97 (11), 2051-2068.
- Boccippio, D., S. Goodman, and S. Heckman, 2000: Regional differences in tropical lightning distributions. J. Appl. Meteor. (TRMM Special Issue), 39, 2231-2248.
- Boccippio, D. J., K. Driscoll, W. Koshak, R. Blakeslee, W. Boeck, D. Mach, D. Buechler, H. J. Christian, and S. J. Goodman, 2000: The optical Transient Detector (OTD): Instrument characteristics and cross-sensor validation. J. Atmos. Oceanic Technol., 17, 441-458.
- Boeck, W. L., D. M. Suszcynsky, T. E. Light, A. R. Jacobson, H. J. Christian, S. J. Goodman, D. E. Buechler, and J. L. L. Guillen, 2004: A demonstration of the capabilities of multisatellite observations of oceanic lightning. J. Geophys. Res. Atmos., 109, D17204, doi:10.1029/2003JD004491.
- Buechler, D. E., W. J. Koshak, H. J. Christian, and S. J. Goodman, 2012: Assessing the performance of the Lightning Imaging Sensor (LIS) using deep convective clouds. Atmos. Res., 135-136, 397-403.
- Cecil, D. J., D. E. Buechler, and R. J. Blakeslee, 2012: Gridded lightning climatology from TRMM-LIS and OTD: Dataset description. Atmos. Res., 135-136, 404-414.
- Christian, H. J., R. J. Blakeslee, and S. J. Goodman, 1989: The detection of lightning from geostationary orbit. J. Geophys. Res. Atmos., 94 (D11), 13,329-13,337.
- Christian, H. J., R. J. Blakeslee, D. J. Boccippio, W. L. Boeck, D. E. Buechler, K. T. Driscoll, S. J. Goodman, J. M. Hall, W. J. Koshak, D. M. Mach, and M. F. Stewart, 2003: Global frequency and distribution of lightning as observed from space by the Optical Transient Detector. J. Geophys. Res. Atmos., 108 (D1), 4005, doi:10.1029/2002JD002347.
- Cummins, K. L., J. A. Cramer, C. J. Biagi, E. P. Krider, J. Jerauld, M. A. Uman, and V. Rakov, 2006: The U.S. National Lightning Detection Network: Post-upgrade status. Second Conference on Meteorological Applications of Lightning Data,27 Jan to 03 Feb, Atlanta, GA, Amer. Meteor. Soc., 6.1. [Available online at https://ams.confex.com/ams/Annual2006/webprogram/Paper105142.html]
- Davis, S. M., D. M. Suszcynsky, and T. E. L. Light, 2002: FORTE observations of optical emissions from lightning: Optical properties and discrimination capability. J. Geophys. Res., 107 (D21), 4579, doi:10.1029/2002JD002434.
- Goodman, S. J., H. J. Christian, and W. D. Rust, 1988: A comparison of the optical pulse characteristics of intracloud and cloud-to-ground lightning as observed above clouds. J. Appl. Meteor., 27, 1369-1381.
- Goodman, S. J., R. Blakeslee, H. Christian, W. Koshak, J. Bailey, J. Hall, E. McCaul, D. Buechler, C. Darden, J. Burks, T. Bradshaw, and P. Gatlin, 2005: The North Alabama Lightning Mapping Array: Recent severe storm observations and future prospects. Atmos. Res., 76, 423-437.
- Goodman, S. J., R. J. Blakeslee, W. J. Koshak, D. Mach, J. C. Bailey, L. D. Carey, D. E. Buechler, C. D. Schultz, M. Bateman, E. McCaul, and G. Stano, 2013: The GOES-R Geostationary Lightning Mapper. Atmos. Res., 125–126, 34-49.
- Hembury, N. and R. Holle, 2011: Flash of inspiration: Latest innovations in worldwide lightning detection. Meteorological Technology International, May 2011, 48-50, http://viewer.zmags.com/publication/852ec8f8#/852ec8f8/1.
- Mach, D., H. Christian, R. Blakeslee, D. Boccippio, S. Goodman, and W. Boeck, 2007: Performance assessment of the Optical Transient Detector and Lightning Imaging Sensor. Part II: Clustering algorithm. J. Geophys. Res., 112, D09210, doi:10.1029/2006JD007787.
- Murphy, M. J., N. W. S. Demetriades, R. L. Holle, and K. L. Cummins, 2006: Overview of capabilities of the U.S. National Lightning Detection Network. Use of Lightning Data in Aviation Operations, Joint with Second Conference on Meteorological Applications of Lightning Data,27 Jan to 03 Feb, Atlanta, GA, Amer. Meteor. Soc., J2.5. [Available online at https://ams.confex.com/ams/Annual2006/webprogram/Paper103980.html]
- Orville, R. and G. R Huffines, 2001: Cloud-to-ground lightning in the United States: NLDN results in the first decade, 1989–98. Geophys. Res. Lett., 129, 1179-1193.
- Petersen, D. A and W. H. Beasley, 2013: High-speed video observations of a natural negative stepped leader and subsequent dart-stepped leader. J. Geophys. Res. Atmos., 118, 12,110–12,119, doi:10.1002/2013JD019910.
- Petersen, M., W. Deierling, C. Liu, D. Mach, and C. Kalb, 2017: The properties of optical lightning flashes and the clouds they illuminate. J. Geophys. Res., 122 (1), 423-442, doi:10.1002/2016JD025312.
- Rolando, S., V. Goiffon, P. Magnan, F. Corbière, R. Molina, M. Tulet, M. Bréart-de-Boisanger, O. Saint-Pé, S. Guiry, F. Larnaudie, B. Leone, L. Perez-Cuevas, and I. Zayer, 2013: Smart CMOS image sensor for lightning detection and imaging. Appl. Opt., 52, C16-C23.
- Rudlosky, S. D. and D. T. Shea, 2013: Evaluating WWLLN performance relative to TRMM/LIS. Geophys. Res. Lett., 40, 1–5, doi:10.1002/grl.50428.
- Rudlosky, S. D., S. J. Goodman, K. S. Virts, and E. C. Bruning, 2019: Initial Geostationary Lightning Mapper observations. Geophys. Res. Lett., 46 (2), 1097-1104.
- Schultz, C. J., G. T. Stano, P. J. Meyer, B. C. Carcione, and T. Barron, 2017: Lightning decision support using VHF total lightning mapping and NLDN cloud-to-ground data in North Alabama. J. Oper. Meteor., 5 (11), 134-145.
- Stano, G. T., 2012: Preparing for GOES-R: The Pseudo Geostationary Lightning Mapper. 37th Natl. Wea. Assoc. Annual Meeting, 6-11 Oct., Madison, WI, Natl. Wea. Assoc., P1.21. [Available online at http://www.nwas.org/meetings/nwa2012/agenda/]
- Thomas, R., P. Krehbiel, W. Rison, T. Hamlin, D. Boccippio, S. Goodman, and H. Christian, 2000: Comparison of ground-based 3-dimensional lightning mapping observations with satellite-based LIS observations in Oklahoma. Geophys. Res. Lett., 27, 1703-1706.
- Thomas, R., P. R. Krehbiel, W. Rison, S. J. Hunyady, W. P. Winn, T. Hamlin, and J. Harlin, 2004: Accuracy of the Lightning Mapping Array. J. Geophys. Res., 109, D14207, doi:10.1029/2004JD004549.
Cloud Electrification, Thunderstorms, and Severe Weather
- Ashley, W. S. and C. W. Gilson, 2009: A reassessment of U.S. lightning mortality. Bull. Amer. Meteor. Soc., 90, 1501-1518.
- Bruning, E. C., W. D. Rust, T. J. Schuur, D. R. MacGorman, P. R. Krehbiel, and W. Rison, 2007: Electrical and polarimetric radar observations of a multicell storm in TELEX. Mon. Wea. Rev., 135 (7), 2525–2544.
- Bruning, E. C., W. D. Rust, D. R. MacGorman, M. I. Biggerstaff, and T. J. Schuur, 2010: Formation of charge structures in a supercell. Mon. Wea. Rev., 138 (10), 3740–3761.
- Carcione, B. C., K. D. White, and G. T. Stano, 2009: An analysis of total lightning over North Alabama during the 2 March 2012 tornado event. 26th Conference on Severe Local Storms, 5 - 8 Nov., Nashville, TN, Amer. Meteor. Soc., P3.49. [Available online at https://ams.confex.com/ams/26SLS/webprogram/Paper212031.html]
- Cintineo, J. L., M. J. Pavolonis, J. M. Sieglaff, D. T. Lindsey, L. Cronce, J. Gerth, B. Rodenkirch, J. Brunner, and C. Gravelle, 2018: The NOAA/CIMSS ProbSevere model: Incorporation of total lightning and validation. Wea. Forecasting, 33 (1), 331-345.
- Correoso, J. F., E. Hernández, R. García-Herrera, D. Barriopedro, and D. Paredes, 2006: A 3-year study of cloud-to-ground lightning flash characteristics of mesoscale convective systems over the Western Mediterranean Sea. Atmos. Res., 79, 89-107.
- Darden, C. B., D. J. Nadler, B. C. Carcione, R. J. Blakeslee, G. T. Stano, and D. E. Buechler, 2010: Utilizing total lightning information to diagnose convective trends. Bull. Amer. Meteor. Soc., 91, 167-175.
- Emersic, C., P. L. Heinselman, D. R. MacGorman, and E. C. Bruning, 2011: Lightning activity in a hail-producing storm observed with phased-array radar. Mon. Wea. Rev., 139 (6), 1809–1825.
- Gatlin, P. N. and S. J. Goodman, 2010: A total lightning trending algorithm to identify severe thunderstorms. J. Atmos. Oceanic Technol., 27, 3-22.
- Hager, W. W., B. C. Aslan, R. G. Sonnenfeld, T. D. Crum, J. D. Battles, M. T. Holborn, and R. Ron, 2010: Three-dimensional charge structure of a mountain thunderstorm. J. Geophys. Res., 115, D12119, doi:10.1029/2009JD013241.
- Harris, R. J., J. R. Mecikalski, W. M. MacKenzie Jr., P. A. Durkee, and K. E. Nielsen, 2010: The definition of GOES infrared lightning initiation interest fields. J. Appl. Meteor. Climatol., 49, 2527-2543.
- MacGorman, D. R., I. R. Apostolakopoulos, N. R. Lund, N. W. S. Demetriades, M. J. Murphy, and P. R. Krehbiel, 2011: The timing of cloud-to-ground lightning relative to total lightning activity. Mon. Wea. Rev., 139, 3871–3886.
- Mansell, E. R., C. L. Ziegler, and E. C. Bruning, 2010: Simulated electrification of a small thunderstorm with two-moment bulk microphysics. J. Atmos. Sci., 67 (1), 171–194.
- Mecikalski, J. R., X. Li, and L. D. Carey, 2013: Regional comparison of GOES cloud-top properties and radar characteristics in advance of first-flash lightning initiation. Mon. Wea. Rev., 141, 55-74.
- Medici, G., K. L. Cummins, D. J. Cecil, W. J. Koshak, and S. D. Rudlosky, 2017: The intracloud lightning fraction in the contiguous United States. Mon. Wea. Rev., 145 (11), 4481-4499.
- Molinie, G. and A. R. Jacobson, 2004: Cloud-to-ground lightning and cloud top brightness temperature over the contiguous United States. J. Geophys. Res., 109, D13106, doi:10.1029/2003JD003593.
- Nadler, D. J., C. B. Darden, G. T. Stano, and D. E. Buechler, 2009: An oeprational perspective of total lightning information. Fourth Conference on the Meteorological Applications of Lightning Data, 11-15 Jan., Phoenix, AZ, Amer. Meteor. Soc., P1.11. [Available online at https://ams.confex.com/ams/89annual/webprogram/Paper144210.html]
- Rust, W. D., D. R. MacGorman, E. C. Bruning, S. A. Weiss, P. R. Krehbiel, R. J. Thomas, W. Rison, T. Hamlin, and J. Harlin, 2005: Inverted-polarity electrical structures in thunderstorms in the Severe Thunderstorm Electrification and Precipitation Study (STEPS). Atmos. Res., 76, 247–271.
- Schultz, C. J., W. A. Petersen, and L. D. Carey, 2009: Preliminary development and evaluation of lightning jump algorithms for the real-time detection of severe weather. J. Appl. Meteor. Climatol., 48, 2543-2563.
- Schultz, C. J., W. A. Petersen, and L. D. Carey, 2011: Lightning and severe weather: A comparison between total and cloud-to-ground lightning trends. Wea. Forecasting, 26, 744-755.
- Schultz, C. J., L. D. Carey, E. V. Schultz, and R. J. Blakeslee, 2015: Insight into the kinematic and microphysical processes that control lightning jumps. Wea. Forecasting, 30, 1591-1621.
- Schultz, C. J., L. D. Carey, E. V. Schultz, and R. J. Blakeslee, 2017: Kinematic and microphysical significance of lightning jumps versus nonjump increases in total flash rate. Wea. Forecasting, 32 (1), 275-288.
- Schultz, C. J., G. T. Stano, P. J. Meyer, B. C. Carcione, and T. Barron, 2017: Lightning decision support using VHF total lightning mapping and NLDN cloud-to-ground data in North Alabama. J. Oper. Meteor., 5 (11), 134-145.
- Schultz, E. V., C. J. Schultz, L. D. Carey, D. J. Cecil, and M. Bateman, 2016: Automated storm tracking and the lightning jump algorithm using GOES-R Geostationary Lightning Mapper (GLM) proxy data. J. Oper. Meteor., 4 (7), 92-107.
- Stano, G. T., H. E. Fuelberg, and W. P. Roeder, 2010: Developing empirical lightning cessation forecast guidance for the Cape Canaveral Air Force Station and Kennedy Space Center. J. Geophys. Res., 115, D09205, doi:10.1029/2009JD013034.
- Stano, G. T., K. M. Kuhlman, C. W. Siewert, and B. Carcione, 2012: Evaluation of NASA SPoRT’s Pseudo-Geostationary Lightning Mapper products in the 2011 Spring Program. Eighth Annual Symposium on Future Operational Environmental Satellite Systems, 92nd AMS Annual Meeting, 22-26 Jan., New Orleans, LA, Amer. Meteor. Soc., 501. [Available online at https://ams.confex.com/ams/92Annual/webprogram/Paper203352.html]
- Stano, G. T., C. J. Schultz, L. D. Carey, D. R. MacGorman, and K. M. Calhoun, 2014: Total lightning observations and tools for the 20 May 2013 Moore, Oklahoma, tornadic supercell. J. Oper. Meteorol., 2, 71-88.
- Stolzenburg, M., T. C. Marshall, S. Karunarathne, N. Karunarathna, and R. Orville, 2014: Branched dart leaders preceding lightning return strokes. J. Geophys. Res. Atmos., 119, 4228-4252, doi:10.1002/2013JD021254.
- Thottappillil, R., V. A. Rakov, and M. A. Uman, 1990: K and M changes in close lightning ground flashes in Florida. J. Geophys. Res., 95, 18,631–18,640.
- Takahashi, T., 1978: Riming electrification as a charge generation mechanism in thunderstorms. J. Atmos. Sci., 35, 1536-1548.
- Villanueva, Y., V. A. Rakov, and M. A. Uman, 1994: Microsecond-scale electric field pulses in cloud lightning discharges. J. Geophys. Res., 99, 14,353-14,360
- Weiss, S. A., W. D. Rust, D. R. MacGorman, E. C. Bruning, and P. R. Krehbiel, 2008: Evolving complex electrical structure of the STEPS 25 June 2000 multicell storm. Mon. Wea. Rev., 136 (2), 741–756
- Williams, E., B. Boldi, A. Matlin, M. Weber, S. Hodanish, D. Sharp, S. Goodman, R. Raghavan, and D. Buechler. 1999: The behavior of total lightning activity in severe Florida thunderstorms. Atmos. Res., 51, 245-265.
Lightning and Atmospheric Chemistry
- Kaynak, B., Y. Hu, R. V. Martin, A. G. Russell, Y. Choi, and Y. Wang, 2008: The effect of lightning NOx production on surface ozone in the continental United States. Atmos. Chem. Phys., 8, 5151-5159. [Available online at http://www.atmos-chem-phys.net/8/5151/2008/acp-8-5151-2008.html]
Lightning and Aviation
- Murphy, M. J., N. W. S. Demetriades, R. L. Holle, and K. L. Cummins, 2006: Overview of capabilities of the U.S. National Lightning Detection Network. Use of Lightning Data in Aviation Operations, Joint with Second Conference on Meteorological Applications of Lightning Data,27 Jan to 03 Feb, Atlanta, GA, Amer. Meteor. Soc., J2.5. [Available online at https://ams.confex.com/ams/Annual2006/webprogram/Paper103980.html]
- Rogers, R., L. Carey, K. Bedka, W. Feltz, M. Bateman, and G. Stano, 2014: Total Lightning as an indication of convectively induced turbulence potential in and around thunderstorms. Fourth Aviation, Range, and Aerospace Meteorology Special Symposium, 2-6 Feb., Atlanta, GA, Amer. Meteor. Soc. [Available online at https://ams.confex.com/ams/94Annual/webprogram/Paper232956.html]
- Terborg, A. and G. Stano, 2017: Impacts to Aviation Weather Center operations using total lightning observations from the Pseudo-GLM. J. Oper. Meteor., 5 (1), 1-13.
- Weber, M., J. Evans, M. Wolfson, R. DeLaura, B. Moser, B. Martin, J. Welch, and J. Andrews, 2006: Improving Air Traffic Management During Thunderstorms. 12th Conference on Aviation Range and Aerospace Meteorology, 27 Jan to 03 Feb., Atlanta, GA, Amer. Meteor. Soc. [Available online at http://ams.confex.com/ams/Annual2006/webprogram/Paper103774.html]
Lightning and Climate
- Albrecht, T. I., S. J. Goodman, D. E. Buechler, R. J. Blakeslee, and H. J. Christian, 2016: Where are the lightning hotspots on Earth?. Bull. Amer. Meteor. Soc., 97 (11), 2051-2068.
- Albrecht, R. I., S. J. Goodman, W. A. Petersen, D. E. Buechler, E. C. Bruning, R. J. Blakeslee, and H. J. Christian, 2011: The 13 years of TRMM Lightning Imaging Sensor: From individual flash characteristics to decadal tendencies. XIV International Conference on Atmospheric Electricity, August 08-12, 2011, Rio de Janeiro, Brazil.
- Albrecht, R. I., S. Goodman, D. Buechler, R. Blakeslee, and H. Christian. 2016. LIS 0.1 Degree Very High Resolution Gridded Lightning Full Climatology (VHRFC). Dataset available online from the NASA Global Hydrology Resource Center DAAC, Huntsville, Alabama, U.S.A., https://ghrc.nsstc.nasa.gov/pub/lis/climatology/LIS/VHRFC/.
- Chronis, T. G., S. J. Goodman, D. Cecil, D. Buechler, F. J. Robertson, J. Pittman, and R. J. Blakeslee, 2008: Global lightning activity from the ENSO perspective. Geophys. Res. Lett., 35, L19804, doi:10.1029/2008GL034321.
- Tao, W-K., E. A. Smith, R. F. Adler, A. Y. Hou, R. Meneghini, J. Simpson, Z. S. Haddad, T. Iguchi, S. Satoh, R. Kakar, T. N. Krishnamurti, C. D. Kummerow, S. Lang, K. Nakamura, T. Nakazawa, K. Okamoto, S. Shige, W. S. Olson, Y. Takayabu, G. J. Tripoli, and S. Yang, 2006: Retrieval of latent heating from TRMM measurements. Bull. Amer. Meteor. Soc., 87, 1555-1572.
Lightning and Numerical Weather Prediction
- Allen, B. J., E. R. Mansell, D. C. Dowell, and W. Deierling, 2016: Assimilation of pseudo-GLM data using the ensemble Kalman filter. Mon. Wea. Rev., 144 (9), 3465-3486.
- Dixon K., C. F. Mass, G. J. Hakim, and R. H. Holzworth, 2016: The impact of lightning data assimilation on deterministic and ensemble forecasts of convective events. J. Atmos. Oceanic Technol., 33 (9), 1801-1823.
- Fierro, A. O., E. R. Mansell, C. L. Ziegler, and D. R. MacGorman, 2012: Application of a lightning data assimilation technique in the WRF-ARW model at cloud-resolving scales for the tornado outbreak of 24 May 2011. Mon. Wea. Rev., 140, 2609–2627.
- McCaul Jr., E. W., S. J. Goodman, K. M. LaCasse, and D. J. Cecil, 2009: Forecasting lightning threat using cloud-resolving model simulations. Wea. Forecasting, 24, 709–729.
- Tao, W-K., E. A. Smith, R. F. Adler, A. Y. Hou, R. Meneghini, J. Simpson, Z. S. Haddad, T. Iguchi, S. Satoh, R. Kakar, T. N. Krishnamurti, C. D. Kummerow, S. Lang, K. Nakamura, T. Nakazawa, K. Okamoto, S. Shige, W. S. Olson, Y. Takayabu, G. J. Tripoli, and S. Yang, 2006: Retrieval of latent heating from TRMM measurements. Bull. Amer. Meteor. Soc., 87, 1555-1572.
Lightning and Precipitation
- Cecil, D. J., Steven J. Goodman, Dennis J. Boccippio, Edward J. Zipser and Stephen W. Nesbitt, 2005: Three years of TRMM precipitation features. Part I: Radar, radiometric, and lightning characteristics. Mon. Wea. Rev., 133, 543–566.
- Hagen, M. and S. E. Yuter, 2003: Relations between radar reflectivity, liquid-water content, and rainfall rate during the MAP SOP. Q. J. R. Meteorolog. Soc., 129, 477-493.
- Maddox, R. A., J. Zhang, J. J. Gourley, and K. W. Howard, 2002: Weather radar coverage over the contiguous United States. Wea. Forecasting, 17, 927-934.
- Minjarez-Sosa, C. M., C. L. Castro, K. L. Cummins, E. P. Krider, and J. Waissmann, 2012: Toward development of improved QPE in complex terrain using cloud-to-ground lightning data: A case study for the 2005 monsoon in Southern Arizona. J. Hydrometeor., 13, 1855-1873.
- Stout, G. E. and E. A. Mueller, 1968: Survey of relationships between rainfall rate and radar reflectivity in the measurement of precipitation. J. Appl. Meteor., 7, 465-474.
- Xu, W., R. F. Adler, and N. Y. Wang, 2013: Improving geostationary satellite rainfall estimates using lightning observations: Underlying lightning–rainfall–cloud relationships. J. Appl. Meteor. Climatol., 52, 213-229.
- Xu, W., R. F. Adler, and N. Y. Wang, 2014: Combining satellite infrared and lightning information to estimate warm-season convective and stratiform rainfall. J. Appl. Meteor. Climatol., 53, 180-199.
Lightning and Tropical Cyclones
- DeMaria, M., R. T. DeMaria, J. A. Knaff, and D. Molenar, 2012: Tropical cyclone lightning and rapid intensity change. Mon. Wea. Rev., 140, 1828-1842.
- Fierro, A. O. and E. R. Mansell, 2017: Electrification and lightning in idealized simulations of a hurricane-like vortex subject to wind shear and sea surface temperature cooling. J. Atmos. Sci., 74 (6), 2023-2041.
- Fierro, A. O., S. N. Stevenson, and R. M. Rabin, 2018: Evolution of GLM-Observed total lightning in Hurricane Maria (2017) during the period of maximum intensity. Mon. Wea. Rev., 146 (6), 1641-1666.
- Wang., Y., 2009: How do outer spiral rainbands affect tropical cyclone structure and intensity?. J. Atmos. Sci., 66, 1250-1273.
- Xu, w., S. A. Rutledge, and W. Zhang, 2017: Relationships between total lightning, deep convection, and tropical cyclone intensity change. J. Geophys. Res. Atmos., 122 (13), 7047-7063.
Contributors
COMET Sponsors
MetEd and the COMET® Program are a part of the University Corporation for Atmospheric Research's (UCAR's) Community Programs (UCP) and are sponsored by
- NOAA's National Weather Service (NWS)
with additional funding by: - Bureau of Meteorology of Australia (BoM)
- Bureau of Reclamation, United States Department of the Interior
- European Organisation for the Exploitation of Meteorological Satellites (EUMETSAT)
- Meteorological Service of Canada (MSC)
- NOAA's National Environmental Satellite, Data and Information Service (NESDIS)
- NOAA's National Geodetic Survey (NGS)
- National Science Foundation (NSF)
- Naval Meteorology and Oceanography Command (NMOC)
- U.S. Army Corps of Engineers (USACE)
To learn more about us, please visit the COMET website.
Project Contributors
Program Managers
- Wendy Abshire – UCAR/COMET
- Bruce Muller – UCAR/COMET
Project Lead and Meteorologist
- Patrick Dills – UCAR/COMET
Instructional Design
- Bruce Muller – UCAR/COMET
Science Advisors and Contributors
- Dr. Steven J. Goodman – NOAA/NESDIS/GSFC
- Dr. Geoffrey Stano – ENSCO, Inc.
- Dr. Scott Rudlosky - NOAA/NESDIS/STAR
- James J. Gurka – NOAA/NESDIS Center for Satellite Applications and Research (STAR)
Graphics, Animations
- Steve Deyo – UCAR/COMET
Multimedia Authoring, Interface Design
- Gary Pacheco – UCAR/COMET
Audio, Video Editing, Production
- Steve Deyo – UCAR/COMET
Audio Narration
- Amanda Leitz – UCAR/COMET
- Auliya McCauley-Hartner – UCAR/COMET
Data Provided By
- NASA/SPoRT
- NOAA/NESDIS
- NOAA/NESDIS/STAR
- NOAA/NWS
COMET Staff, March 2019
Director's Office
- Dr. Elizabeth Mulvihill Page, Director
- Tim Alberta, Assistant Director Operations and IT
- Paul Kucera, Assistant Director International Programs
Business Administration
- Lorrie Alberta, Administrator
- Auliya McCauley-Hartner, Administrative Assistant
- Tara Torres, Program Coordinator
IT Services
- Bob Bubon, Systems Administrator
- Joshua Hepp, Student Assistant
- Joey Rener, Software Engineer
- Malte Winkler, Software Engineer
Instructional Services
- Dr. Alan Bol, Scientist/Instructional Designer
- Tony Mancus, Instructional Designer
- Sarah Ross-Lazarov, Instructional Designer
- Tsvetomir Ross-Lazarov, Instructional Designer
International Programs
- David Russi, Translations Coordinator
- Martin Steinson, Project Manager
Production and Media Services
- Steve Deyo, Graphic and 3D Designer
- Dolores Kiessling, Software Engineer
- Gary Pacheco, Web Designer and Developer
Science Group
- Dr. William Bua, Meteorologist
- Patrick Dills, Meteorologist
- Bryan Guarente, Meteorologist
- Matthew Kelsch, Hydrometeorologist
- Andrea Smith, Meteorologist
- Amy Stevermer, Meteorologist
- Vanessa Vincente, Meteorologist