Media Gallery
Media elements used in this module are protected by a variety of copyright licenses. Please use the "copyright terms" link associated with each item below for more information.
Description:
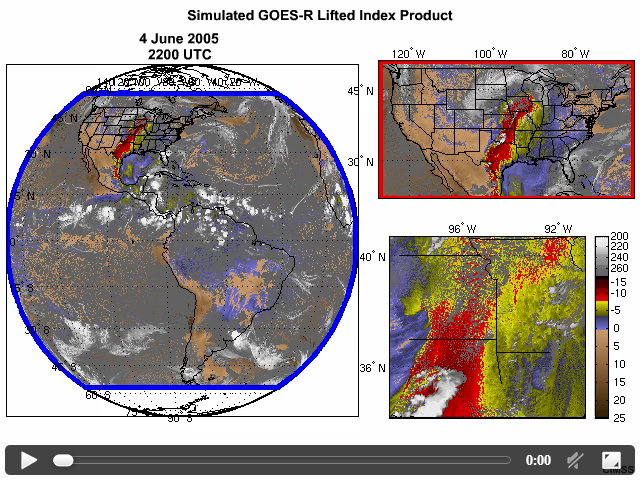
Simulated GOES-R lifted index derived product imagery comparing full disk, Conus, and mesoscale sector coverages and update rates for a two period on June 4, 2005.
File Name:
abi_lidpi_flexmode3_scanning.mp4
Credits:
CIMSS
Copyright Terms:
COMET Standard Terms of Use
Description:
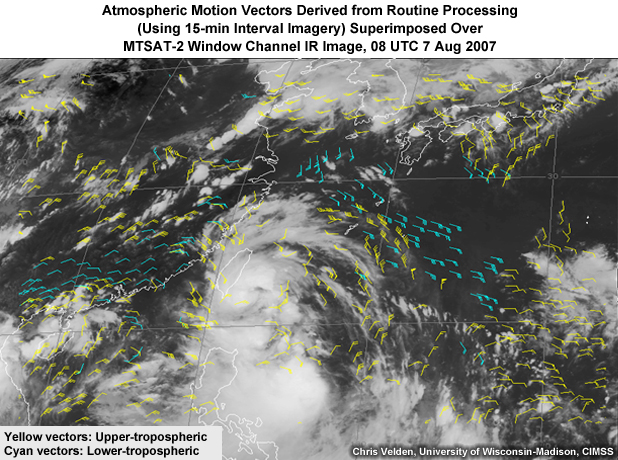
Atmospheric Motion Vectors Derived from Routine Processing (Using 15-min Interval Imagery) Superimposed Over MTSAT-2 Window Channel IR Image, 08 UTC Aug 7, 2007
File Name:
amv_over_mtsat_ir_7aug2007_15min.jpg
Credits:
Chris Velden, University of Wisconsin-Madison, CIMSS
Copyright Terms:
COMET Standard Terms of Use
Description:
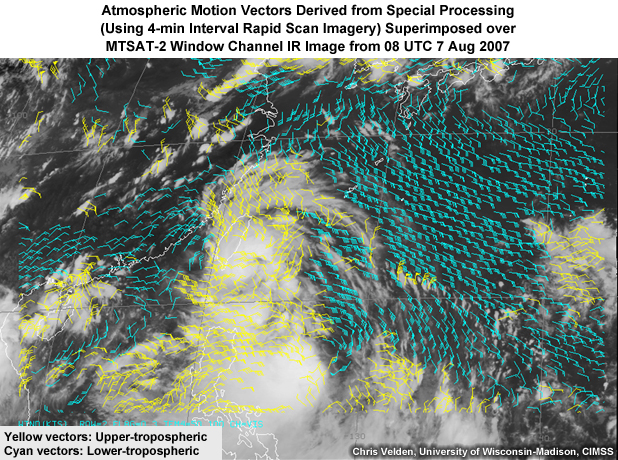
Atmospheric Motion Vectors Derived from Special Processing (Using 4-min Interval Rapid Scan Imagery) Superimposed over MTSAT-2 Window Channel IR Image from 08 UTC August 7, 2007
File Name:
amv_over_mtsat_ir_7aug2007_4min.jpg
Credits:
Chris Velden, University of Wisconsin-Madison, CIMSS
Copyright Terms:
COMET Standard Terms of Use
Description:
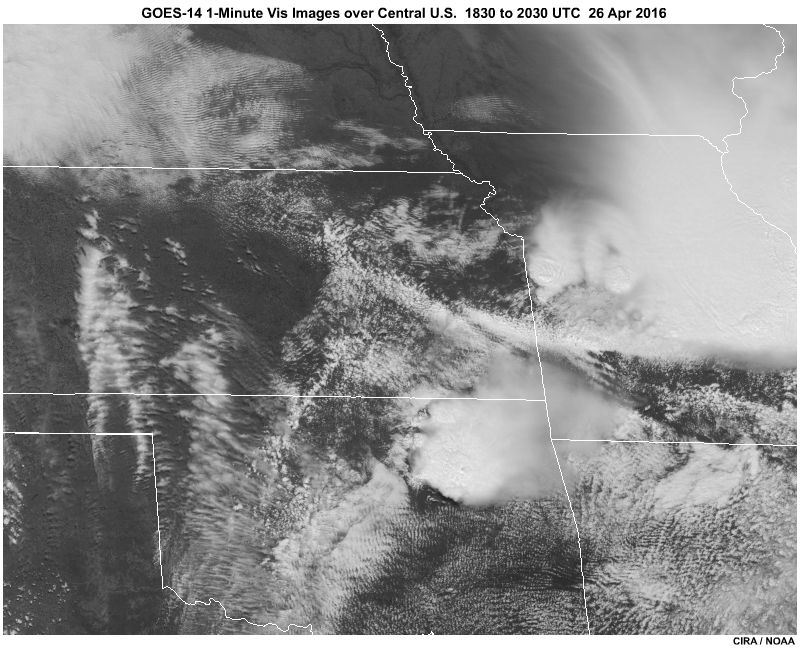
GOES-14 SRSOR (Super Rapid Scan Operations for GOES-R) 1-minute interval visible imagery showing a variety of mesoscale features as severe weather breaks out across the Plains states on April 26, 2016.
File Name:
g14_1min_vis_26apr16.mp4
Credits:
CIRA / NOAA
Copyright Terms:
COMET Standard Terms of Use
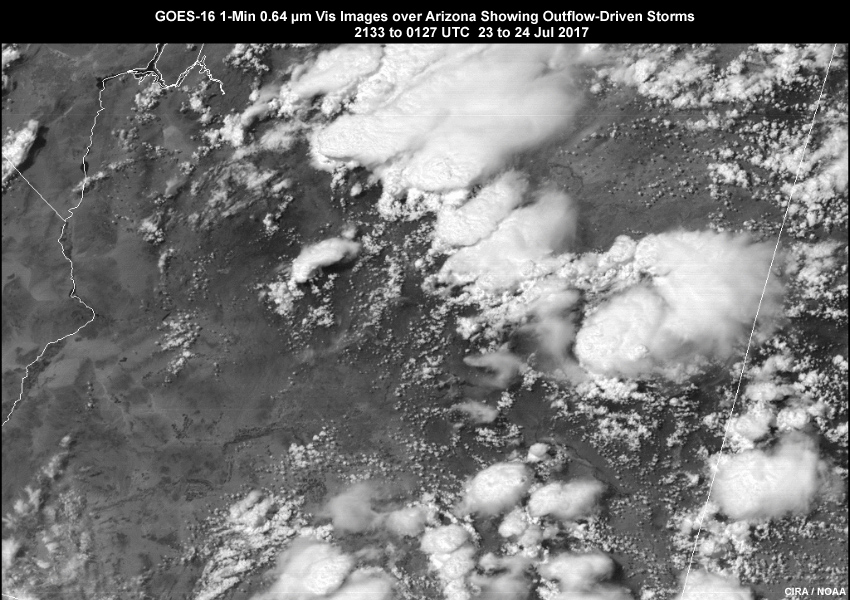
Description:
GOES-16 ABI 1-minute 0.64 micrometer visible (band 2) imagery showing outflow-driven convection and storms over Arizona on July 23, 2017
File Name:
g16_1min_vis_23jul17_ani.mp4
Credits:
CIRA / NOAA
Copyright Terms:
COMET Standard Terms of Use
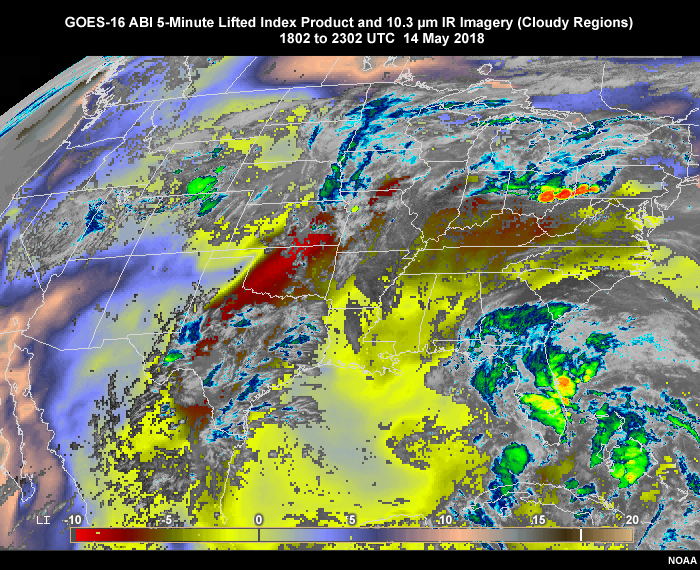
Description:
GOES-16 ABI lifted index derived product imagery blended with 10.3 micrometer IR imagery showing CONUS coverage and 5-minute updates on May 14, 2018
File Name:
g16_abi_irli_ani.mp4
Credits:
NOAA
Copyright Terms:
COMET Standard Terms of Use
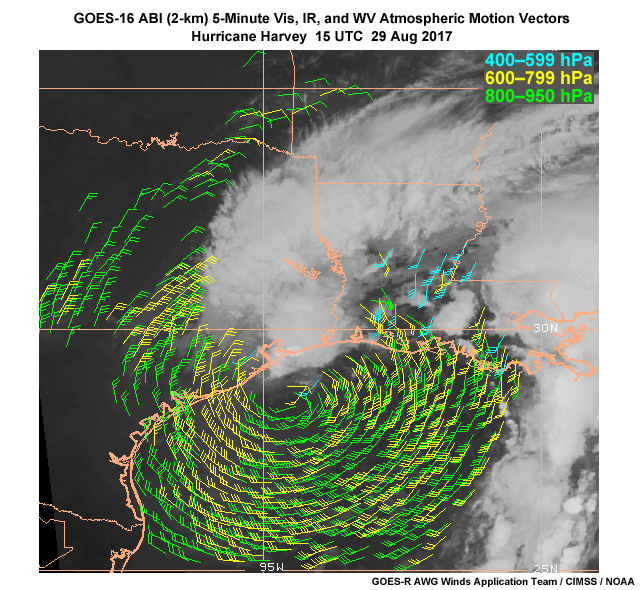
Description:
GOES-16 ABI 2-km 5-minute visible, infrared, and water vapor derived motion winds on top of 10.3 micrometer infrared image showing hurricane Harvey at 15 UTC on 29 August, 2017
File Name:
g16_abi_vs_goes_atmos_motion_winds_abi.jpg
Credits:
GOES-R AWG Winds Application Team / CIMSS / NOAA
Copyright Terms:
COMET Standard Terms of Use
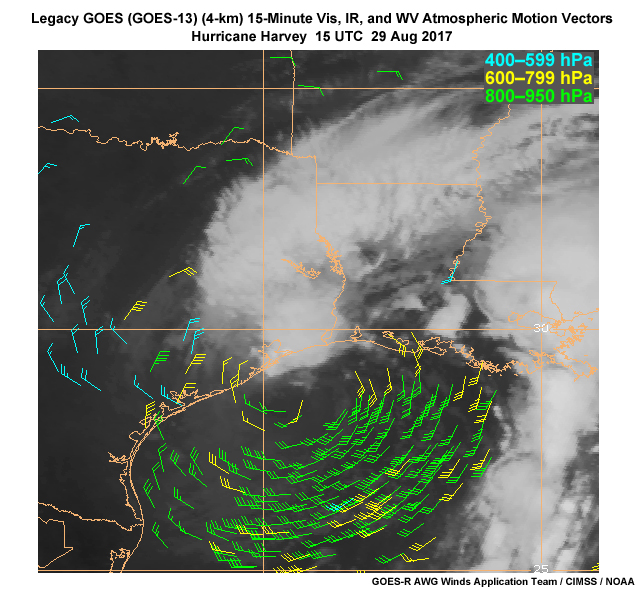
Description:
GOES-13 15-minute visible, infrared, and water vapor derived motion winds overlaid on top of 11.2 micrometer infrared image showing hurricane Harvey at 15 UTC on 29 August, 2017
File Name:
g16_abi_vs_goes_atmos_motion_winds_goes.jpg
Credits:
GOES-R AWG Winds Application Team/CIMSS/NOAA
Copyright Terms:
COMET Standard Terms of Use
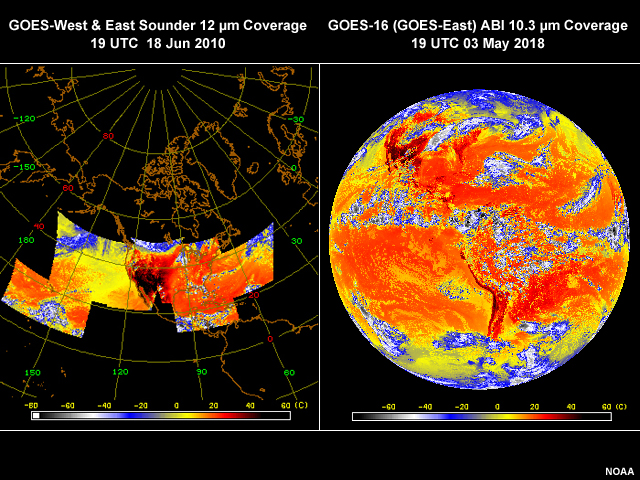
Description:
2 images, one showing GOES-West & East Sounder 12 µm Coverage from 19 UTC 18 Jun 2010, the other GOES-16 (GOES-East) ABI 10.3 µm Coverage from 19 UTC 03 May 2018
File Name:
goes_sndr_vs_abi_coverage.jpg
Credits:
NOAA
Copyright Terms:
COMET Standard Terms of Use
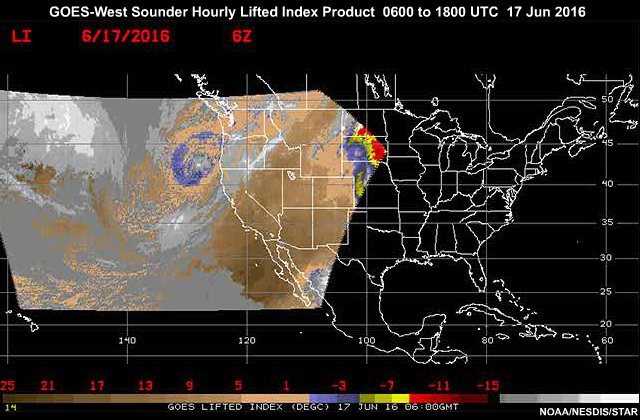
Description:
GOES-West (GOES-15) lifted index derived product imagery showing coverage over a 12-hour period on June 17, 2016
File Name:
goes_west_sounder_lidpi_coverage.mp4
Credits:
NOAA/NESDIS/STAR
Copyright Terms:
COMET Standard Terms of Use
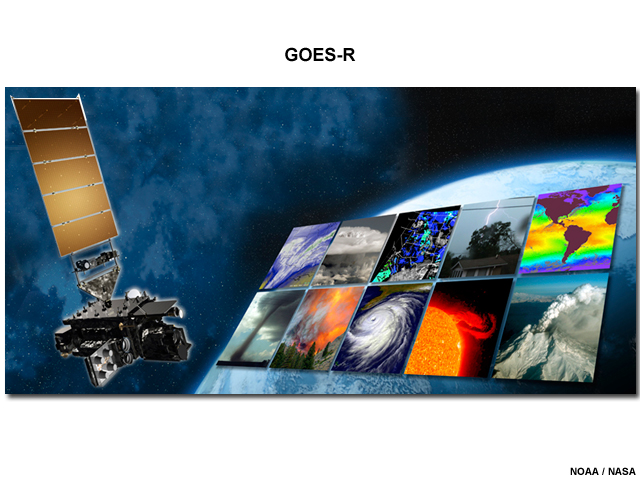
Description:
Artist rendering of the GOES-R satellite flying above Earth with images overlaid of features and phenomena that it will be used to monitor.
File Name:
goesr_viewing_phenomena.jpg
Credits:
NOAA / NASA
Copyright Terms:
COMET Standard Terms of Use
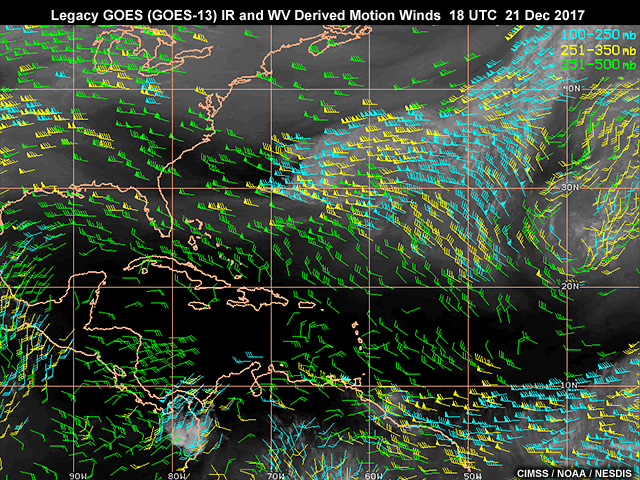
Description:
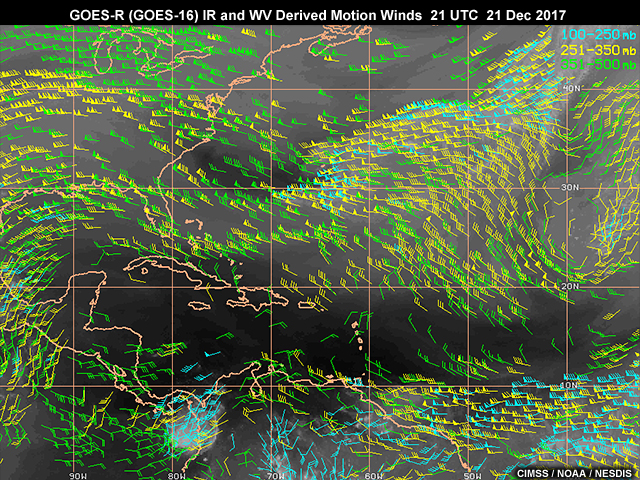
Satellite derived middle to upper level infrared and water vapor wind data density from the legacy GOES-13 satellite on 21 Dec 2017
File Name:
irwv_sat_derived_winds_1.jpg
Credits:
CIMSS/NOAA/NESDIS
Copyright Terms:
COMET Standard Terms of Use
Description:
Satellite derived middle to upper level infrared and water vapor wind data density from the new GOES-R (GOES-16) satellite on 21 Dec 2017
File Name:
irwv_sat_derived_winds_2.jpg
Credits:
CIMSS/NOAA/NESDIS
Copyright Terms:
COMET Standard Terms of Use
Description:
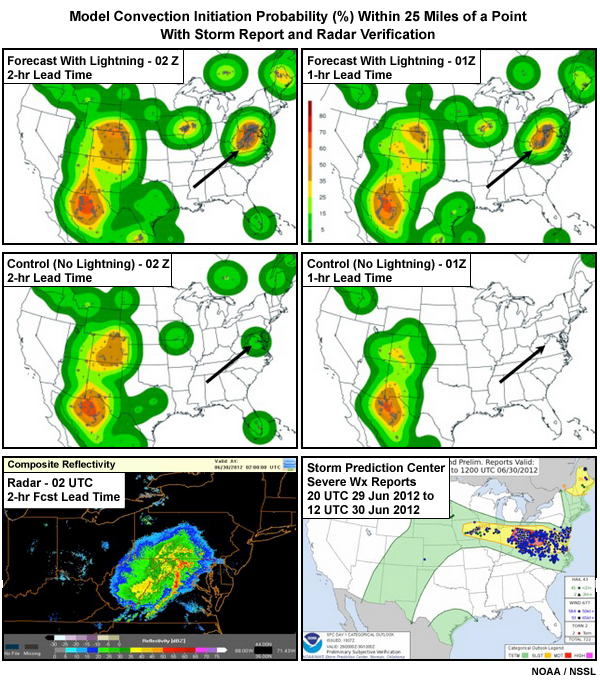
Plots showing model convection initiation probability (%) within 25 mi of a point with storm report and radar verification
File Name:
ltg_assim_exp_jun2012.jpg
Credits:
NOAA / NSSL
Copyright Terms:
COMET Standard Terms of Use
Description:
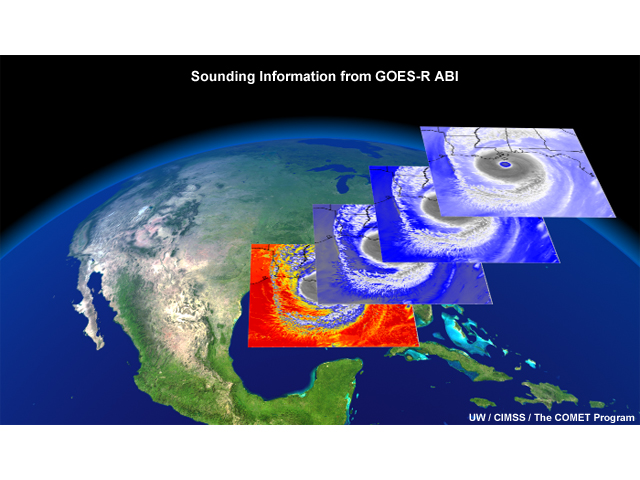
Simulated GOES-R Advanced Baseline Imager (ABI) imagery of Hurricane Katrina as it is making landfall in southeast Louisiana. Four images are shown stacked on top of each other (as viewed from a 45° angle to the earth's surface. Each one of these images represents at which level the ABI would be seeing these data. From bottom to top, the surface image is made with the shortwave infrared image, then the next three images are different water vapor images at different altitudes. These are the only channels that will be used to make soundings in the future with the ABI. The rest of the data will be interpolated from NWP output.
File Name:
sim_ABI_layers_sounding_katrina.jpg
Credits:
UW / CIMSS / The COMET Program
Copyright Terms:
COMET Standard Terms of Use
Description:
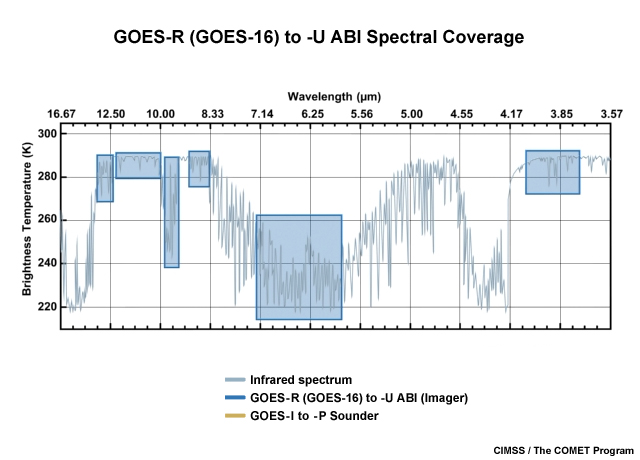
Graph showing simulated GOES-R ABI spectral coverage
File Name:
spectral_coverage_abi_satfc.jpg
Credits:
CIMSS / The COMET Program
Copyright Terms:
COMET Standard Terms of Use
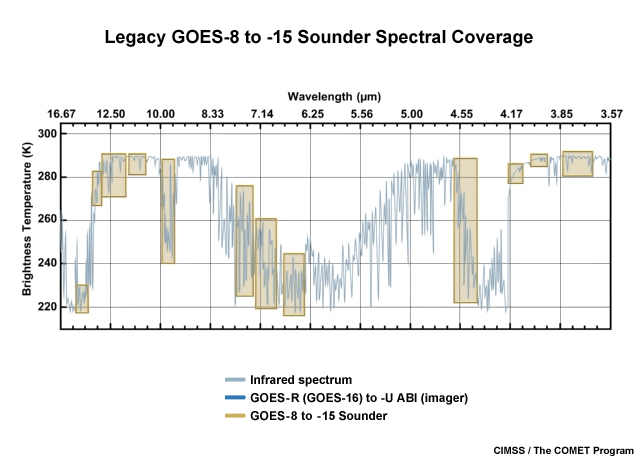
Description:
Graph showing current GOES sounder spectral coverage
File Name:
spectral_coverage_goes_sndr_satfc.jpg
Credits:
CIMSS / The COMET Program
Copyright Terms:
COMET Standard Terms of Use