About the Lesson
Meteorological and environmental satellites supply more than 91% of the observations assimilated by numerical weather prediction (NWP) models. These observations include critical information on atmospheric moisture, temperature, and winds, and on surface conditions for Earth's land and oceanic regions.
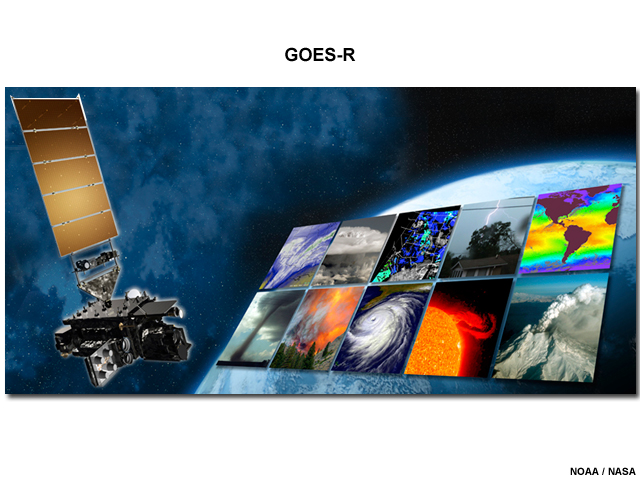
This lesson presents a brief overview of how GOES-R observations are expected to support and potentially enhance NWP analyses and forecasts.
On completing the lesson, you should be able to:
- Describe what GOES-R offers that is different from previous satellites that will affect NWP performance
- Describe the potential impacts of GOES-R observations on NWP analyses and forecasts
GOES-R Capabilities
The GOES-R series offers the following capabilities and improvements to NWP:
- New capability for lightning detection
- More than triple the number of infrared channels
- Four times higher spatial resolution
- Five times faster imaging from CONUS to the full Earth disk
- More accurate radiometric measurements for observing subtle features, and
- Improved image navigation and pixel registration
The following pages address how these capabilities are expected to impact NWP.
Atmospheric Sounding
Polar-orbiting and to a lesser extent geostationary satellite sounders provide measurements that account for about 60% of the satellite data assimilated into NWP models.
The GOES-R to GOES-U satellites will not have a dedicated sounder. However, despite its design as an imager, the GOES-R ABI will continue to provide legacy information on atmospheric moisture, temperature, and stability by leveraging it's improved spatial and temporal scanning capabilities.
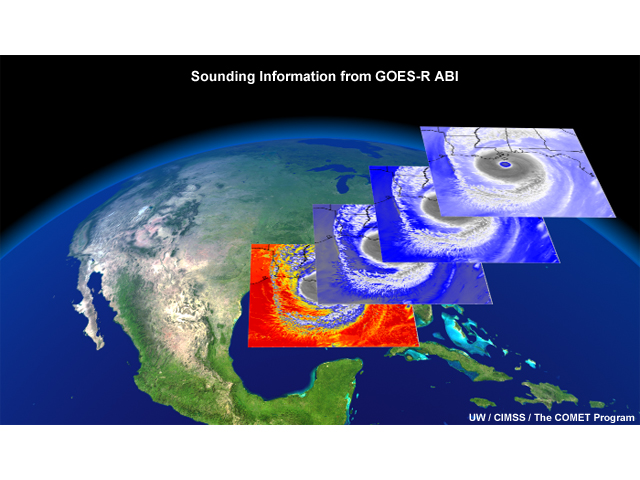
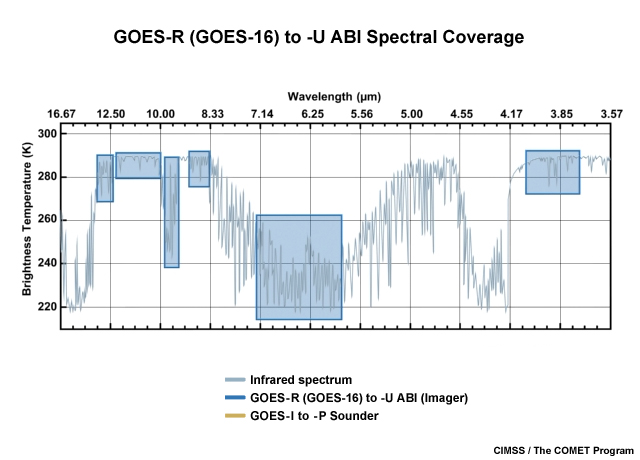
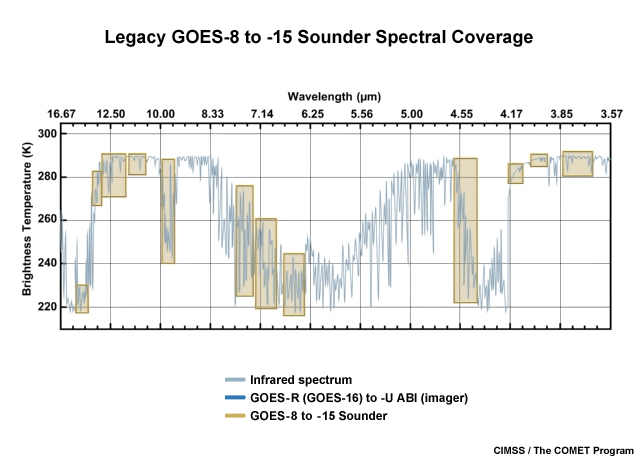
While the ABI has an expanded suite of spectral channels, it has fewer channels that can be used for profiling atmospheric temperature and moisture when compared to the current GOES sounder. The result is poorer vertical resolution, which would reduce the accuracy of the ABI's sounding profiles and derived products.
Use the slider to see the difference in spectral coverage between the current GOES sounder and the ABI.
The ABI's more frequent imaging and expanded areal coverage should mitigate some of the reduction in vertical resolution.
In the comparison below, we see the significant improvement in coverage when comparing the current hourly GOES sounder scans (left) to the 15-minute full-disk GOES-R ABI scan (right).
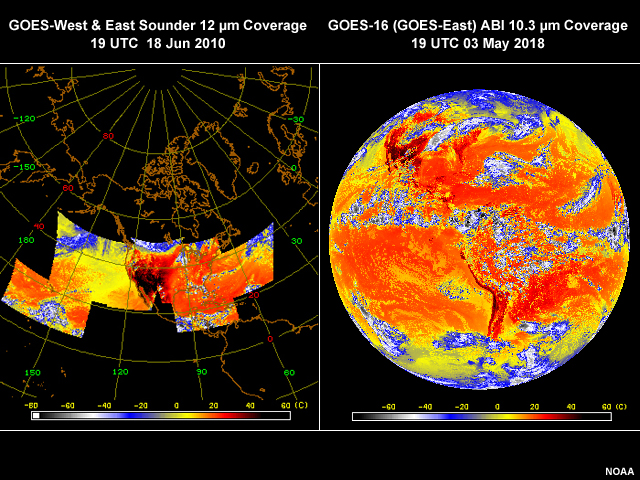
Legacy GOES sounder coverage (left) repeats hourly, whereas GOES-R ABI coverage (right) refreshes every 15 minutes across the full Earth disk, and more frequently for CONUS (every 5 minutes) and mesoscale sectors (every 1 minute for two sectors, 30 seconds for one sector) (see the animation below).
This second comparison between the legacy GOES-West (GOES-15) sounder and the GOES-16 ABI, highlights the ABI's improved 5-minute refresh rate over CONUS. The ability to detect changes on smaller time scales and at higher spatial resolution help improve ABI's atmospheric temperature and moisture profiles.
View the images in both tabs.
Legacy GOES-West (GOES-15) sounder lifted index derived product coverage and hourly updates over a 12-hour period on June 17, 2016.
Blended GOES-16 lifted index derived product and 10.3 micrometer IR imagery over CONUS during the afternoon of May 14, 2018. CONUS imagery routinely updates every five minutes. Areas where lifted index retrieval is prevented due to cloud cover are filled in with ABI 10.3 micrometer IR imagery.
Atmospheric Motion Winds
A greater number of reliable and accurate 3-dimensional atmospheric wind profiles are essential to improving the quality of NWP model analyses and forecasts.
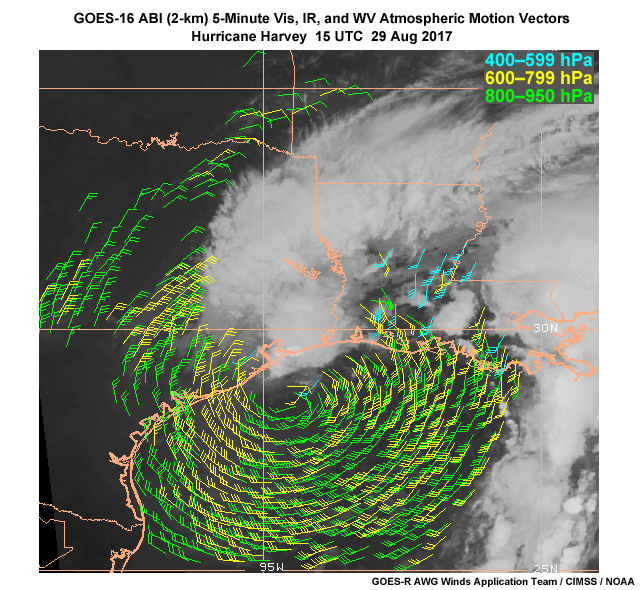
The GOES-R ABI's more rapid imaging, increased coverage, higher spatial resolution, and improved pixel geolocation increase the number and accuracy of high–resolution derived atmospheric motion vectors (or AMVs). ABI's extra imaging bands also improve the definition of AMV height assignments.
View the images in both tabs.
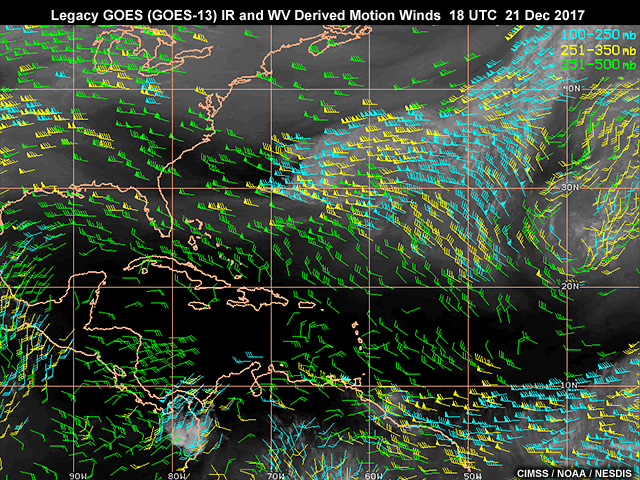
Satellite derived middle to upper level infrared and water vapor winds showing wind data density from the legacy GOES satellites.
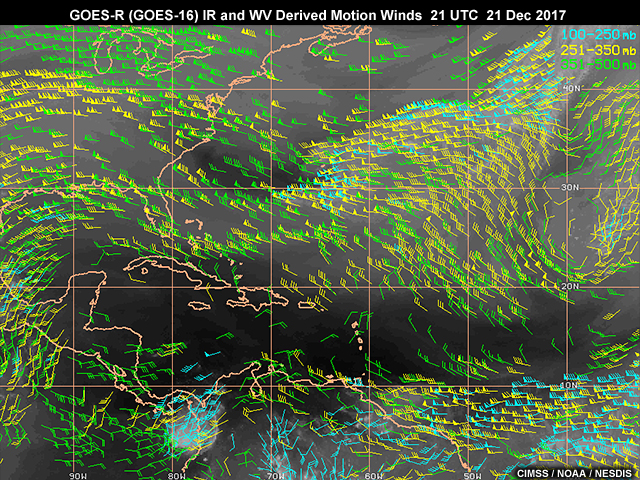
Satellite derived middle to upper level infrared and water vapor winds showing increased wind data density from the GOES-R satellite series (shown here for GOES-16).
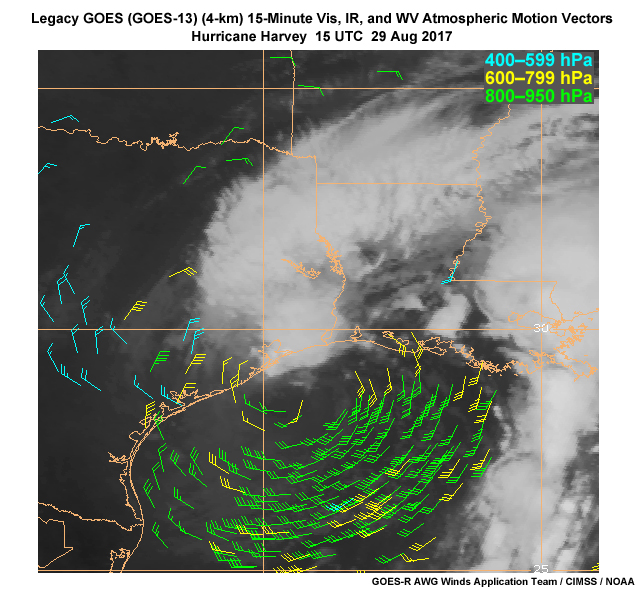
ABI's improved observing capability and positive impact on NWP should result in better forecasts for both tropical cyclones and extratropical storms.
For example, Velden (2005) has shown that increasing the temporal refresh rate from 15 to 5 minutes on the regional scale, and even finer on the mesoscale, leads to enhanced AMVs and improved forecasts of tropical cyclones.
Velden states that “Accurately specifying the initial conditions in terms of vortex structure and environmental wind flows affecting (the tropical cyclone) is paramount to achieving superior predictions of track and intensity.”
The two images below show AMVs generated from routine processing for legacy GOES-13 and newer GOES-16 imagery. Notice the increased number of wind vectors in the 5-minute ABI imagery compared to those generated using 15-minute legacy GOES imagery.
Comparisons like this allow us to reasonably conclude that increasing the temporal refresh rate on geostationary satellites leads to much better AMVs.
Use the slider to compare atmospheric motion winds derived from legacy GOES and newer GOES-16 ABI imagery.
Small-Scale Features
High-resolution NWP models have difficulty both assimilating small-scale features in their analyses and correctly predicting their evolution. An additional complication is that poor forecasts of small-scale features adversely affect the analysis first guess.
Addressing these challenges requires improvements in both DA systems and NWP models. High-resolution observations from satellites (and other surface-based sources such as dual-polarization radar) will need to be properly assimilated into the analysis. With a better understanding of the small-scale features in the data, scientists will create DA analyses and NWP models that better assimilate the small-scale motions that support small-scale features, such as gravity waves and convective updrafts and downdrafts.
Some of the instruments, both satellite and more conventional, that will provide the finer-scale observations needed to support the forecast of mesoscale features like convection include:
- GOES-R ABI
- High resolution Infrared imagery such as the 2-km imagery produced by the GOES-R ABI (for cloud top characterization)
- High temporal resolution profiles of temperature, moisture, and atmospheric stability
- High temporal and spatial resolution atmospheric motion vectors (from cloud and water vapor tracking)
- Other international geostationary imagers for atmospheric motion vectors and outgoing infrared radiances
- GOES-R Geostationary Lightning Mapper (GLM)
- High-resolution infrared and microwave sounders (currently on polar-orbiting satellites)
- Metop hyperspectral Infrared Atmospheric Sounding Interferometer (IASI) (mid-morning/evening coverage)
- S-NPP/JPSS hyperspectral CrIS (Cross-track Infrared Sounder) and ATMS (Advanced Technology Microwave Sounder) (early afternoon/morning coverage), collectively referred to as CrIMSS
- Metop AMSU (Advanced Microwave Sounding Unit) and MHS (Microwave Humidity Sounder)
- Microwave scatterometers for sea surface wind vectors (Metop ASCAT (Advanced Scatterometer), Indian ScatSat and OSCAT (OceanSat Scatterometer), Chinese SCAT series)
- Ground-based Doppler radar and LIDAR (Light Detection And Ranging) systems (for boundary layer and lower free tropospheric temperature, moisture, and wind profiles)
- Other non-satellite sources (aircraft, RAOB, surface synoptic observations, buoy, ground-based lightning)
GOES-16 1-minute mesoscale sector 0.64 micrometer (band 2) visible imagery loop showing outflow-driven convection over Arizona on 23 July, 2017.
Convective Storm Forecasts
The GOES-R GLM will provide lightning data to data assimilation systems for convection-allowing NWP models. This should improve both initial and forecast convection strength and location.
The challenge for NWP is that if a convection-allowing model does not predict convection at a particular location in its first guess, the model will not assimilate satellite data from active convection at that location.
Experimental assimilation of lightning data in high resolution models offers a potential solution. The experimental DA system builds thunderstorms in the analysis where there's observed lightning but no storms in the model, and adjusts storm intensity based on lightning frequency.
Over the next decade, new geostationary lightning detection capabilities from various international satellite operators will provide continuous lightning coverage over much of the full Earth disk.
We can see the impact of including proxies for GOES-R GLM lightning observations on convection forecasts in this graphic. The NWS Storm Prediction Center's severe weather reports and radar indicate that the experimental forecasts clearly provide better guidance than the control model run where no lightning was assimilated.
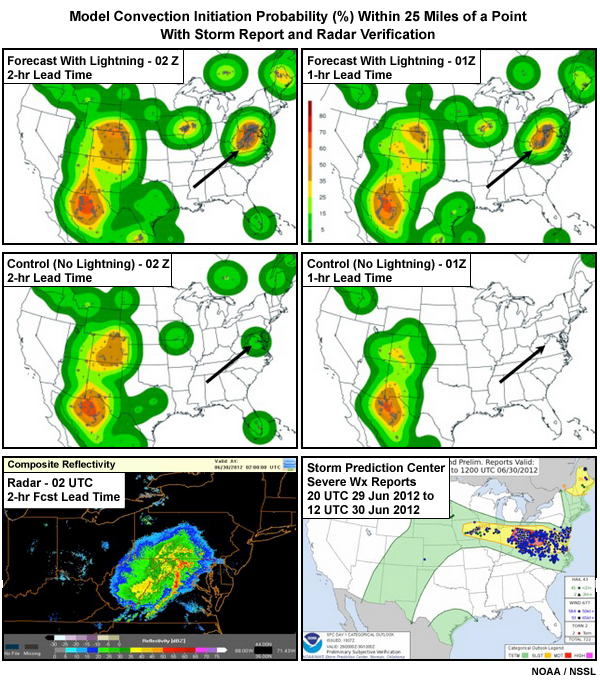
The first two rows show the chance of convective initiation within 25 miles of a point at two- and one-hour lead times for forecasts run with and without proxies for future GOES-R GLM lightning data. The third row shows SPC's severe weather reports during the event and radar at the two-hour forecast lead time.
Summary
- The GOES-R ABI will provide legacy atmospheric profiles of moisture, temperature, and stability with improved geographic and temporal coverage compared to the current GOES sounder.
- GOES-R ABI's expanded areal coverage and increased refresh rate will improve atmospheric motion vectors for better NWP model analyses and forecasts.
- High resolution observations from the GOES-R ABI and GLM should help improve the prediction of smaller scale features like convection.
- Lightning data from the GOES-R GLM should improve both initial and forecast convection strength and location for convection-allowing NWP models.
You have reached the end of the lesson. Please complete the quiz and share your feedback with us via the user survey.
References
- COMET, cited 2016: How Satellite Observations Impact NWP. The COMET© Program. (Available online at https://www.meted.ucar.edu/training_module.php?id=1016)
- Fierro, A. O., E. R. Mansell, C. L. Ziegler, and D. R. MacGorman, 2012: Application of a lightning data assimilation technique in the WRF-ARW model at cloud-resolving scales for the tornado outbreak of 24 May 2011. Mon. Wea. Rev., 140, 2609–2627.
- McCaul Jr., E. W., S. J. Goodman, K. M. LaCasse, and D. J. Cecil, 2009: Forecasting lightning threat using cloud-resolving model simulations. Wea. Forecasting, 24, 709–729.
- Schmit, Timothy J.; Gunshor, Mathew M.; Menzel, W. Paul; Gurka, James J.; Li, Jun and S. A. Bachmeier, 2005: Introducing the next-generation Advanced Baseline Imager on GOES-R. Bull. Amer. Meteor. Soc., 86, 1079-1096.
- Schmit, T. J., J. Li, J. J. Gurka, M. D. Goldberg, K. J. Schrab, J. Li, and W. F. Feltz, 2008: The GOES-R Advanced Baseline Imager and the continuation of current sounder products. J. Appl. Meteor. and Climatol., 47, 2696-2711.
- Velden, C. S., J. Daniels, D. Stettner, D. Santek, J. Key, J. Dunion, K. Holmlund, G. Dengel, W. Bresky, and P. Menzel, 2005: Recent innovations in deriving tropospheric winds from meteorological satellites. Bull. Amer. Meteor. Soc., 86, 205-223.
- Wu, Ting-Chi, H. Liu, S. J. Majumdar, C. S. Velden, and J. L. Anderson, 2014: Influence of assimilating satellite-derived atmospheric motion vector observations on numerical analyses and forecasts of tropical cyclone track and intensity. Mon. Wea. Rev., 142 (1), 49-71.
Contributors
COMET Sponsors
MetEd and the COMET® Program are a part of the University Corporation for Atmospheric Research's (UCAR's) Community Programs (UCP) and are sponsored by
- NOAA's National Weather Service (NWS)
with additional funding by: - Bureau of Meteorology of Australia (BoM)
- Bureau of Reclamation, United States Department of the Interior
- European Organisation for the Exploitation of Meteorological Satellites (EUMETSAT)
- Meteorological Service of Canada (MSC)
- NOAA's National Environmental Satellite, Data and Information Service (NESDIS)
- NOAA's National Geodetic Survey (NGS)
- National Science Foundation (NSF)
- Naval Meteorology and Oceanography Command (NMOC)
- U.S. Army Corps of Engineers (USACE)
To learn more about us, please visit the COMET website.
Project Contributors
Program Managers
- Wendy Abshire – UCAR/COMET
- Bruce Muller – UCAR/COMET
Project Lead and Meteorologist
- Patrick Dills – UCAR/COMET
Instructional Design
- Bruce Muller - UCAR/COMET
Science Advisors and Contributors
- Dr. William Bua - UCAR/COMET
- Dr. Jacob Carley – NOAA/NWS
- Dr. Jason Otkin – University of Wisconsin/SSEC
Graphics/Animations
- Steve Deyo — UCAR/COMET
Multimedia Authoring/Interface Design
- Gary Pacheco — UCAR/COMET
Audio Narration
- Vanessa Vincente — UCAR/COMET
COMET Staff, June 2018
Director's Office
- Dr. Elizabeth Mulvihill Page, Director
- Tim Alberta, Assistant Director Operations and IT
- Paul Kucera, Assistant Director International Programs
Business Administration
- Lorrie Alberta, Administrator
- Auliya McCauley-Hartner, Administrative Assistant
- Tara Torres, Program Coordinator
IT Services
- Bob Bubon, Systems Administrator
- Joshua Hepp, Student Assistant
- Joey Rener, Software Engineer
- Malte Winkler, Software Engineer
Instructional Services
- Dr. Alan Bol, Scientist/Instructional Designer
- Tsvetomir Ross-Lazarov, Instructional Designer
International Programs
- Rosario Alfaro Ocampo, Translator/Meteorologist
- David Russi, Translations Coordinator
- Martin Steinson, Project Manager
Production and Media Services
- Steve Deyo, Graphic and 3D Designer
- Dolores Kiessling, Software Engineer
- Gary Pacheco, Web Designer and Developer
- Sylvia Quesada, Production Assistant
Science Group
- Dr. William Bua, Meteorologist
- Patrick Dills, Meteorologist
- Bryan Guarente, Instructional Designer/Meteorologist
- Matthew Kelsch, Hydrometeorologist
- Erin Regan, Student Assistant
- Andrea Smith, Meteorologist
- Amy Stevermer, Meteorologist
- Vanessa Vincente, Meteorologist