Media elements used in this module are protected by a variety of copyright licenses. Please use the "copyright terms" link associated with each item below for more information.
Description:
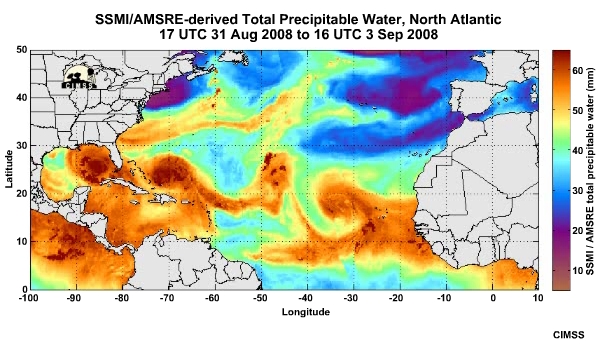
SSMI/AMSRE-derived Total Precipitable Water product showing a large pocket of dry air moving across the Atlantic Ocean from 31 Aug to 3 Sep 2008
File Name:
080901-03_mimic_tpw_anim.mp4
Credits:
CIMSS
Copyright Terms:
COMET Standard Terms
of Use
Description:
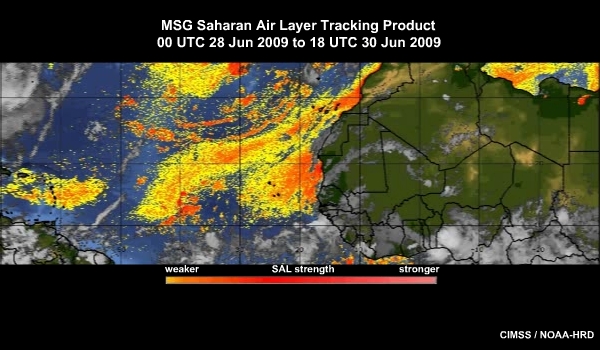
SAL Tracking Product showing the Saharan air layer moving across the Atlantic Ocean from 28 to 30 June 2009
File Name:
090630_met9_sal_anim_0001.htm
Credits:
CIMSS / NOAA-HRD
Copyright Terms:
COMET Standard Terms
of Use
Description:
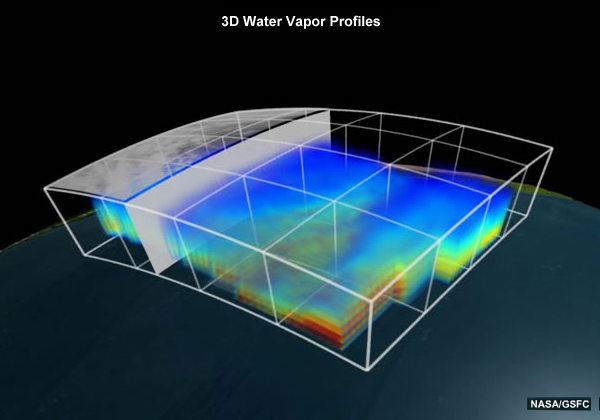
3d visualization of a water vapor field
File Name:
3d_water_vapor.jpg
Credits:
NASA/JPL
Copyright Terms:
COMET Standard Terms
of Use
Description:
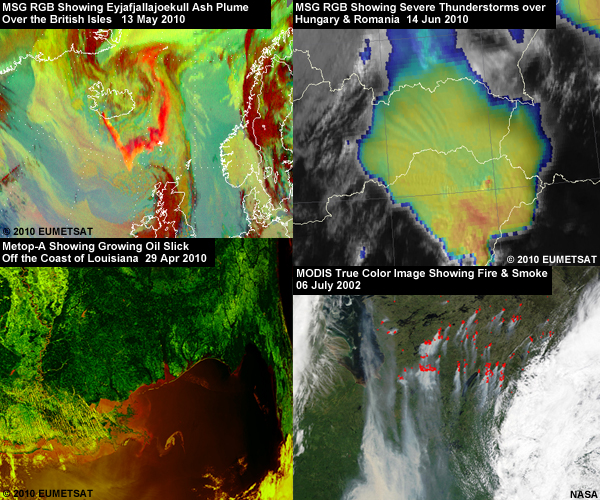
Satellite images of 4 environmental hazards (volcanic ash, a severe thunderstorm, an oil slick, and fire and smoke)
File Name:
4_hazards.jpg
Credits:
© 2010 EUMETSAT / NASA
Copyright Terms:
COMET Standard Terms
of Use
Description:
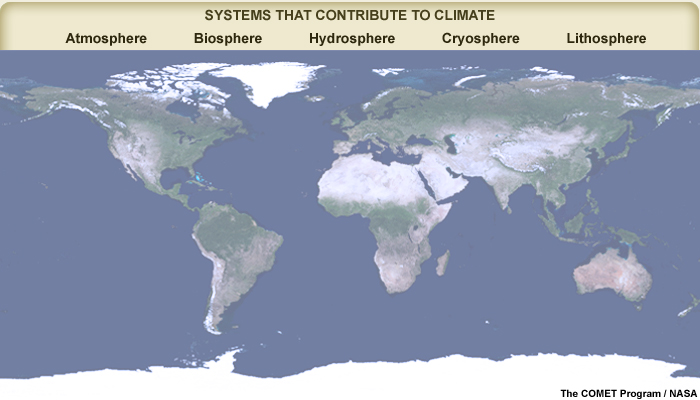
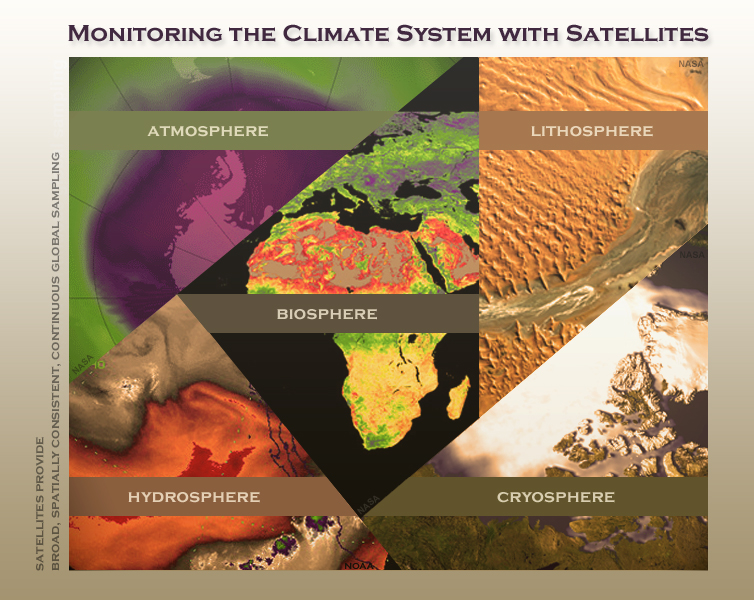
Graphic showing the different systems that contribute to climate
File Name:
5_systems.jpg
Credits:
The COMET Program/NASA
Copyright Terms:
COMET Standard Terms
of Use
Description:
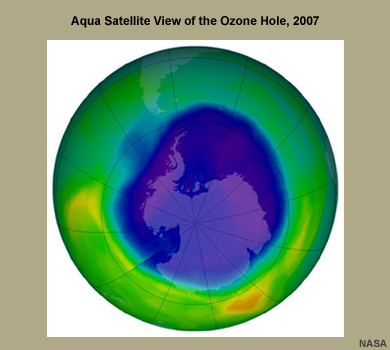
Aqua satellite view of the ozone hole, 2007
File Name:
5_systems_atmos.jpg
Credits:
NASA
Copyright Terms:
COMET Standard Terms
of Use
Description:
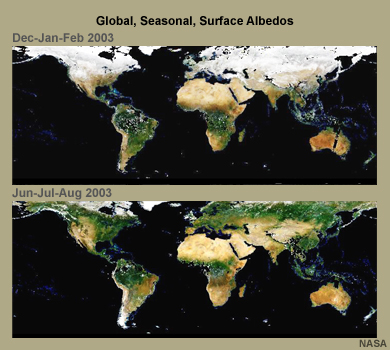
Landsat images showing global and seasonal surface albedos for dec/jan/feb 2003 and jun/jul/aug 2003
File Name:
5_systems_bio.jpg
Credits:
NASA
Copyright Terms:
COMET Standard Terms
of Use
Description:
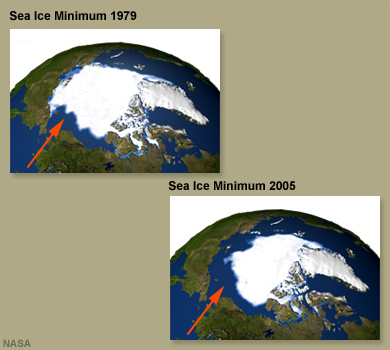
NASA images showing sea ice minimum in the arctic in 1979 vs. 2005
File Name:
5_systems_cryo.jpg
Credits:
NASA
Copyright Terms:
COMET Standard Terms
of Use
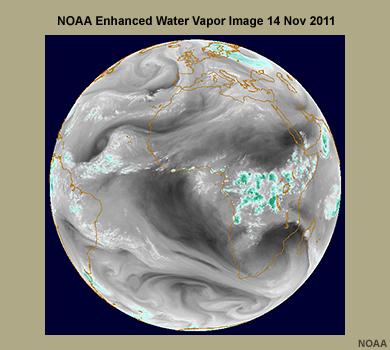
Description:
NOAA enhanced global water vapor image for 14 Nov 2011
File Name:
5_systems_hyrdo.jpg
Credits:
NOAA
Copyright Terms:
COMET Standard Terms
of Use
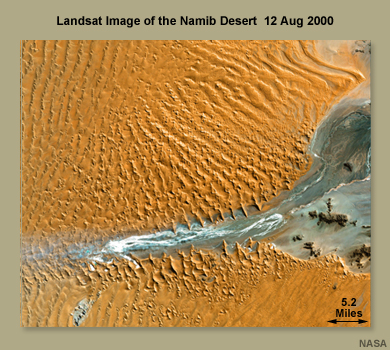
Description:
Landsat image of the Namib desert from 12 Aug 2000
File Name:
5_systems_terra.jpg
Credits:
NASA
Copyright Terms:
COMET Standard Terms
of Use
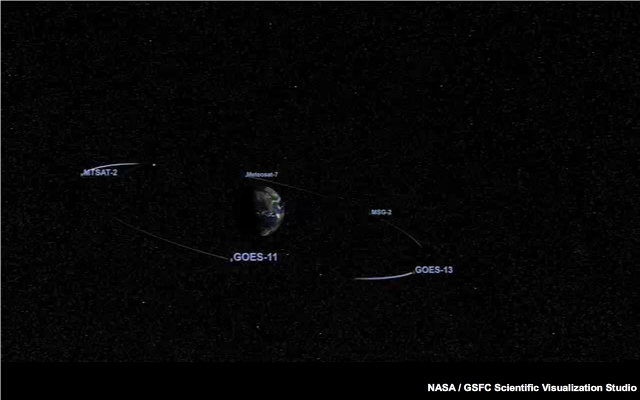
Description:
Visualization showing the five weather satellites that create NOAA's Climate Prediction Center products (GOES-11, GOES-13, MSG-2, Meteosat-7 and MTSAT-2)
File Name:
5geo_satellites_ani.mp4
Credits:
NASA / GSFC Scientific Visualization Studio
Copyright Terms:
COMET Standard Terms
of Use
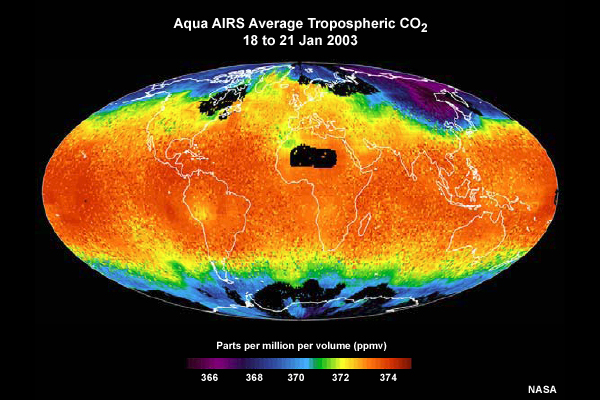
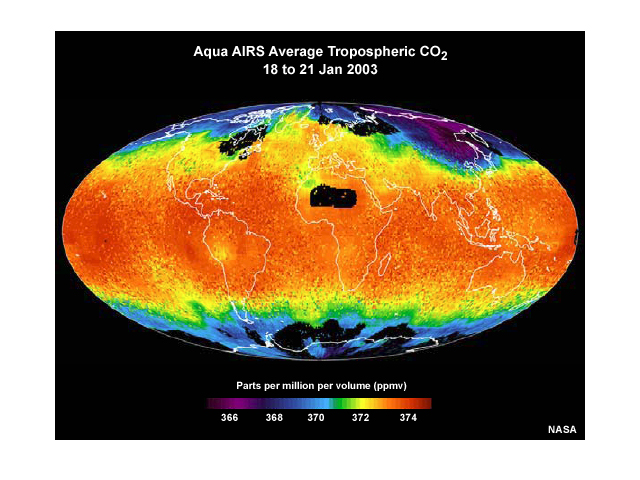
Description:
Tropospheric average carbon dioxide concentrations as retrieved from EOS Aqua AIRS sounder data from 18 to 21 January, 2003.
File Name:
airs_co2.jpg
Credits:
NASA
Copyright Terms:
COMET Standard Terms
of Use
Description:
Aqua AIRS average global tropospheric carbon dioxide from 18 to 21 Jan 2003
File Name:
airs_co2_01.jpg
Credits:
NASA
Copyright Terms:
COMET Standard Terms
of Use
Description:
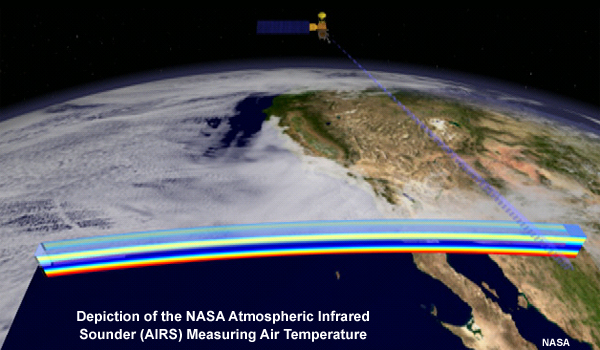
Depiction of the NASA Atmospheric Infrared Sounder (AIRS) measuring air temperature.
File Name:
airs_conceptual_drawing.jpg
Credits:
NASA
Copyright Terms:
COMET Standard Terms
of Use
Description:
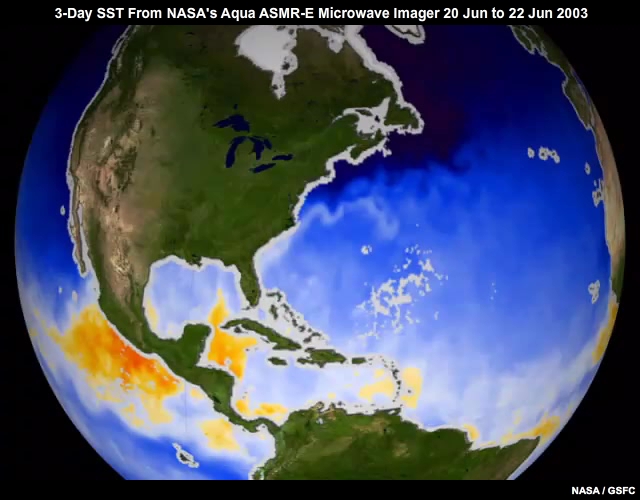
Animation of monthly sea surface temperature from the AMSR-E microwave imager on board the NASA Aqua polar-orbiting satellite from 20 Jun to 22 Jun 2003
File Name:
amsre_sst_ani.mp4
Credits:
NASA / GSFC
Copyright Terms:
COMET Standard Terms
of Use
Description:
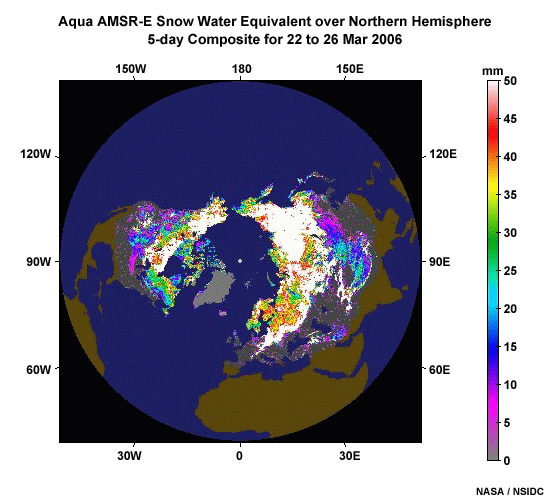
Five-day snow water equivalent composite analysis from the Aqua AMSR-E microwave imager covering the Northern Hemisphere for the period ending 26 March 2006.
File Name:
amsre_swe_nhem1_5day.jpg
Credits:
NASA / NSIDC
Copyright Terms:
COMET Standard Terms
of Use
Description:
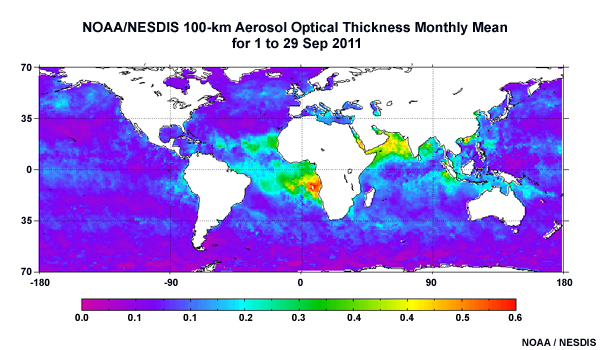
Global image of 100-km Aerosol Optical Thickness Data for a 28-day period ending 29 Sep 2011
File Name:
aod_prod_24oct2011.jpg
Credits:
NOAA / NESDIS
Copyright Terms:
COMET Standard Terms
of Use

Description:
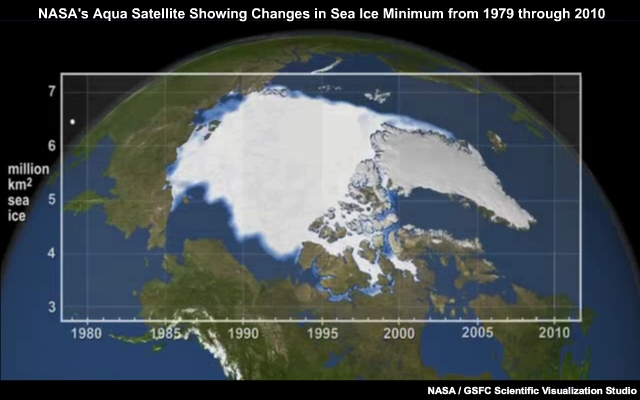
Animation showing changes in sea ice from NASA's Aqua satellite from 1979 through 2010
File Name:
arctic_ams_2010246.jpg
Credits:
NASA / GSFC Scientific Visualization Studio
Copyright Terms:
COMET Standard Terms
of Use
Description:
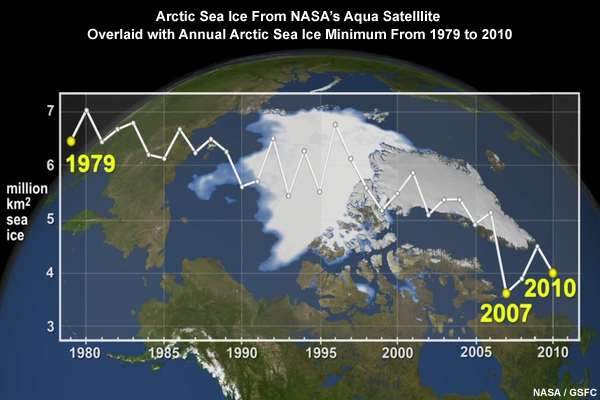
Image of the Earth showing arctic sea ice overlaid with a graph of the annual arctic sea ice minimum from 1979 to 2010
File Name:
arctic_seaice_graph_1979to2010.jpg
Credits:
NASA / GSFC
Copyright Terms:
COMET Standard Terms
of Use
Description:
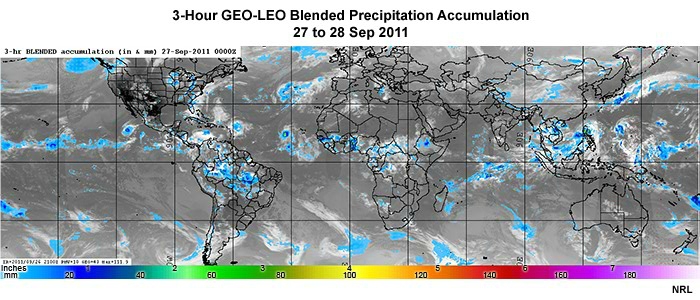
Three-hour blended geostationary and polar-orbiting satellite rainfall accumulation product animation every three hours from 00 to 00 UTC, September 27 to 28, 2011.
File Name:
blended_rainrate_0001.htm
Credits:
NRL
Copyright Terms:
COMET Standard Terms
of Use
Description:
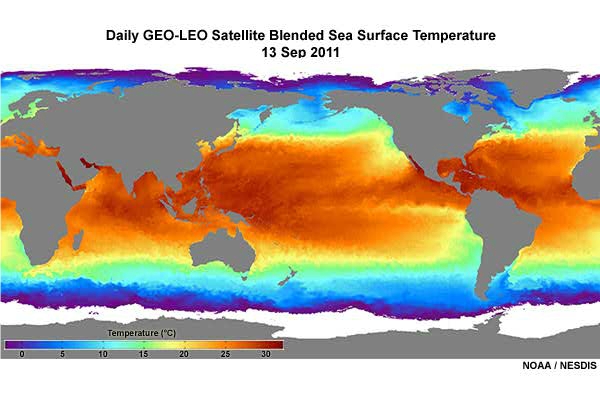
30-day blended geostationary and polar-orbiting satellite sea surface temperature analysis animation for September 13 to October 04, 2011.
File Name:
blended_sst_0001.htm
Credits:
NOAA / NESDIS
Copyright Terms:
COMET Standard Terms
of Use
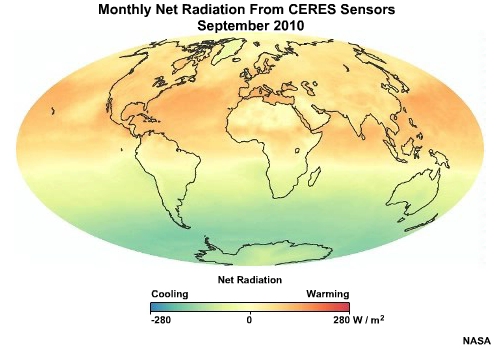
Description:
Animation showing monthly net radiation in watts per square meter from CERES sensors on NASA's Aqua and Terra satellites
File Name:
cerex_netflux_0001.htm
Credits:
NASA
Copyright Terms:
COMET Standard Terms
of Use
Description:
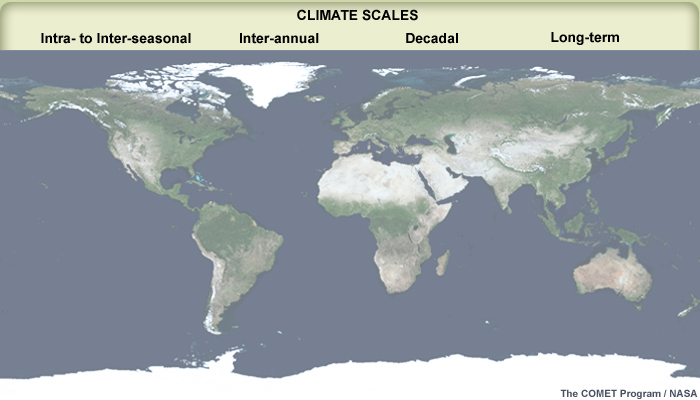
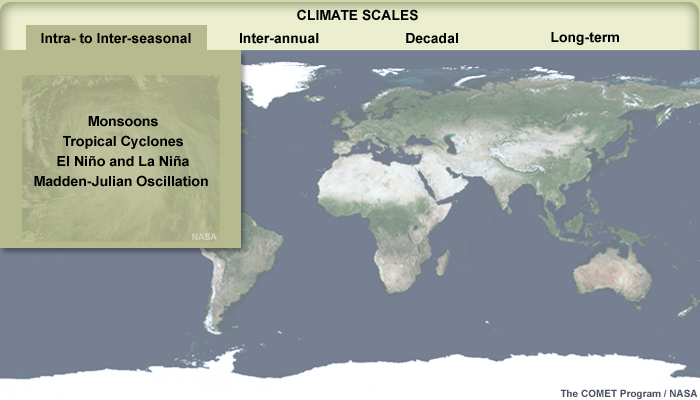
Map of the map with the four scales of climate labeled above it for an exercise
File Name:
climate_scales.jpg
Credits:
The COMET Program/NASA
Copyright Terms:
COMET Standard Terms
of Use
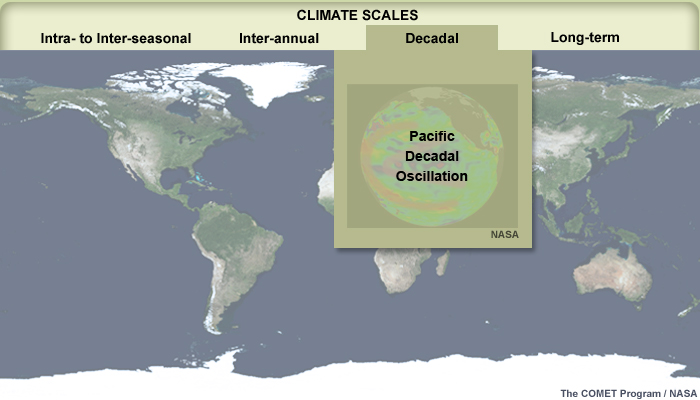
Description:
NASA image of the PDO over a map of the world, with the different climate scales labeled for an interaction
File Name:
climate_scales_decadal_both.jpg
Credits:
The COMET Program/NASA
Copyright Terms:
COMET Standard Terms
of Use
![Graphic showing the different scales of climate (intra/interseason, interannual, decadal, long-term] with decadal and longterm highlighted and an image representing each of their cycles displayed on a map of the world](media/graphics/climate_scales_decadal_longterm.jpg)
Description:
Graphic showing the different scales of climate (intra/interseason, interannual, decadal, long-term] with decadal and longterm highlighted and an image representing each of their cycles displayed on a map of the world
File Name:
climate_scales_decadal_longterm.jpg
Credits:
The COMET Program / NASA
Copyright Terms:
COMET Standard Terms
of Use
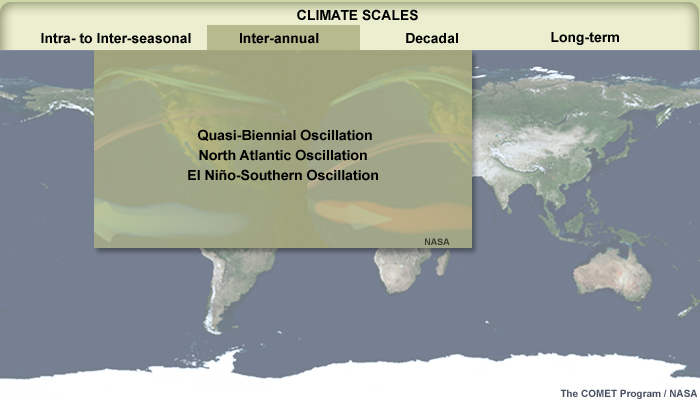
Description:
Images of the phases of ENSO over a map of the world, with the different climate scales labeled for an interaction
File Name:
climate_scales_interannual_both.jpg
Credits:
The COMET Program/NASA
Copyright Terms:
COMET Standard Terms
of Use

Description:
NASA graphics of sea ice max/min over a map of the world, with the different climate scales labeled for an interaction
File Name:
climate_scales_longterm_both.jpg
Credits:
The COMET Program/NASA
Copyright Terms:
COMET Standard Terms
of Use
Description:
NASA image of hurricane Katrina over a map of the world, with the different climate scales labeled for an interaction
File Name:
climate_scales_seasonal_both.jpg
Credits:
The COMET Program / NASA
Copyright Terms:
COMET Standard Terms
of Use
![Graphic showing the different scales of climate (intra/interseason, interannual, decadal, long-term] with seasonal and decadal highlighted and images of the PDO and Hurricane Katrina displayed over a map of the world](media/graphics/climate_scales_seasonal_decadal.jpg)
Description:
Graphic showing the different scales of climate (intra/interseason, interannual, decadal, long-term] with seasonal and decadal highlighted and images of the PDO and Hurricane Katrina displayed over a map of the world
File Name:
climate_scales_seasonal_decadal.jpg
Credits:
The COMET Program / NASA
Copyright Terms:
COMET Standard Terms
of Use
Description:
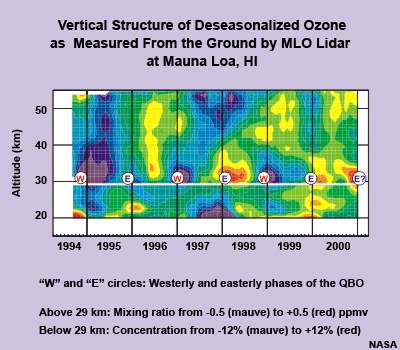
Vertical structure of deseasonalized ozone as measured from the ground by MLO Lidar at the Mauna Loa, HI from 1994 to 2000.
File Name:
deseasonalized_ozone_hawaii.jpg
Credits:
NASA
Copyright Terms:
COMET Standard Terms
of Use
Description:
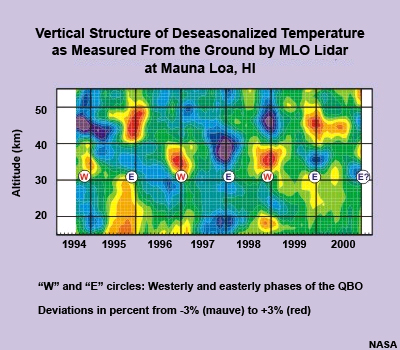
Vertical cross-section of deseasonalized temperature anomalies observed by the MLO Lidar at Mauna Loa, HI from 1994 to 2000.
File Name:
deseasonalized_temp_hawaii.jpg
Credits:
NASA
Copyright Terms:
COMET Standard Terms
of Use
Description:
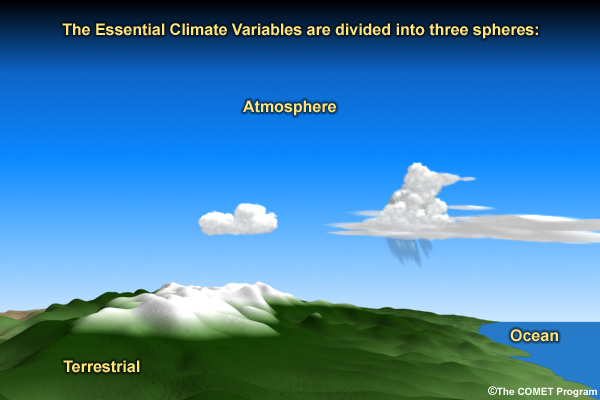
Conceptual drawing showing land, ocean, and atmosphere, with each sphere labeled
File Name:
earth_atmos_systems_variables.jpg
Credits:
©The COMET Program
Copyright Terms:
COMET Standard Terms
of Use
Description:
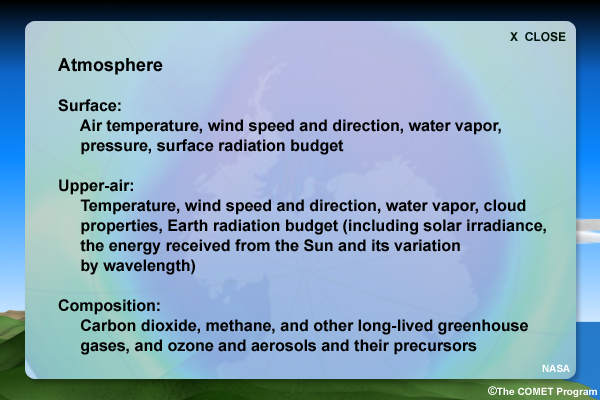
List of some of the essential climate variables in the atmospheric sphere
File Name:
earth_atmos_systems_variables_atmos.jpg
Credits:
©The COMET Program
Copyright Terms:
COMET Standard Terms
of Use
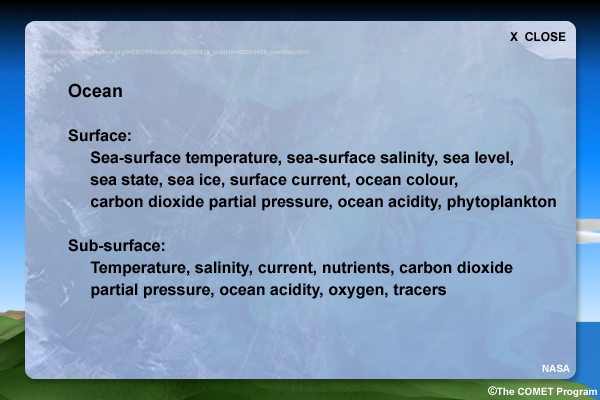
Description:
List of some of the essential climate variables in the ocean sphere
File Name:
earth_atmos_systems_variables_ocean.jpg
Credits:
©The COMET Program
Copyright Terms:
COMET Standard Terms
of Use
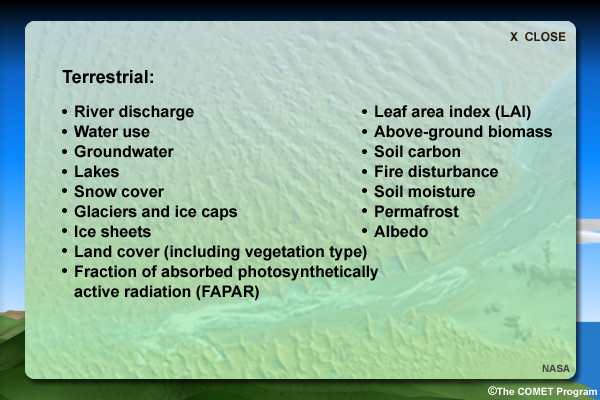
Description:
List of some of the essential climate variables in the terrestrial sphere
File Name:
earth_atmos_systems_variables_terra.jpg
Credits:
©The COMET Program
Copyright Terms:
COMET Standard Terms
of Use
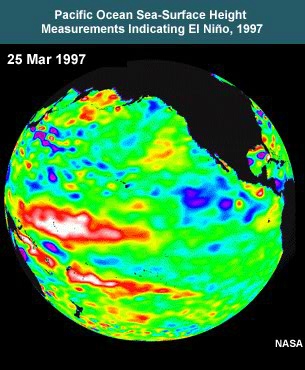
Description:
Pacific Ocean sea-surface height measurements indicating El Nino for 4 months in 1997 (Mar - Jun)
File Name:
el_la_nin_mar_jun_1997_0001.htm
Credits:
NOAA
Copyright Terms:
COMET Standard Terms
of Use
Description:
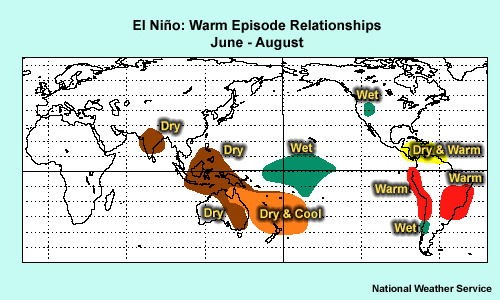
Map of the world with dry/wet and warm/cool areas associated with El Nino events labeled
File Name:
el_la_nws_wetdry_elnino.jpg
Credits:
NOAA
Copyright Terms:
COMET Standard Terms
of Use
Description:
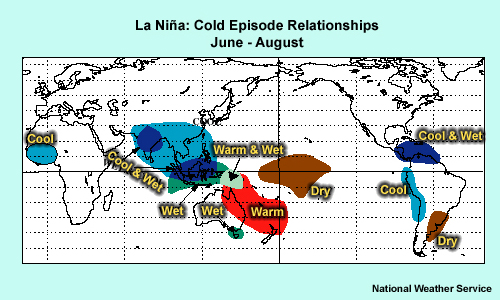
Map of the world with dry/wet and warm/cool areas associated with La Nina events labeled
File Name:
el_la_nws_wetdry_lanina.jpg
Credits:
NOAA
Copyright Terms:
COMET Standard Terms
of Use
Description:
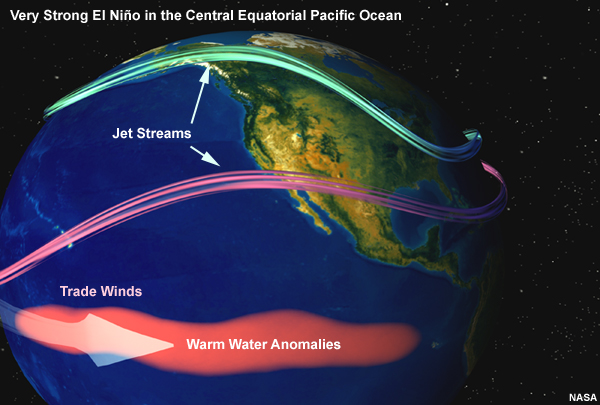
Conceptual graphic showing what happens when a very strong El Nino strikes surface waters in the Central equatorial Pacific Ocean
File Name:
enso_elnino.jpg
Credits:
NASA
Copyright Terms:
COMET Standard Terms
of Use
Description:
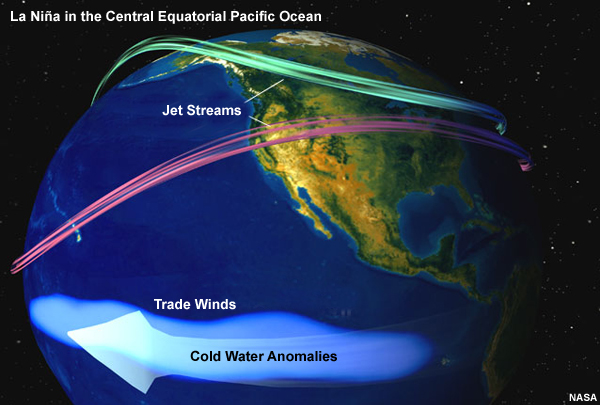
Conceptual graphic showing what happens during a La Niña event, when equatorial water becomes unusually cold and easterly trade winds blow stronger
File Name:
enso_lanina.jpg
Credits:
NASA
Copyright Terms:
COMET Standard Terms
of Use
Description:
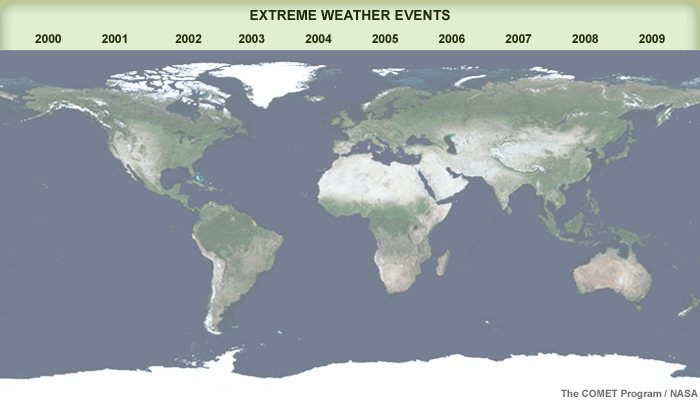
Interface for a section on extreme weather events, with the years 2000 to 2009 labeled above a NASA image of the Earth
File Name:
extreme_events.jpg
Credits:
© The COMET Program/NASA
Copyright Terms:
COMET Standard Terms
of Use
Description:
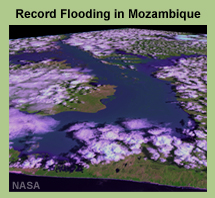
NASA image of flooding in Mozambique in 2000
File Name:
extreme_events_2000.jpg
Credits:
NASA
Copyright Terms:
COMET Standard Terms
of Use
Description:
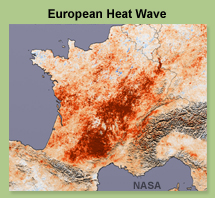
NASA image of the 2003 heat wave in Europe
File Name:
extreme_events_2003.jpg
Credits:
NASA
Copyright Terms:
COMET Standard Terms
of Use
Description:
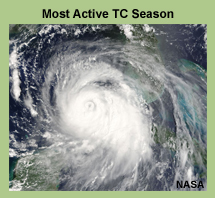
NASA image of of hurricane Katrinia in 2005
File Name:
extreme_events_2005.jpg
Credits:
NASA
Copyright Terms:
COMET Standard Terms
of Use
Description:
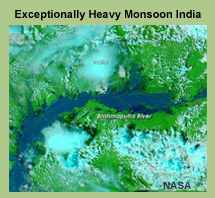
NASA image showing an exceptionally heavy monsoon in India in 2007
File Name:
extreme_events_2007.jpg
Credits:
NASA
Copyright Terms:
COMET Standard Terms
of Use
Description:
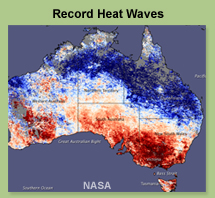
NASA image showing record heat waves in Australia
File Name:
extreme_events_2009.jpg
Credits:
NASA
Copyright Terms:
COMET Standard Terms
of Use
Description:
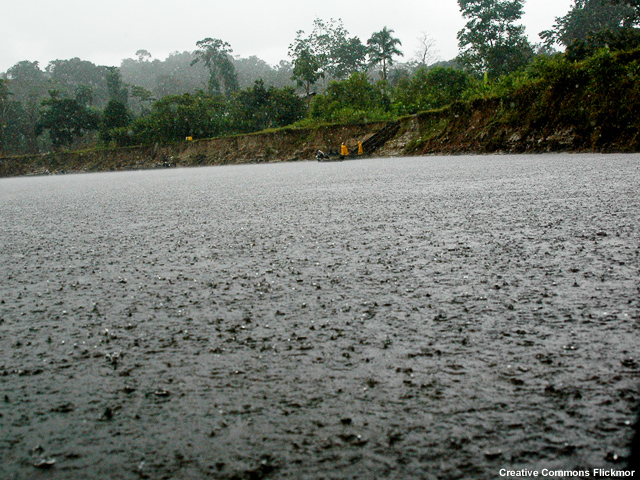
Rain on a river in Ecuador
File Name:
flickr_Amazon_rain.jpg
Credits:
Creative Commons Flickmor
Copyright Terms:
Creative
Commons Attribution-Noncommercial 2.0 Generic
Description:
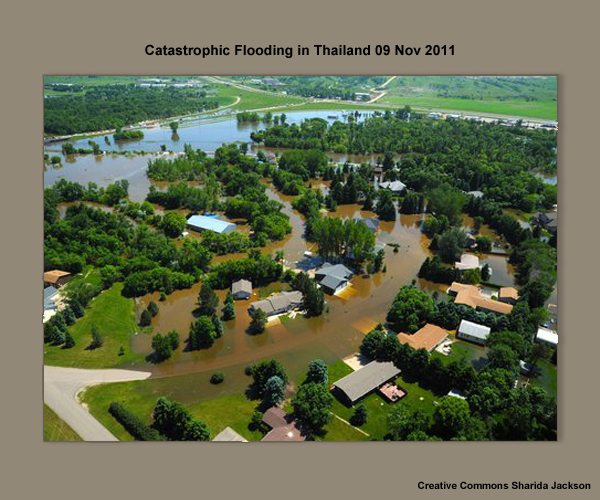
Photograph showing flooding in Thailand on 09 Nov 2011
File Name:
flooding_thailand.jpg
Credits:
Creative Commons Sharida Jackson
Copyright Terms:
Creative
Commons Attribution 2.0 Generic
Description:
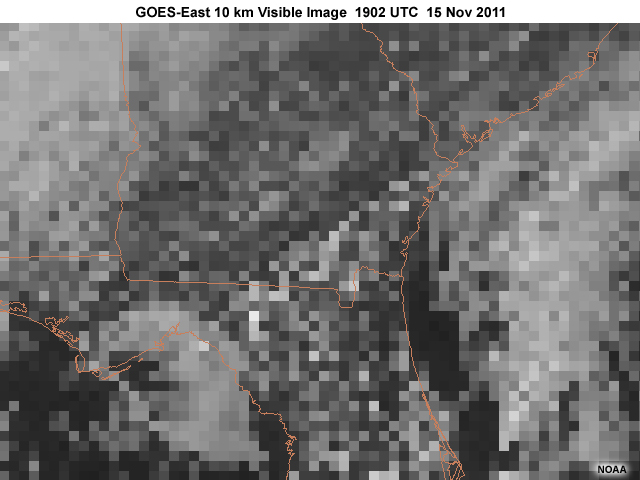
GOES-East 10 km visible image over the southeastern U.S. highlighting cumulus clouds on 15 November, 2011.
File Name:
ge_vis_se_10km.jpg
Credits:
NOAA
Copyright Terms:
COMET Standard Terms
of Use
Description:
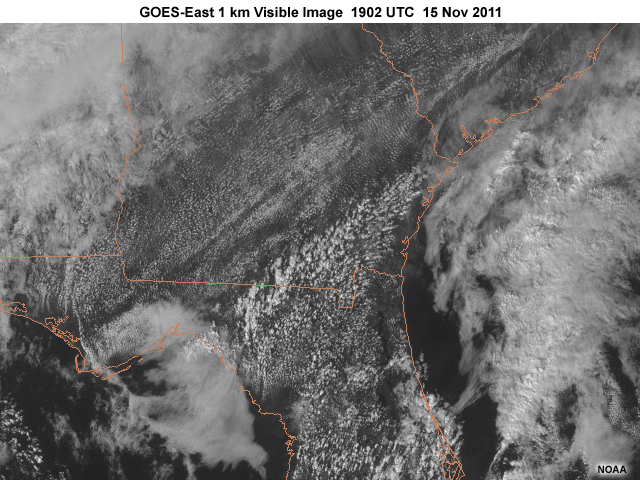
GOES-East 1 km visible image over the southeastern U.S. highlighting cumulus clouds on 15 November, 2011.
File Name:
ge_vis_se_1km.jpg
Credits:
NOAA
Copyright Terms:
COMET Standard Terms
of Use
Description:
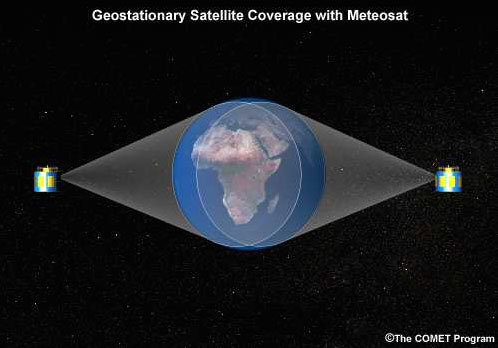
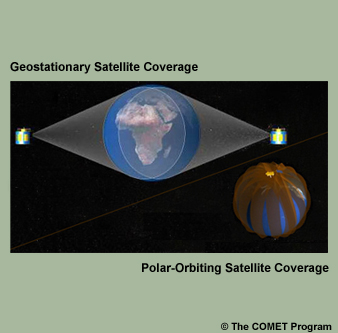
Geostationary satellite coverage with Meteosat
File Name:
geo.jpg
Credits:
©The COMET Program
Copyright Terms:
COMET Standard Terms
of Use
Description:
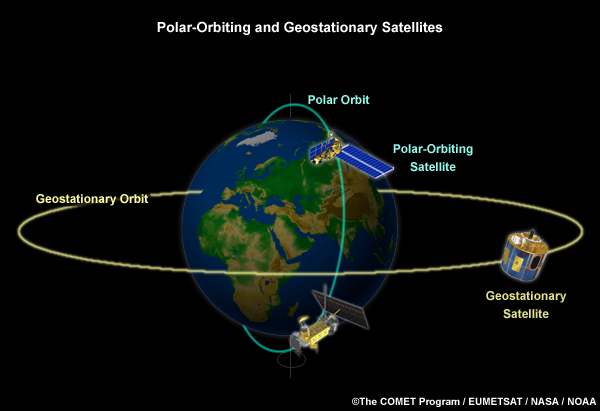
Geostationary and polar-orbiting satellites (Meteosat and MetOp)
File Name:
geo_leo_satellites.jpg
Credits:
©The COMET Program
Copyright Terms:
COMET Standard Terms
of Use
Description:
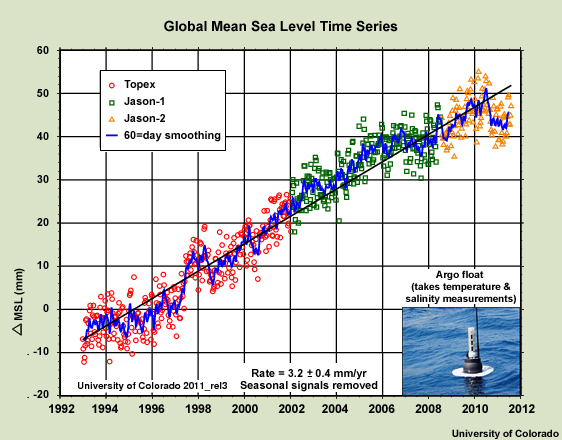
Graph of the global mean sea level time series made from data from the Topex, Jason-1 and Jason-2 satellites
File Name:
glob_mean_sea_level_1992to2012.jpg
Credits:
University of Colorado
Copyright Terms:
COMET Standard Terms
of Use
Description:
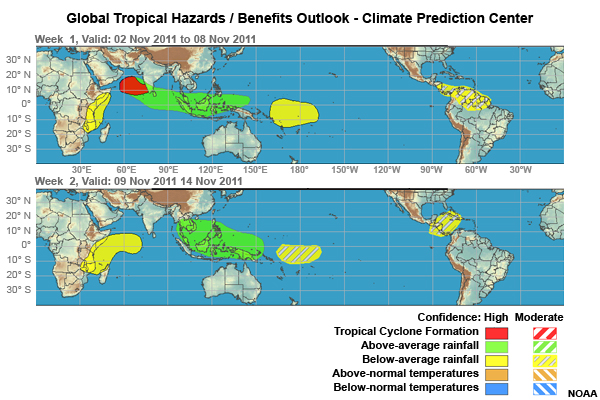
Map showing the outlook for global tropical hazards for 2 - 14 November 2011
File Name:
glob_trop_hazards.jpg
Credits:
NASA
Copyright Terms:
COMET Standard Terms
of Use
Description:
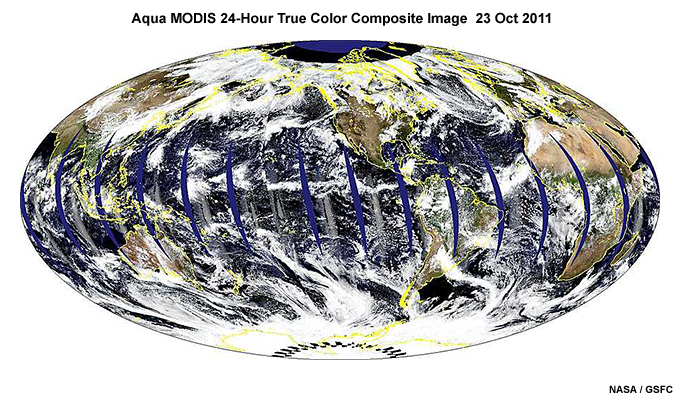
24-hour global true-color composite of cloud cover produced from the Aqua MODIS imager on 23 October, 2011.
File Name:
global_cloud_cover1.jpg
Credits:
NASA / GSFC
Copyright Terms:
COMET Standard Terms
of Use
Description:
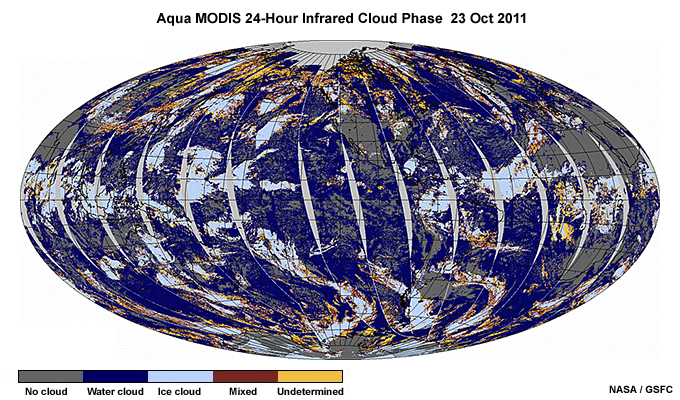
24-hour global composite of infrared cloud phase produced from the Aqua MODIS imager on 23 October, 2011.
File Name:
global_cloud_cover2.jpg
Credits:
NASA / GSFC
Copyright Terms:
COMET Standard Terms
of Use
Description:
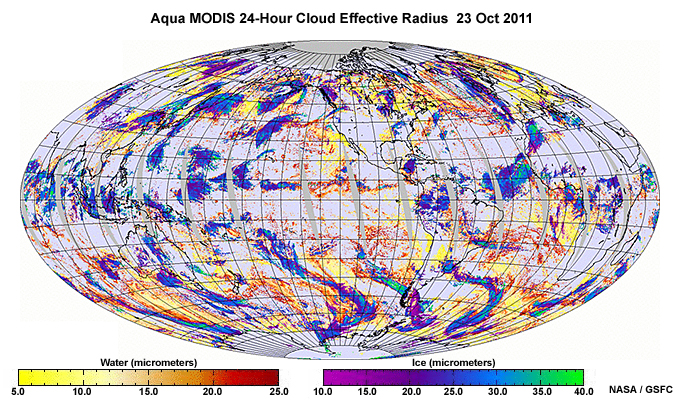
24-hour global composite of cloud effective radius produced from the Aqua MODIS imager on 23 October, 2011.
File Name:
global_cloud_cover3.jpg
Credits:
NASA / GSFC
Copyright Terms:
COMET Standard Terms
of Use
Description:
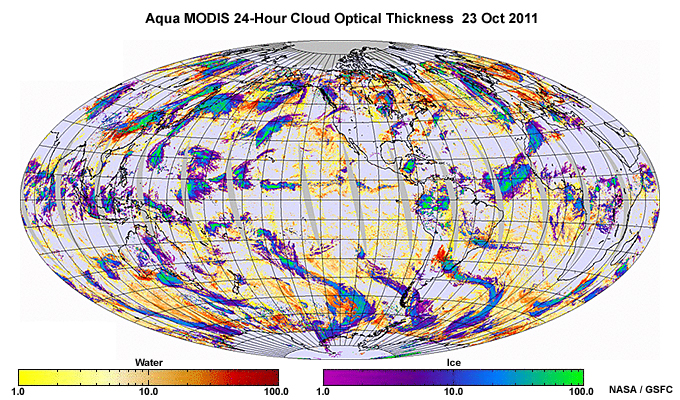
24-hour global composite of cloud optical thickness produced from the Aqua MODIS imager on 23 October, 2011.
File Name:
global_cloud_cover4.jpg
Credits:
NASA / GSFC
Copyright Terms:
COMET Standard Terms
of Use
Description:
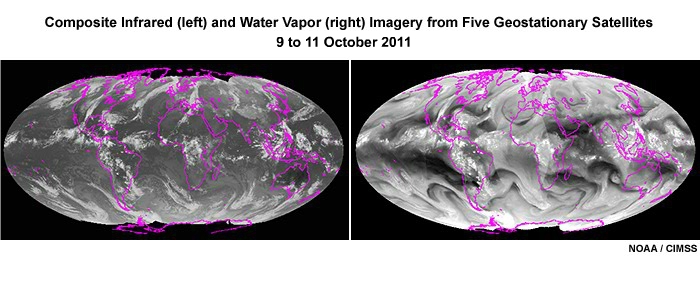
Infrared and water vapor imagery 3-hourly composites assembled from five geostationary weather satellites from 9 to 11 October, 2011.
File Name:
global_ir_wv_ani_0001.htm
Credits:
NOAA / CIMSS
Copyright Terms:
COMET Standard Terms
of Use
Description:
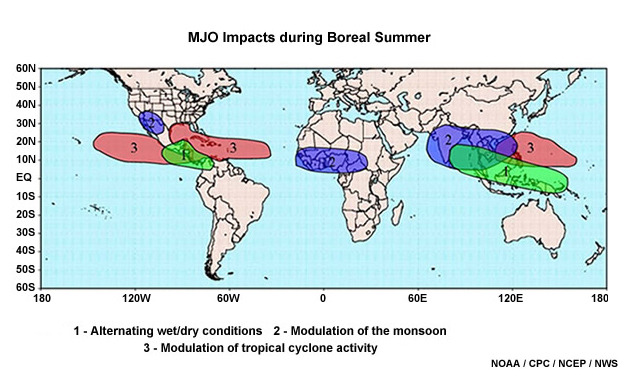
Global pattern of MJO impacts during Boreal summer (JJA). Impacts identified are: (1) alternating periods of wetter and drier conditions in the tropics; (2) modulation of the monsoons; and (3) modulation of tropical cyclone activity
File Name:
global_mjo_impacts_boreal_summer.jpg
Credits:
NOAA/CPC/NCEP/NWS
Copyright Terms:
COMET Standard Terms
of Use
Description:
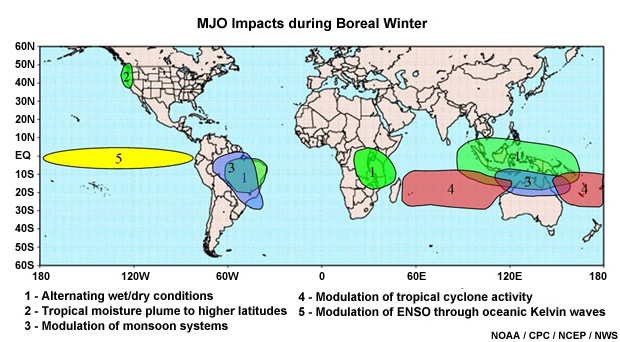
Global pattern of MJO impacts during Boreal winter (DJF): (1) alternate periods of wetter and drier conditions; (2) extension of a tropical moisture plume (the Pineapple Express) into higher latitudes, feeding heavy midlatitude rainfall events; (3) modulation of monsoon systems; (4) modulation of tropical cyclone activity; and (5) modulation of ENSO through oceanic Kelvin waves.
File Name:
global_mjo_impacts_boreal_winter.jpg
Credits:
NOAA/CPC/NCEP/NWS
Copyright Terms:
COMET Standard Terms
of Use

Description:
Geostationary and polar-orbiting satellite contributors to the global operational satellite observation system, shown as satellite icons orbiting around Earth. Updated 10 November, 2011.
File Name:
globalsys.jpg
Credits:
The COMET Program/EUMETSAT/NASA/NOAA/WMO
Copyright Terms:
COMET Standard Terms
of Use
Description:
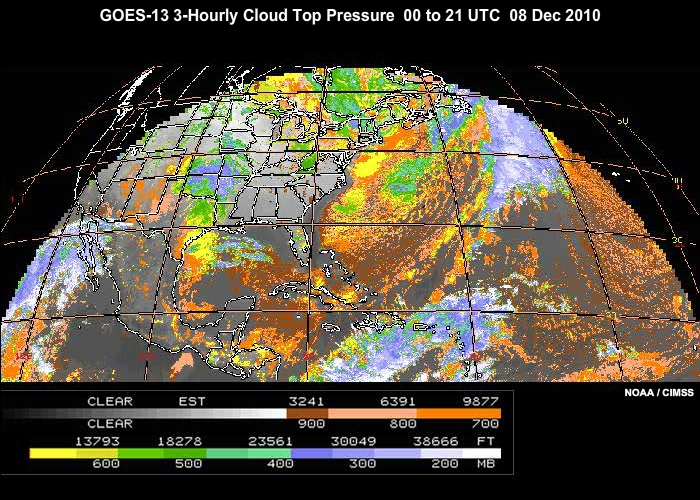
Animation of GOES-13 3-hourly Cloud Top Pressure imagery from 00 to 21 UTC on 08 December, 2010.
File Name:
goes_ctp_0001.htm
Credits:
NOAA / CIMSS
Copyright Terms:
COMET Standard Terms
of Use
Description:
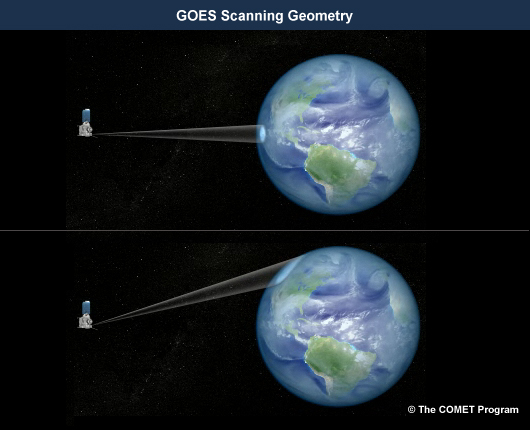
Graphical depiction of GOES scanning geometry
File Name:
goes_limb_viewing.jpg
Credits:
© The COMET Program
Copyright Terms:
COMET Standard Terms
of Use
Description:
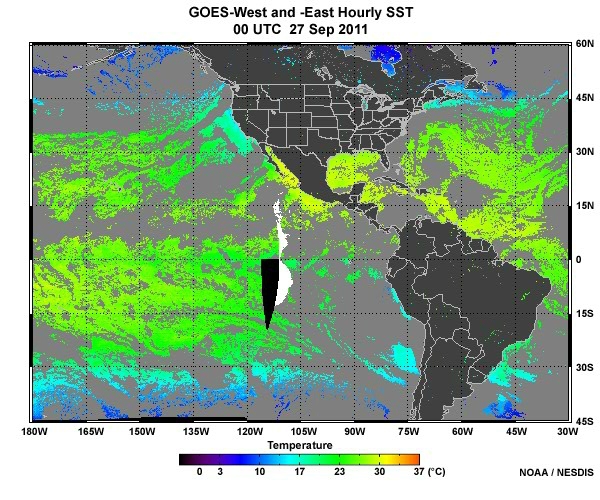
GOES-West and -East hourly sea surface temperature composites for 24 hours on September 27, 2011.
File Name:
goes_sst_0001.htm
Credits:
NOAA / NESDIS
Copyright Terms:
COMET Standard Terms
of Use
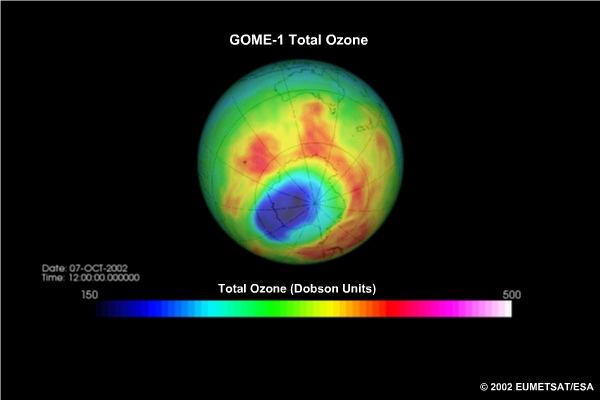
Description:
Animation showing total ozone in Dobson units as measured by the GOME-1 instrument from 18 Sep to 11 Oct 2002
File Name:
gomeozone_ani.mp4
Credits:
©2002 EUMETSAT/ESA
Copyright Terms:
COMET Standard Terms
of Use
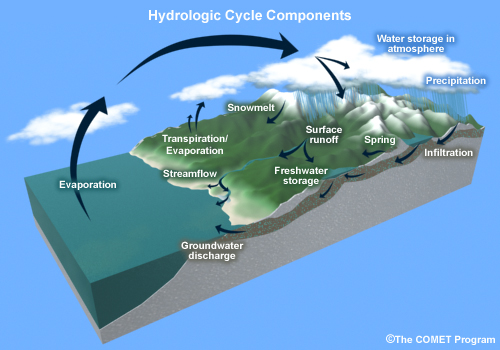
Description:
Conceptual image of components of the hydrologic cycle. Shows a mountainous basin with drainage into an ocean. Parts labeled include: evaporation, transpiration, condensation, precipitation, ice and snow melt, surface runoff into such freshwater storage areas as lakes and streams. Infiltration into the ground to aquifers and springs are also included. Finally, remaining streamflow and groundwater drain into the ocean.
File Name:
hydro_cycle.jpg
Credits:
The COMET Program
Copyright Terms:
COMET Standard Terms
of Use
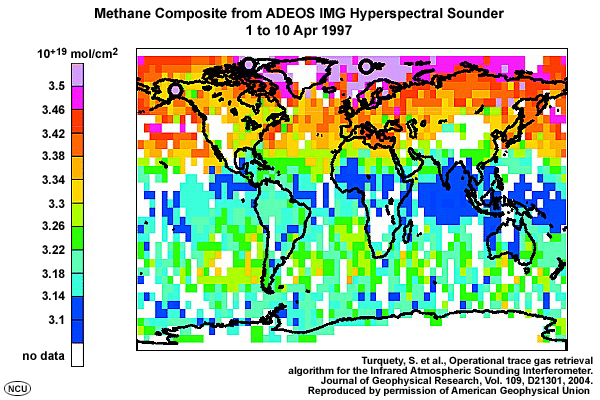
Description:
Global composite of total column methane from the ADEOS IMG hyperspectral sounder, 1 to 10 April 1997.
File Name:
iasi_methane.jpg
Credits:
NASA
Copyright Terms:
COMET Standard Terms
of Use
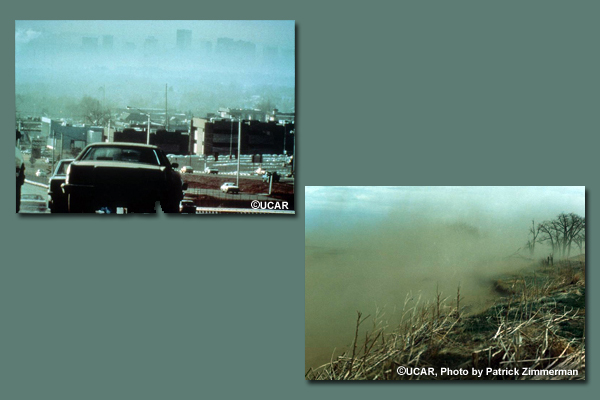
Description:
(upper left) Pollution: Contributors to Denver's Brown Cloud (lower right) Pollution: biomass burning
File Name:
iasi_n2o.jpg
Credits:
use same as on originals
Copyright Terms:
COMET Standard Terms
of Use
Description:
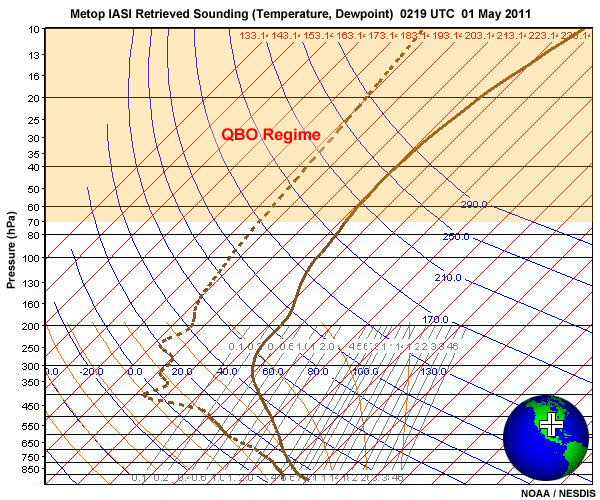
Retrieved sounding of temperature and dewpoint from the Metop IASI hyperspectral sounder 0219 UTC, May 1, 2011.
File Name:
iasi_noaa_profile.jpg
Credits:
NOAA / NESDIS
Copyright Terms:
COMET Standard Terms
of Use

Description:
Animation showing SO2 concentrations derived from IASI spreading out over the polar regions from 21 to 24 May 2011
File Name:
iasi_so2concentrat_may2011_0001.htm
Credits:
© 2011 EUMETSAT
Copyright Terms:
COMET Standard Terms
of Use
Description:
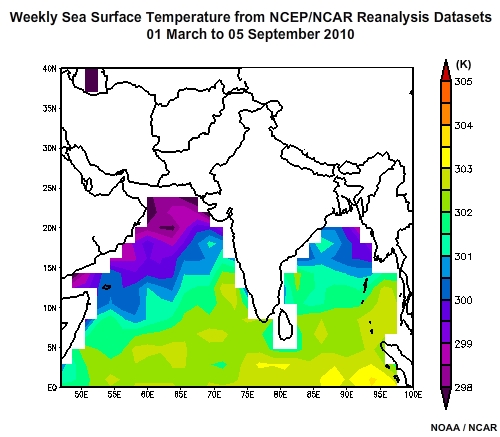
Weekly sea surface temperature plots from NCEP/NCAR reanalysis datasets covering the Arabian Sea and Indian Ocean from 1 March to 4 September 2010 during the pre-monsoon and peak-monsoon seasons.
File Name:
io_sst_ani_0001.htm
Credits:
NOAA / NCAR
Copyright Terms:
COMET Standard Terms
of Use
Description:
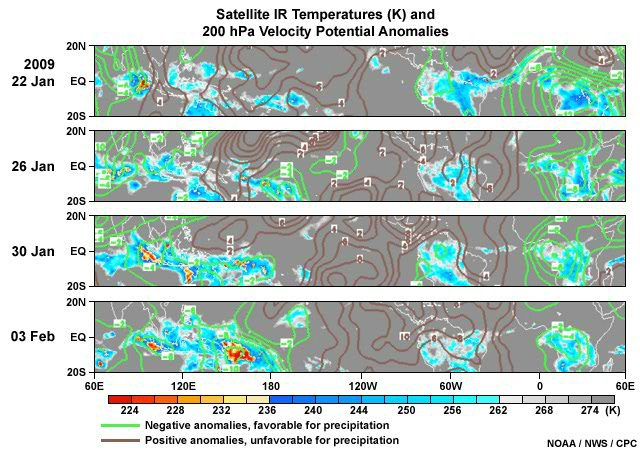
Multi-panel depiction of satellite infrared cloud top temperatures and 200 hPa velocity potential anomalies from 22 January to 18 February, 2009, highlighting eastward progression of the MJO.
File Name:
ir_temp_vel_anom_0001.htm
Credits:
NOAA / NWS / CPC
Copyright Terms:
COMET Standard Terms
of Use
Description:
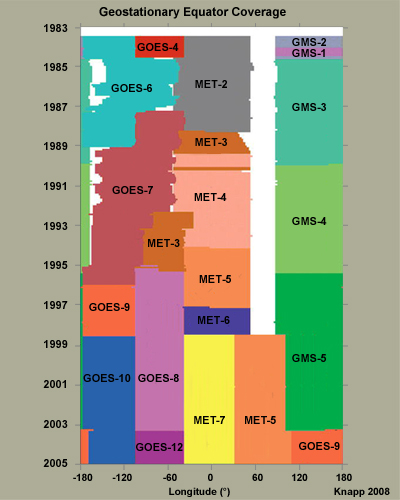
Graphical depiction of the US and EUMETSAT geostationary satellites covering the equator since 1983
File Name:
isccp_geo_coverage_carpet.jpg
Credits:
Knapp 2008
Copyright Terms:
COMET Standard Terms
of Use
Description:
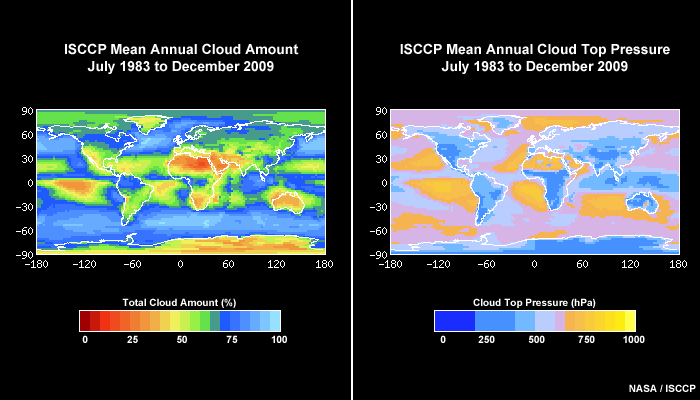
ISCCP (International Cloud Climatology Project) images of global mean annual cloud amount and cloud top pressure for the period from July 1983 to December 2009.
File Name:
isccp_mean_annual.jpg
Credits:
NASA / ISCCP
Copyright Terms:
COMET Standard Terms
of Use
Description:
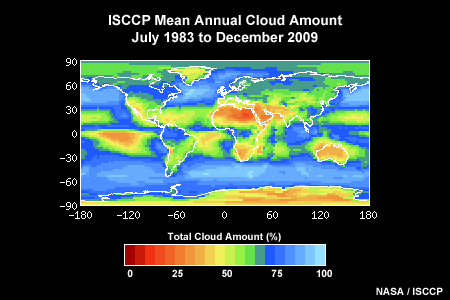
ISCCP (International Cloud Climatology Project) image of global mean annual cloud amount for the period from July 1983 to December 2009.
File Name:
isccp_mean_annual_cld_amt.jpg
Credits:
NASA / ISCCP
Copyright Terms:
COMET Standard Terms
of Use
Description:
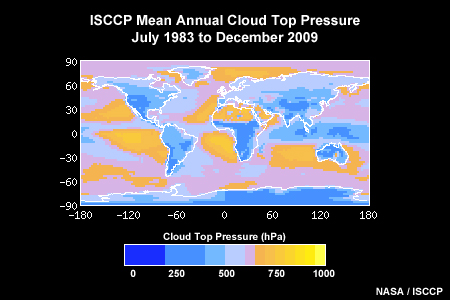
ISCCP (International Cloud Climatology Project) image of global mean annual cloud top pressure for the period from July 1983 to December 2009.
File Name:
isccp_mean_annual_ctp.jpg
Credits:
NASA / ISCCP
Copyright Terms:
COMET Standard Terms
of Use
Description:
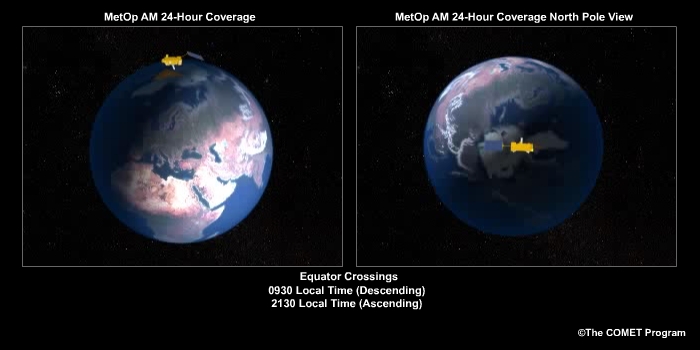
Animation showing the 24-hr coverage of METOP, a polar-orbiting satellite
File Name:
leo.mp4
Credits:
©The COMET Program
Copyright Terms:
COMET Standard Terms
of Use
Description:
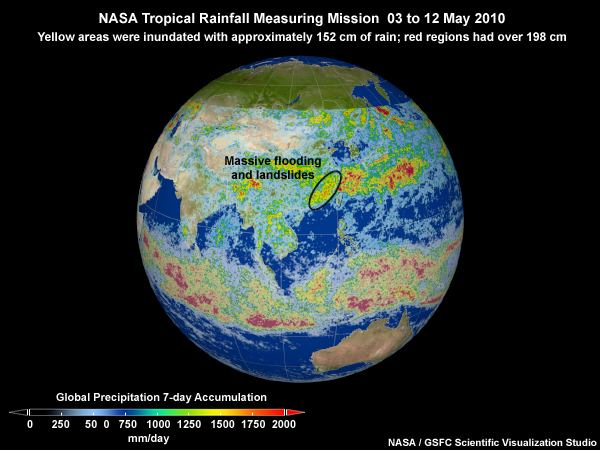
NASA's Tropical Rainfall Monitoring Mission (TRMM) satellite showing massive flooding and landslides in south central and southeast China from 03 to 12 May 2010.
File Name:
may_flood_trmm.jpg
Credits:
NASA / GSFC Scientific Visualization Studio
Copyright Terms:
COMET Standard Terms
of Use
Description:
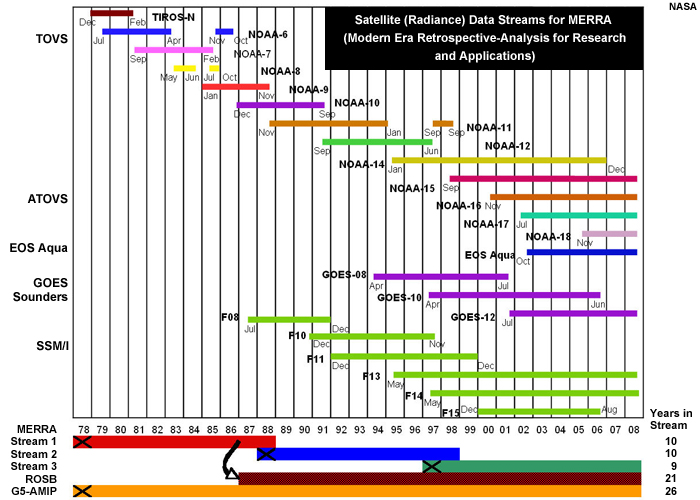
Graph showing satellite (radiance) data streams from 1978 to 2008 for MERRA (Modern Era Retrospective-Analysis for Research and Applications)
File Name:
merra_input_data.jpg
Credits:
NASA
Copyright Terms:
COMET Standard Terms
of Use
Description:
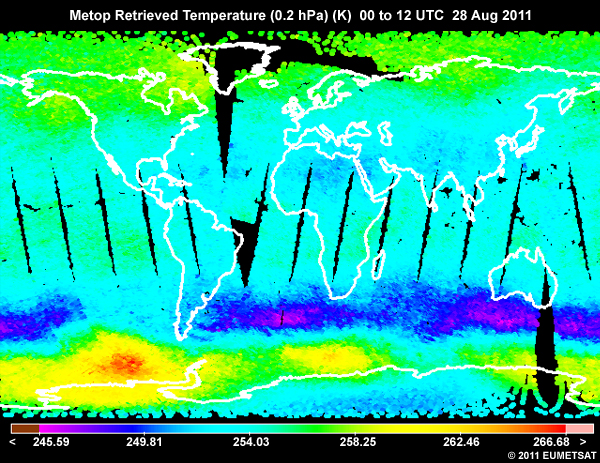
Metop Retrieved Temperature (0.2 hPa) 00 to 12 UTC 28 Aug 2011
File Name:
metop_temp.jpg
Credits:
copyright 2011 EUMETSAT
Copyright Terms:
COMET Standard Terms
of Use
Description:
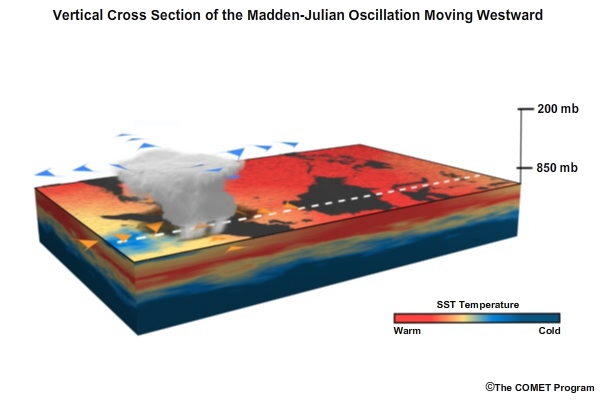
Vertical cross section of the Madden-Julian Oscillation moving eastward from the Indian to Pacific Oceans
File Name:
mjo_conceptual.mp4
Credits:
©The COMET Program
Copyright Terms:
COMET Standard Terms
of Use
Description:
3-panel depiction of the typical setup for a heavy wintertime precipitation event over the U.S. West Coast related to the MJO
File Name:
mjo_north_america_rain.gif
Credits:
The COMET Program / NASA
Copyright Terms:
COMET Standard Terms
of Use
Description:
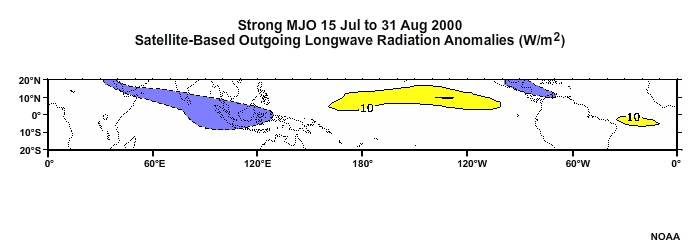
40 Days of Satellite-Based Outgoing Longwave Radiation Anomalies
10 Nov 2009 to 19 Dec 2009 ISCCP (International Cloud Climatology Project) image of global mean annual cloud top pressure for the period from July 1983 to December 2009.
File Name:
mjo_olr_ani_0001.htm
Credits:
NOAA
Copyright Terms:
COMET Standard Terms
of Use
Description:
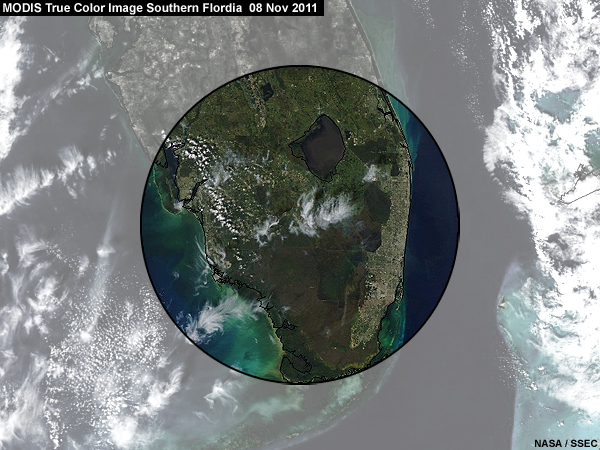
MODIS true color image of South Florida 10 Nov 2011
File Name:
modis_clear_blurry.jpg
Credits:
NASA / SSEC
Copyright Terms:
COMET Standard Terms
of Use
Description:
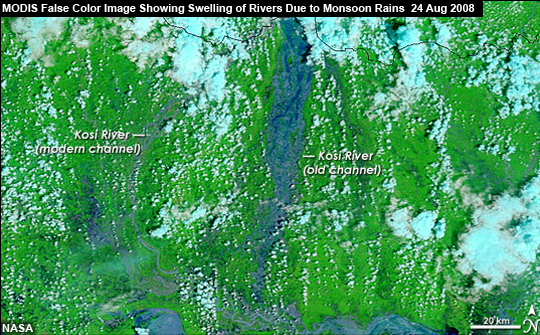
MODIS False Color Image showing swelling of rivers due to monsoon rains in northern India, 24 Aug 2008
File Name:
modis_falsecolor_kosiriver_24aug2008.jpg
Credits:
NASA
Copyright Terms:
COMET Standard Terms
of Use
Description:
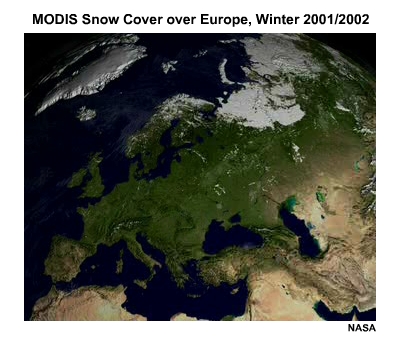
MODIS animation showing snow cover over Europe over the winter of 2001-2002
File Name:
modis_snowcover_europe_2001_02.mp4
Credits:
NASA
Copyright Terms:
COMET Standard Terms
of Use
Description:
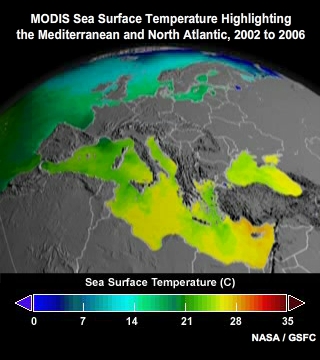
Animation showing a 32-day moving average of SST data spanning from 04 Jul 2002 to 23 Oct 2006
File Name:
modis_sst_2002to2006.mp4
Credits:
NASA / GSFC
Copyright Terms:
COMET Standard Terms
of Use
Description:
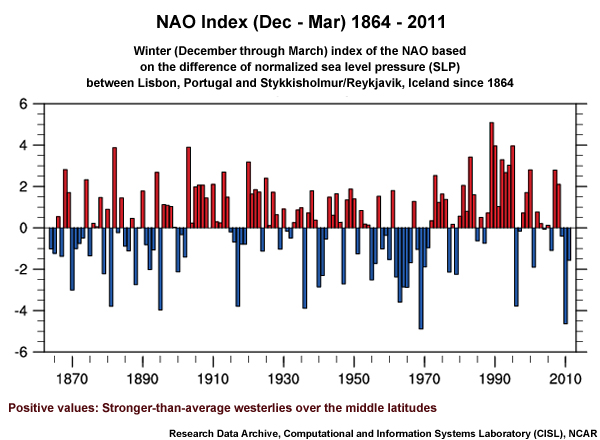
NAO Index from winter months of December to March from 1864 to 2011
File Name:
nao_index_1864_2011.jpg
Credits:
RDA, CISL, NCAR
Copyright Terms:
COMET Standard Terms
of Use
Description:
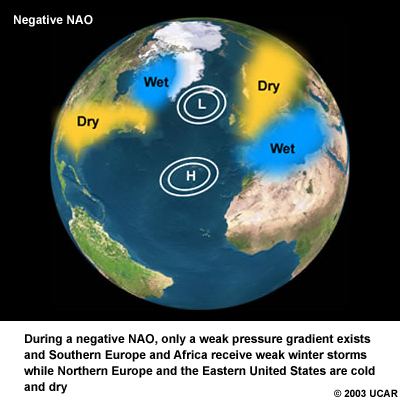
Image of the Earth showing a negative North Atlantic Oscillation with high/low and wet/dry areas highlighted
File Name:
nao_negative.jpg
Credits:
© 2003 UCAR
Copyright Terms:
COMET Standard Terms
of Use
Description:
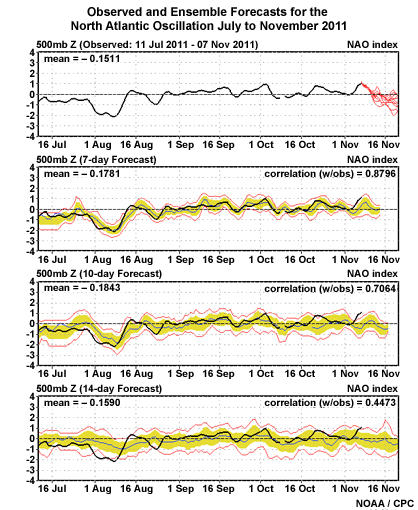
Observed and Ensemble Forecasts for the North Atlantic Oscillation
File Name:
nao_observed_ensemble_fcst.jpg
Credits:
NOAA / CPC
Copyright Terms:
COMET Standard Terms
of Use
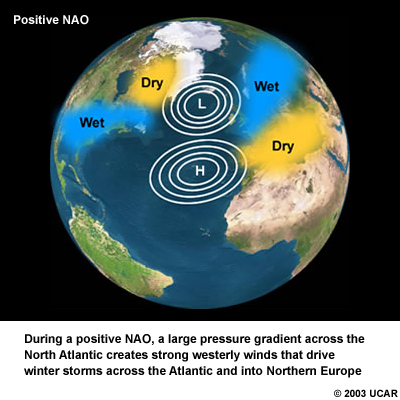
Description:
Image of the Earth showing a positive North Atlantic Oscillation with high/low and wet/dry areas highlighted
File Name:
nao_positive.jpg
Credits:
© 2003 UCAR
Copyright Terms:
COMET Standard Terms
of Use
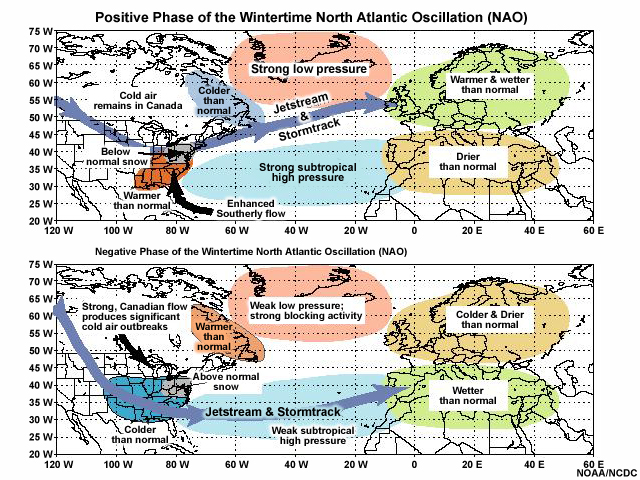
Description:
Positive and negative phases of the wintertime North Atlantic Oscillation (NAO).
File Name:
nao_wintertime.jpg
Credits:
NOAA/NCDC
Copyright Terms:
COMET Standard Terms
of Use

Description:
Conceptual graphic showing a warm El Nino episode in the Pacific Ocean from December to February
File Name:
ninoimpacts1.jpg
Credits:
NCEP / CPC / NOAA
Copyright Terms:
COMET Standard Terms
of Use
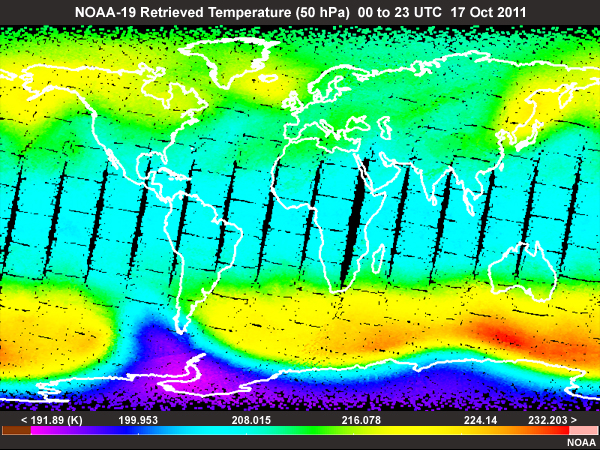
Description:
NOAA-19 Retrieved Temperature (50 mb) for 00 UTC to 23 UTC 17 Oct 2011
File Name:
noaa19_50mbtemp.jpg
Credits:
NASA
Copyright Terms:
COMET Standard Terms
of Use
Description:
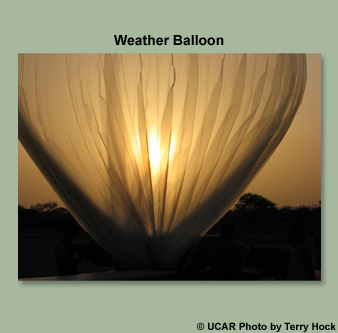
Photograph of a weather balloon
File Name:
obser_systems_balloon.jpg
Credits:
©The COMET Program / UCAR
Copyright Terms:
COMET Standard Terms
of Use
Description:
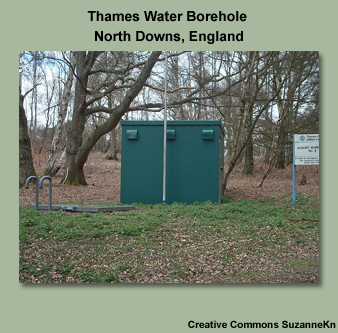
Photograph of the Thames Water borehole, North Downs, England
File Name:
obser_systems_borehole.jpg
Credits:
SuzanneKn
Copyright Terms:
COMET Standard Terms
of Use
Description:
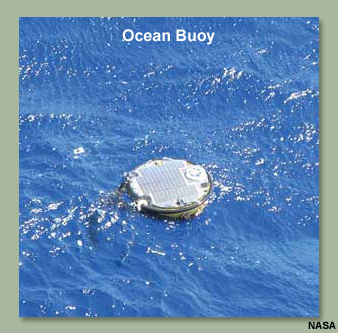
Photograph of an ocean bouy
File Name:
obser_systems_buoy.jpg
Credits:
The COMET Program & NASA
Copyright Terms:
COMET Standard Terms
of Use
Description:
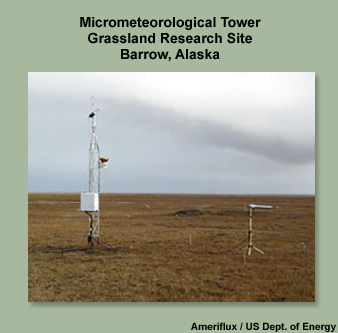
Photograph of a micrometeorological tower at the Grassland Research Site, Barrow Alaska
File Name:
obser_systems_micrometower.jpg
Credits:
©The COMET Program & Ameriflux / US Dept. of Energy
Copyright Terms:
COMET Standard Terms
of Use
Description:
Photograph of a geostationary and polar-orbiting satellites and their coverage
File Name:
obser_systems_sat.jpg
Credits:
©The COMET Program
Copyright Terms:
COMET Standard Terms
of Use
Description:
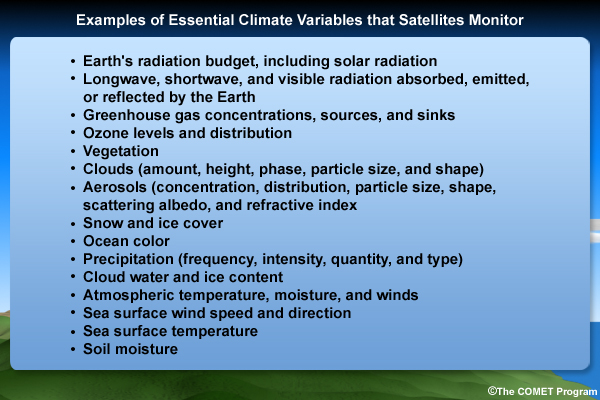
Graphic listing some of the Essential Climate Variables that satellite monitor
File Name:
obser_systems_sats_ecvs.jpg
Credits:
©The COMET Program
Copyright Terms:
COMET Standard Terms
of Use
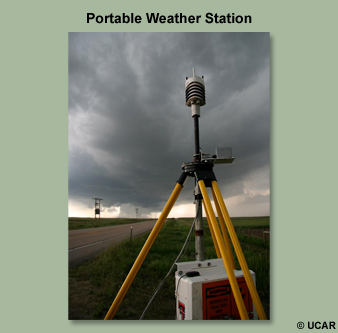
Description:
Photograph of a portable weather station
File Name:
obser_systems_wxstat.jpg
Credits:
©The COMET Program / UCAR
Copyright Terms:
COMET Standard Terms
of Use
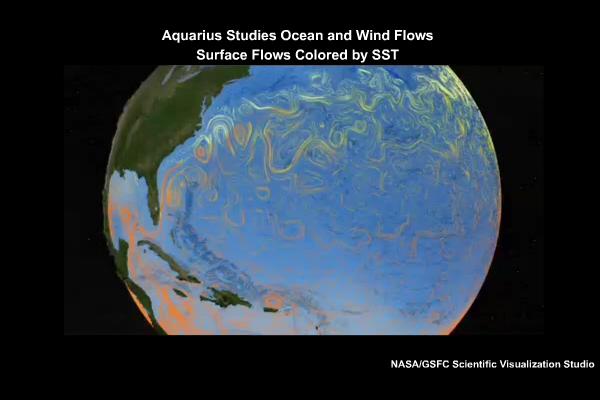
Description:
Animation showing a 32-day moving average of SST data spanning from 04 Jul 2002 to 23 Oct 2006
File Name:
ocean_circulation_comp.mp4
Credits:
NASA/GSFC Scientific Visualization Studio
Copyright Terms:
COMET Standard Terms
of Use
Description:
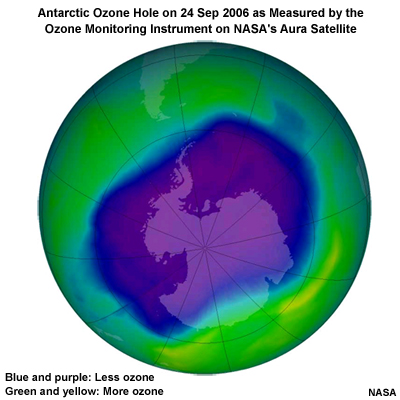
Antarctic Ozone Hole on 24 Sep 2006 as Measured by the Ozone Monitoring Instrument on NASA's Aura Satellite
File Name:
omi_ozone_hole_24sep06.jpg
Credits:
NASA
Copyright Terms:
COMET Standard Terms
of Use
Description:
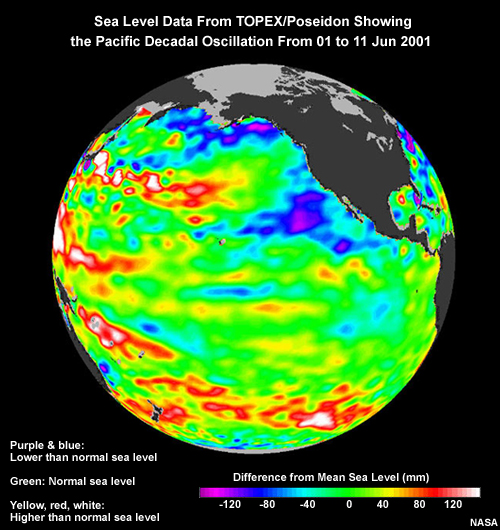
Sea level data from TOPEX/Poseidon showing the Pacific Decadal Oscillation from 01 to 11 Jun 2001
File Name:
pdo_sea_level.jpg
Credits:
NOAA / ESRL
Copyright Terms:
COMET Standard Terms
of Use
Description:
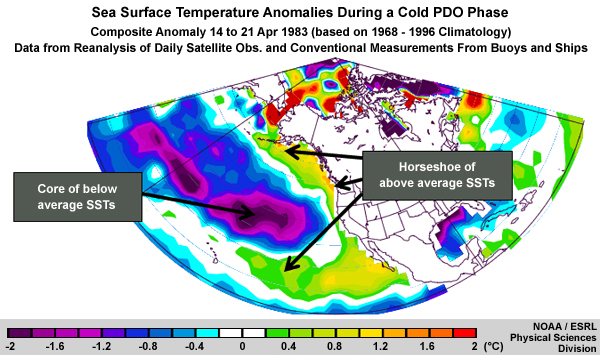
Sea Surface Temperature Anomalies During a Cold PDO Phase
File Name:
pdo_sst_cold_phase.jpg
Credits:
NOAA / ESRL Physical Sciences Division
Copyright Terms:
COMET Standard Terms
of Use
Description:
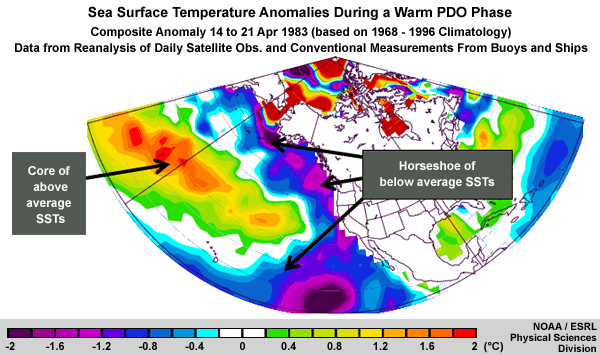
Sea Surface Temperature Anomalies During a Warm PDO Phase
File Name:
pdo_sst_warm_phase.jpg
Credits:
NOAA / ESRL Physical Sciences Division
Copyright Terms:
COMET Standard Terms
of Use
Description:
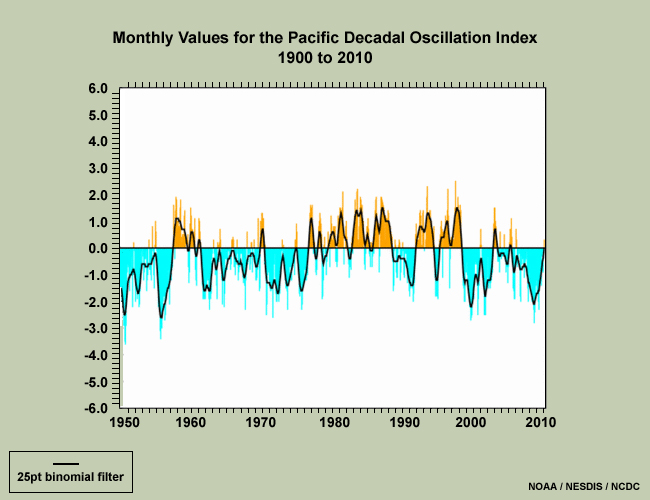
Plot showing monthly values for the Pacific Decadal Oscillation (PDO) index from 1900 to 2010
File Name:
pdo-f-pg.jpg
Credits:
NOAA / NESDIS / NCDC
Copyright Terms:
COMET Standard Terms
of Use
Description:
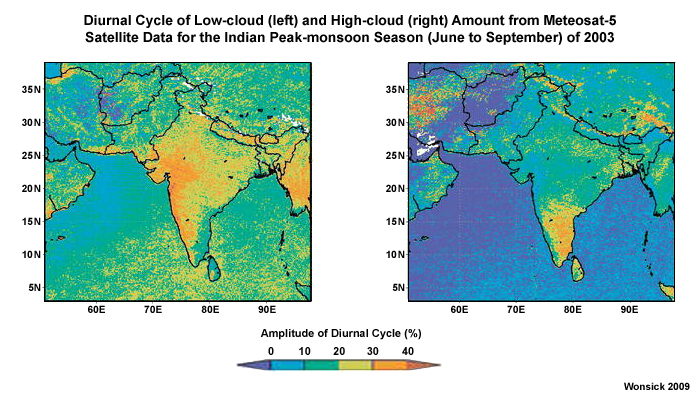
Diurnal cycle of low and high cloud amount from Meteosat-5 satellite data for the Indian peak-monsoon season (June to September) 2003
File Name:
peak_monsoon_cld_cover.jpg
Credits:
Wonsick 2009
Copyright Terms:
COMET Standard Terms
of Use
Description:
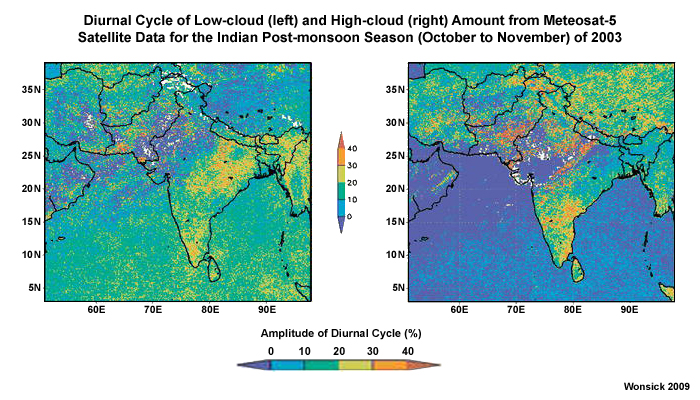
Diurnal cycle of low and high cloud amount from Meteosat-5 satellite data for the Indian post-monsoon season (October to November) 2003
File Name:
post_monsoon_cld_cover.jpg
Credits:
Wonsick 2009
Copyright Terms:
COMET Standard Terms
of Use
Description:
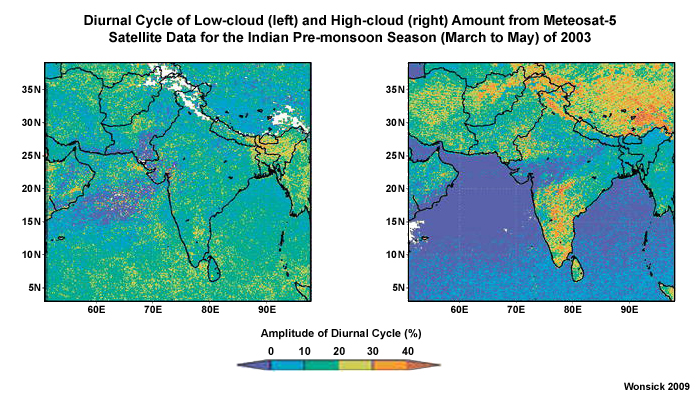
2 panel graphic showing the diurnal cycle of low and high clouds from Meteosat-5 satellite data for the Indian pre-monsoon season (March to May), 2003
File Name:
pre_monsoon_cld_cover.jpg
Credits:
Wonsick 2009
Copyright Terms:
COMET Standard Terms
of Use
Description:
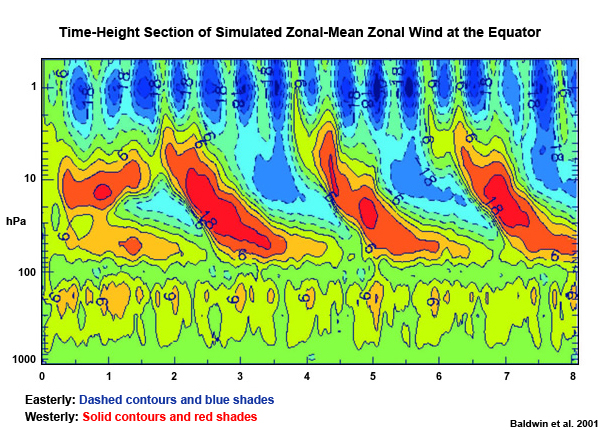
Time-height cross-section of the equatorial zonal-mean zonal winds simulated by Takahashi. Westerly (red) and easterly (blue) winds have 6 m s-1 contour interval.
File Name:
qbo_temporal_height.jpg
Credits:
Baldwin et al. 2001
Copyright Terms:
COMET Standard Terms
of Use
Description:
Graphic showing idealized radiation scattering and absorbtion in the atmosphere and at Earth's surface.
File Name:
radiation_processes.gif
Credits:
© The COMET Program
Copyright Terms:
COMET Standard Terms
of Use
Description:
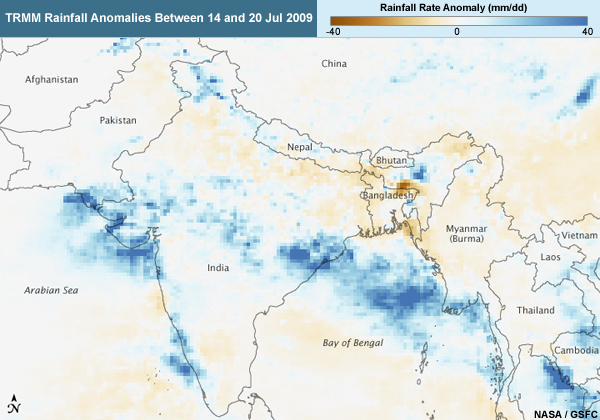
Rainfall anomaly map from the TRMM satellite showing anomalies in India and SE Asia from 14 to 20 July 2009
File Name:
rainfall_anom_india_july2009.jpg
Credits:
NASA / GSFC
Copyright Terms:
COMET Standard Terms
of Use

Description:
MODIS true color image showing the Saharan air layer off West Africa on 7 Jan 2002
File Name:
sal_modis.jpg
Credits:
NASA
Copyright Terms:
COMET Standard Terms
of Use
Description:
MODIS true color image showing the Saharan air layer off West Africa on 7 Jan 2002
File Name:
sal_modis.jpg
Credits:
NASA
Copyright Terms:
COMET Standard Terms
of Use
Description:
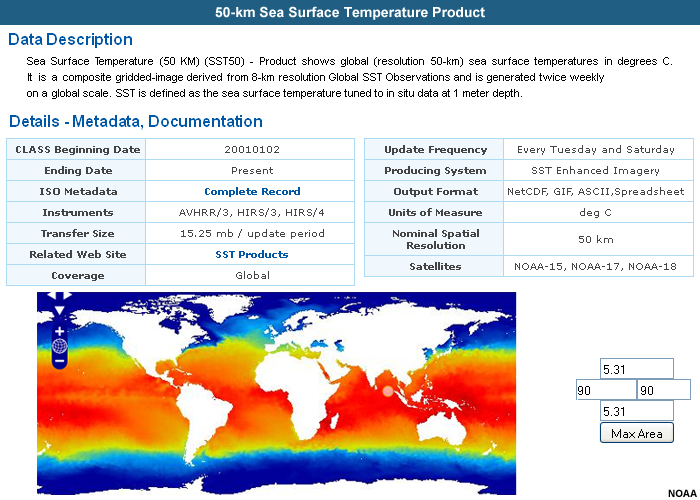
Metadata and sample image of global 50-km satellite-derived sea surface temperature product as archived by NOAA's CLASS archive system.
File Name:
sample_metadata.jpg
Credits:
NOAA
Copyright Terms:
COMET Standard Terms
of Use
Description:
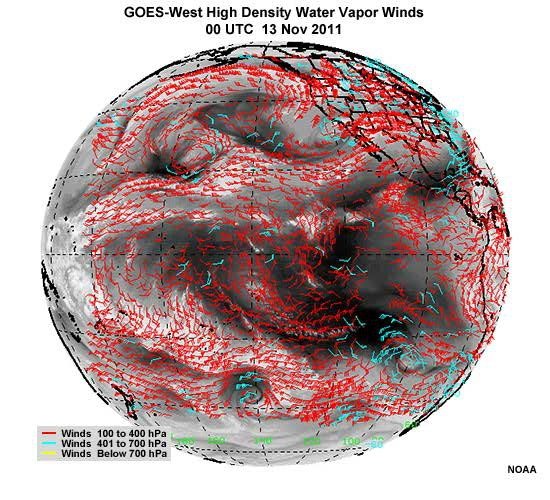
GOES-West high density water vapor winds product from 00 UTC 13 November to 00 UTC 14 November 10, 2011.
File Name:
sat_wv_winds_0001.htm
Credits:
NOAA
Copyright Terms:
COMET Standard Terms
of Use
Description:
Animation showing changes in sea ice from NASA's Aqua satellite from 1979 through 2010
File Name:
sea_ice_ani.mp4
Credits:
NASA / GSFC Scientific Visualization Studio
Copyright Terms:
COMET Standard Terms
of Use
Description:
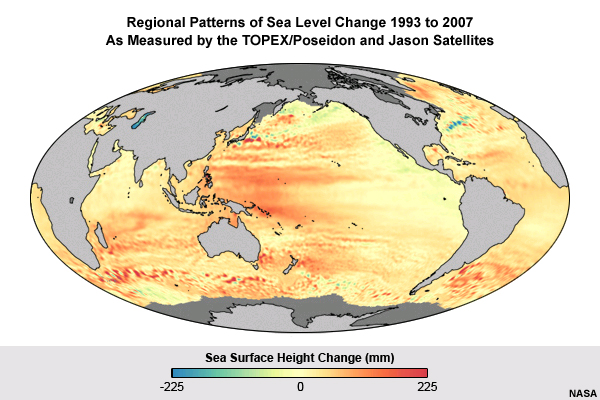
Regional Patterns of Sea Level Change 1993 to 2007 As Measured by the Topex and Jason 1 Satellites
File Name:
sea_sfc_height_topaz_jason1.jpg
Credits:
NASA
Copyright Terms:
COMET Standard Terms
of Use
Description:
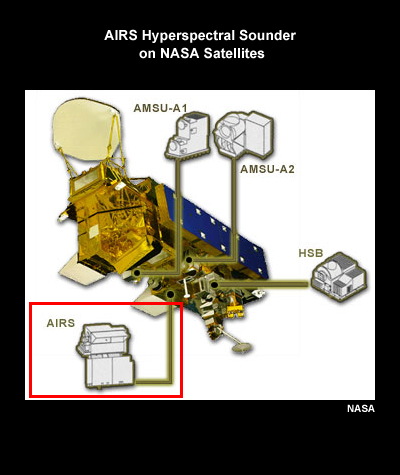
AIRS Hyperspectral Sounder on NASA Satellites
File Name:
sounding_instruments_airs.jpg
Credits:
NASA
Copyright Terms:
COMET Standard Terms
of Use
Description:
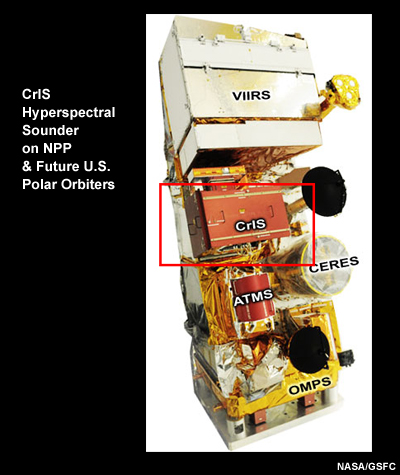
Image of the CrIS Hyperspectral Sounder on NPP & Future U.S. Polar Orbiters
File Name:
sounding_instruments_cris.jpg
Credits:
NASA/GSFC
Copyright Terms:
COMET Standard Terms
of Use
Description:
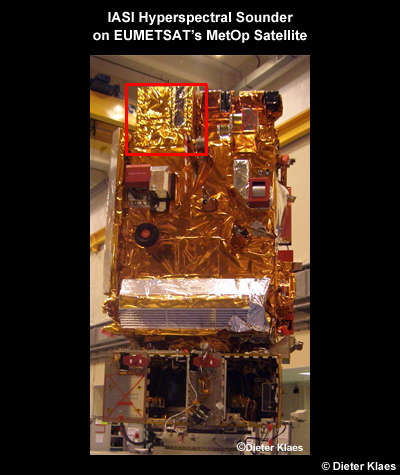
Image of EUMETSAT's IASI instrument on its Metop polar orbiter
File Name:
sounding_instruments_iasi.jpg
Credits:
copyright Dieter Klaes
Copyright Terms:
COMET Standard Terms
of Use
Description:
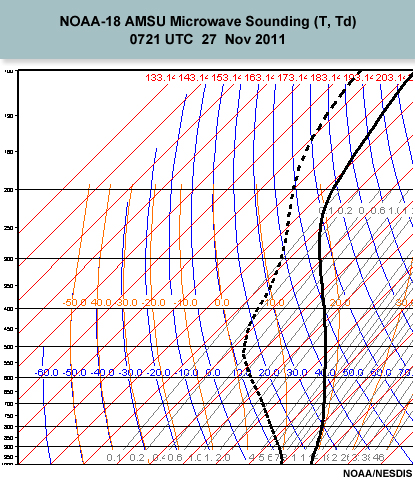
NOAA-18 AMSU Microwave Sounding (T, Td) from 0721 UTC 27 Nov 2011
File Name:
soundings_amsu.jpg
Credits:
NOAA / NESDIS
Copyright Terms:
COMET Standard Terms
of Use

Description:
NOAA-18 HIRS Infrared Sounding (T, Td) from 0721 UTC 27 Nov 2011
File Name:
soundings_hirs.jpg
Credits:
NOAA / NESDIS
Copyright Terms:
COMET Standard Terms
of Use
Description:
Splash graphic for the module "Monitoring the Climate System with Satellites"
File Name:
splash.jpg
Credits:
NOAA / NASA / The COMET Program
Copyright Terms:
COMET Standard Terms
of Use
Description:
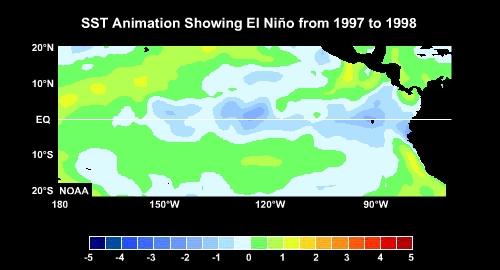
SST animation showing El Niño from 1997 to 1998
File Name:
sst_9798_el_nino_animated.mp4
Credits:
NOAA
Copyright Terms:
COMET Standard Terms
of Use

Description:
Animation of 50 days of solar activity from GOES-12 SXI.
File Name:
SXI50D_20011019.mp4
Credits:
NOAA
Copyright Terms:
COMET Standard Terms
of Use
Description:
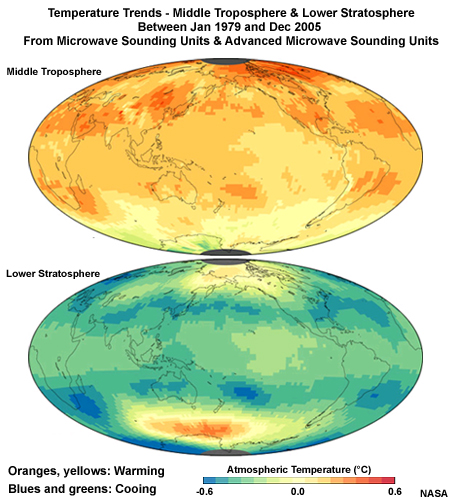
Temperature Trends in the Middle and Lower Troposphere Between Jan 1979 and Dec 2005 From Microwave Sounding Units & Advanced Microwave Sounding Units
File Name:
temp_trends_trop_strat.jpg
Credits:
NASA
Copyright Terms:
COMET Standard Terms
of Use
Description:
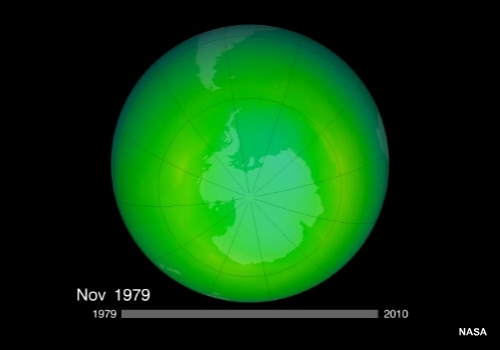
False-Color View of Total Ozone Over the Antarctic pole from 1979 to 2010
File Name:
toms_ozone_1979to2010_0001.htm
Credits:
NASA
Copyright Terms:
COMET Standard Terms
of Use
Description:
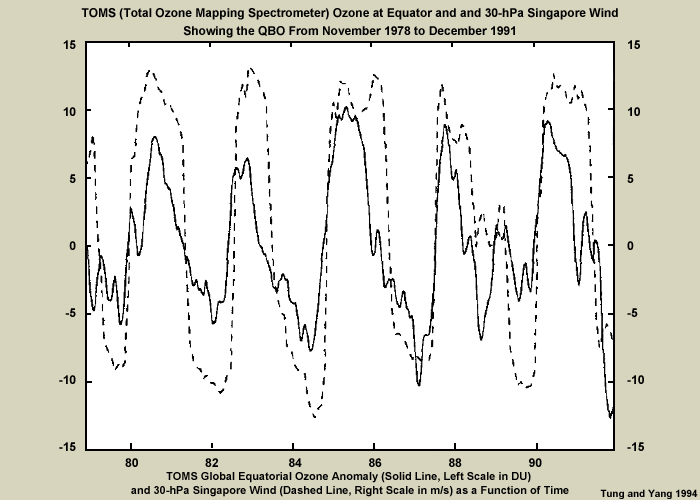
A plot showing TOMS (Total Ozone Mapping Spectrometer) equatorial ozone anomalies and 30-mb Singapore winds
File Name:
toms_ozone_qbo_equator.jpg
Credits:
Tung and Yang 1994
Copyright Terms:
COMET Standard Terms
of Use

Description:
Conceptual illustration of trace gases and the greenhouse effect
File Name:
trace_gases_greenhouse_effect.jpg
Credits:
copyright The COMET Program
Copyright Terms:
COMET Standard Terms
of Use
Description:
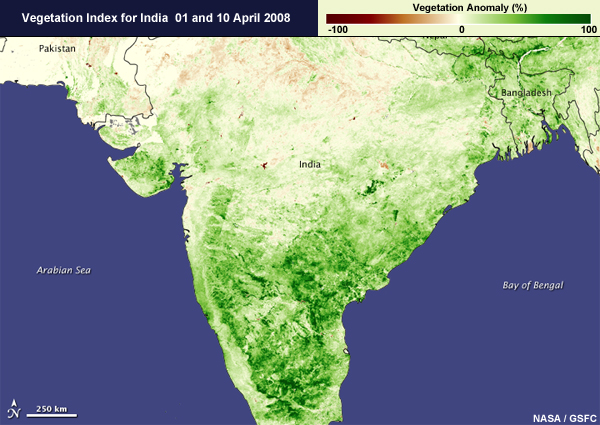
Vegetation index for India from 1 to 10 April 2008
File Name:
veg_index_india_apr2008.jpg
Credits:
NASA / GSFC
Copyright Terms:
COMET Standard Terms
of Use