Produced by The COMET® Program
Introduction
The case describes the weather associated with the crash landing of American Airlines Flight 331 on 22 December 2009 at the Norman Manley Airport in Kingston, Jamaica. The airplane skidded during landing, overran the runway, broke through the perimeter fence, crossed a highway, and stopped about 40 meters from the Caribbean Sea. The fuselage broke into three major pieces but there were no fatalities; however, numerous injuries were reported.
Heavy rain and a 7 m/s (14 kt) tail wind component were reported at the time of the accident. We will examine synoptic charts, satellite imagery, soundings, and radar imagery to identify features that created hazards to this flight prior to and during landing including heavy rainfall, severe weather, low visibility, low ceiling, and turbulence.
Case Timeframe
22 December 2009 (22-23 December)
Phenomena of Interest
Quasi-stationary front, squall lines, upper-level cyclone and trough, upper-level jet streak, a developing surface low, and a low-level jet.
Forecasting Challenges
- Recognize the key synoptic ingredients that can lead to heavy rainfall and severe weather
- Identify heavy rainfall and severe weather features in satellite imagery
- Identify mesoscale and severe weather signatures in the radar imagery
- Recognize key synoptic ingredients that can lead to turbulence
Geography and Climatology
The island of Jamaica is in the northwest Caribbean (Fig. 1). It has a mountainous interior with maximum elevation of 2256 meters.
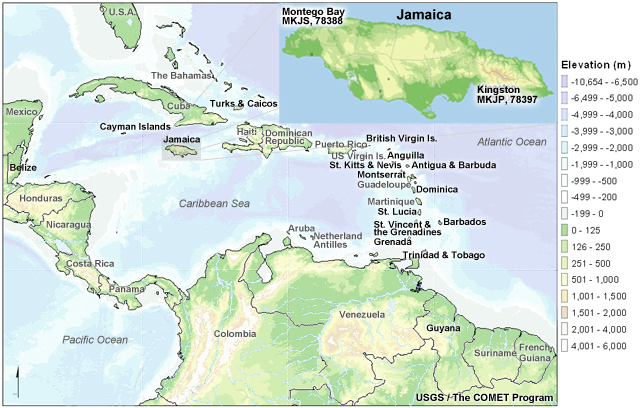
Fig.1. Map of the Caribbean showing elevation and bathymetry. Inset map shows Jamaica with parish boundaries and the observing stations at the international airports in Kingston (MKJP, 78397) and Montego Bay (MKJS, 78388). Caribbean Meteorological Organization (CMO) members are labeled in bold black.
The Doppler radar of the National Meteorological Service is located in the hills above Kingston and its long-range coverage of 480 km extends to Cuba, The Cayman Islands, and Haiti (Fig. 2).
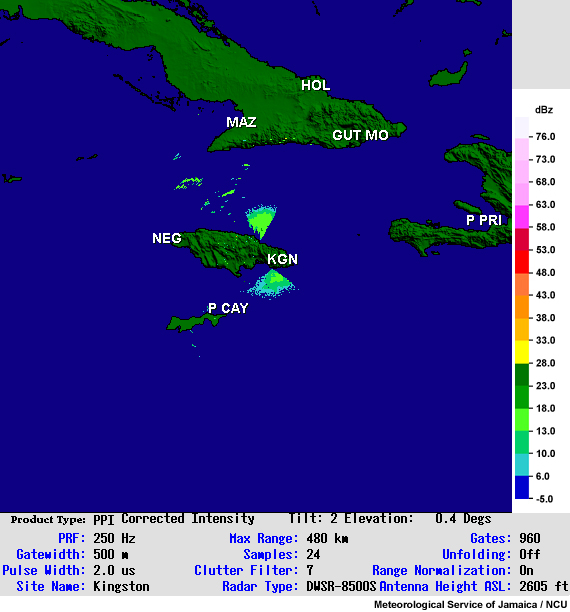
Fig. 2. Long range (480 km) Doppler radar map for Jamaica (courtesy of the National Meteorological Service of Jamaica).
Surface fronts, prefrontal troughs, and upper-level cyclones are the primary producers of heavy rainfall over the Greater Antilles of the Caribbean during winter. Winter is otherwise dry for most of the region.
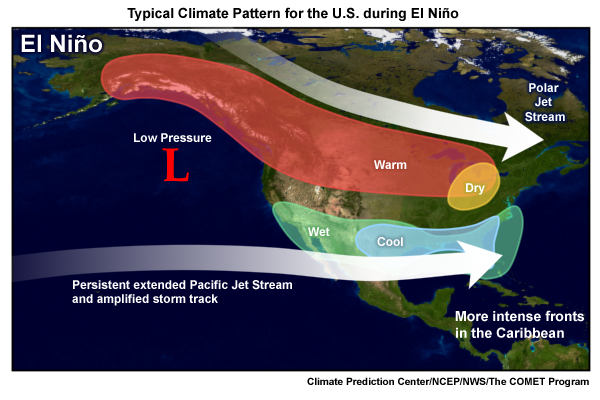
Fig.3. Schematic of the typical pattern of climate impacts during El Niño. The more southern storm track means that midlatitude cyclones and cold fronts extend far into the Caribbean and Central America.
During El Niño winters, midlatitude cyclones track well south of their normal positions (Fig. 3) and cold fronts can extend as far south as Central America. For example, fatal and record flash floods associated with fronts, prefrontal troughs, and upper-tropospheric troughs have occurred in Jamaica and Puerto Rico during El Niño winters. December 2009 was an El Niño period so these types of extratropical weather systems were expected to affect the Caribbean.
Common patterns that forecasters are advised to examine include:
- The location of surface fronts, troughs, and shear lines
- The amplitude of mid- and upper tropospheric circulations
- The position of upper-tropospheric jet streaks and low-level jets
Conceptual Model of Surface and Upper-air Cyclone Structure
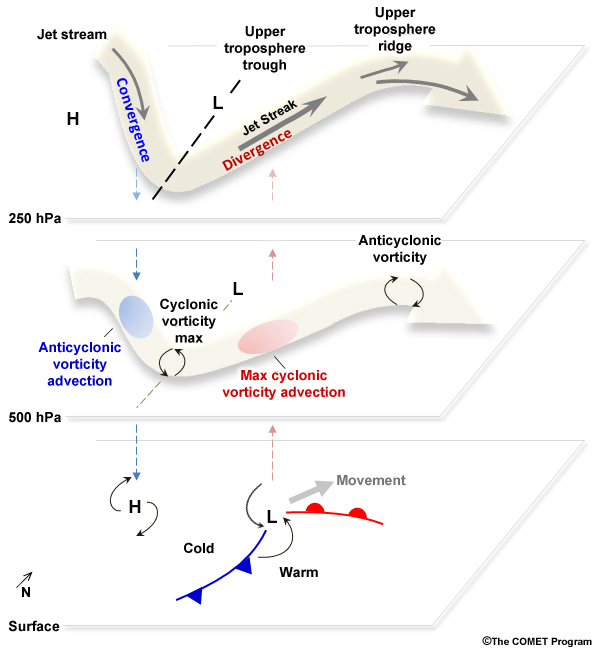
Fig. 4. Conceptual model of a midlatitude cyclone at the surface, 500 hPa, and 250 hPa. Note the alignment of the surface low pressure center with mid-level cyclonic vorticity advection and upper-level divergence.
Midlatitude cyclones form in regions of strong temperature gradients, frontal zones, where cold and warm air masses meet. Cyclones form because of baroclinic instability; the atmosphere becomes unstable as temperature and density gradients develop between warm and cold air.
The conceptual diagram shows where a surface cyclone is most likely to develop relative to an upper-level wave known as a Rossby wave (Fig. 4). Rossby waves are the dominant synoptic waves in the midlatitudes. Upper-level divergence moves air out of the column leading to rising motion and lowering of surface pressure. Rising motion also leads to clouds and precipitation. Cyclonic vorticity advection in the mid-upper troposphere increases flow into the surface low. Upper-level waves become intense with meridional orientation, when cold, sinking air is moving towards the equator and warm, rising air is moving poleward. The cold air advection amplifies the upper-level wave, which enhances upper-level divergence and intensifies the surface low.
The polar jet stream occurs aloft of strong temperature gradients. It occurs at 10-13 km (30000–40000 ft) above the surface. Wind speed maxima within the jet stream are called jet streaks. Divergence in the entrance region of the jet streak induces low-level convergence, acceleration of the wind at low-levels, and rising motion along sloped isentropic surfaces towards the divergent region (Fig. 5).
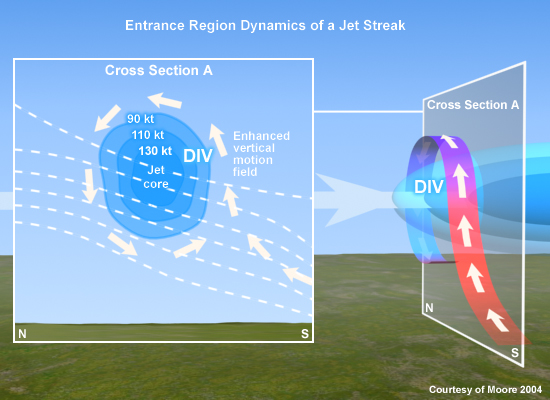
Fig. 5. Conceptual diagram of secondary circulation associated with the entrance region of an upper-tropospheric jet streak. Vertical motion is due to sloped ascent of the accelerating low-level wind towards the upper-level divergence in the jet entrance region.
The COMET webcast, Jet Streak Circulations, shows that upper-level divergence is maximized for a wave with:
- large amplitude
- short wavelength
- strong winds at the jet streak level
- strong shear between jet streak level and the level of non-divergence (500-600 hPa)
Mesoscale Convective System (MCS) and Environments
Fig 6a
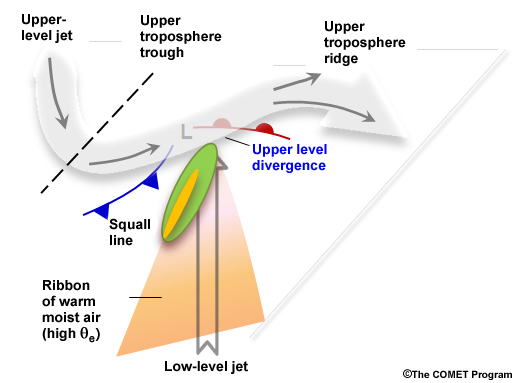
Fig. 6. (a) Schematic of key features associated with midlatitude, prefrontal squall lines. Green and yellow shades represent the radar reflectivity signature of squall line (linear MCS). (b) Conceptual model of an MCS moving left to right. Shown qualitatively as a low-level horizontal slice through the radar reflectivity of the system. The blue line ahead of the low-level reflectivity core marks the system gust front. Point A shows a gust front that stays close to the leading deep updrafts of the system and a tight low-level reflectivity gradient. Both indicators suggest an enhanced likelihood for damaging winds near point A. Point B shows a gust front that has outrun the core, and a very broad reflectivity gradient. The damaging wind risk here is significantly lower than at point A.
Fig 6b
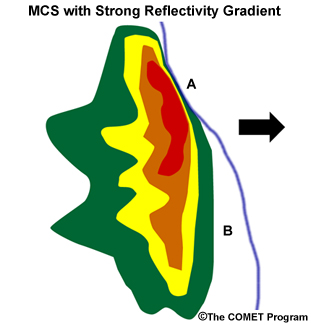
Fig. 6. (a) Schematic of key features associated with midlatitude, prefrontal squall lines. Green and yellow shades represent the radar reflectivity signature of squall line (linear MCS). (b) Conceptual model of an MCS moving left to right. Shown qualitatively as a low-level horizontal slice through the radar reflectivity of the system. The blue line ahead of the low-level reflectivity core marks the system gust front. Point A shows a gust front that stays close to the leading deep updrafts of the system and a tight low-level reflectivity gradient. Both indicators suggest an enhanced likelihood for damaging winds near point A. Point B shows a gust front that has outrun the core, and a very broad reflectivity gradient. The damaging wind risk here is significantly lower than at point A.
A squall line is an MCS that is oriented along a line. Squall lines tend to form in the warm sector of midlatitude cyclones, ahead of the cold front and downstream of the Rossby wave trough. Figure 6 depicts a common type of prefrontal squall line environment. Upper-divergence helps to trigger conditional instability and rising motion leading to deep convection. Winds at the low-levels of the warm sector accelerate in response, creating a low-level jet (Fig. 6). The low-level jet provides warm, moist air to prefrontal MCSs. The coupling of jets in the upper and lower troposphere supports strong ascent and long-lived MCSs. MCS formation is also aided by mid-level cyclonic vorticity advection (Fig. 4).
MCSs are easily identified and tracked in enhanced satellite IR and radar reflectivity images. For the environment shown in Fig. 6, typically individual cells move northeastward and the squall line moves ESE as new cells form ahead of the line.
Midlatitude Cyclones and Turbulence
Turbulence, develops because of wind shear. Figure 7 shows how turbulence is generated by vertical wind shear, the change in wind speed with height.
Fig 7a
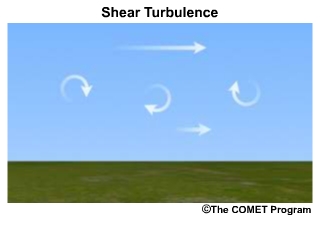
Fig. 7. (a) Schematic depiction of turbulence generated by shear. (b) Locations of turbulence areas associated with midlatitude cyclone and polar jet stream.
Fig 7b
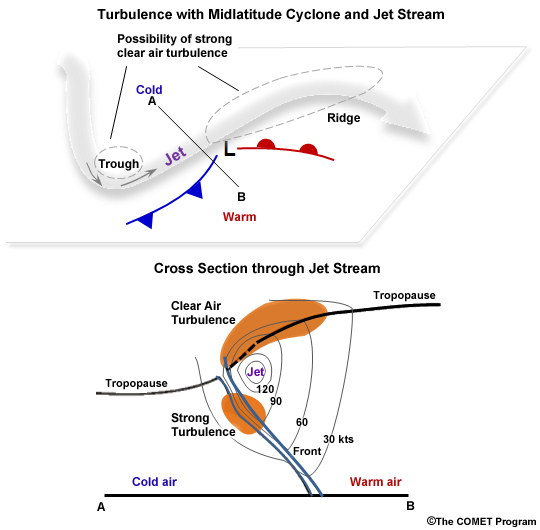
Fig. 7. (a) Schematic depiction of turbulence generated by shear. (b) Locations of turbulence areas associated with midlatitude cyclone and polar jet stream.
Several aspects of midlatitude cyclones contribute to turbulence, including:
- Upper-level jet stream
- Upper-level trough
- Fronts
- Vertical motion in thunderstorms
Jet streams cause both horizontal and vertical shear. Since jet streams are usually above all but cirrus clouds, the turbulence is often called clear-air-turbulence (CAT). Turbulence is common
- in the sloping tropopause above the jet core,
- in the front below the core, and
- on the low pressure side of the core (Fig. 7b).
Maximum shear exists on the edge of the jet where speed differences are large. Turbulence is common in cloud bands, called transverse bands, which are often oriented perpendicular to the jet stream. Abrupt wind shifts in sharply-curved upper-level troughs also generate turbulence (Fig. 7b). Fronts are likely places of turbulence because vertical shear is related to horizontal temperature gradients (through the thermal wind balance). Folding of the tropopause, associated with upper-level fronts, also induces turbulence.
Thunderstorm-related turbulence, also known as Convectively-induced Turbulence (CIT), occurs:
- Above thunderstorm tops – related to gravity waves that propagate vertically and break above the convection or to the collapse of convective updrafts. Long-lived thunderstorm systems, such as MCSs, can have significant vertical wind shear. Stronger shear cause more intense turbulence, but over smaller areas nearer to the cloud top, while intermediate shear creates turbulence over a larger volume of the convective cloud. Thunderstorm updrafts interact with overlying stable air.
- Displaced from the thunderstorm cloud but related to the cloud, 10s of km from individual thunderstorms and in radial bands in the outer anvils of MCSs and tropical cyclones – may be associated with high frequency gravity waves aligned perpendicular to the orientation of the bands. These radial bands produce Near-cloud Turbulence (NCT), within 100s of kilometers from the convective portion of an MCS, which is difficult to detect with standard on-board radar.
Case Challenge
- Recognize the key synoptic ingredients that can lead to heavy rainfall and severe weather.
- Identify heavy rainfall and severe weather features in satellite imagery.
- Identify mesoscale and severe weather signatures in the radar imagery.
- Recognize key synoptic ingredients that can lead to turbulence.
Synoptic Analysis
Surface Analysis
A cold front became quasi-stationary over the island from 20-22 December. This long front was oriented northeast-to-southwest across the Atlantic, Hispaniola, Jamaica and reached as far south as Central America (Fig. 8). Temperatures ahead of the front ranged from 28-29°C (82-84°F) while behind the range was 24-26°C (75-78°F).
Fig. 8. Unified surface analysis from 19 to 22 December 2009 showing the advancing then quasi-stationary cold front and developing low pressure over the Greater Antilles.
Question 1 of 2
Review the surface analysis in the 24 hrs prior to 1200 UTC 22 December 2009. How
would you expect the front to affect the weather in Kingston over the next 12 hours?
(Select all that apply.)
The correct answers are a) and c).
Heavy rainfall and showers are expected as warm moist air is lifted by cooler air at the front. Thunderstorms are also common in the warm sector ahead of the front. These conditions are expected to continue with a quasi-stationary front although occasional wind shifts may occur as the front oscillates.
Question 2 of 2
What will be the weather hazards for aviation operations?
(Select all that
apply.)
The correct answers are a), c) and d).
Heavy rainfall and showers will cause low visibility and low ceilings. Thunderstorms with strong updrafts and downdrafts will contribute to turbulence. Wind velocity shifts across the frontal boundary causes horizontal wind shear, which, in turn, can contribute to turbulence. For the northern hemisphere, winds are generally southerly to easterly south of the front and northerly to westerly north of the front. Winds are typically stronger along and behind the cold front in response to the strong gradients of temperature and pressure at the cold front.
250 hPa Analysis
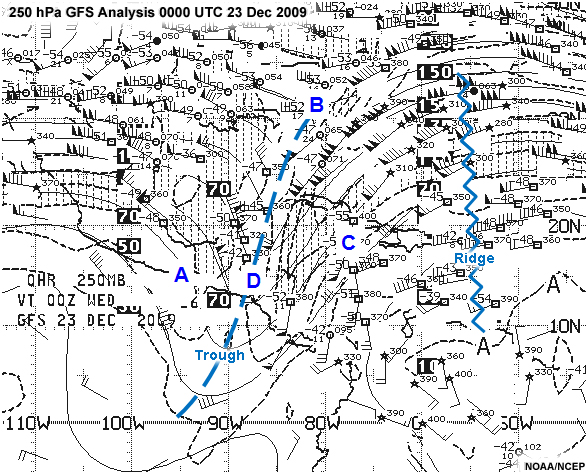
The surface front is coincident with an upper-tropospheric trough whose axis extended from Florida across Central America to the tropical east Pacific.
Question 1 of 2
Examine the 250 hPa synoptic chart at 0000 UTC 23 December 2009. Where would you
expect strong upper-level divergence? Choose the letter that best matches the
location.
(Choose the best answer.)
The correct answer is c).
This region, east of the trough and in the right entrance of the upper-level jet streak is favored for upper-level divergence.
Question 2 of 2
What are some words that could be used to describe the upper-tropospheric wave
pattern?
(Choose the best answer.)
The correct answer is a).
This is a large amplitude wave with a short wavelength and a jet streak that exceeds 80 m/s (160 kts). Recall that upper-level divergence is maximized for a wave with large amplitude, short wavelength, strong winds at the jet streak level, strong shear between jet streak level and the level of non-divergence (500-600 hPa).
Based on the conceptual model (Fig. 4), upper-level divergence is associated with rising motion, which, in this case, is coincident with a quasi-stationary surface front and a prefrontal trough (Fig. 8).
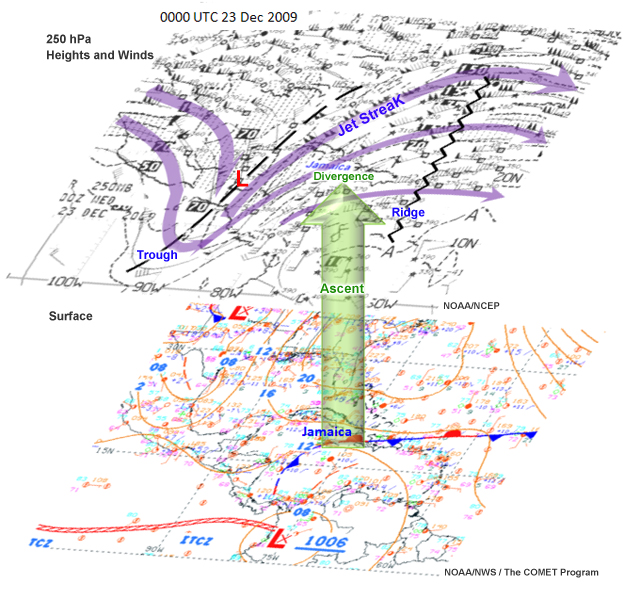
Fig. 9. 250 hPa heights and winds and the corresponding surface analysis. The green arrow represents rising motion that is induced by the upper-level divergence.
500 hPa Analysis
Winds at 500 hPa (Fig. 10) are an order of magnitude less than the jet streak winds and the wave amplitude is smaller. East of the 500 hPa trough is marked by cyclonic vorticity advection, which is maximized in the green-shaded area in Fig. 10.
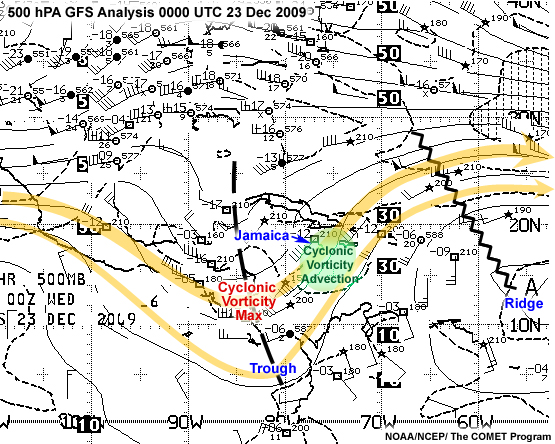
Fig. 10. 500 hPa heights and winds at 0000 UTC 23 December 2009. Green shaded area marks the area of maximum cyclonic vorticity advection.
As noted earlier, this upper-level wave pattern will induce strong upper-level divergence because it also has strong shear between jet streak level and the level of non-divergence (500-600 hPa).
Strong thunderstorms were observed in the vicinity of the front and ahead of the front. The coldest cloud tops were to the south and east of Jamaica, in the warm sector of the surface front and to the east of the upper-level trough where upper-level divergence abounds (Fig. 11).

Fig. 11. (upper) Surface analysis at 0000 UTC on 23 Dec 2009, overlaid with 250 hPa streamlines. Green-shaded area marks upper-level divergence. Coincident satellite water vapor (lower left) and thermal IR (lower right) images show the classic comma-shaped cloud pattern of mid-latitude cyclones.
Question
Based on the mid-to-upper troposphere wave pattern, what would you expect to happen
to surface low-pressure?
(Choose the best answer.)
The correct answer is c).
The surface low pressure will strengthen in response to upper-level divergence and cyclonic vorticity advection.
Indeed, a new surface low pressure formed and intensified after 0000 UTC 23 December (Fig. 12), increasing surface convergence and rising motion.
Fig. 12. Unified surface analysis from 19 to 23 Dec 2009.
Soundings taken at 1200 UTC on 22 and 23 December (Fig. 13) confirm the intensification of the Rossby wave. Note the dramatic increase in the mid-tropospheric wind velocity (from 30 to 50 kts). By 1200 UTC on 23 December, the atmosphere is considerably drier as high pressure is established in the wake of the cyclone and frontal passage.
Fig 13a
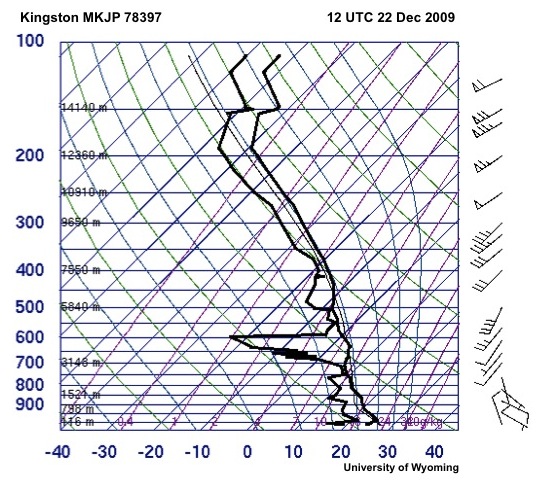
Fig.13. Soundings from MKJP, Kingston, Jamaica at 1200 UTC on 22 and 23 Dec 2009.
Fig 13b
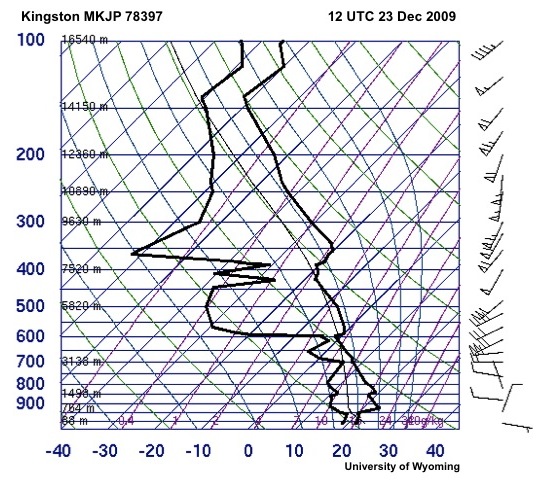
Fig.13. Soundings from MKJP, Kingston, Jamaica at 1200 UTC on 22 and 23 Dec 2009.
850 hPa Analysis
One of the key features to identify at 850 hPa is the low-level jet. The jet is usually a source of low-level warm advection and warm, moist air that maintains long-lived MCSs. At 1200 UTC on 22 December a low-level jet is bringing warm, moist air from the southeastern Caribbean into a cyclonic circulation over the western Caribbean (Fig. 14a). The cyclone moves east by 0000 UTC 23 December and the 850 hPa wind speed increases over Jamaica (Fig. 14b). The combined effect of the moisture advection, low-level warm advection, cyclonic vorticity advection and upper-level divergence is the development of intense MCSs in the warm sector. We will examine the MCSs in the satellite and radar imagery in the next sections.
Fig 14a
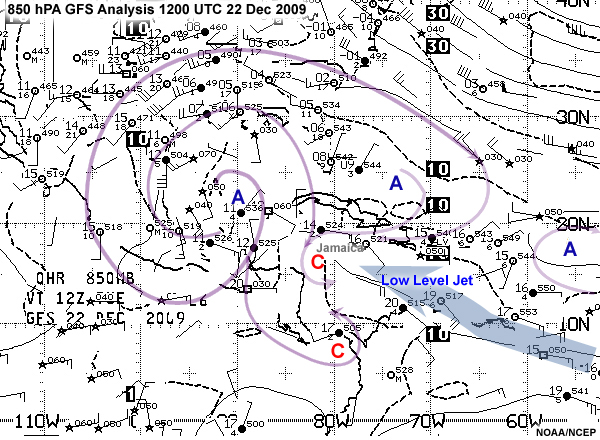
Fig. 14. 850 hPa heights and wind velocity at 1200 UTC on 22 Dec and 0000 UTC on 23 Dec 2009. The broad blue arrow marks the low-level jet and the thin, purple lines are streamlines.
Fig 14b
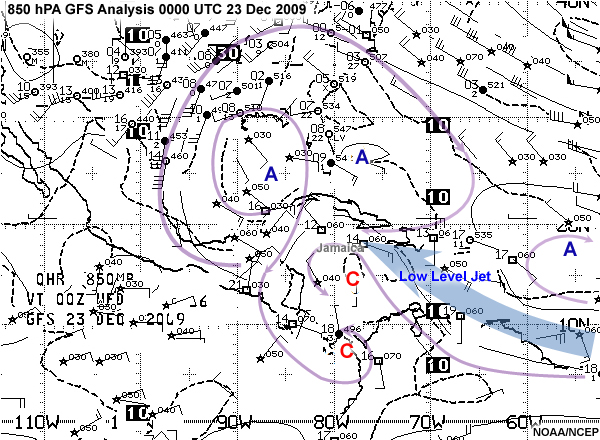
Fig. 14. 850 hPa heights and wind velocity at 1200 UTC on 22 Dec and 0000 UTC on 23 Dec 2009. The broad blue arrow marks the low-level jet and the thin, purple lines are streamlines.
Summary: Key Synoptic Ingredients
Key synoptic ingredients that contributed to heavy rainfall and severe weather:
- A strong Rossby wave with a large amplitude trough and short wavelength
- Upper-level jet streak with winds exceeding 80 m/s (160 kts)
- Upper-level divergence that enhanced rising motion to the east of the trough and in the entrance of the jet streak
- Mid-tropospheric cyclonic vorticity advection
- A low-level jet at 850 hPa that provides low-level warm advection and moisture advection
- Surface front which aids in lifting of warm, moist air
- Extratropical cyclone genesis which increased the surface convergence and rising motion, clouds, and heavy precipitation.
The alignment of the upper-level wave, jet streak, mid-tropospheric circulation, low-level jet, and surface fronts indicates strong baroclinic instability, a condition that is favorable for extratropical cyclone genesis. This Rossby wave was more intense because of its meridional orientation, which caused cold, sinking air to move towards the equator and warm, rising air to move poleward. This triggered convective instability over the Caribbean and led to heavy rainfall and severe weather.
Satellite Imagery
Fig. 15. GOES enhanced IR images from 2345 UTC 22 Dec to 0515 UTC 23 Dec 2009.
Satellite images show the classic comma-shaped cloud band associated with the Rossby wave and surface front (Fig. 15). Notice the general north-northeast movement of cloud features following the direction of the upper-level jet and mid-tropospheric wave. As the cyclone strengthened it produced widespread clouds and precipitation across the Western Caribbean. Precipitation resulted from the broad ascent in the cyclone with MCS producing precipitation of high intensity.
Enhanced satellite images help us to identify MCSs more easily. First, we identify the most intense convection from cold cloud tops, e.g., areas with brightness temperatures below -40°C (magenta areas in Fig. 15). Then we examine the shape and evolution of the convection features. If the areas are becoming colder, it means that the convective updrafts are stronger allowing taller clouds to form. The broadening of the cold cloud area without change in temperature usually indicates that the MCS is near its mature stage. An apex point formation, an enhanced-V in the cold cloud, signifies strong upper tropospheric shear and strong updrafts that penetrate into the stratosphere. Strong updrafts lead to severe weather and heavy precipitation.

Fig. 16. Enhanced IR image at 1825 UTC 22 Dec 2009.
As the low moved east between 1200 UTC 22 Dec and 0000 UTC 23 December, the MCS moved across and south of Jamaica (e.g., green areas of Fig. 16). These MCSs formed and strengthened to the east of the upper level trough and within the warm sector of the front, near the apex of the low-level jet. Between 2345 UTC 22 Dec and 0545 UTC 23 December, several mesoscale cold cloud features passed over and north of Jamaica. These smaller MCSs were the ones that AA Flight 331 encountered enroute to Kingston. Note the cold cloud area that extends from western Jamaica to Kingston at 0245 UTC, just prior to the crash landing.
Fig.17. GOES enhanced water vapor IR images from 2345 UTC 22 Dec to 0515 UTC 23 Dec 2009.
Enhanced water vapor images help us to analyze mid-upper troposphere motion and moisture advection. Like the thermal IR images, these water vapor channel images show the classic comma-shaped cyclone cloud pattern (Fig. 17). The bright red and orange circular-shaped area east of the Yucatan indicates the flow of descending dry air around the upper-level low. The large band of ascending clouds is outlined in grey and shows outflow associated with the upper-tropospheric jet streak across the Western Caribbean, the Bahamas, and into the Atlantic. Embedded within the large cloud band are the MCSs described earlier and seen here as areas of blue, green and red. Note the contrast between the dry ridges and the very moist trough, further indication of the strong dynamic and thermodynamic forcing in the mid-to-upper troposphere.
Summary: Satellite Signals of Heavy Rainfall and Severe Weather
Summary: Satellite Image Signals of Heavy Rainfall and Severe Weather:
- Midlatitude cyclones are identified by their broad comma-shaped cloud band in satellite images.
- MCSs are identified by their cold cloud tops, which are easily seen in enhanced imagery. The most intense part of the MCS often has an apex formation where strong updrafts penetrate the tropopause.
- MCSs are commonly observed in the warm sector of midlatitude cyclones.
- Water vapor IR images are especially useful for locating Rossby wave troughs and ridges.
Radar Signals of Heavy Rainfall and Severe Weather
The radar images provide a more detailed view of mesoscale convection and rainfall (Fig. 18). Here, we will focus on the pattern and the relative values as the reflectivity in the images are lower than expected from the surface and satellite observations.
Fig. 18. Animation of radar images from 1800 LT on 22 December to 0400 LT 23 December 2009.
The main features are squall lines that affected Jamaica and neighboring islands between 1800 LT 22 December and 0400 LT 23 December 2009. The same squall lines are observed as cold clouds in the IR images (Fig. 15).
Radar reflectivity at 1800 LT (2300 UTC) shows a squall line across western Jamaica and adjacent waters with a leading convective line of higher reflectivity and trailing region of lower reflectivity. Light rain showers are reported in Montego Bay (MKJS) from that squall line. The general motion of the squall line is towards the east while individual cell motion is towards the north-northeast.
Over the Pedro Cays (P Cay) is a smaller squall line with relatively high reflectivity cells oriented northeast to southwest. That line is moving towards the north, closer to the southern end of the large squall line between 1800 and 2000 LT. By 2000 LT (0100 UTC), the leading edge of the rain reached Kingston and heavy rain showers are reported at the international airport (MKJP).
Question 1 of 2
What aviation-related hazards will the squall line bring to the airport?
(Select
all that apply.)
The correct answers are b) and d).
Heavy rainfall causes low visibility and wet runways and occurs with storms with low ceilings. Squall line thunderstorm updrafts, downdrafts and gust fronts are causes of turbulence, conditions that are not conducive to smooth landings.
Between 2100 and 2200 LT, reflectivity gradients became stronger at the leading edge of the squall line and reflectivity values increase over the northern part of the squall line.
Question 2 of 2
What do strong gradients of low-level reflectivity and increasing reflectivity
indicate for aviation weather?
(Choose the best answer.)
The correct answer is b).
As noted in the conceptual model (Fig. 6b), potentially damaging winds in squall lines are most threatening where the reflectivity gradients are strong at low-levels and the gust front remains close to the leading edge.
A special observation from MKJP at 2128 LT (0228 UTC) reported thunderstorm showers and visibility of 5 km. The northern part of the leading line has tight gradients (indicating potentially damaging winds) with no precipitation to its east. Behind the leading line is less intense precipitation west and north of Jamaica, in areas along the expected flight route. At 2200 LT (0300 UTC), 22 minutes prior to the crash landing, a reflectivity maximum (yellow area in the image) is observed over Kingston Harbour and vicinity. Heavy showers, visibility of 3.3 km, and a ceiling of 1400 ft (427 m) were reported at the airport.
Over the next couple of hours, rain continued over Kingston and off the southeastern coast. The northern squall line moved NNE towards Cuba, while the southern, and more intense, MCS moved towards the east.
Summary: Radar Signals of Heavy Rainfall and Severe Weather
Mesoscale and local-scale convection is more closely monitored with radar imagery, which provides guidance for aviation forecasting. Some of the key points to remember from this case are:
- Squall lines formed ahead of the cold front and produced heavy showers.
- The general movement of the larger squall line was parallel to the cold front but individual cells moved north-northeastward.
- Low-level radar reflectivity gradients at the leading line increased, indicating strong updrafts, high surface winds, and a more intense squall line.
- An area of high reflectivity was observed over and west of Kingston about 20 minutes before the accident; at the same time the station reported heavy showers.
- A small squall line moved northward close to the large squall line then both moved primarily eastward. Without radar, it would be difficult to track the movement of the smaller system, which produced heavy rainfall over Kingston and other areas of southern Jamaica.
Synoptic Ingredients Associated with Turbulence
Examine the 500 and 250 hPa wind velocity and heights at 0000 UTC 23 December and answer the questions below.
Question 1 of 2
Choose the region(s) where turbulence is likely at 250 hPa.
(Select all that
apply.)
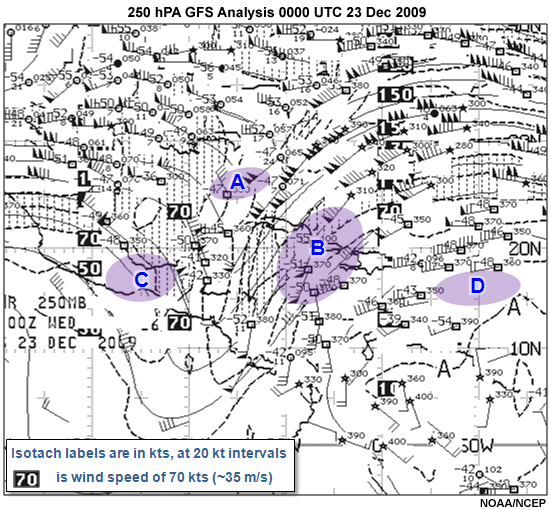
The correct answers are a), b) and c).
Region A is in the upper-level trough, where flights will experience turbulence caused by dramatic changes in wind direction and speed. Region B covers part of the jet streak and its entrance region where horizontal and vertical shear create turbulence. That region also has the front, where turbulence is related to vertical wind shear and thunderstorms. Region C has strong horizontal wind shear, likely to cause clear air turbulence as the water vapor satellite images show a very dry mid-upper troposphere in that area. Region D is in an area of weak winds and the upper-level ridge so turbulence is unlikely.
Question 2 of 2
Choose the region(s) where turbulence is likely at 500 hPa.
(Select all that
apply.)
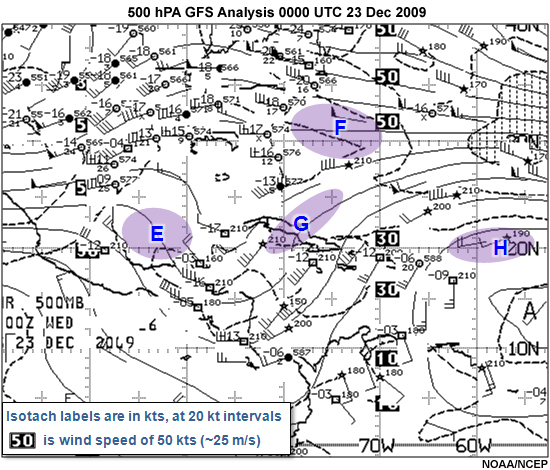
The correct answers are f) and g).
Both regions have strong horizontal wind shear, which generates turbulence. These regions are below a very strong jet streak, which is a major source of turbulence. Region G is also near the frontal boundary which contributes to vertical wind shear and turbulence. Regions E and H have weak winds and no horizontal wind shear.
Summary: Key Synoptic Ingredients for Turbulence
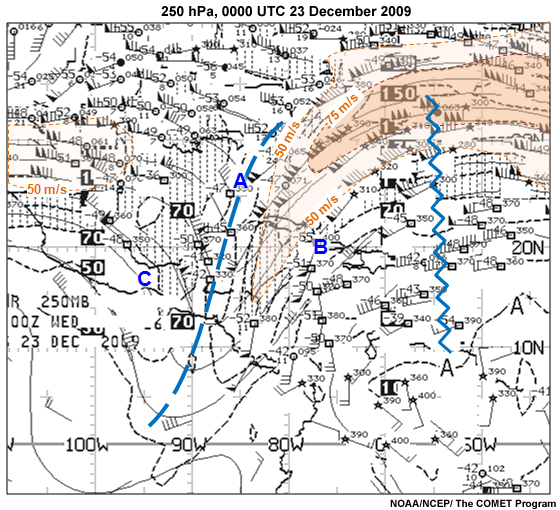
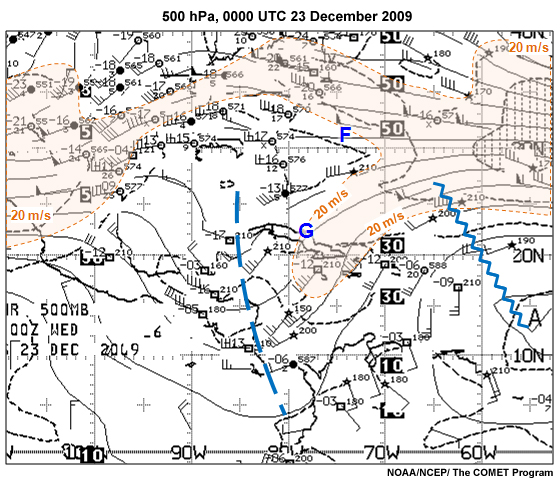
Fig 19a
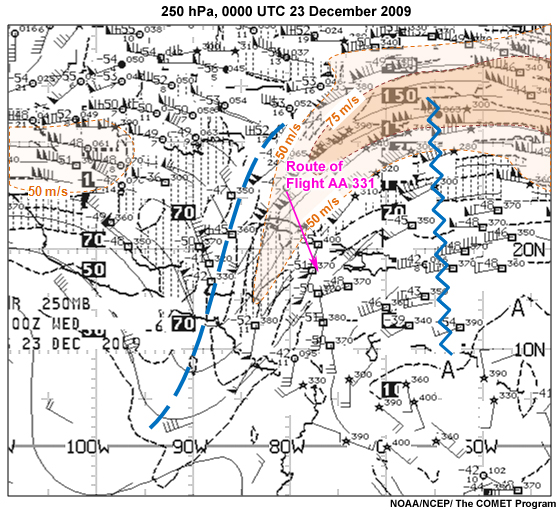
Fig. 19. (a) 250 hPa and (b) 500 hPa heights and wind velocity at 0000 UTC 23 December 2009. Orange-shaded areas are winds ≥ 50 m/s in (a) and 20 m/s in (b). The route of Flight AA 331 is the magenta arrow on both maps.
Fig 19b
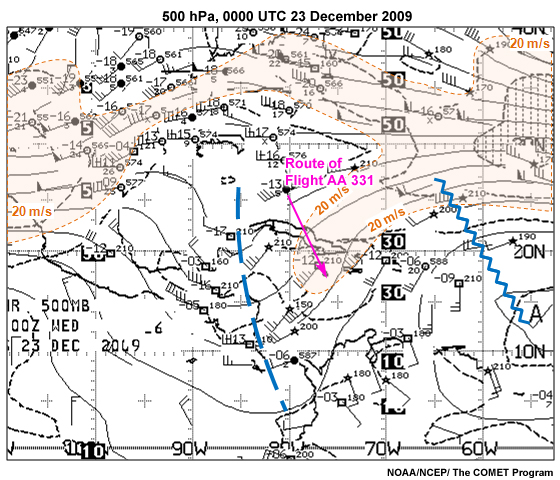
Fig. 19. (a) 250 hPa and (b) 500 hPa heights and wind velocity at 0000 UTC 23 December 2009. Orange-shaded areas are winds ≥ 50 m/s in (a) and 20 m/s in (b). The route of Flight AA 331 is the magenta arrow on both maps.
A jet streak with winds exceeding 80 m/s (160 kts) contributed to turbulence along the flight path of AA 331 (Fig. 19a). Horizontal shear in the mid-troposphere also contributed to turbulence. Note the lobe of winds exceeding 20 m/s (40 kts) along the flight path (Fig. 19b).
In this case, the Rossby wave contributed to:
- Turbulence from horizontal and vertical wind shear associated with the upper-tropospheric jet streak
- Turbulence from vertical wind shear associated with the upper-level trough
- Turbulence from transverse waves along the upper-level jet stream, as seen over Florida, the Bahamas, and Cuba in Fig. 16.
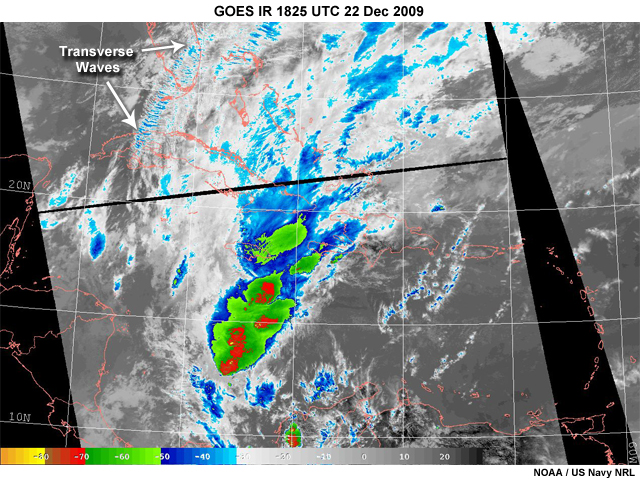
Repeat of Fig.16, showing locations of transverse waves associated with a strong jet streak over Florida, Cuba, and the Bahamas.
The surface front, Rossby wave, and intensifying surface cyclone, created conditionally unstable conditions, leading to the formation of organized, deep convection, which generated turbulence associated severe thunderstorm updrafts, downdrafts, and cloud anvils.
Assessing the Impacts
Rossby Wave, Surface Cyclone, and Front
Conditions associated with cold fronts include heavy rainfall and showers as warm, moist air is lifted ahead of cold, drier air. Thunderstorms are also common in the warm sector ahead of the front. The hazards to aviation posed by the surface cyclone and Rossby wave include:
- Low ceilings associated with heavy precipitation and thunderstorms
- Low visibility associated with heavy precipitation
- Wet runways from heavy precipitation
- Turbulence from wind shear associated with upper-tropospheric jet streaks
- Turbulence from wind shear in a sharply-curved, elongated upper-level trough
- Turbulence from squall line thunderstorm updrafts and downdrafts.
This case illustrates the synoptic and mesoscale environments that affected AA Flight 331 on 22 December 2009, including: heavy rain showers, thunderstorms, low ceiling, low visibility, and turbulence. The elongated upper-level trough and high winds in the jet stream (exceeding 80 m/s or 160 kts) contributed to turbulence along the flight path of AA 331. News reports indicate that cabin service was suspended several times during the flight because of turbulence.
Writing TAFs
Imagine that you are an aeronautical forecaster responsible for writing Terminal Aerodrome Forecasts (TAFs) for the international airport in Jamaica. What might you put in a TAF for the period 0000 UTC 23 Dec to 0000 UTC 24 December 2009?
Recall some of the steps described in the module, Writing Effective TAFs in the Caribbean. For this case, without numerical weather prediction guidance, the focus is on these WMO/ICAO specifications:
- Create a mental model of the atmosphere based on the synoptic analysis.
- Use the mental model to write a TAF that will address the expected weather events and meet the needs of your aviation customers.
- Amend the TAF if necessary, using new data which will include satellite, radar and METAR information.
The primary synoptic drivers are the strong, large amplitude Rossby wave (with a strong jet streak) and the surface front. In developing your mental model, consider the following:
- How do these synoptic systems typically move and evolve?
- How will the evolution of these systems affect aviation weather in your aerodrome area?
- How will flight categories for clouds and visibility change?
- What kinds of mesoscale systems are expected?
- What will be their effect on aviation operations in your aerodrome area?
- According to the mesoscale analysis and forecast, how will flight categories for clouds and visibility change?
Question
After completing your synoptic and mesoscale analysis at 0000 UTC, you review a previously issued TAF:
TAF MKJP 222100Z 2300/2324 35008KT 9999 FEW018 SCT032 BKN090
TEMPO 2300/2306 9000 -SHRA BKN018 FEW018CB SCT032
BECMG 2314/2316 20010KT
TEMPO 2318/2324 8000 SHRA SCT018 SCT080
The synoptic analysis shows surface pressure decreasing across the region during the past six hours (note the movement of the 1012 hPa isobar in Fig. 12). This is not surprising given the Rossby wave and jet streak pattern and associated upper-level divergence. The water vapor satellite images (Fig. 16) show general eastward motion of the synoptic wave. At the mesoscale, satellite and radar images indicate persistent squall lines moving west to east towards the aerodrome (Fig. 15). Montego Bay (MKJS), upstream from Kingston, reported rain showers (light and moderate) for four of the past five hours and broken cloud ceilings of 1600 ft for five hours and overcast clouds at 6000 ft. Showers were reported in the vicinity of the aerodrome in the previous hour. Decreasing pressure produces new storms and/or more intense storms. Thus moderate to heavy rainfall, with accompanying persistent low ceiling and low visibility is now imminent and the TAF has to be amended.
Based on the case analysis, recent observations, and your review of Writing TAFs for the Caribbean, what amendments would best represent the changing weather situation? (Choose the best answer.)
The correct answer is a).
It is critical to review the TAF and, when necessary, issue amendments promptly. In this case, the alignment of this strong upper-level trough and the surface front is conducive to the formation of surface low pressure and pre-frontal MCSs. Under these conditions, the intensity of the thunderstorms and the rainfall is expected to be greater than previously observed with frontal lifting only. There was indeed a reduction in visibility and low ceilings with thunderstorms and heavy rains between 0100 and 0600 UTC on 23 December (see next page for more details). In keeping with the mental model of cyclone evolution and motion, as the wave moves eastward, high pressure will become established across the region so all flight categories are expected to improve. However, light showers are possible, with favorably onshore winds; therefore a PROB30 field is added for the latter part of the TAF.
Choice B is the same TAF, which does not reflect the changing conditions. Choice C is incorrect because the visibility is much lower than expected for the rainfall intensity and the ceiling level. For the period after 1800 UTC, there is a mismatch between the high visibility and heavy showers. Choice D is incorrect because the change is not expected to be a gradual improvement during this time period. The satellite and radar images indicated that squall lines will persist across the aerodrome area.
Observations at MKJP, Kingston
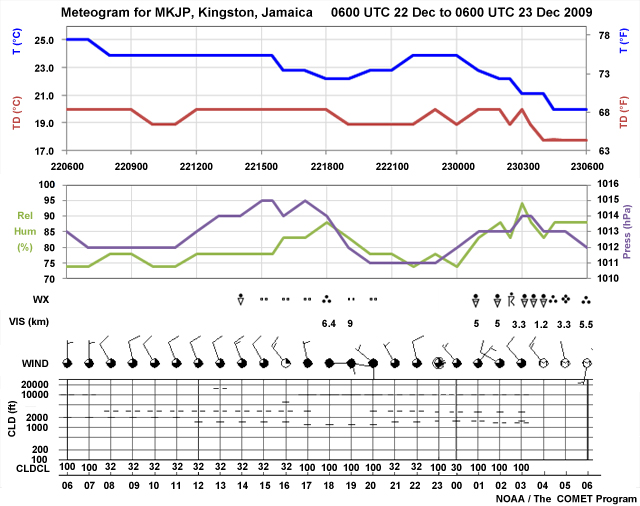
Fig. 20. Meteogram at MKJP, Kingston, from 0600 UTC 22 Dec to 0600 UTC 23 Dec 2009.
The surface observations show that the airport experienced several hours of light rain and a period of moderate rain during the day, between 1400 and 2000 UTC, 22 December (Fig. 20, Table 1). The moderate rain lowered the visibility to 6.4 km and lowered the temperature and dew point temperature by 1°C. Winds became easterly briefly and it remained cloudy for the next four hours but with no rain.
After 0100 UTC (2000 LT) 23 December, moderate to heavy showers began as the cyclone was intensifying. Visibility was reduced to less than 5 km. Special weather observations included thunderstorm rain showers and visibility as low as 1.2 km. The surface observations corroborated the relatively high radar reflectivity observations (Fig. 18). Temperature dropped by 4°C between 0000 and 0430 UTC and relative humidity increased. These are likely responses to strong convectively-generated cold pool as well as movement of the front. As the front and the deepening surface low moved east, pressure increased behind the front.
At 0300 UTC (2200 LT) 23 December, just prior to the crash, the observed weather was heavy rain showers, visibility of 3.3 km, and a ceiling of 1400 ft with few cumulonimbus clouds and broken higher level clouds.
Special Crash METAR Observation
SPECI MKJP 230325Z 32011KT 22000 +SHRA
BKN014 FEW016CB SCT030 BKN100 21/19 Q1014 RETSRA
Decoded SPECI
Wind 320 degrees at 11 knots, visibility 2200 m, heavy rain showers, ceiling at 1400
feet with broken clouds, few clouds with cumulonimbus 1,600 ft, scattered
clouds 3,000 ft., broken clouds 10,000 ft; temperature 21°C, dew point 19°C, QNH 1014 hPa.
Recent thunderstorm and rain.
| Table 1. METARS for Norman Manley International Airport (MKJP), Kingston | |||||||||||
|---|---|---|---|---|---|---|---|---|---|---|---|
| MKJP | 220600Z | 36006KT | 9999 | FEW020 | BKN100 | 25/20 | Q1013 | ||||
| MKJP | 220700Z | 36005KT | 9999 | FEW020 | BKN100 | 25/20 | Q1012 | ||||
| MKJP | 220800Z | 33008KT | 9999 | FEW020 | BKN032 | 24/20 | Q1012 | ||||
| MKJP | 220900Z | 35010KT | 9999 | FEW020 | BKN032 | 24/20 | Q1012 | ||||
| MKJP | 221000Z | 33008KT | 9999 | FEW020 | BKN032 | 24/19 | Q1012 | ||||
| MKJP | 221100Z | 34010KT | 9999 | FEW020 | BKN032 | 24/19 | Q1012 | ||||
| MKJP | 221200Z | 34011KT | 9999 | FEW015 | BKN032 | 24/20 | Q1013 | ||||
| MKJP | 221300Z | 34012KT | 9999 | FEW015 | BKN032 | BKN150 | 24/20 | Q1014 | |||
| MKJP | 221400Z | 34013KT | 9999 | SHRA | FEW015 | BKN032 | 24/20 | Q1014 | |||
| MKJP | 221500Z | 33010KT | 9999 | -RA | FEW015 | BKN032 | 24/20 | Q1015 | |||
| MKJP | 221600Z | 32013KT | 9999 | -RA | FEW015 | BKN032 | SCT060 | 23/20 | Q1014 | ||
| MKJP | 221700Z | 35003KT | 9999 | -RA | SCT012 | SCT032 | OVC100 | 23/20 | Q1015 | ||
| MKJP | 221800Z | 09014KT | 9999 | RA | SCT012 | OVC100 | 22/20 | Q1014 | |||
| MKJP | 221900Z | 10012KT | 9000 | -RA | SCT012 | OVC100 | 22/19 | Q1012 | |||
| MKJP | 222000Z | 31005KT | 9999 | -RA | FEW012 | SCT032 | OVC100 | 23/19 | Q1011 | ||
| MKJP | 222100Z | 33005KT | 9999 | FEW015 | BKN032 | BKN100 | 23/19 | Q1011 | |||
| MKJP | 222200Z | 35008KT | 9999 | FEW015 | BKN032 | BKN100 | 24/19 | Q1011 | |||
| MKJP | 222300Z | 00000KT | 9999 | VCSH | SCT016 | SCT030 | BKN100 | 24/20 | Q1011 | ||
| MKJP | 230000Z | 32004KT | 9999 | FEW016 | BKN030 | BKN100 | 24/19 | Q1012 | |||
| MKJP | 230100Z | 040033KT | 5000 | SHRA | BKN016 | SCT030 | BKN100 | 23/20 | Q1013 | RERA | |
| MKJP | 230200Z | 300122KT | 5000 | SHRA | BKN014 | SCT030 | BKN100 | 22/20 | Q1013 | RERA | |
| MKJP | 230228Z | 31009KT | 5000 | TSRA | BKN014 | FEW016CB | SCT030 | BKN100 | 22/19 | Q1013 | |
| MKJP | 230300Z | 32008KT | 3300 | +SHRA | BKN014 | FEW016CB | SCT030 | BKN100 | 21/20 | Q1014 | RETSRA |
| MKJP | 230325Z | 32011KT | 2200 | +SHRA | BKN014 | FEW016CB | SCT030 | BKN100 | 21/19 | Q1014 | RETSRA |
| MKJP | 230400Z | 32014KT | 1150 | +SHRA | BKN014 | FEW016CB | SCT028 | BKN090 | 21/18 | Q1013 | RERA |
| MKJP | 230430Z | 34011KT | 4400 | RA | BKN014 | FEW016CB | BKN100 | 21/13 | Q1013 | RESHRA | |
| MKJP | 230500Z | 35002KT | 3300 | +RA | BKN014 | BKN090 | 20/18 | Q1013 | |||
| MKJP | 230600Z | 19003KT | 5500 | RA | BKN014 | BKN090 | 20/18 | Q1012 | |||
| NOAA | |||||||||||
Civil Aviation Authority Reports
- Jamaica Civil Aviation Authority (JCAA) preliminary report, 6 January 2010
- "…scheduled passenger flight from Miami, Florida, to Kingston Jamaica, originated at Miami International Airport at about 8:22 pm eastern standard time (EST) on December 22, 2009. At about 10:22 pm EST, the aircraft ran off the eastern end of Runway 12 while landing at the Norman Manley International Airport (MKJP), Kingston."
- "Instrument Meteorological Conditions prevailed in the area and heavy rain was reported at the airport at the time of the accident." "The crew reported that after descending through the cloud cover, they made visual contact with the runway at between 1000 ft and 700 ft above ground level. According to the Flight Data Recorder (FDR), the aircraft was traveling at the Vref (landing) airspeed of 148 knots, with a ground speed of 162 knots, i.e., with a tailwind component of 14 knots, when the wheels made initial contact at about 4,000 feet down the 8,900 ft runway."
- Final draft of Jamaica Civil Aviation Authority (JCAA) report, July 2011
http://go-jamaica.com/news/read_article.php?id=30199
News Reports
- Gleaner Online Cartoon of plane landing and crash with Google maps
http://go-jamaica.com/news/reenactment-updated.html#Next%20page
- The runway, Runway 12, measures 8900 x 150 ft (2713 x 46 m), and is the only one with an Instrument Landing System (ILS).
- Aircraft touched down at about 4000 ft (1219 m) on the runway; normal touchdown is about 1500 ft (457 m). Indications are that, given the wind direction of 320 degrees at 11 kts (4 m/s) as stated in the 0300 UTC METAR, the airplane had a tailwind of about 14 kts (7 m/s) during approach and landing on Runway 12.
- NTSB Saftey Recommendation following accident issued 7 Dec 2011
https://www.kreindler.com/Recent-Developments/NTSB-A-11-092-095.pdf - Report and photos from the Aviation Herald
http://avherald.com/h?article=424a11b1 - Aerial photo with credit
http://www.jamaicaobserver.com/news/Observer-first-in-the-world-to-report-AA-crash - American Airline statement, 11:58 pm US Central Time, 22 Dec 2009
https://enacademic.com/dic.nsf/enwiki/11785924 - Gleaner report, 14 Dec 2011
http://jamaica-gleaner.com/gleaner/20111214/lead/lead8.html