Media Gallery
Media elements used in this module are protected by a variety of copyright licenses. Please use the "copyright terms" link associated with each item below for more information.
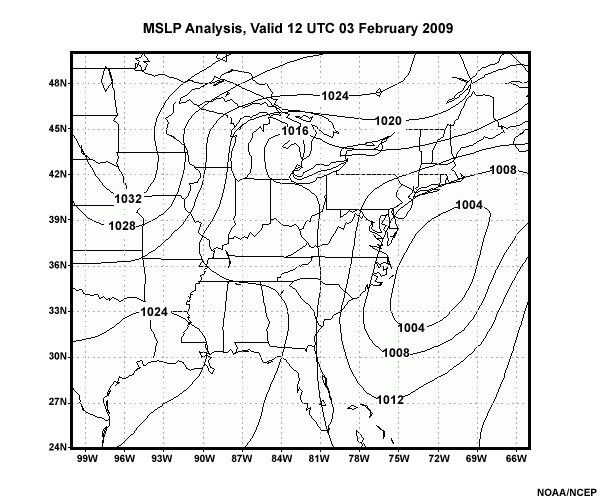
Description:
GDAS MSLP (hPa) analysis valid at 12Z 3 February 2009 over the eastern United States. The data are plotted in 4 hPa intervals and show cyclone well offshore of the Mid-Atlantic coast.
File Name:
anlpmsl2009020312.jpg
Credits:
NOAA/NCEP
Copyright Terms:
COMET Standard Terms of Use
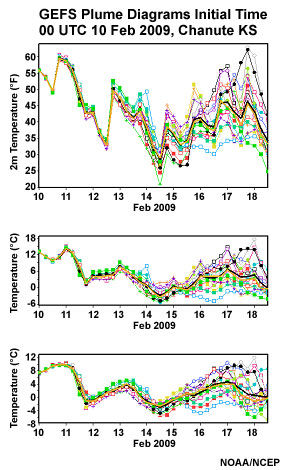
Description:
Global Ensemble Forecast System plume diagram of temperatures at Chanute KS from the 00 UTC 10 February 2009 GEFS run out to 12 UTC 18 February 2009. The upper panels shows the 2m temperatures (degrees F), the middle panel is 925 hPa (degrees C) and lower panel is 850 hPa temperatures (degrees C). Each member value is plotted along with the ensemble mean (bold black) and median (dark yellow). Forecasts diverge rapidly at Chanute, KS, particularly after 14 February.
File Name:
ChanuteKSplumes.jpg
Credits:
NOAA/NCEP
Copyright Terms:
COMET Standard Terms of Use
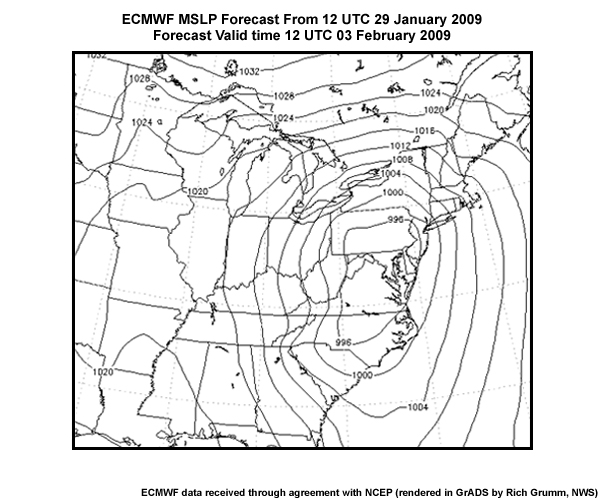
Description:
ECMWF MSLP (hPa) forecasts valid at 12Z 3 February 2009 over the eastern United States. The data are plotted in 4 hPa intervals and show cyclone over the Mid-Atlantic region.
File Name:
ECMWFpmsl2009020312.jpg
Credits:
ECMWF data received through agreement with NCEP (rendered in GrADS by Rich Grumm, NWS)
Copyright Terms:
COMET Standard Terms of Use
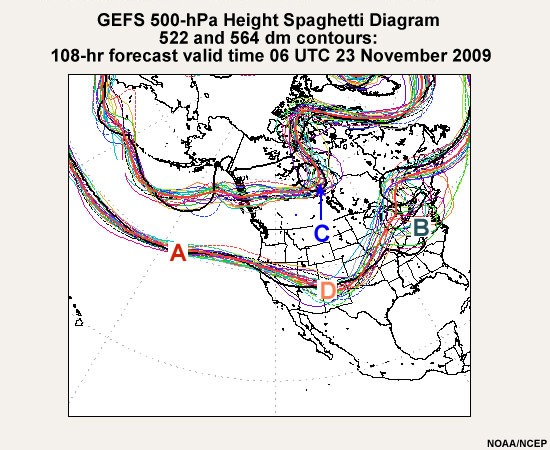
Description:
Global Ensemble Forecast System (GEFS) 500-hPa heights spaghetti diagram (522 and 564 decameter contours) for the 18 UTC 18 November 2009 forecast valid 06 UTC 23 November 2009. Labels A, B, C, and D are for identification of lowest and highest uncertainty areas for two final quiz questions.
File Name:
ens500_spghquiz_522_f108.jpg
Credits:
NOAA/NCEP
Copyright Terms:
COMET Standard Terms of Use
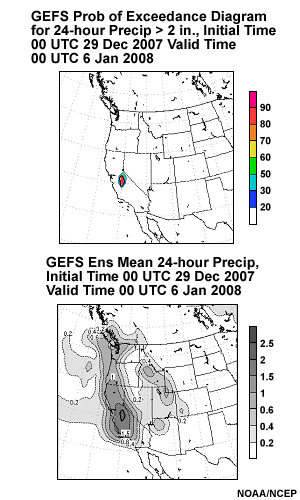
Description:
GEFS forecast of 24 hour precipitation initialized at 0000 UTC 29 December 2007 valid at 00 UTC 6 January 2008. The panel shows the probability of 24-hour precipitation exceeding 2 inches over the western U.S. (top panel, shaded) and ensemble mean 24 hour precipitation (bottom panel, shaded).
File Name:
GEFSp24_2in_vt2008010600.jpg
Credits:
NOAA/NCEP
Copyright Terms:
COMET Standard Terms of Use
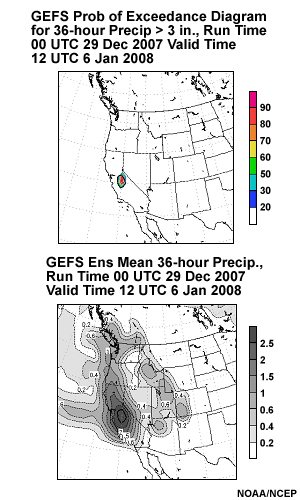
Description:
GEFS forecast of 36 hour precipitation initialized at 0000 UTC 29 December 2007 valid at 12 UTC 6 January 2008. The panel shows the probability of 36-hour precipitation exceeding 3 inches over the western U.S. (top panel, shaded) and ensemble mean 36 hour precipitation (bottom panel, shaded).
File Name:
GEFSp36_3in_vt2008010612.jpg
Credits:
NOAA/NCEP
Copyright Terms:
COMET Standard Terms of Use
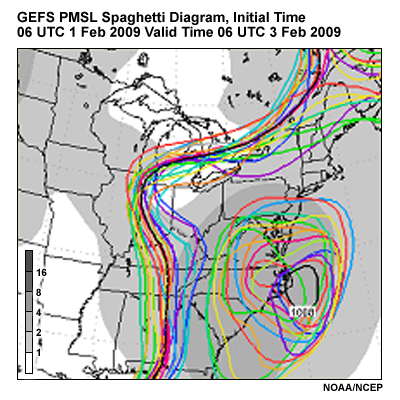
Description:
Global Ensemble Forecast System spaghetti plots of sea level pressure initialized at 0600 01 February 2009. It shows the forecast by each GEFS member's 1008 and 1020 hPa contour and the spread, shaded, about the mean. The forecast is valid at 0600 UTC 3 Feb 2009.
File Name:
GEFSpmslpsgh2009020106run.jpg
Credits:
NOAA/NCEP
Copyright Terms:
COMET Standard Terms of Use
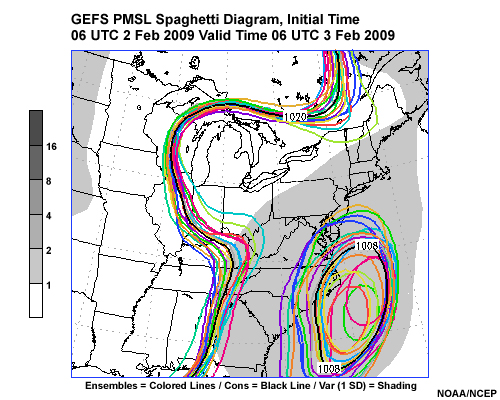
Description:
Global Ensemble Forecast System spaghetti plots of sea level pressure initialized at 0600 02 February 2009. It shows the forecast by each GEFS member's 1008 and 1020 hPa contour and the spread, shaded, about the mean. The forecast is valid at 0600 UTC 3 Feb 2009.
File Name:
GEFSpmslpsgh2009020206run.jpg
Credits:
NOAA/NCEP
Copyright Terms:
COMET Standard Terms of Use
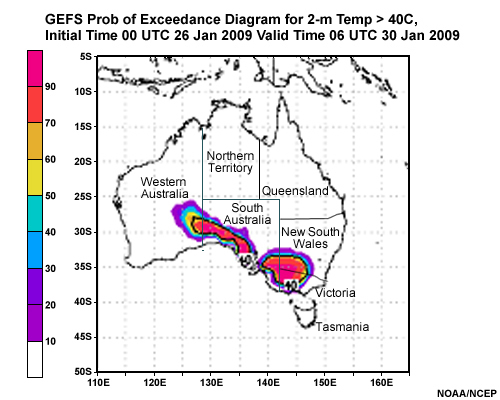
Description:
GEFS forecast of 2m temperatures initialized at 0000 UTC 26 January 2009 valid at 0600 UTC 30 January 2009. The panel shows the probability of 2m temperatures exceeding 40C over Australia and the 40C mean contour in bold black. Australian territories and state borders are shown and labeled according to the answer labeling for the related question.
File Name:
GEFSprob40Cvt2009013006.jpg
Credits:
NOAA/NCEP
Copyright Terms:
COMET Standard Terms of Use
Description:
GFS MSLP (hPa) forecasts valid at 12Z 3 February 2009 over the eastern United States. The data are plotted in 4 hPa intervals and show cyclone over adjacent areas of northwest NJ/northeast PA/southeast NY.
File Name:
GFSpmsl2009020312.jpg
Credits:
NOAA/NCEP
Copyright Terms:
COMET Standard Terms of Use
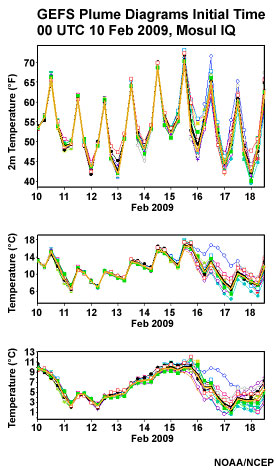
Description:
Global Ensemble Forecast System plume diagram of temperatures at Mosul IQ from the 00 UTC 10 February 2009 GEFS run out to 12 UTC 18 February 2009. The upper panels shows the 2m temperatures (degrees F), the middle panel is 925 hPa (degrees C) and lower panel is 850 hPa temperatures (degrees C). Each member value is plotted along with the ensemble mean (bold black) and median (dark yellow). Forecasts at Mosul do not diverge, typical of a desert climate.
File Name:
MosulIQplumes.jpg
Credits:
NOAA/NCEP
Copyright Terms:
COMET Standard Terms of Use
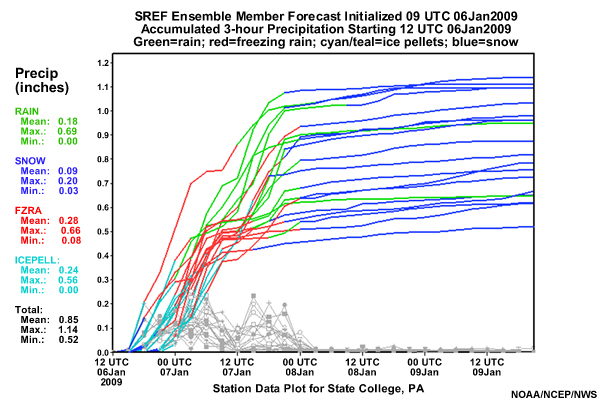
Description:
Plume diagram showing accumulated precipitation for each Short-Range Ensemble Forecast (SREF) at the specified point of State College, PA, initial time 09 UTC 6 January 2009 for the full 87-hour forecast period ending 00 UTC 10 January 2009. Precipitation type is color coded. Mean, maximum and minimum amounts per ensemble member are indicated at the left. In this forecast, mean, maximum, and minimum amounts are 0.18, 0.69, and 0.00 inches for rain; 0.09, 0.20, and 0.03 inches for snow; 0.28, 0.66, and 0.08 inches for freezing rain; and 0.24, 0.56, and 0.00 for ice pellets. Total precipitation is 0.85, 1.14, and 0.52 for mean, maximum and minimum respectively.
File Name:
plume.jpg
Credits:
NOAA/NCEP/NWS
Copyright Terms:
COMET Standard Terms of Use
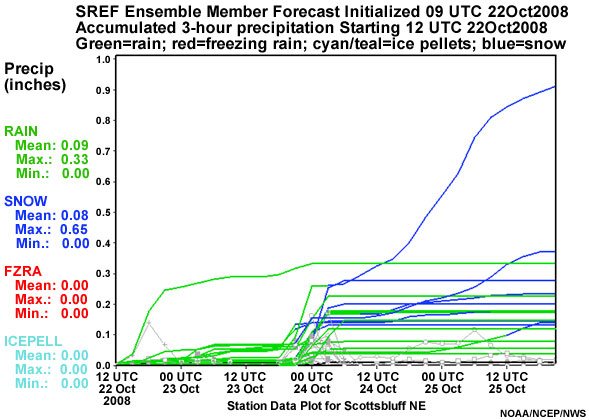
Description:
Plume diagram showing accumulated precipitation for each Short-Range Ensemble Forecast (SREF) at the specified point of Scottsbluff, NE, initial time 09 UTC 20 October 2008 for the full 87-hour forecast period ending 00 UTC 24 October 2008. The precipitation type is color coded. SREF mean, maximum, and minimum water equivalent for each precipitation type per ensemble is indicated at the left-hand side. The mean, maximum, and minimum rain amount in the SREF forecast is 0.09, 0.33, and 0.00 inches for rain and 0.08, 0.65, and 0.00 for snow. No freezing rain or sleet is predicted.
File Name:
plume1.jpg
Credits:
NOAA/NCEP/NWS
Copyright Terms:
COMET Standard Terms of Use

Description:
Photograph of Richard Grumm, Science Operations Officer at the National Weather Service, Central Pennsylvania Weather Forecast Office in State College PA.
File Name:
RGrumm.jpg
Credits:
The COMET Program
Copyright Terms:
COMET Standard Terms of Use
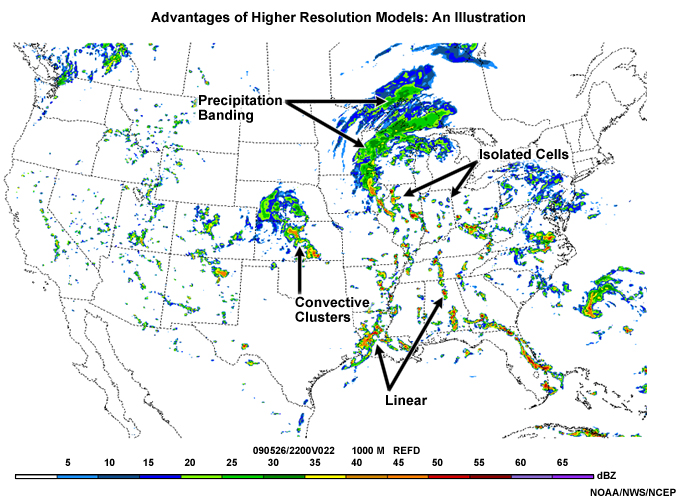
Description:
Display of synthetic radar from a 4km run of the NCEP version of the experimental NAM. The images is from 26 May 2009 and valid at 2200 UTC on 26 May 2009. The image covers the entire USA on a 4km grid. It shows highly detailed forecasts of what a radar might look like at valid time, including supercellular convection, linear convection, and precipitation banding in an area of warm air overrunning cooler air.
File Name:
simreflectivity.jpg
Credits:
NOAA/NCEP
Copyright Terms:
COMET Standard Terms of Use
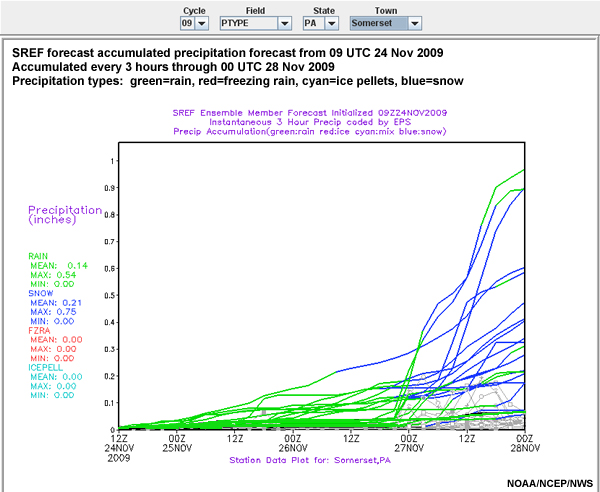
Description:
Short Range Ensemble Forecast (SREF) system plume diagram of accumulated precipitation and precipitation type, forecast initial time 09 UTC 24 November 2009 with forecast time series at 3-hour intervals out to 87 hours (00 UTC 28 November 2009). Rain is indicated with green contour, freezing rain with red, ice pellets with cyan, and snow with blue. Annotation to the left gives mean, maximum, and minimum precipitation amounts over the forecast period for each precipitation type, in inches.
File Name:
somersetpaplume_2009112409.jpg
Credits:
NOAA/NCEP/NWS
Copyright Terms:
COMET Standard Terms of Use
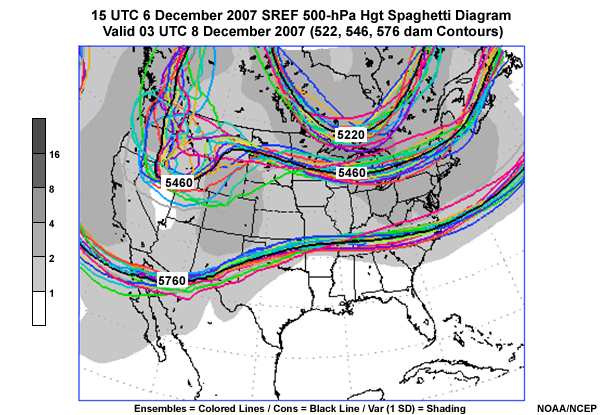
Description:
500 hPa spaghetti plot from Short-Range Ensemble Forecast system (SREF, contours are 522, 546, 576dm) with the spread shaded in meters, showing the forecast over the US from initial time 15 UTC 6 December 2007 valid 03 UTC 8 December 2007. Significant troughs are indicated over the Western U.S. and Great Lakes region. Maximum uncertainty is up- and downstream of the western trough, but on the axis of the Great Lakes trough.
File Name:
spag.jpg
Credits:
NOAA/NCEP
Copyright Terms:
COMET Standard Terms of Use
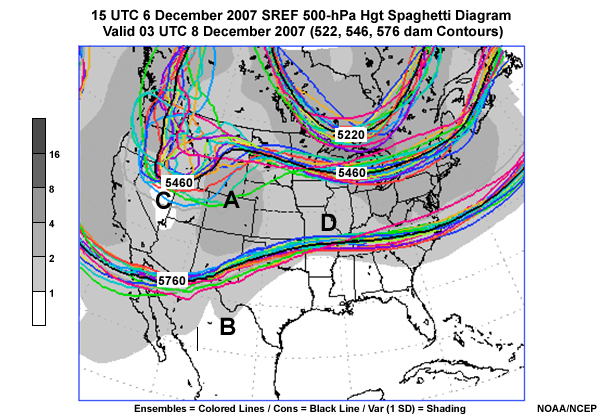
Description:
500 hPa spaghetti plot from Short-Range Ensemble Forecast system (SREF, contours are 522, 546, 576dm) with the spread shaded in meters, showing the forecast over the US from initial time 15 UTC 6 December 2007 valid 03 UTC 8 December 2007. Significant troughs are indicated over the Western U.S. and Great Lakes region. Maximum uncertainty is up- and downstream of the western trough, but on the axis of the Great Lakes trough.
This is the same as spag.jpg, except that letters are added to show choices for multiple choice question in the lesson.
File Name:
spag_a.jpg
Credits:
NOAA/NCEP
Copyright Terms:
COMET Standard Terms of Use
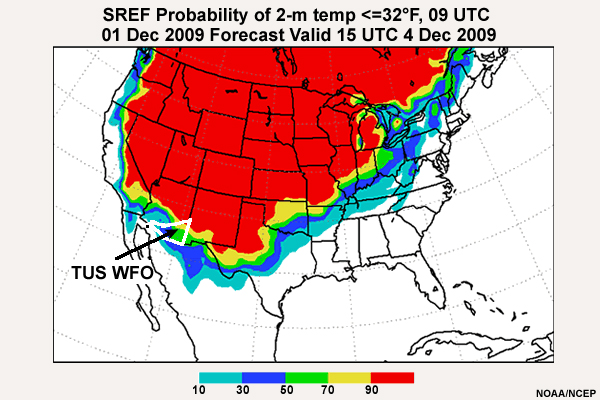
Description:
Probability of "exceedance" diagram for 2-m temperature less than or equal to 0 degrees Celsius from 09 UTC 01 December 2009 Short-Range Ensemble Forecast (SREF) valid time 15 UTC 4 December 2009. Probabilities are shaded, at 10% to 90% levels, at 20% intervals.
File Name:
SREF_prob2mTfrz_2009120109f78.jpg
Credits:
NOAA/NCEP
Copyright Terms:
COMET Standard Terms of Use
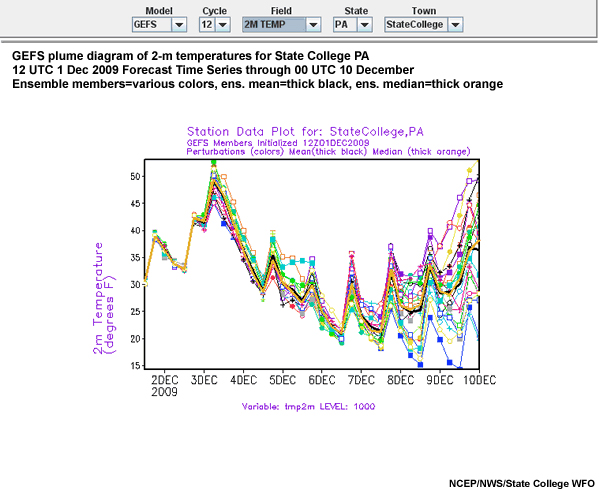
Description:
Plume diagram of 2-m temperatures from the Global Ensemble Forecast System (GEFS) for 180 hours stating at 12 UTC 01 December 2009 for State College, PA. The hash marks on the x-axis indicate 00 UTC for the labeled date. Temperatures (in degrees F) are indicated at 6-hour intervals. Ensemble mean is indicated in thick black contour, and ensemble median in thick orange contour.
File Name:
UNV_2009120112_T2mplume.jpg
Credits:
NOAA/NCEP/NWS
Copyright Terms:
COMET Standard Terms of Use