Media elements used in this module are protected by a variety of copyright licenses. Please use the "copyright terms" link associated with each item below for more information.
Description:
Florida State Univ. Uncertainty Chart for Global Ensemble Fcst. Syst. 00z 07Jan2007 for Wichita, KS 2m temp. Black line is standard deviation (SD) of the forecast, blue is 45-day GEFS SD climatology centered on 00z 7 Jan, and yellow is 25-yr observed SD.
File Name:
11_19Jn2007_slide1.gif
Credits:
FSU, Robert Hart/NWS/COMET
Copyright Terms:
COMET Standard Terms
of Use
Description:
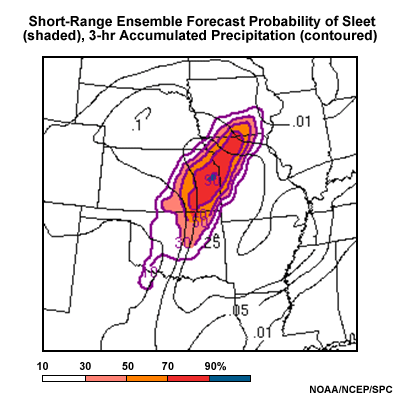
Image showing the probability of the precipitation type being sleet. Purple contours are the probability, the image highlights higher probabilities, black lines are the SREF mean Quantitative Precipitation Forecast (QPF).
File Name:
20070114_sleet.png
Credits:
NOAA/NCEP/SPC
Copyright Terms:
COMET Standard Terms
of Use
Description:
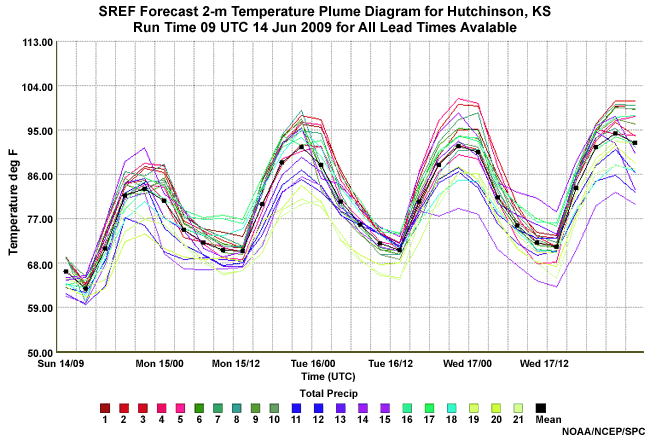
SPC SREF of 2M Temperature Plume Diagram for run starting 09 UTC 14 June 2009. The y-axis is temperature and the x-axis is time. Each individual trace represents the 2M temperature forecast through time of each of the SREF members.
File Name:
2M_Temp_SREF_HUT.png
Credits:
NOAA/NCEP/SPC
Copyright Terms:
COMET Standard Terms
of Use

Description:
Photo of Kenneth Cook, SOO, at his office in Wichita, KS.
File Name:
cook.jpg
Credits:
©The COMET Program
Copyright Terms:
COMET Standard Terms
of Use
Description:
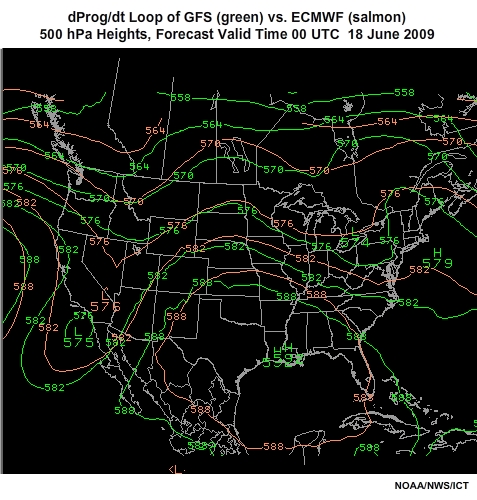
dProg/dt of a poorman's ensemble at 500 mb. Forecasts are all valid at 00 UTC 18 June 2009. The green contours are the 500 mb height forecast of the GFS and the salmon is the ECMWF of same.
File Name:
dPdt.500mb.100_0001.htm
Credits:
NOAA/NWS/ICT
Copyright Terms:
COMET Standard Terms
of Use
Description:
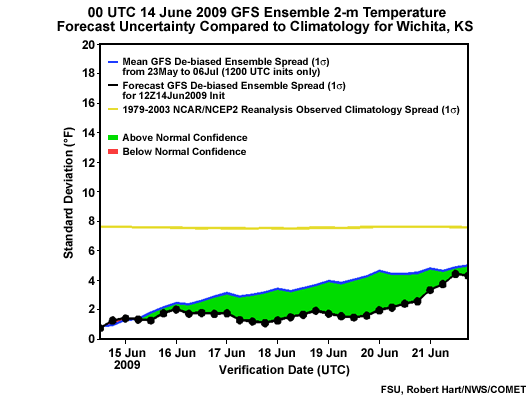
Florida State University Uncertainty Chart of 2-m temp (Wichita, KS) for the Global Ensemble Forecast System (GEFS) forecast made 00 UTC 14 June 2009. Black line is the standard deviation (SD) of this forecast to 7 days, blue is the 45 day GEFS climatological SD centered on 00 UTC 14 June, and yellow is the 25 year observed SD for 14-21 June.
File Name:
FSUplotICT.png
Credits:
FSU, Robert Hart/NWS/COMET
Copyright Terms:
COMET Standard Terms
of Use
Description:
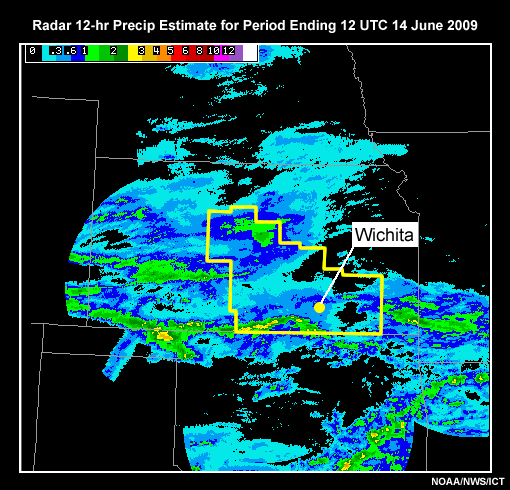
Images of precipitation estimated by radar. This is for a convective event which occurred over the WFO Wichita, KS forecast area. The precipitation totals are for the 12 hour period ending 12 UTC 14 June 2009.
File Name:
June14radar-1004.png
Credits:
NOAA/NWS/ICT
Copyright Terms:
COMET Standard Terms
of Use
Description:
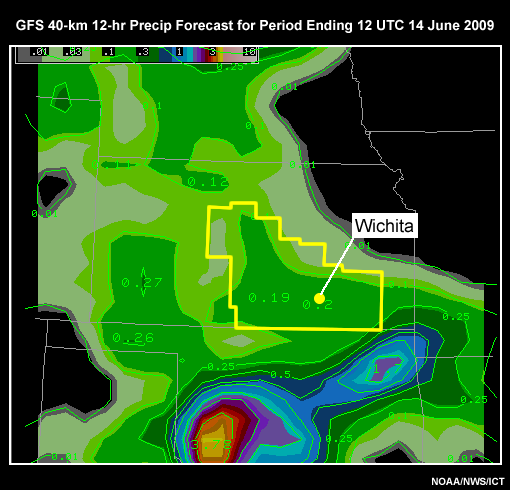
GFS data at 40 km resolution, forecast precipitation. This is for a convective event which occurred over the WFO Wichita, KS forecast area. The precipitation totals are for the 12 hour period ending 12 UTC 14 June 2009.
File Name:
June14radar-GFS40.png
Credits:
NOAA/NWS/ICT
Copyright Terms:
COMET Standard Terms
of Use
Description:
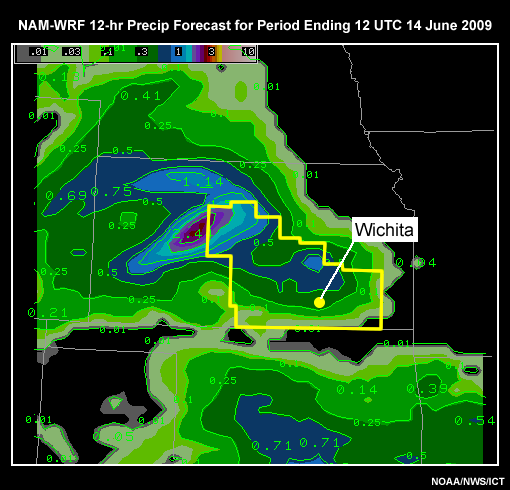
NAM-WRF data at 40 km resolution, forecast precipitation. This is for a convective event which occurred over the WFO Wichita, KS forecast area. The precipitation totals are for the 12 hour period ending 12 UTC 14 June 2009.
File Name:
June14radar-NAM40.png
Credits:
NOAA/NWS/ICT
Copyright Terms:
COMET Standard Terms
of Use
Description:
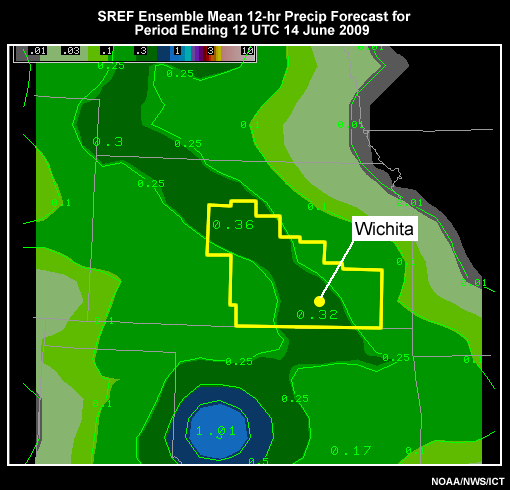
SREF ensemble mean forecast precipitation. This is for a convective event which occurred over the WFO Wichita, KS forecast area. The precipitation totals are for the 12 hour period ending 12 UTC 14 June 2009.
File Name:
June14radar-SREF.png
Credits:
NOAA/NWS/ICT
Copyright Terms:
COMET Standard Terms
of Use
Description:
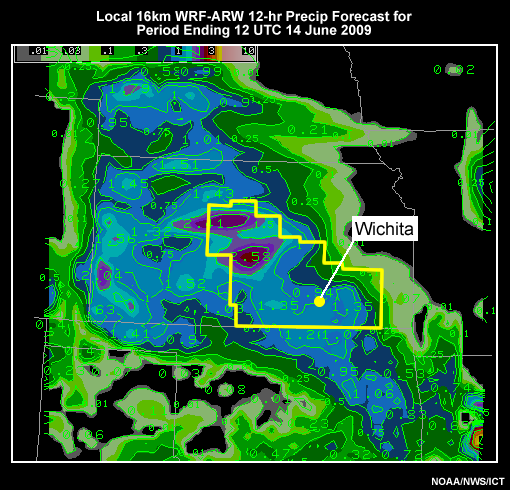
WRF-ARW at 32km resolution forecast precipitation. This is for a convective event which occurred over the WFO Wichita, KS forecast area. The precipitation totals are for the 12 hour period ending 12 UTC 14 June 2009.
File Name:
June14radar-WRF-ARW16.png
Credits:
NOAA/NWS/ICT
Copyright Terms:
COMET Standard Terms
of Use
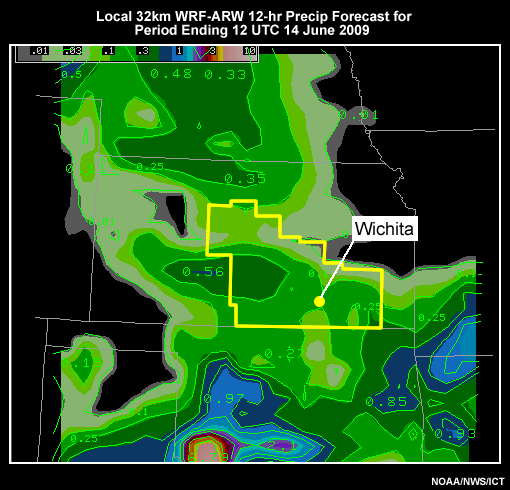
Description:
WRF-ARW at 32km resolution forecast precipitation. This is for a convective event which occurred over the WFO Wichita, KS forecast area. The precipitation totals are for the 12 hour period ending 12 UTC 14 June 2009.
File Name:
June14radar-WRF-ARW32.png
Credits:
NOAA/NWS/ICT
Copyright Terms:
COMET Standard Terms
of Use
Description:
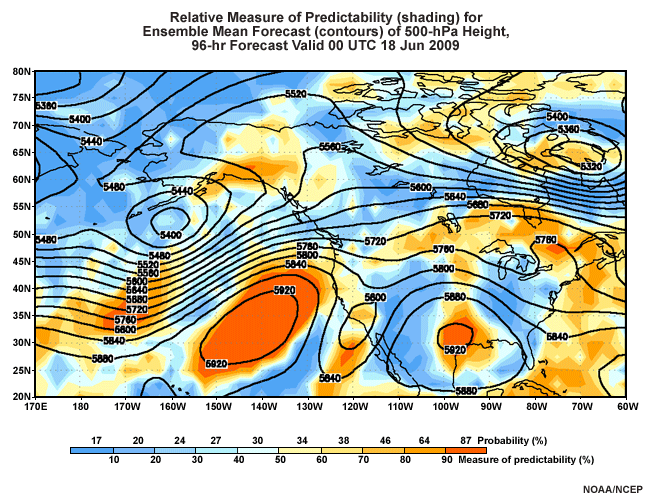
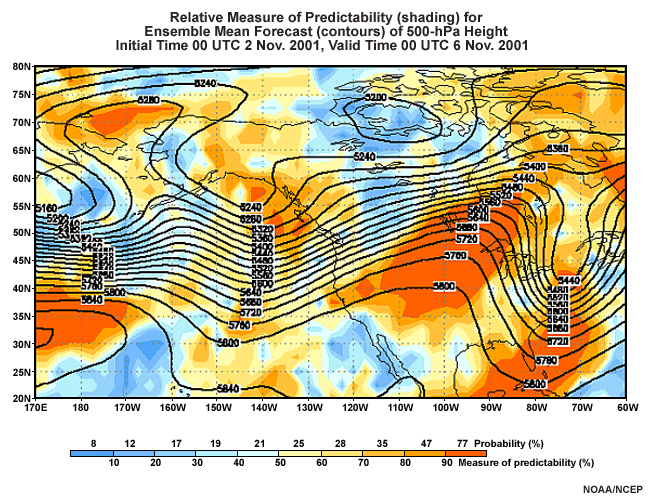
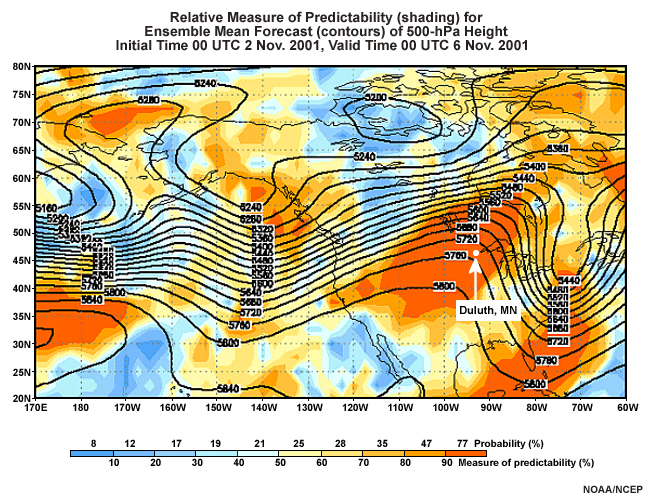
NCEP Relative Measure of Predictability (RMOP), an objective to describe the predictability of the flow, and of how likely a pattern is to verify, according to the color bar at the bottom of the graphic. Contours are GEFS mean 500hPa height contours.
File Name:
mmap_2009061400_96.png
Credits:
NOAA/NCEP
Copyright Terms:
COMET Standard Terms
of Use
Description:
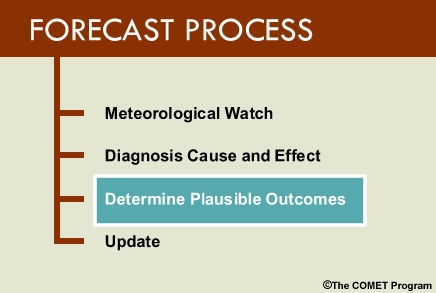
Image depicting the steps of the forecast process
File Name:
NWPico_analysis.jpg
Credits:
The COMET Program
Copyright Terms:
COMET Standard Terms
of Use
Description:
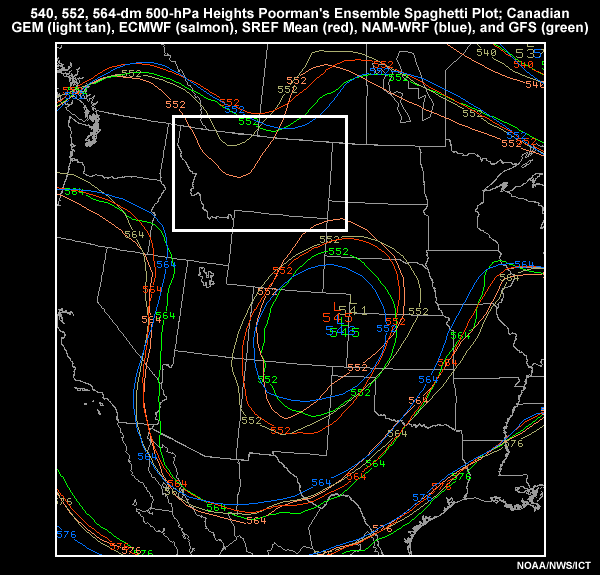
This is a poor man's ensemble. A poor man's ensemble is a different method of ensembling. While the previous ensembles we have studied combine different parameterizations and/or initial conditions of the same modeling system, this method combines different modeling systems and is done by overlaying these on a plan-view map. The image here illustrates this with a poor man's ensemble of the 500-hPa height using the Canadian GEM (light tan), ECMWF (salmon), SREF Mean (red), NAM-WRF (blue), and GFS (green). These are examined using the same techniques as a traditional ensemble explained in the spaghetti plots lesson.
File Name:
poorman_1000.png
Credits:
NOAA/NWS/ICT
Copyright Terms:
COMET Standard Terms
of Use
Description:
A National Centers for Environmental Prediction (NCEP) Relative Measure of Predictability (RMOP) diagram for 500-hPa geopotential height from the Global Ensemble Forecast System (GEFS) run on 00 UTC 21 July 2010, valid 00 UTC 24 July 2010 (a 72 hour forecast). Contours represent the ensemble mean 500-hPa height, while shading represents both how predictable the 500-hPa height is at each grid point and how likely it is to verify, based on the last 30 days of GEFS performance.
File Name:
q_RMOP.gif
Credits:
NOAA/NCEP
Copyright Terms:
COMET Standard Terms
of Use
Description:
Image of a NCEP Relative Measure of Predictability (RMOP) plot. This is an objective way that describes the predictability of the GEFS. This gives forecasters a measure of how likely a pattern is over their region of the country. In this image, warm and cool colors are areas of high and low predictability respectively. The contours are 500 mb height contours of the GEFS mean forecast. Along the bottom of the image is a color bar with numbers above and below. The numbers below the color bar represent the measure of predictability. This relates directly to the amount of spread that exists in the GEFS individual members. The numbers above the color bar represent the probability of occurrence. This is directly related to verification over the last 30 days. The numbers above and below the color bar reflect the image colors on the map.
File Name:
rmop_data-1.png
Credits:
NOAA/NCEP
Copyright Terms:
COMET Standard Terms
of Use
Description:
This is an image of the NCEP Relative Measure of Predictability (RMOP). This is an objective way that describes the predictability of the GEFS. This gives forecasters a measure of how likely a pattern is over their region of the country. In this image, warm and cool colors are areas of high and low predictability respectively. The contours are 500 mb height contours of the GEFS mean forecast. Along the bottom of the image is a color bar with numbers above and below. The numbers below the color bar represent the measure of predictability. This relates directly to the amount of spread that exists in the GEFS individual members. The numbers above the color bar represent the probability of occurrence. This is directly related to verification over the last 30 days. The numbers above and below the color bar reflect the image colors on the map.
File Name:
rmop_data-2.png
Credits:
NOAA/NCEP
Copyright Terms:
COMET Standard Terms
of Use
Description:
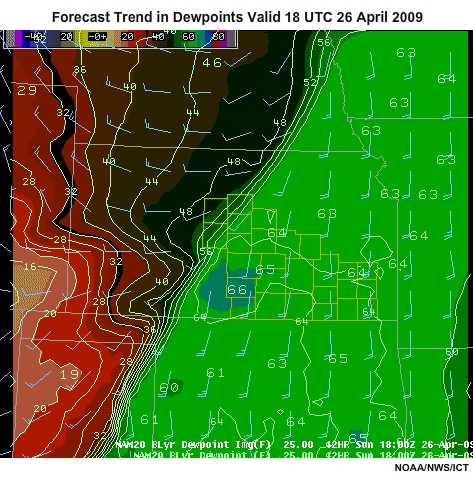
NAM-WRF boundary layer dewpoint forecast loop, valid date 18 UTC 26 April 2009. Note gradient of dewpoint across central Kansas from SW to NE, associated with a cold front moving into the forecast area. The loop begins with a forecast made 42 hours ago and ends with the 24 hour forecast.
File Name:
TD_animation_1_0001.htm
Credits:
NOAA/NWS/ICT
Copyright Terms:
COMET Standard Terms
of Use
Description:
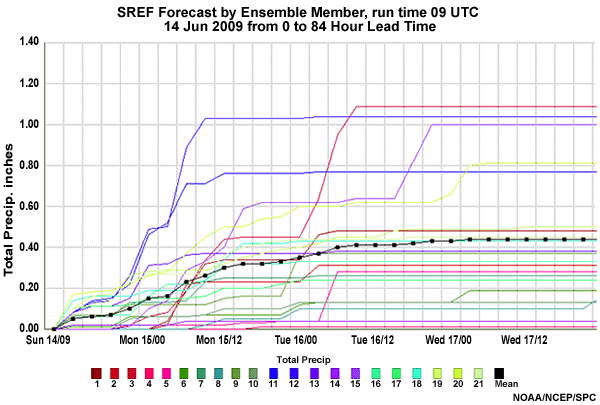
Plume diagram of precipitation totals from Short-Range Ensemble Forecast system for Hutchinson, KS indicating precipitation amount by ensemble member. Model used to create member is color coded. From SREF run beginning 09 UTC 14 June 2009.
File Name:
TotPcpn_SREF_HUT.png
Credits:
NOAA/NCEP/SPC
Copyright Terms:
COMET Standard Terms
of Use
Description:
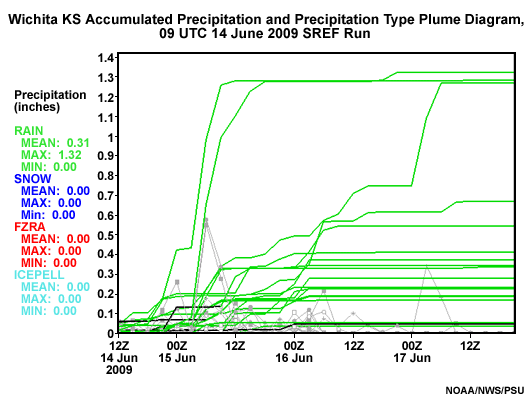
Plume diagram of precipitation totals from Short-Range Ensemble Forecast system for Wichita, KS indicating precipitation amount and type by ensemble member. Average, minimum and maximum precipitation amounts for each type are indicated in print.
File Name:
Wichita_KS_ptype_sref.png
Credits:
NOAA/NWS/PSU
Copyright Terms:
COMET Standard Terms
of Use
Description:
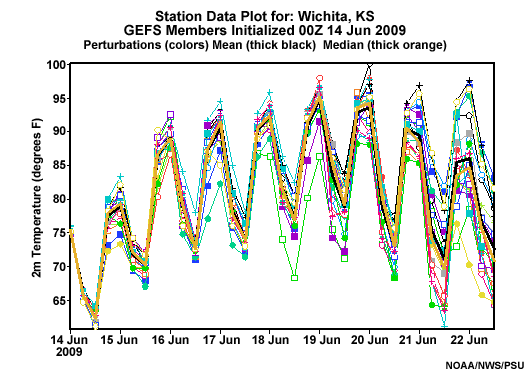
GEFS 2M Temperature Plume Diagram for 14 June 2009. The y-axis is temperature and the x-axis is time. Each trace represents the 2M temperature forecast for each GEFS member. The thicker goldenrod line represents the ensemble mean.
File Name:
Wichita_KS_tmp2m_GEFS.png
Credits:
NOAA/NCEP/PSU
Copyright Terms:
COMET Standard Terms
of Use