EPS Products Reference Guide »
Spaghetti Maps
Description
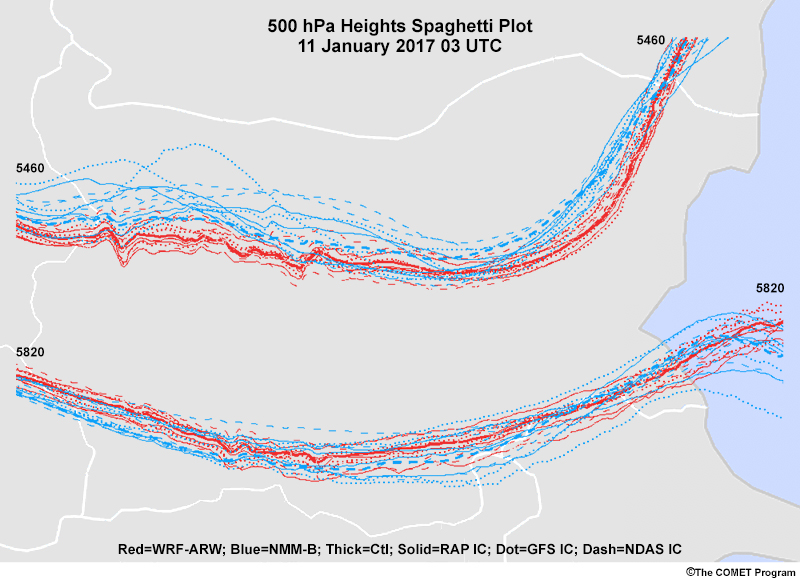
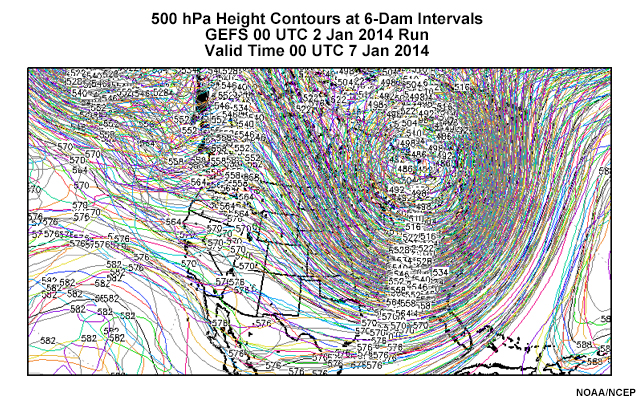
Spaghetti maps are plan-view maps of single values for a variable of interest from all of the ensemble members. They are typically plotted for one or a few key contour values (two in the example above). This keeps the presentation relatively simple while still giving a sense of the distribution of forecast outcomes for the areas around those contours. Contrast that plot with the one below, which contains all contours of the variable from all ensemble members. Clearly the result is hard to interpret!
Spaghetti maps can be generated for a variety of features, such as geopotential heights, precipitation of a certain amount, or a certain contour of temperature.