EPS Products Reference Guide
Media Gallery
Media elements used in this module are protected by a variety of copyright licenses. Please use the "copyright terms" link associated with each item below for more information.
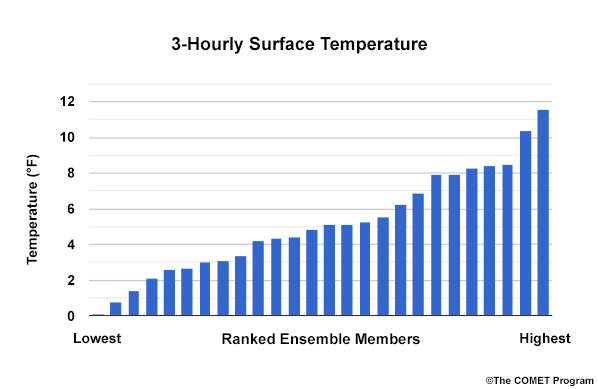
Description:
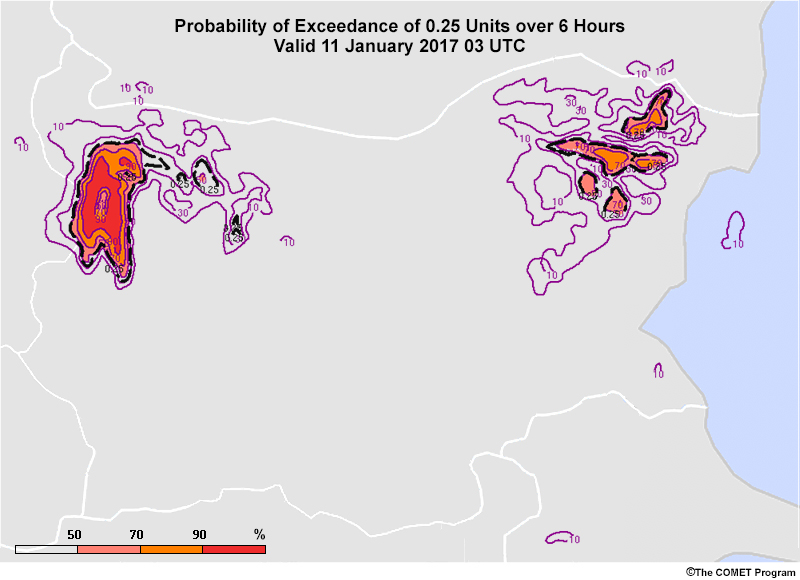
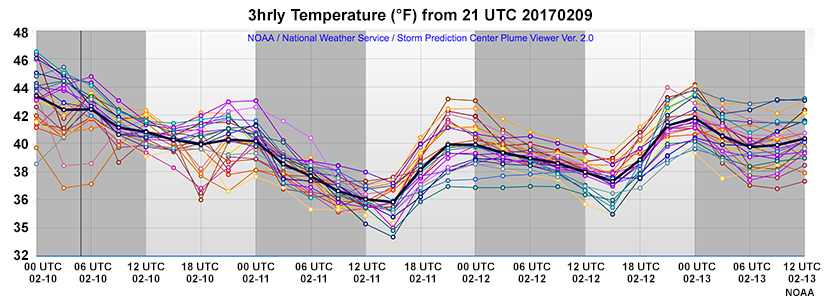
Probability of Exceedance plot for 3-hrly surface temperatures
File Name:
3hr_sfc_temp_ProbExceed.jpg
Credits:
©The COMET Program
Copyright Terms:
COMET Standard Terms of Use
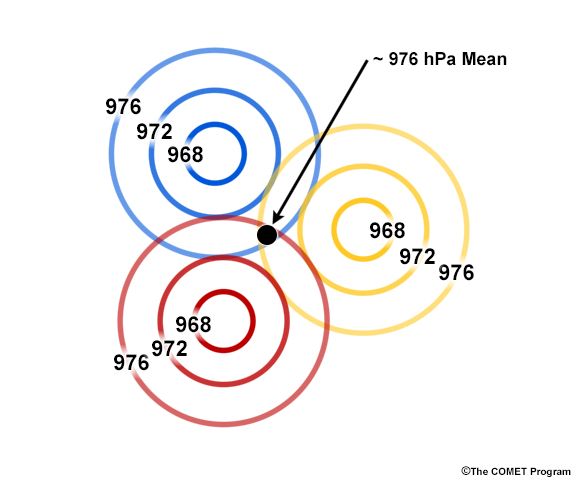
Description:
3 overlapping ensemble members with the same MSLP contours showing a mean value that is higher than any of the lowest central pressures
File Name:
averaging_central_pressures.jpg
Credits:
©The COMET Program
Copyright Terms:
COMET Standard Terms of Use
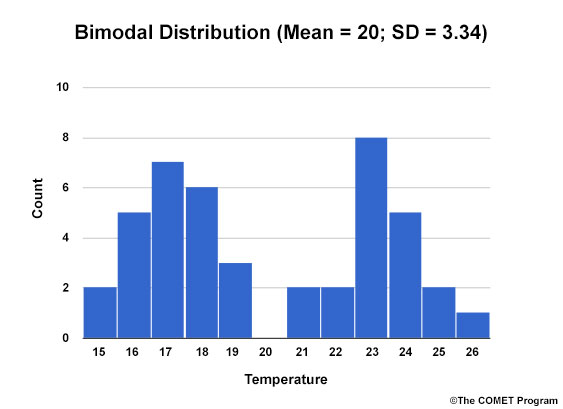
Description:
Bimodal distribution
File Name:
bimodal_distribution.jpg
Credits:
©The COMET Program
Copyright Terms:
COMET Standard Terms of Use
Description:
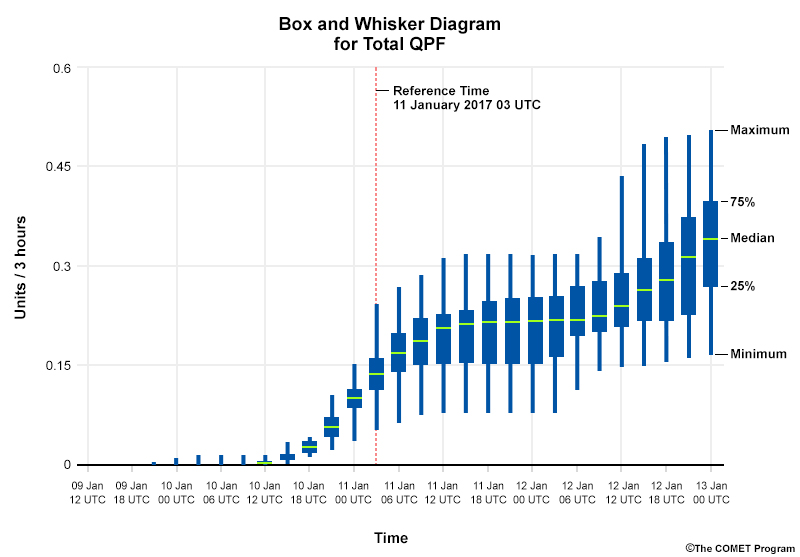
Typical EPS Box-and-Whisker Diagram Output for a Single Weather Variable
File Name:
box_whisker_epsgram_idealized_conceptual.jpg
Credits:
The COMET Program
Copyright Terms:
COMET Standard Terms of Use
Description:
Typical EPS Box-and-Whisker Diagram Distribution for a Single Weather Variable at a single time, with an area highlighted to go along with a description of the product
File Name:
box_whisker_epsgram_idealized_conceptual_box.jpg
Credits:
©The COMET Program
Copyright Terms:
COMET Standard Terms of Use
Description:
Typical EPS Box-and-Whisker Diagram Output for a Single Weather Variable
File Name:
box_whisker_epsgram_idealized_conceptual_cumulative.jpg
Credits:
©The COMET Program
Copyright Terms:
COMET Standard Terms of Use
Description:
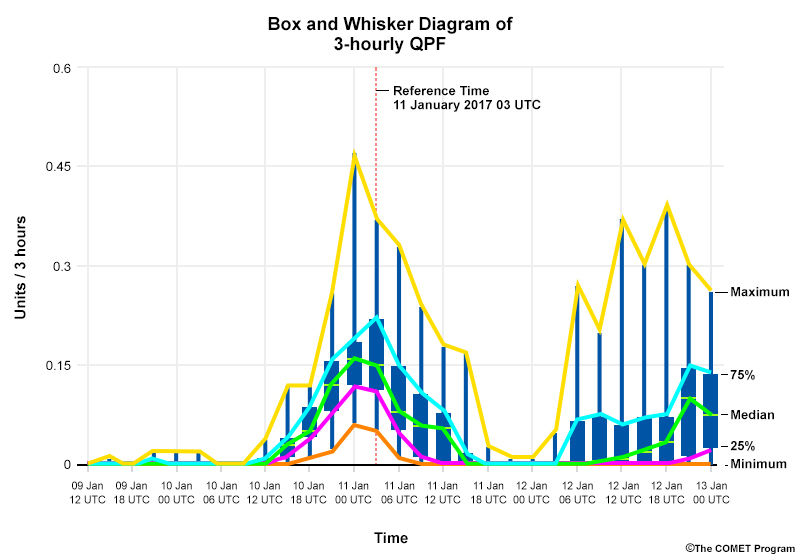
Typical EPS Box-and-Whisker Diagram Distribution for a Single Weather Variable at a single time
File Name:
box_whisker_epsgram_idealized_distribution_conceptual.jpg
Credits:
The COMET Program
Copyright Terms:
COMET Standard Terms of Use

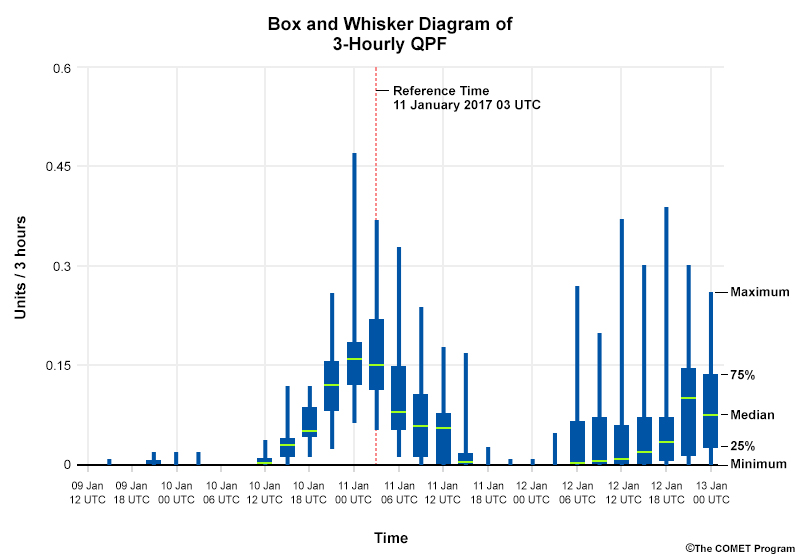
Description:
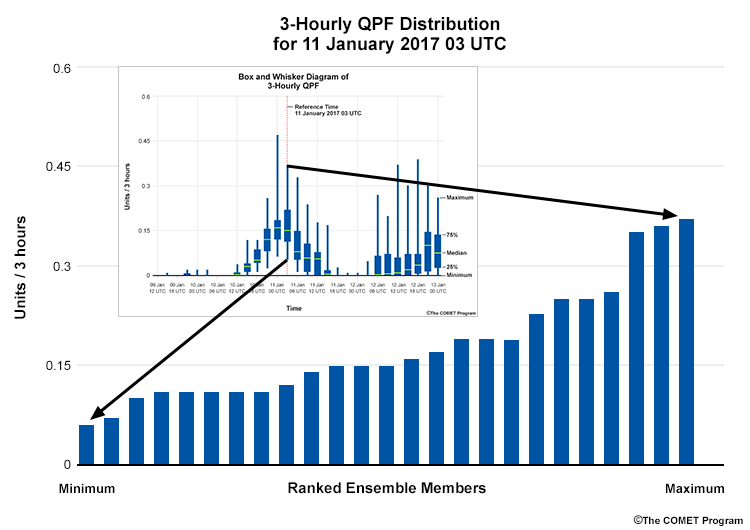
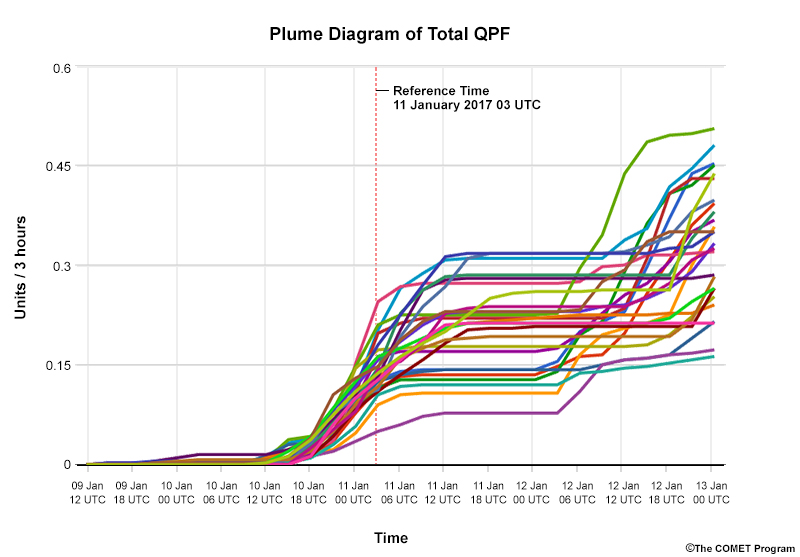
3-hourly QPF plume diagram inset on the distribution at time 11 January 2017 03 UTC.
File Name:
box_whisker_epsgram_idealized_distribution_conceptual_plume.jpg
Credits:
The COMET Program
Copyright Terms:
COMET Standard Terms of Use
Description:
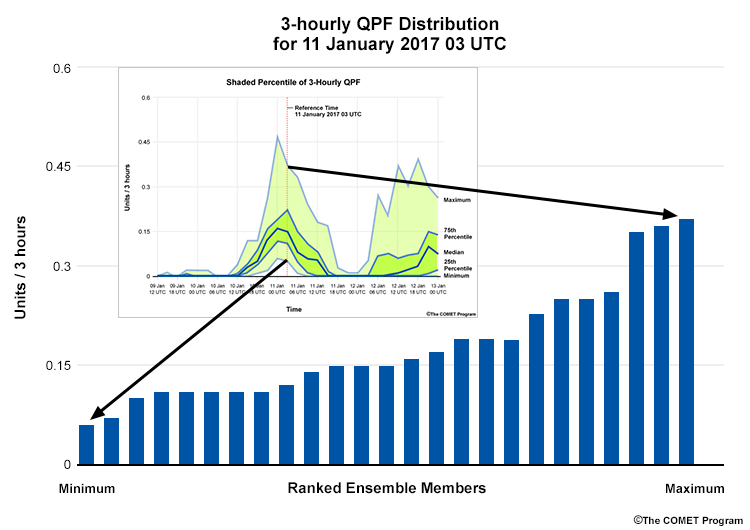
3-hourly QPF shaded percentile inset on the distribution at time 11 January 2017 03 UTC.
File Name:
box_whisker_epsgram_idealized_distribution_conceptual_shaded.jpg
Credits:
The COMET Program
Copyright Terms:
COMET Standard Terms of Use
Description:
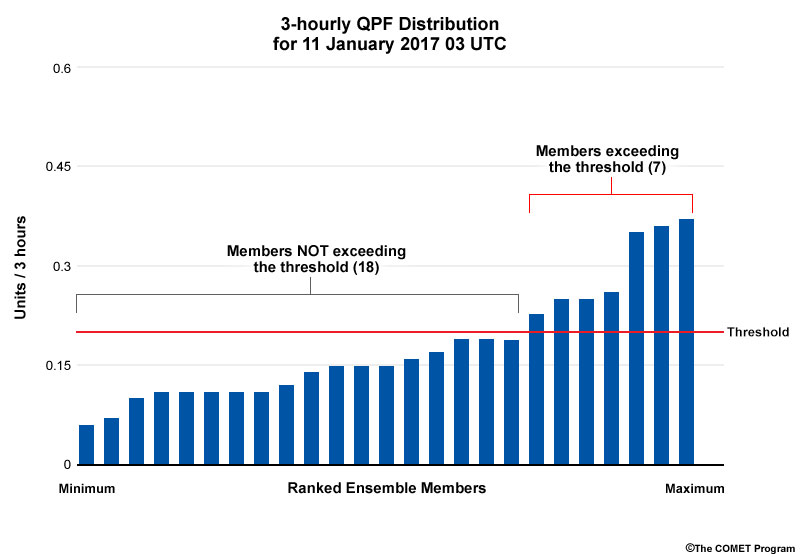
Typical EPS Box-and-Whisker Diagram Distribution for a Single Weather Variable at a single time with threshold value added.
File Name:
box_whisker_epsgram_idealized_distribution_conceptual_threshold.jpg
Credits:
©The COMET Program
Copyright Terms:
COMET Standard Terms of Use
Description:
Image of box and whisker diagram with lines connecting the min, 25th, 50th, 75th, and max percentiles over time, making a shaded percentile graphic
File Name:
box_whisker_lines_superimposed.jpg
Credits:
©The COMET Program
Copyright Terms:
COMET Standard Terms of Use

Description:
LOOP of Climatological Percentiles of IVT initialized at 00Z February 7, 2017
File Name:
climo_percent_ivt_1.htm
Credits:
NOAA
Copyright Terms:
COMET Standard Terms of Use
Description:
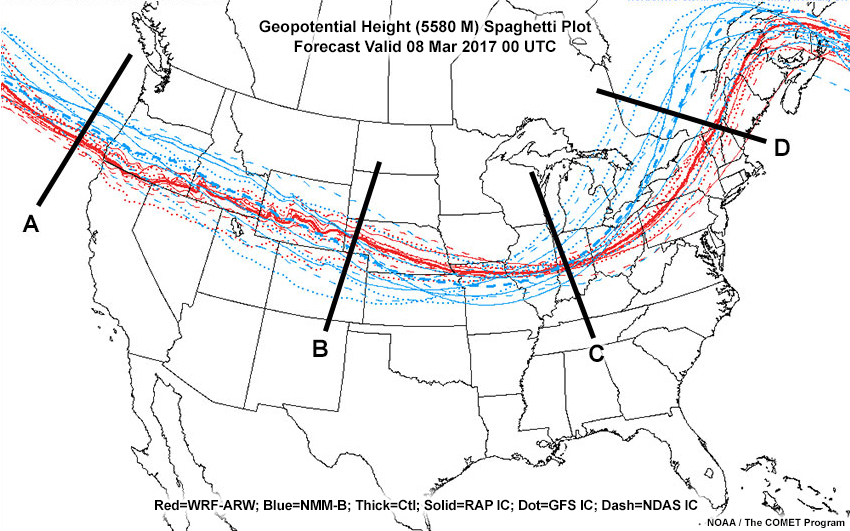
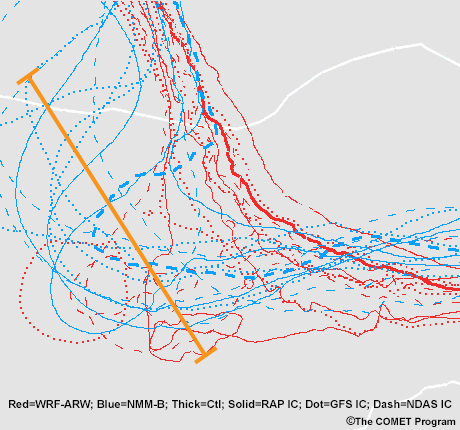
Geopotential Height (5580 M) Spaghetti Plot, Forecast Valid 08 Mar 2017 00UTC
File Name:
Clustering_SREF_Spaghetti_H5_5580__f069_question.jpg
Credits:
NOAA/The COMET Program
Copyright Terms:
COMET Standard Terms of Use
Description:
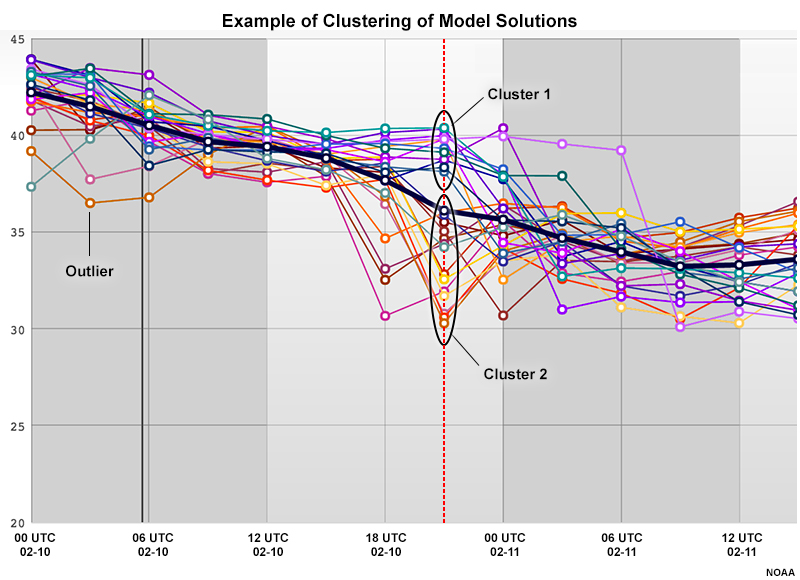
Example of clustering of model solutions.
File Name:
clustering_Td_SREF_21Z_020917_Vancouver.jpg
Credits:
NOAA
Copyright Terms:
COMET Standard Terms of Use
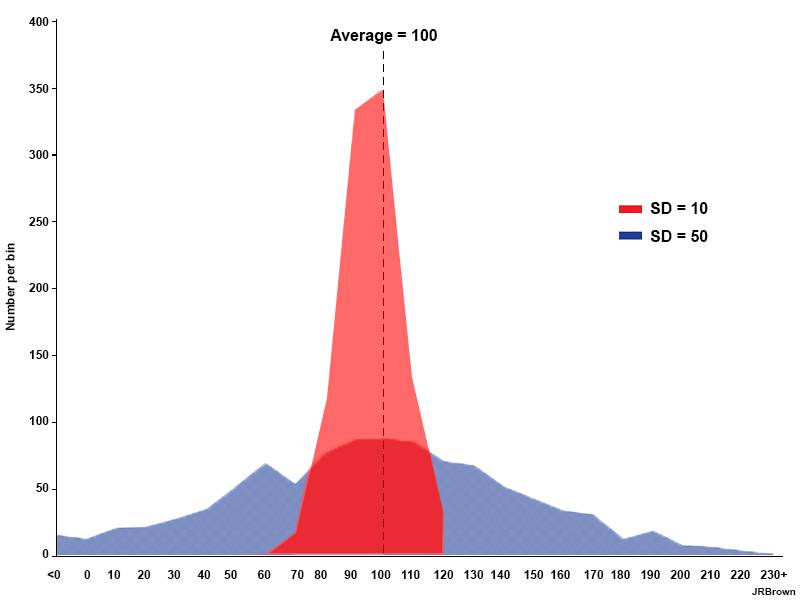
Description:
Diagram of a high and low standard deviation scenario, both with the same mean
File Name:
Comparison_standard_deviations.jpg
Credits:
JRBrown
Copyright Terms:
COMET Standard Terms of Use
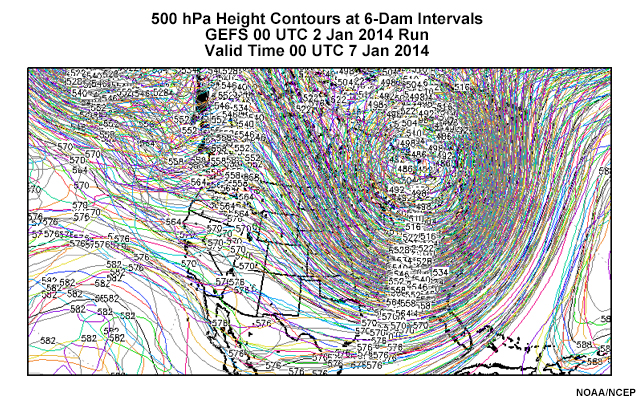
Description:
Plot of 21 Global Ensemble Forecast System 500-hPa Height contours at 60-meter intervals.
File Name:
crazyspag.jpg
Credits:
NOAA/NCEP
Copyright Terms:
COMET Standard Terms of Use
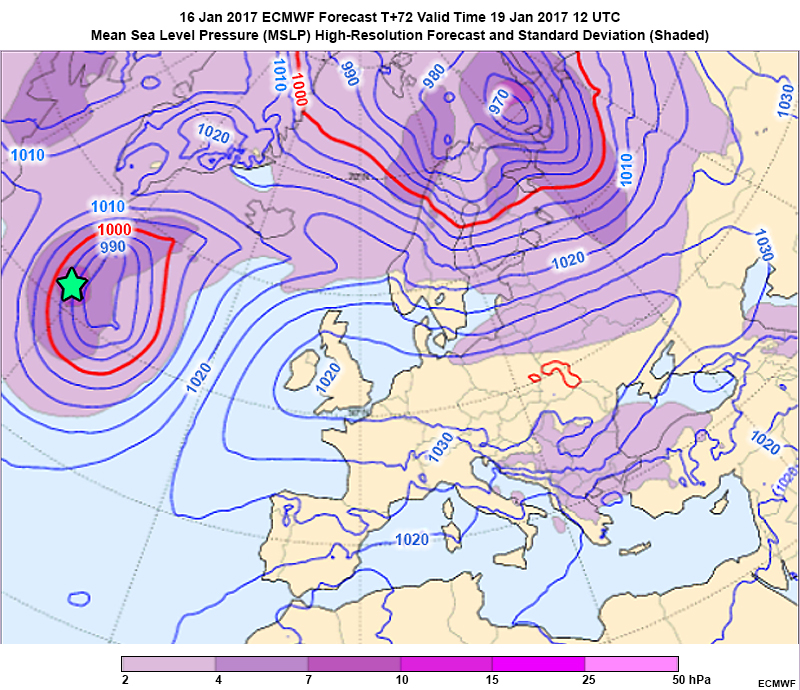
Description:
16 Jan 2017 ECMWF Forecast T+72 Valid Time 19 Jan 2017 12UTC MSLP High-Resolution Forecast and Standard Deviation
File Name:
ecmwf_mslp_highRes_16jan2017.jpg
Credits:
ECMWF
Copyright Terms:
COMET Standard Terms of Use
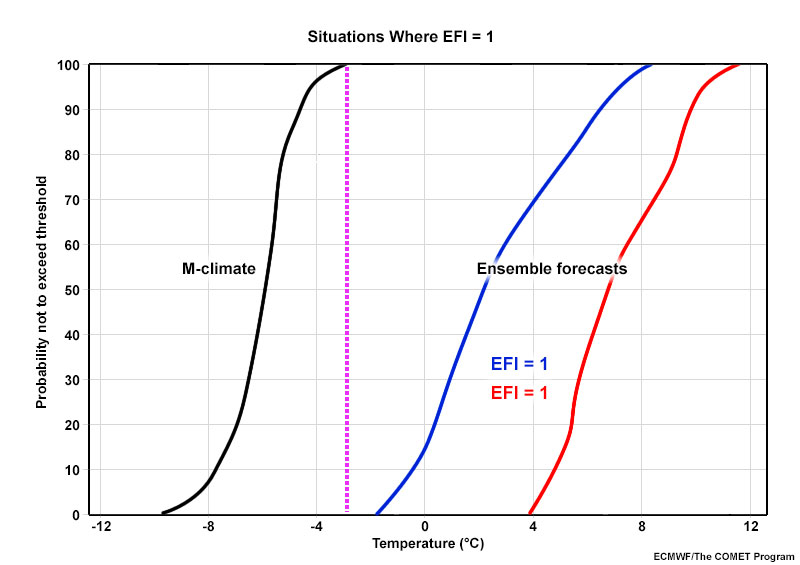
Description:
Graph showing sample configurations where the Extreme Forecast Index equals 1
File Name:
efi_equals1.jpg
Credits:
The COMET Program
Copyright Terms:
COMET Standard Terms of Use
Description:
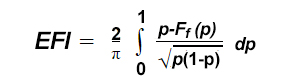
EFI equation
File Name:
efi_equation.jpg
Credits:
©The COMET Program
Copyright Terms:
COMET Standard Terms of Use
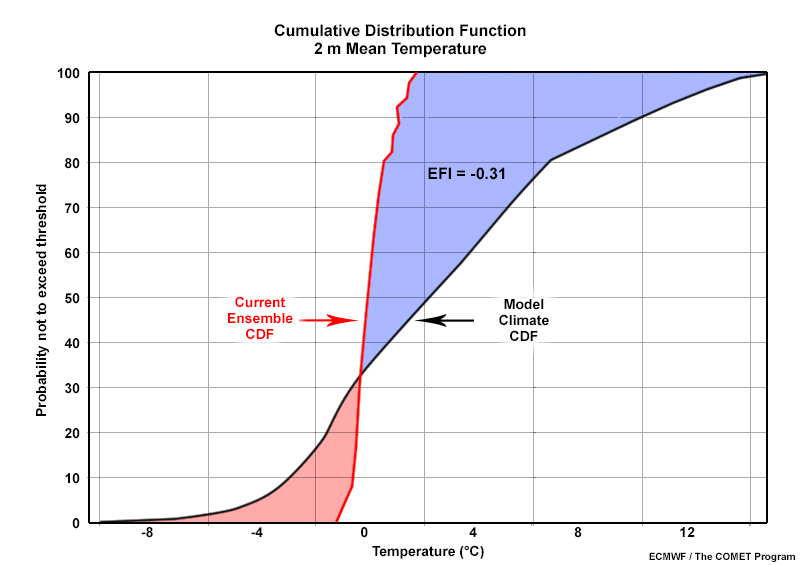
Description:
Current ensemble and model climatology CDFs (Cumulative Distribution Function)for 2m mean temperature, with mixed negative data
File Name:
EFI_mixed_negative.jpg
Credits:
ECMWF/The COMET Program
Copyright Terms:
COMET Standard Terms of Use
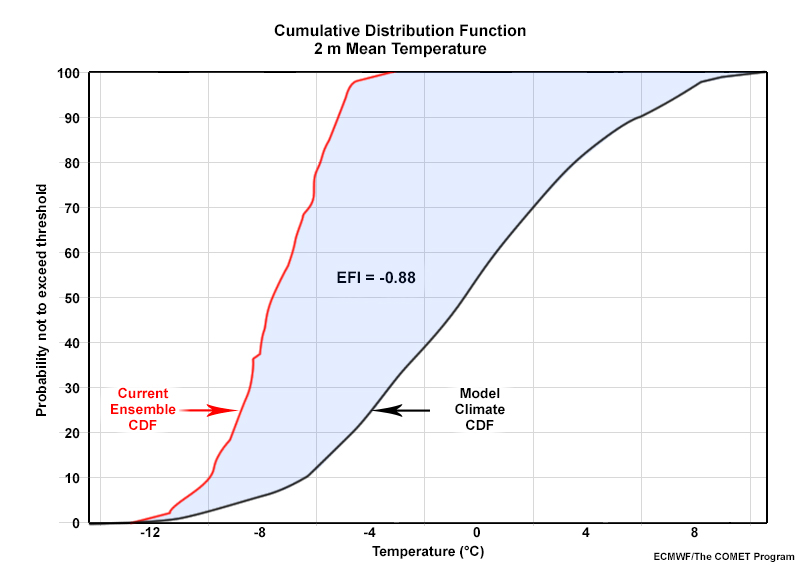
Description:
Current ensemble and model climatology CDFs (Cumulative Distribution Function)for 2m mean temperature, with negative data
File Name:
EFI_negative.jpg
Credits:
ECMWF/The COMET Program
Copyright Terms:
COMET Standard Terms of Use
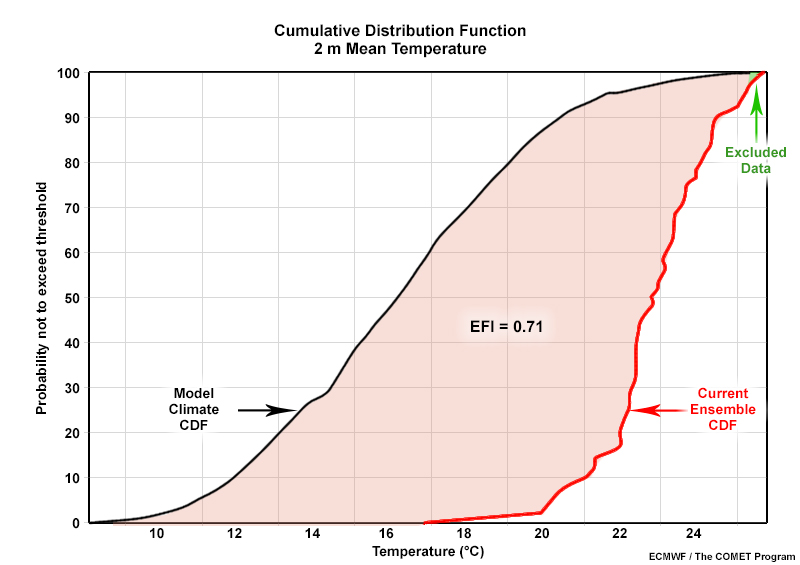
Description:
Current ensemble and model climatology CDFs (Cumulative Distribution Function)for 2m mean temperature, with positive data
File Name:
EFI_positive.jpg
Credits:
ECMWF/The COMET Program
Copyright Terms:
COMET Standard Terms of Use
Description:
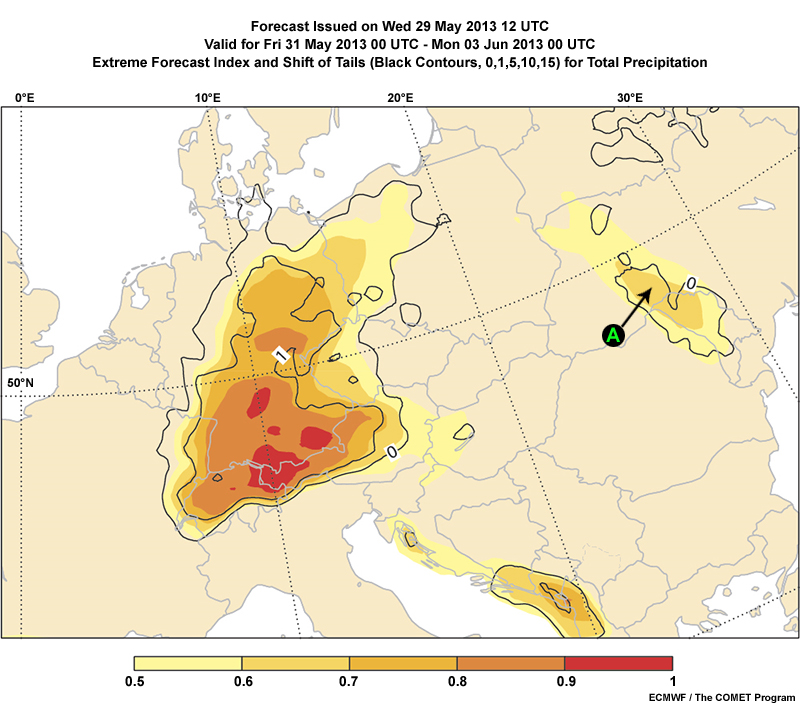
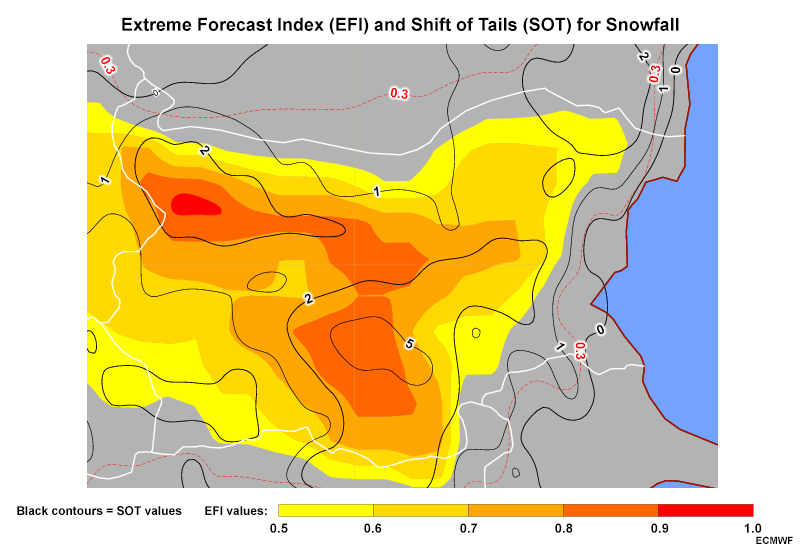
ECMWF Extreme Forecast Index and Shift of Tails forecast for total precipitation issued on Wed 29 May 2013 12UTC valid for Fri 31 May 2013 00UTC to Mon 03 Jun 2013 00UTC; one part of the graphic is labeled for an interaction
File Name:
EFI_SOT_Precip_Example_for_Interaction-a.jpg
Credits:
ECMWF/The COMET Program
Copyright Terms:
COMET Standard Terms of Use
Description:
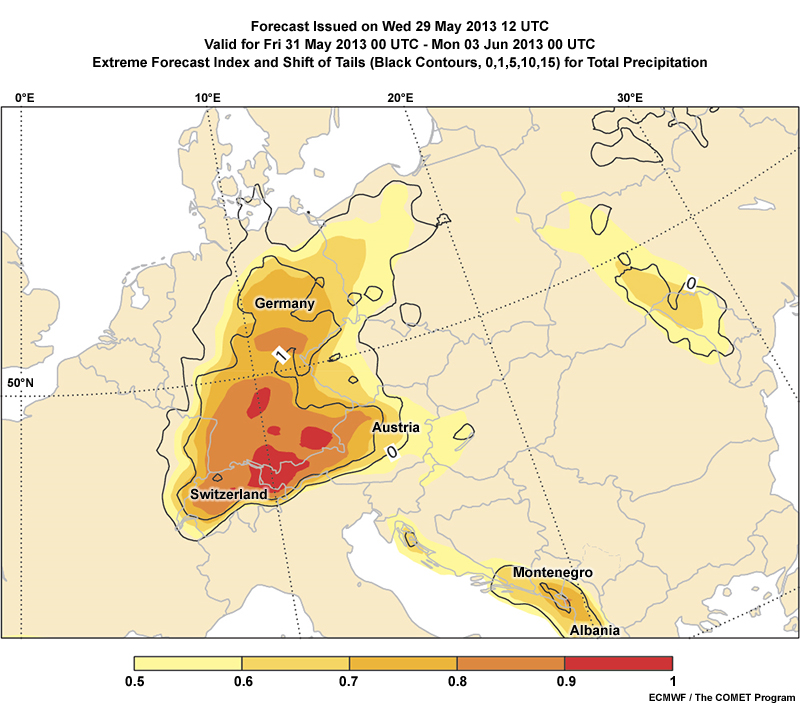
ECMWF Extreme Forecast Index and Shift of Tails forecast for total precipitation issued on Wed 29 May 2013 12UTC valid for Fri 31 May 2013 00UTC to Mon 03 Jun 2013 00UTC; some countries are labeled for an interaction
File Name:
EFI_SOT_Precip_Example_for_Interaction-b.jpg
Credits:
ECMWF/The COMET Program
Copyright Terms:
COMET Standard Terms of Use
Description:
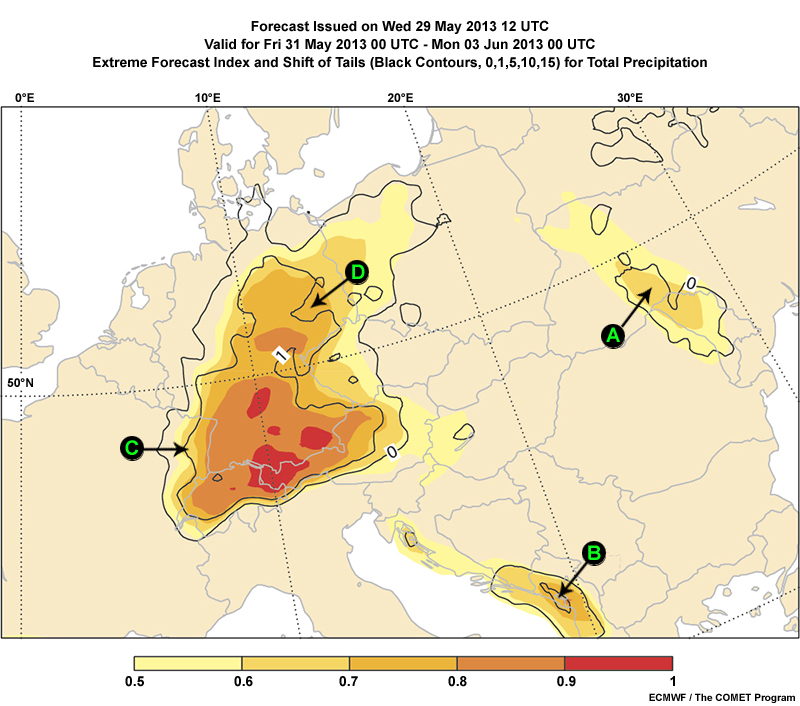
ECMWF Extreme Forecast Index and Shift of Tails forecast for total precipitation issued on Wed 29 May 2013 12UTC valid for Fri 31 May 2013 00UTC to Mon 03 Jun 2013 00UTC; some areas are labeled for an interaction
File Name:
EFI_SOT_Precip_Example_for_Interaction-c.jpg
Credits:
ECMWF/The COMET Program
Copyright Terms:
COMET Standard Terms of Use
Description:
EFI/shift of tails thumbnail
File Name:
efi_thumb.jpg
Credits:
The COMET Program
Copyright Terms:
COMET Standard Terms of Use
Description:
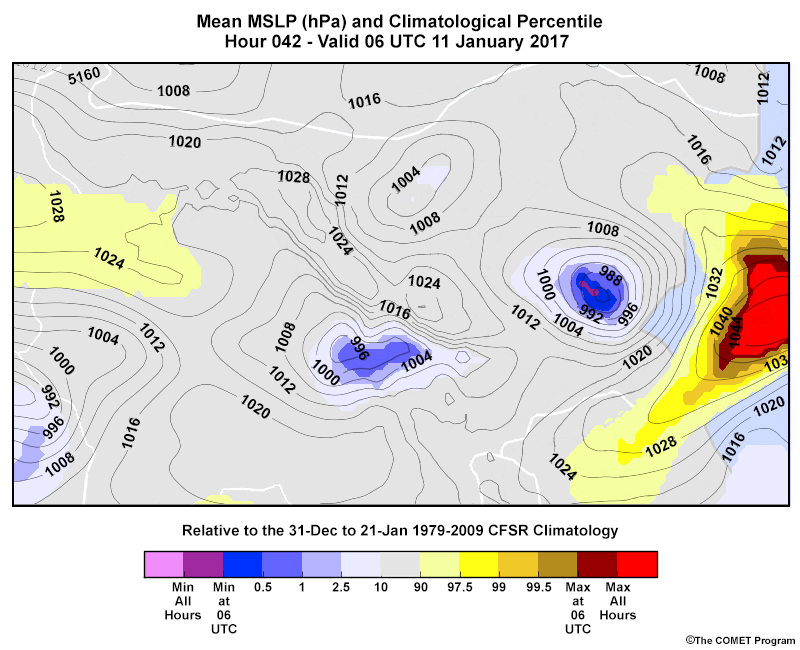
Conceptual Climatological Percentile graphic of MSLP.
File Name:
enhanced_climatology_idealized_conceptual_mslp.jpg
Credits:
The COMET Program
Copyright Terms:
COMET Standard Terms of Use
Description:
Ensemble Climatological Percentile thumbnail
File Name:
ens_climato_percent_thumb.jpg
Credits:
The COMET Program
Copyright Terms:
COMET Standard Terms of Use
Description:
Example of a cyclone tracking trajectory plot of gradient wind vorticity extremum
File Name:
ens_traj_cyclone_tracking_gradWindVortEx.jpg
Credits:
UQAM-Montreal Weather Centre
Copyright Terms:
COMET Standard Terms of Use
Description:
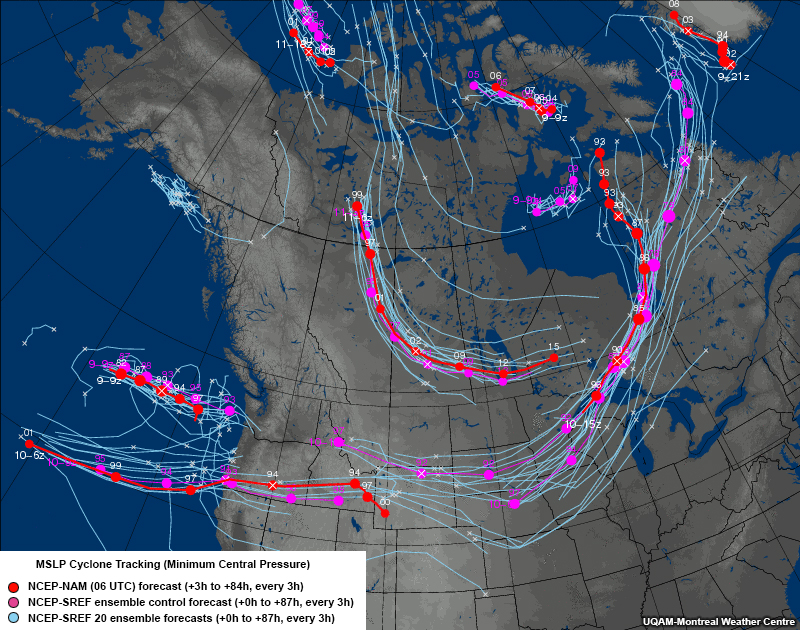
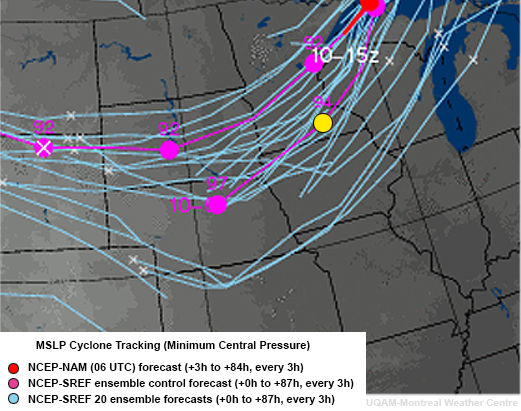
Example of a cyclone tracking trajectory plot showing minimum central pressure
File Name:
ens_traj_cyclone_tracking_minCentralPress.jpg
Credits:
UQAM-Montreal Weather Centre
Copyright Terms:
COMET Standard Terms of Use
Description:
EPSgram/Box&Whisker thumbnail
File Name:
EPSgram_box_whisker_thumb.jpg
Credits:
The COMET Program
Copyright Terms:
COMET Standard Terms of Use
Description:
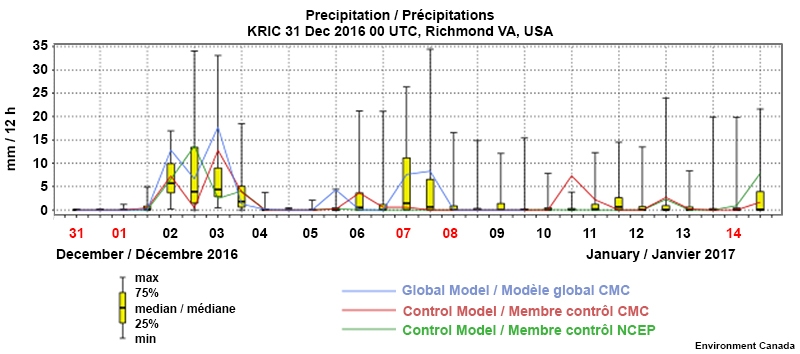
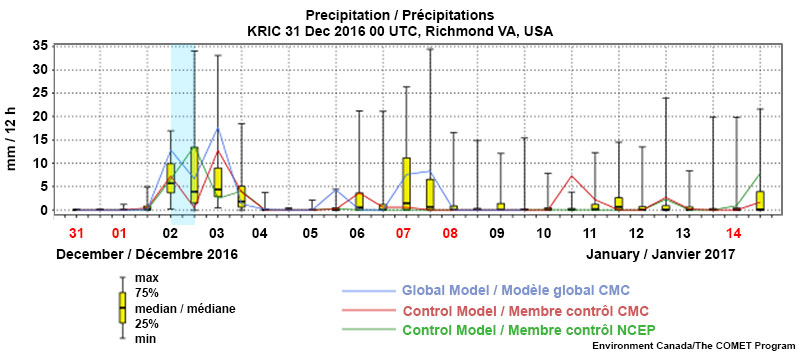
mm/12-h precipitation for Richmond VA, USA in Dec 2016 and Jan 2017 from 3 ensemble models: one global model CMC and 2 control models, CMC and NCEP
File Name:
EPSGram_Precip_2016_Dec_31_00Z.jpg
Credits:
Environment Canada
Copyright Terms:
COMET Standard Terms of Use
Description:
mm/12-h precipitation for Richmond VA, USA in Dec 2016 and Jan 2017 from 3 ensemble models: one global model CMC and 2 control models, CMC and NCEP; part of the graph is highlighted for an exercise
File Name:
EPSGram_Precip_2016_Dec_31_00Z_circle.jpg
Credits:
Environment Canada/The COMET Program
Copyright Terms:
COMET Standard Terms of Use

Description:
Box and Whiskers of maximum temperature (red) and minimum temperature (blue) along with shaded percentiles of the model climatology
File Name:
EPSGram_with_model_climo.jpg
Credits:
ECMWF
Copyright Terms:
COMET Standard Terms of Use
Description:
Typical Extreme Forecast Map Output for a Single Weather Variable
File Name:
extreme_forecast_index_idealized_conceptual.jpg
Credits:
ECMWF
Copyright Terms:
COMET Standard Terms of Use
Description:
Low pressure center trajectories thumbnail
File Name:
low_press_ctr_traj_thumb.jpg
Credits:
UQAM-Montreal Weather Centre
Copyright Terms:
COMET Standard Terms of Use
Description:
Example of a low pressure center trajectory plot
File Name:
low_tracks_idealized_conceptual.jpg
Credits:
UQAM-Montreal Weather Centre
Copyright Terms:
COMET Standard Terms of Use
Description:
Typical EPS Pressure Center Track Diagram Output for a Single Weather Variable
File Name:
low_tracks_idealized_conceptual.jpg
Credits:
UQAM-Montreal Weather Centre
Copyright Terms:
COMET Standard Terms of Use
Description:
Typical EPS Pressure Center Track Diagram Output for a Single Weather Variable zoomed in to an area
File Name:
low_tracks_idealized_conceptual_zoomDot.jpg
Credits:
UQAM-Montreal Weather Centre
Copyright Terms:
COMET Standard Terms of Use
Description:
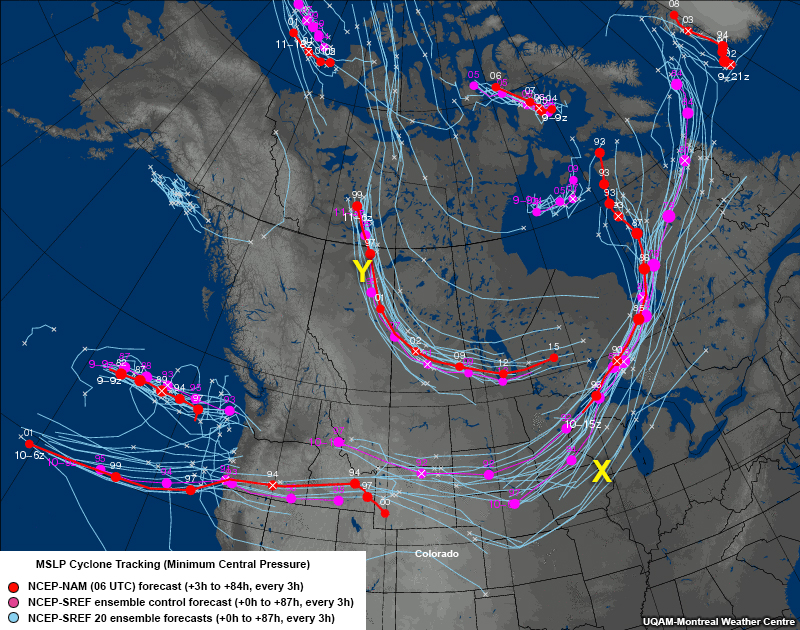
Example of a low pressure center trajectory plot with areas labeled for a discussoin
File Name:
low_tracks_idealized_conceptual-labeled.jpg
Credits:
UQAM-Montreal Weather Centre
Copyright Terms:
COMET Standard Terms of Use
Description:
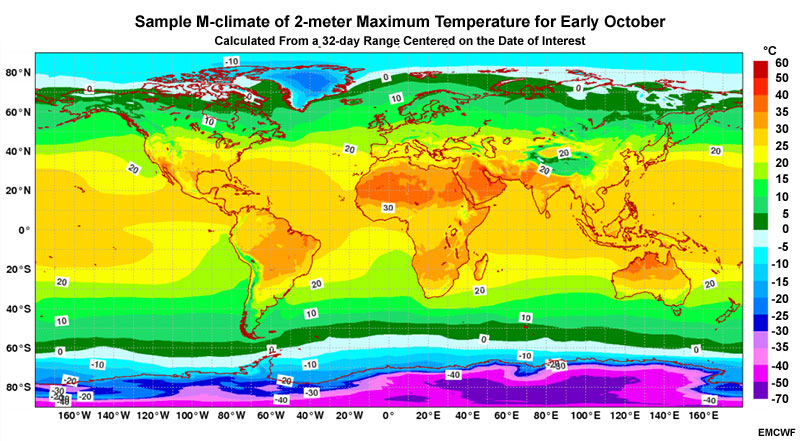
M-climate Median of 2-Metre Maximum Temperature at the Beginning of October
File Name:
m-climate_example.jpg
Credits:
ECMWF
Copyright Terms:
COMET Standard Terms of Use
Description:
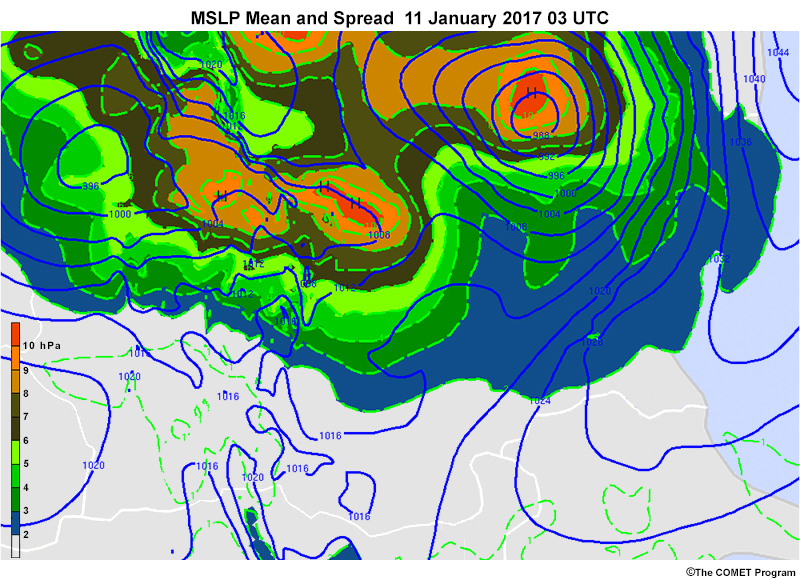
Typical EPS Mean and Spread Diagram Output for a Single Weather Variable
File Name:
mean_and_spread_idealized_conceptual.jpg
Credits:
The COMET Program
Copyright Terms:
COMET Standard Terms of Use

Description:
Typical EPS Mean and Spread Diagram Output for a Single Weather Variable with one area marked to accompany a discussion
File Name:
mean_and_spread_idealized_conceptual_dot.jpg
Credits:
The COMET Program
Copyright Terms:
COMET Standard Terms of Use
Description:
Mean and Spread thumbnail
File Name:
mean_spread_thumb.jpg
Credits:
The COMET Program
Copyright Terms:
COMET Standard Terms of Use
Description:
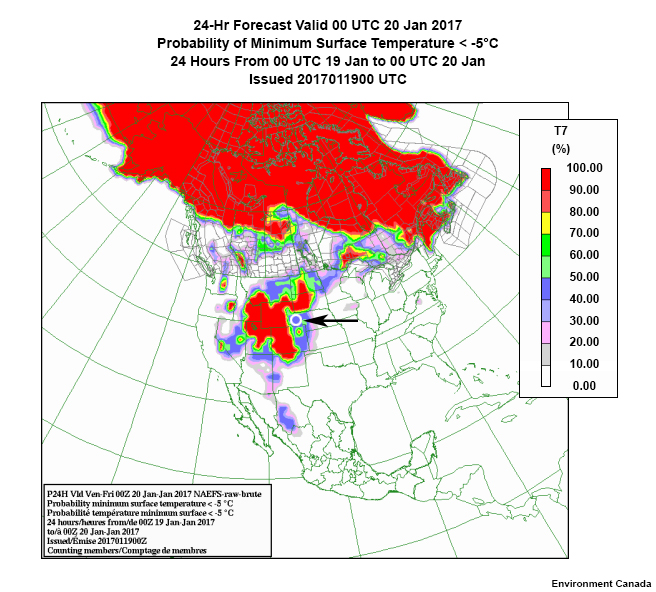
Probability of temperatures below -5˚C 19 Jan 2017 12UTC over North America
File Name:
msc_prob_temp_below_minus5c.jpg
Credits:
Environment Canada
Copyright Terms:
COMET Standard Terms of Use
Description:
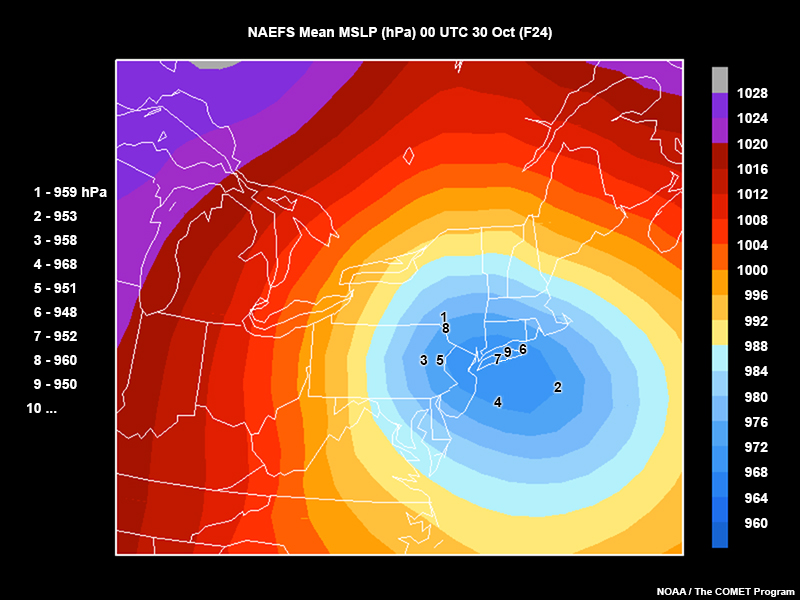
NAEFs mean MSLP (hPa) 00Z 30 Oct
File Name:
naefs_mslp_hurrSandy_30oct.jpg
Credits:
NOAA/The COMET Program
Copyright Terms:
COMET Standard Terms of Use
Description:
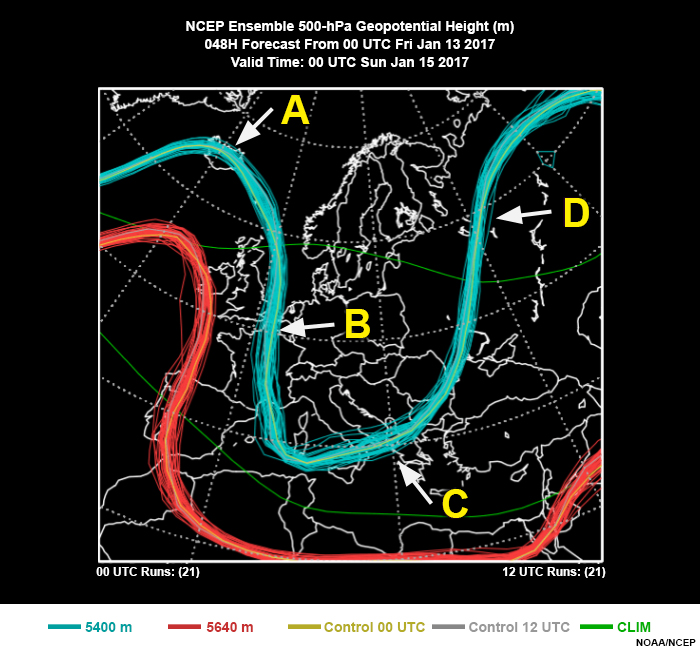
NCEP Ensemble 500mb Z 048H forecast from 00Z Fri Jan 13 2017, valid time 00Z Sun Jan 15 2017
File Name:
ncep_ensemble_500mb_jan2017.jpg
Credits:
NOAA/NCEP
Copyright Terms:
COMET Standard Terms of Use
Description:
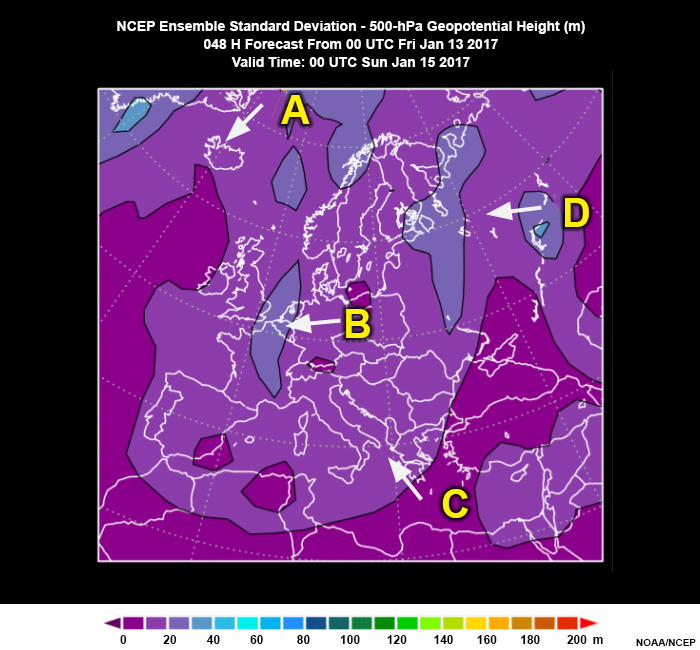
NCEP standard deviation plot over Europe with labels indicating four areas of spread that match up with the spaghetti plot locations, 500mb Z 048H forecast from 00Z Fri Jan 13 2017, valid time 00Z Sun Jan 15 2017
File Name:
ncep_ensemble_500mb_jan2017_std_dev.jpg
Credits:
NOAA/NCEP
Copyright Terms:
COMET Standard Terms of Use
Description:
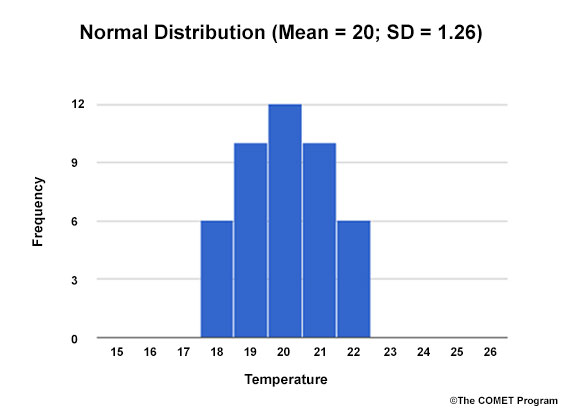
Normal distribution
File Name:
normal_distribution.jpg
Credits:
©The COMET Program
Copyright Terms:
COMET Standard Terms of Use
Description:
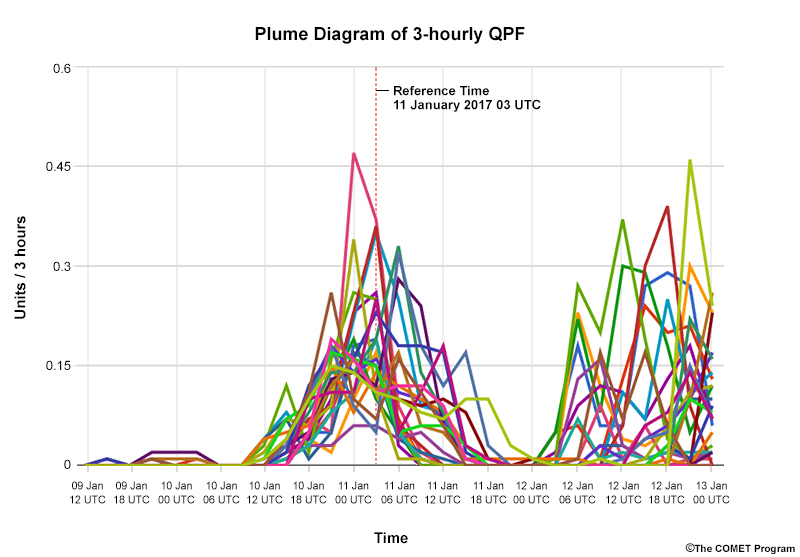
Typical EPS Plume Diagram Output for a Single Weather Variable
File Name:
plume_idealized_conceptual.jpg
Credits:
The COMET Program
Copyright Terms:
COMET Standard Terms of Use
Description:
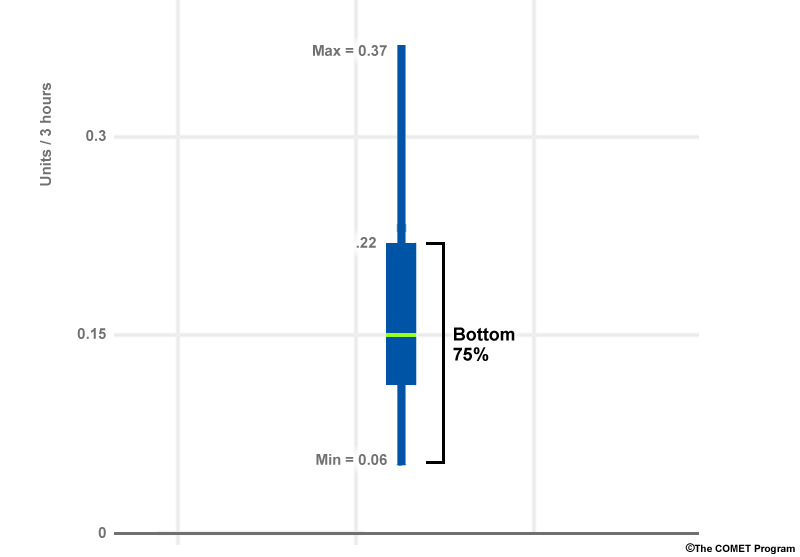
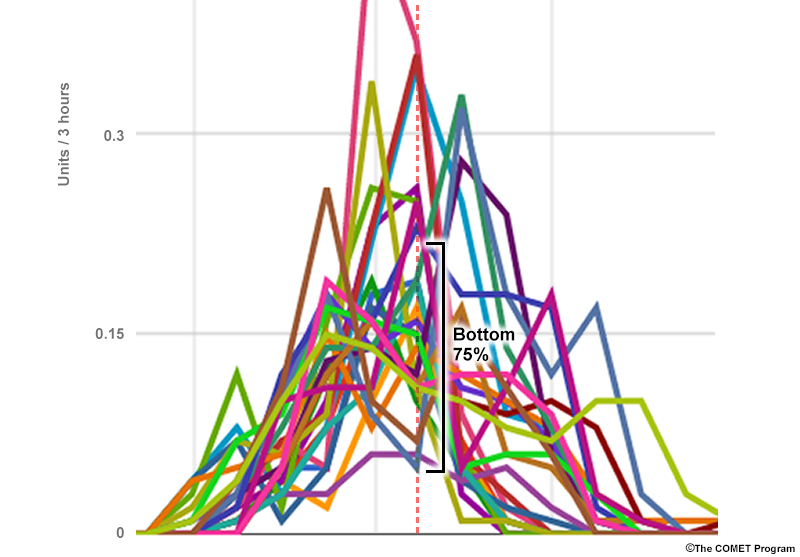
Conceptual plume diagram with bottom 75% of distribution highlighted.
File Name:
plume_idealized_conceptual_box.jpg
Credits:
The COMET Program
Copyright Terms:
COMET Standard Terms of Use
Description:
Typical EPS Plume Diagram Output for a Single Cumulative Weather Variable
File Name:
plume_idealized_conceptual_cumulative.jpg
Credits:
The COMET Program
Copyright Terms:
COMET Standard Terms of Use
Description:
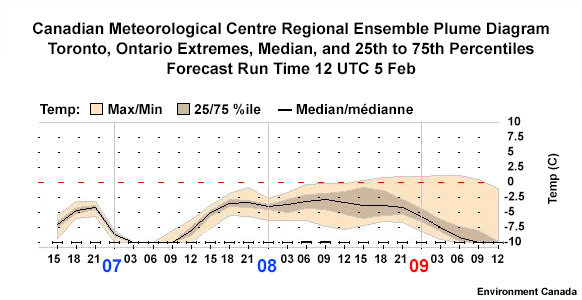
Canadian Met. Center regional ensemble plume diagram for Toronto Ontario showing extremes, median, and 25th to 75th percentiles from forecast run time 12 UTC 6 Feb
File Name:
plume_meanspr.jpg
Credits:
Environment Canada
Copyright Terms:
COMET Standard Terms of Use
Description:
Plume thumbnail
File Name:
plumes_thumb.jpg
Credits:
The COMET Program
Copyright Terms:
COMET Standard Terms of Use
Description:
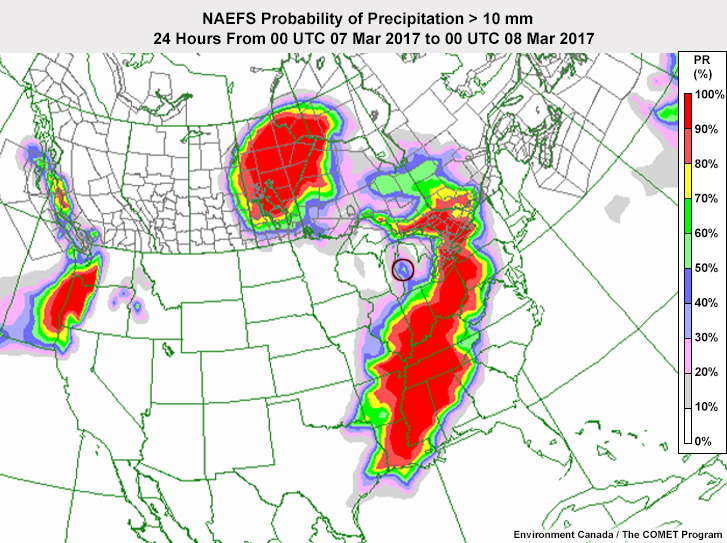
NAEFS Probability of Precipitation > 10 mm / 24h, From 00Z 07 Mar 2017 to 00Z 08 Mar 2017
File Name:
Prob__series_2017030600_10mm.jpg
Credits:
Environment Canada/The COMET Program
Copyright Terms:
COMET Standard Terms of Use
Description:
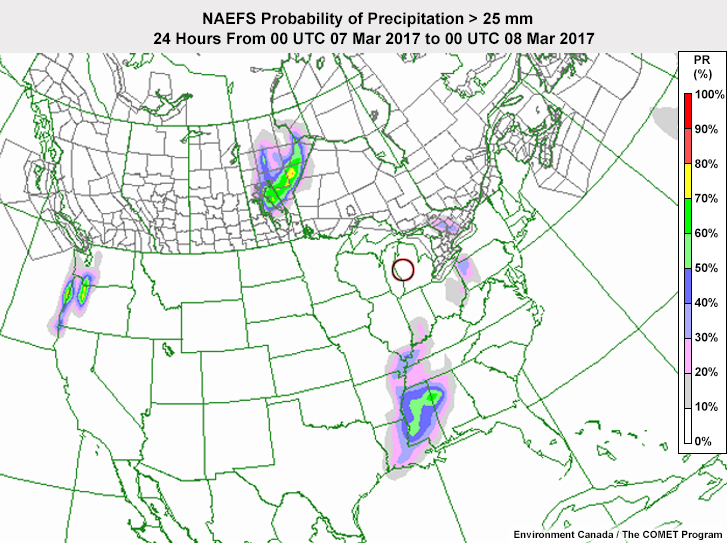
NAEFS Probability of Precipitation > 25 mm / 24h, From 00Z 07 Mar 2017 to 00Z 08 Mar 2017
File Name:
Prob__series_2017030600_25mm.jpg
Credits:
Environment Canada/The COMET Program
Copyright Terms:
COMET Standard Terms of Use
Description:
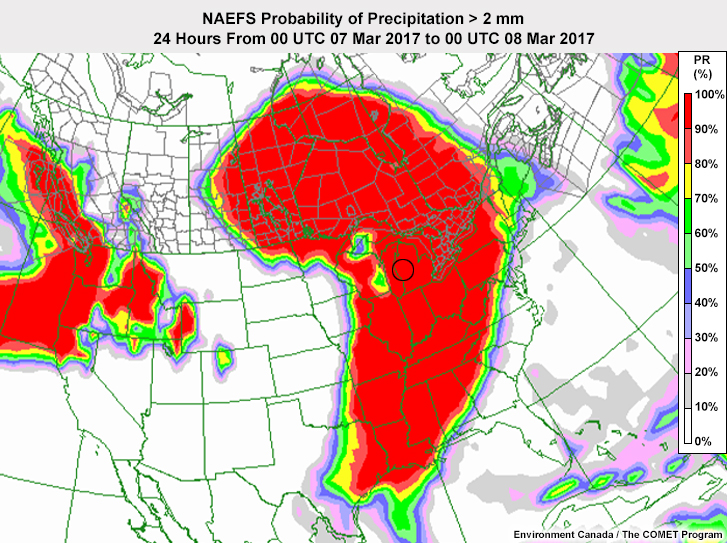
NAEFS Probability of Precipitation > 2 mm / 24h, From 00Z 07 Mar 2017 to 00Z 08 Mar 2017
File Name:
Prob__series_2017030600_2mm.jpg
Credits:
Environment Canada/The COMET Program
Copyright Terms:
COMET Standard Terms of Use
Description:
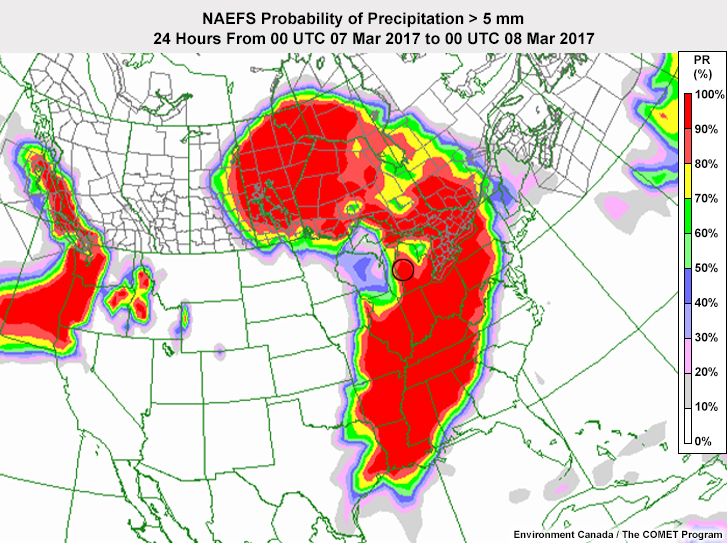
NAEFS Probability of Precipitation > 5 mm / 24h, 24 Hours From 00Z 07 Mar 2017 to 00Z 08 Mar 2017
File Name:
Prob__series_2017030600_5mm.jpg
Credits:
Environment Canada/The COMET Program
Copyright Terms:
COMET Standard Terms of Use
Description:
Probability of exceedance thumbnail
File Name:
prob_exceed_thumb.jpg
Credits:
The COMET Program
Copyright Terms:
COMET Standard Terms of Use
Description:
Typical Probability of Exceedance Map Output for a Single Weather Variable
File Name:
probability_exceedance_idealized_conceptual.jpg
Credits:
The COMET Program
Copyright Terms:
COMET Standard Terms of Use
Description:
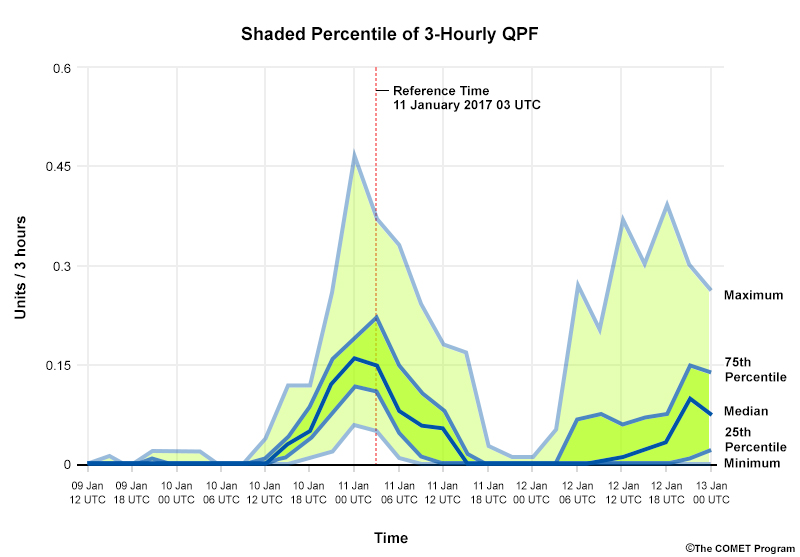
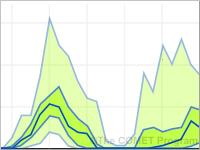
Typical EPS Shaded Percentile Diagram Output for a Single Weather Variable
File Name:
shaded_percentile_idealized_conceptual.jpg
Credits:
The COMET Program
Copyright Terms:
COMET Standard Terms of Use
Description:
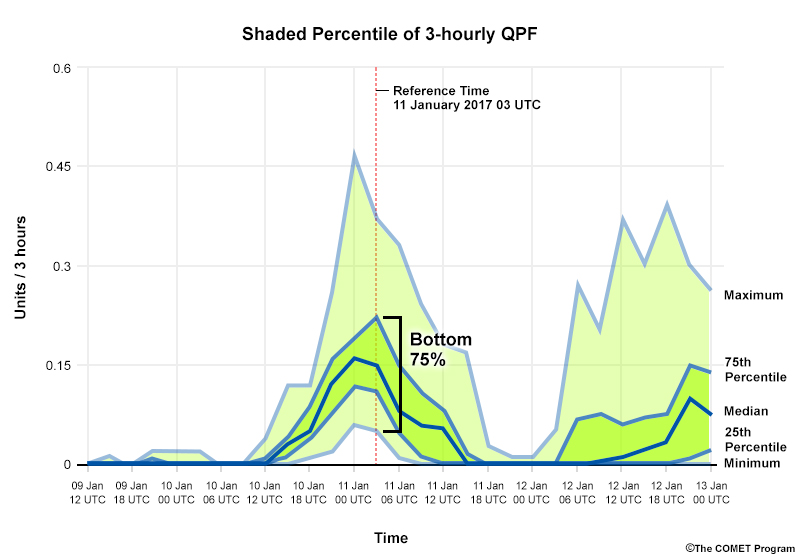
Shaded percentile plot with bottom 75% of the distribution highlighted at 11 January 2017 03 UTC.
File Name:
shaded_percentile_idealized_conceptual_box.jpg
Credits:
The COMET Program
Copyright Terms:
COMET Standard Terms of Use
Description:
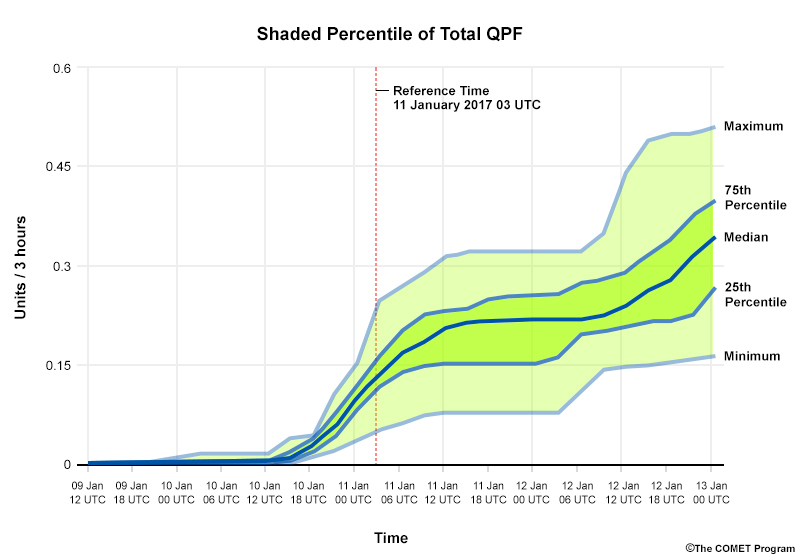
Typical EPS Shaded Percentile Diagram Output for a Single Weather Variable
File Name:
shaded_percentile_idealized_conceptual_cumulative.jpg
Credits:
©The COMET Program
Copyright Terms:
COMET Standard Terms of Use
Description:
Shaded Quantile/Percentiles thumbnail
File Name:
shaded_percentiles_thumb.jpg
Credits:
The COMET Program
Copyright Terms:
COMET Standard Terms of Use
Description:
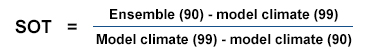
Equation for Shift of Tails
File Name:
sot_equation.jpg
Credits:
The COMET Program
Copyright Terms:
COMET Standard Terms of Use
Description:
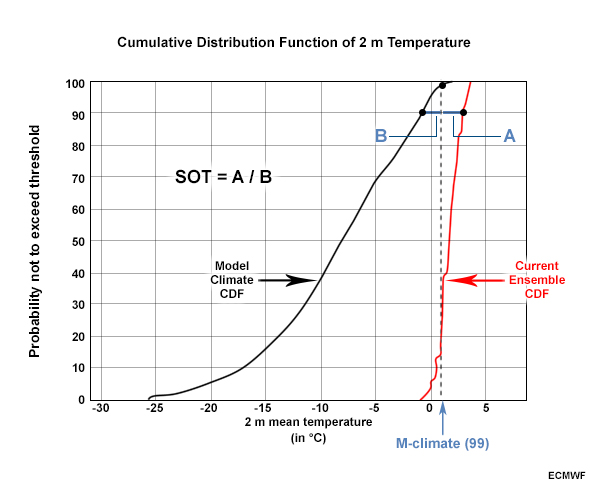
Cumulative Distribution Function of 2m temperature
File Name:
sot_equation_graphical.jpg
Credits:
ECMWF
Copyright Terms:
COMET Standard Terms of Use
Description:
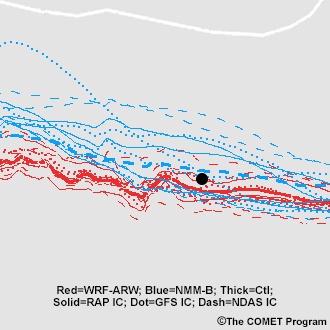
Typical EPS Spaghetti Diagram Output for a Single Weather Variable
File Name:
spaghetti_idealized_conceptual.jpg
Credits:
©The COMET Program
Copyright Terms:
COMET Standard Terms of Use
Description:
Spaghetti plot with 8 members to the north of the location and 16 members to the south.
File Name:
spaghetti_idealized_conceptual_dot.jpg
Credits:
©The COMET Program
Copyright Terms:
COMET Standard Terms of Use
Description:
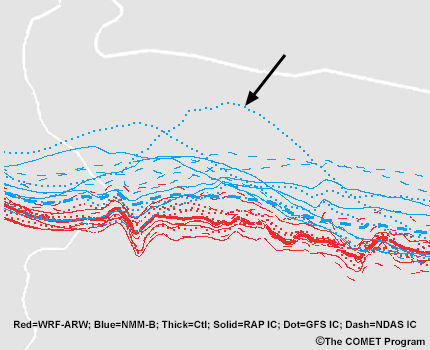
Spaghetti plot with an obvious outlier.
File Name:
spaghetti_idealized_conceptual_outlier.jpg
Credits:
©The COMET Program
Copyright Terms:
COMET Standard Terms of Use
Description:
Spaghetti heights or variables thumbnail
File Name:
spaghetti_thumb.jpg
Credits:
The COMET Program
Copyright Terms:
COMET Standard Terms of Use
Description:
SREF Spaghetti Plot for 5460dm at forecast hour 84 with an amplitude difference highlighted
File Name:
SREF_Spaghetti_H5_5460_f084_amplitude_differences.jpg
Credits:
©The COMET Program
Copyright Terms:
COMET Standard Terms of Use
Description:
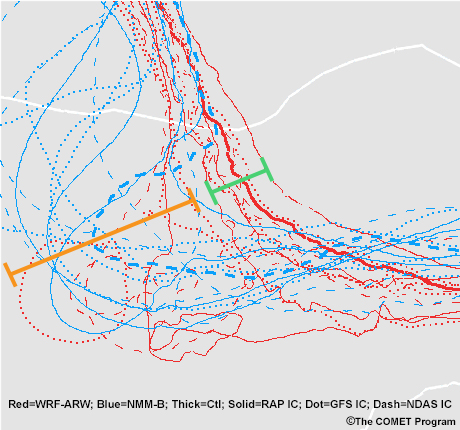
SREF Spaghetti Plot for 5460dm at forecast hour 84 with a spatial and temporal displacement highlighted
File Name:
SREF_Spaghetti_H5_5460_f084_spatial_temporal_displacement.jpg
Credits:
©The COMET Program
Copyright Terms:
COMET Standard Terms of Use
Description:
SREF Temperature plume for Vancouver, BC, Canada
File Name:
Temp_SREF_Vancouver.jpg
Credits:
NOAA
Copyright Terms:
COMET Standard Terms of Use
Description:
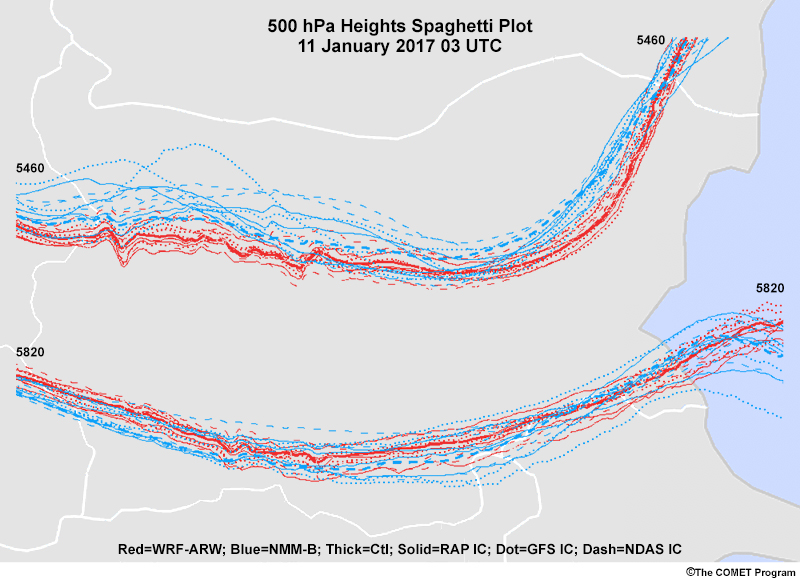
This is the corresponding 500-hPa ensemble spaghetti diagram for three height contours that matches with trough_cluster.gif.
File Name:
trough_cluster.jpg
Credits:
The COMET Program
Copyright Terms:
COMET Standard Terms of Use
Description:
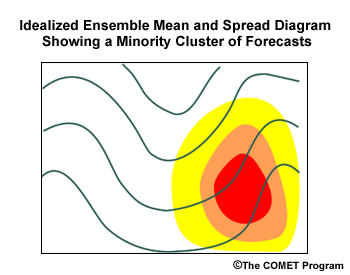
from Ensemble Module page 4_2_1.htm
File Name:
trough_intensity.jpg
Credits:
The COMET Program
Copyright Terms:
COMET Standard Terms of Use
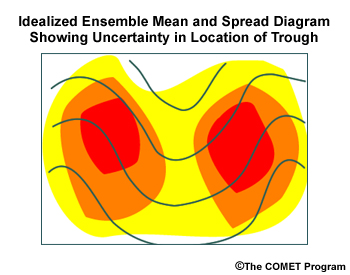
Description:
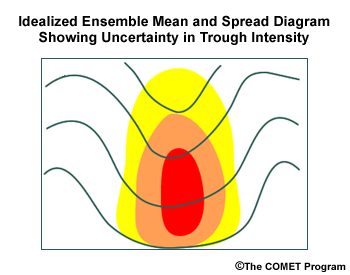
from Ensemble Module page 4_2_1.htm
File Name:
trough_location.jpg
Credits:
The COMET Program
Copyright Terms:
COMET Standard Terms of Use
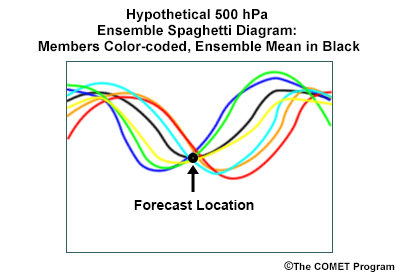
Description:
Hypothetical spaghetti diagram to go with trough_location.gif. These two graphics together illustrate how to use mean/spread to determine what contours to use for spaghetti diagram.
File Name:
troughsp_location.jpg
Credits:
(c)The COMET Program
Copyright Terms:
COMET Standard Terms of Use