EPS Products Reference Guide »
Shaded Percentile EPSgrams
Description
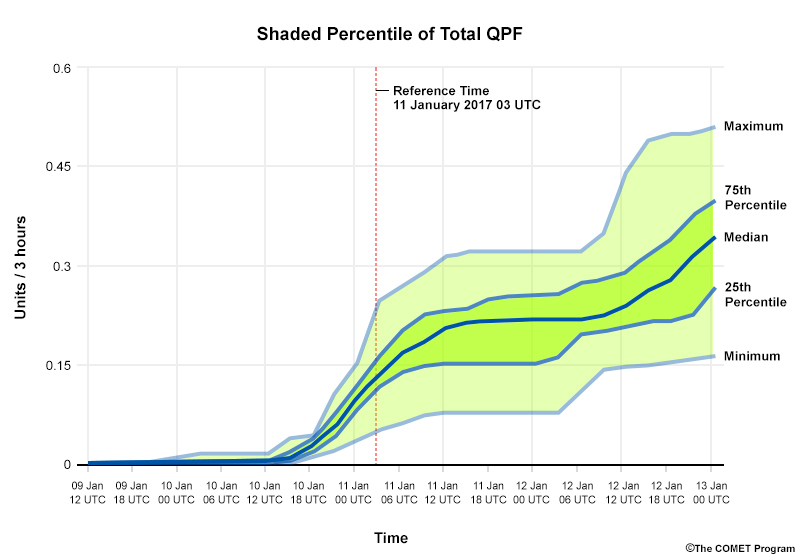
Shaded percentile meteograms, or EPSgrams, display probabilistic information about how specific weather variables change over time at a particular location. They can either represent Probability Distribution Functions (PDFs) or Cumulative Distribution Functions (CDFs, shown above). The values at each time step represent the full range of the PDF and distinguish important probabilistic quantities, such as nth percentile levels and the median.