EPS Products Reference Guide »
Mean and Spread
Description
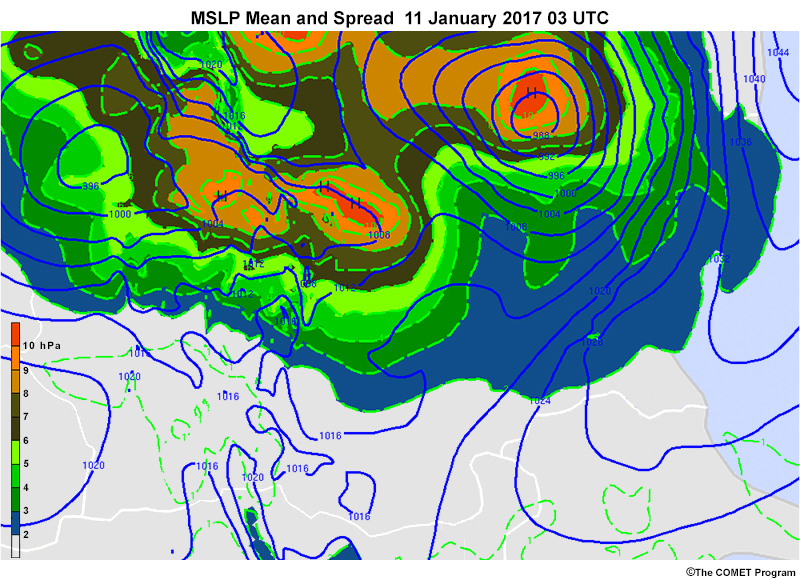
Mean and spread diagrams are plan-view products that display the average (mean) value of a variable as well as a representation of uncertainty (spread). The spread is often represented as the value of one standard deviation of the distribution at each grid box on the graphic. The mean and spread together give an indication of the overall shape of the distribution.