Media elements used in this module are protected by a variety of copyright licenses. Please use the "copyright terms" link associated with each item below for more information.
Description:
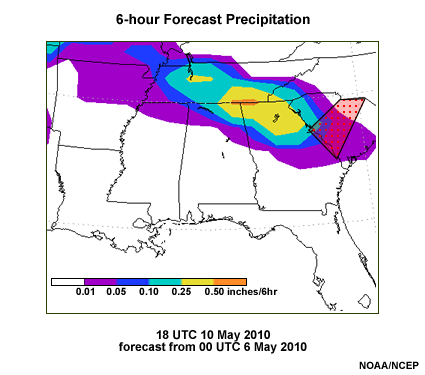
A plan view map of 114-hour, 6-hourly accumulated precipitation forecast from the Global Forecast System over the Southeast U.S. Precipitation amounts are shaded in inches at 0.01", 0.05", 0.10", 0.25" and 0.50" levels. The precipitation is forecast to occur in an overrunning band from northwest Tennessee east-southeastward into the Carolinas and Georgia. The Columbia SC National Weather Service Forecast Office is highlighted with a red dotted polygon.
File Name:
6hprcp_2010050600f114.png
Credits:
NOAA/NCEP/NWS
Copyright Terms:
COMET Standard Terms
of Use
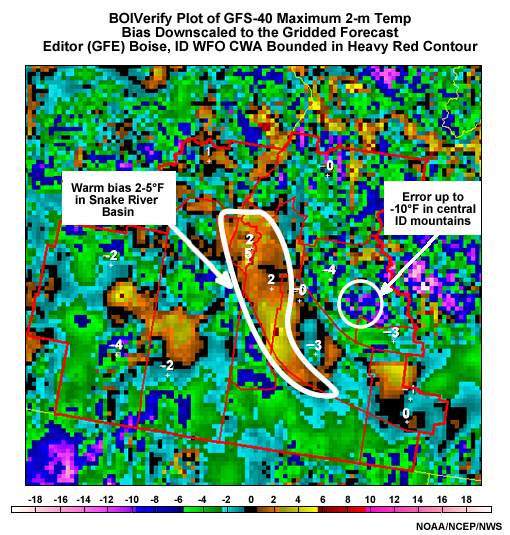
Description:
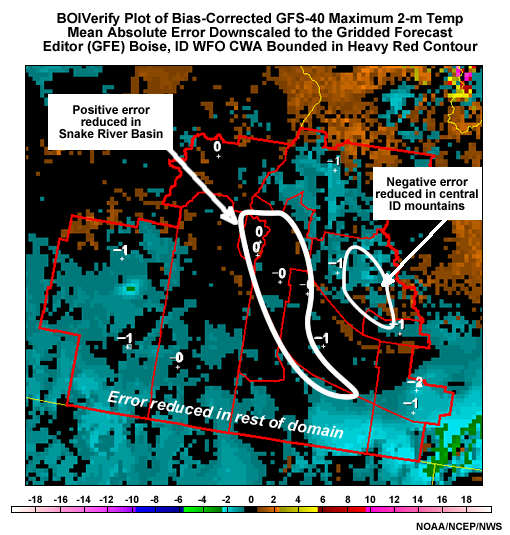
Screen capture of National Weather Service Graphical Forecast Editor using BOIVerify to downscale maximum 2-meter temperature bias errors for the bias-corrected GFS at 40-km resolution to the National Forecast Guidance Database Grid. Data is for September 2006.
File Name:
adjGFS40_BOIVerify_BOI.png
Credits:
NOAA/NCEP/NWS
Copyright Terms:
COMET Standard Terms
of Use
Description:
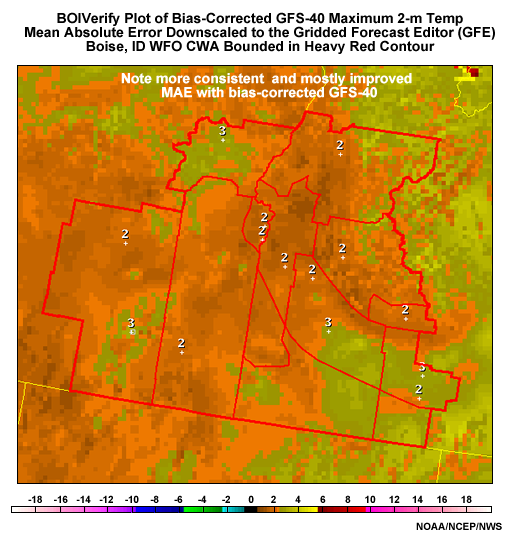
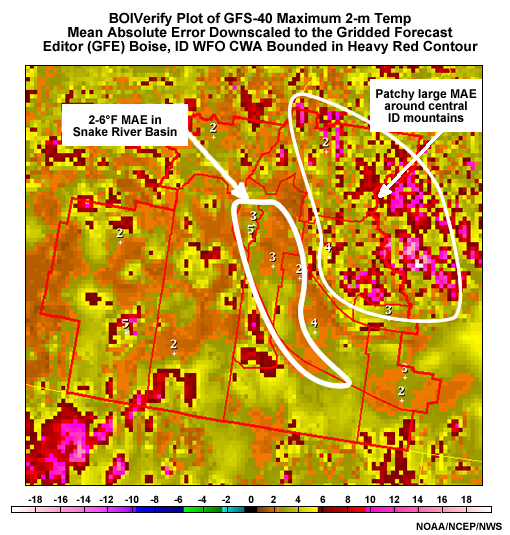
Screen capture of National Weather Service Graphical Forecast Editor using BOIVerify to downscale maximum 2-meter temperature mean absolute error for the bias-corrected GFS at 40-km resolution to the National Forecast Guidance Database Grid. Data is for September 2006.
File Name:
adjGFS40MAE_BOIVerify_BOI.png
Credits:
NOAA/NCEP/NWS
Copyright Terms:
COMET Standard Terms
of Use
Description:
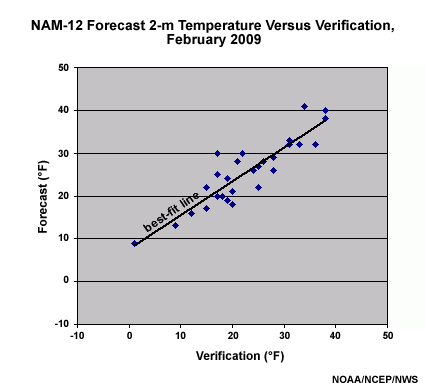
A scatterplot of 12-km resolution NAM WRF-NMM 24-hour forecast 2-m temperature data for all 00 UTC February 2009 cycles versus verification, interpolated to the 5-km National Digital Guidance Database (NDGD) Grid. A best fit line has been drawn through the data in bold black. Units for forecast and verification temperatures is degrees Fahrenheit.
File Name:
BOIVerifyBCexample.png
Credits:
NOAA/NCEP/NWS
Copyright Terms:
COMET Standard Terms
of Use
Description:
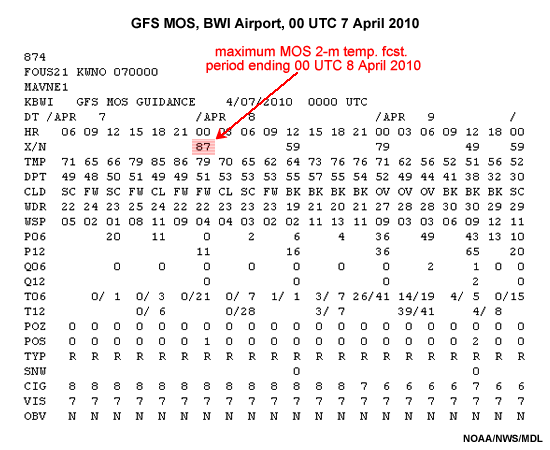
Table of Global Forecast System (GFS) based Model Output Statistics (MOS) forecasts, based on 00 UTC 7 April 2010 GFS model forecast data. Indicated are 24-hour maximum, 24-hour minimum, and 3-hourly instantaneous 2-m temperatures and dewpoints, cloud cover, wind direction and speed, probability of precipitation at 6 and 12 hour intervals, categorical quantitative precipitation forecast, 6-hour and 12-hour probability of thunder, probability of freezing rain and snow, most likely precipitation type, snow amount at 24 hour intervals, categorical ceiling and visibility, and what obstruction to visibility is forecast to exist, if any.
File Name:
BWIMOStable_2010040700.png
Credits:
NOAA/NWS/MDL
Copyright Terms:
COMET Standard Terms
of Use
Description:
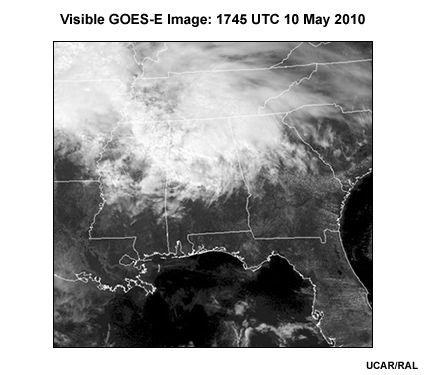
A plan view visible satellite map centered on Montgomery, AL for valid time 1745 UTC 10 May 2010. Image comes from UCAR's RAL lab.
File Name:
g13.2010130.1745_smMGM_vis.png
Credits:
UCAR/RAL
Copyright Terms:
COMET Standard Terms
of Use
Description:
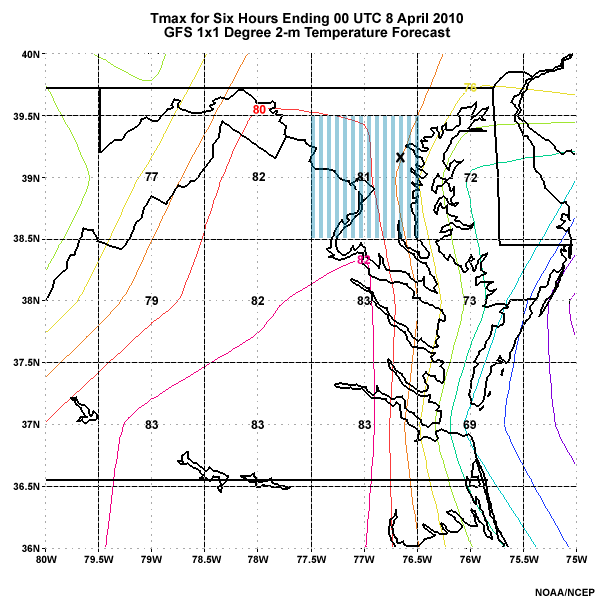
Forecast Maximum 2-m temperature for 6 hours ending 00 UTC 8 April 2010 from GFS 1ºx1º resolution forecast. Temperatures for each grid box are printed in their centers in ºFahrenheit. Grid box including Baltimore-Washington International Airport is highlighted with vertical blue stripes. Temperatures are also contoured at 2ºF intervals.
File Name:
gfstmax2m_2010040800.png
Credits:
NOAA/NCEP
Copyright Terms:
COMET Standard Terms
of Use
Description:
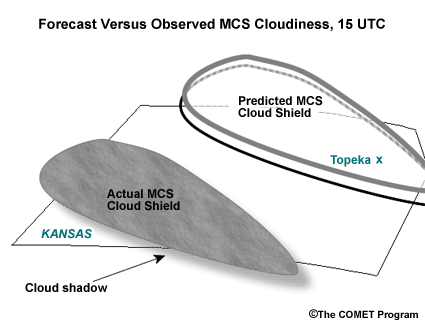
Idealized graphic depicting a forecast MCS cloud shield at 15 UTC on a summer day, contoured in gray and black (shadow) in a forecast model that results from a convective "bulls-eye" upstream of Topeka, Kansas. While an MCS actually took place, it took place farther south and west (shaded in gray and black), and the resulting cloud shield is not expected to affect Topeka.
File Name:
MCS_shieldTopeka.png
Credits:
©The COMET Program
Copyright Terms:
COMET Standard Terms
of Use
Description:
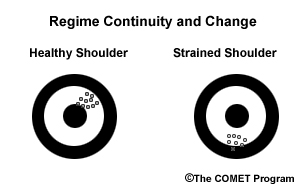
This image has two panels. The left panel shows a target and the locations balls will hit if a pitcher throws high and to the right. The right panel shows the same target and the location that the same pitcher will throw the ball after straining his elbow - low and to the right.
File Name:
regime_baseball.jpg
Credits:
©The COMET Program
Copyright Terms:
COMET Standard Terms
of Use
Description:
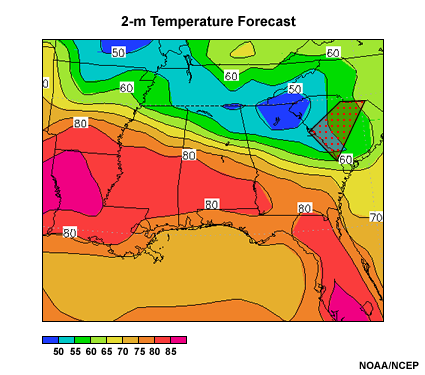
A plan view of a 114-hour 2-m temperature forecast in degrees Fahrenheit for the Southeast U.S. from the GFS valid 18 UTC 10 May 2010. The Columbia SC National Weather Service Forecast Office is highlighted with a red dotted polygon.
File Name:
t2m_2010050600f114.png
Credits:
NOAA/NCEP
Copyright Terms:
COMET Standard Terms
of Use
Description:
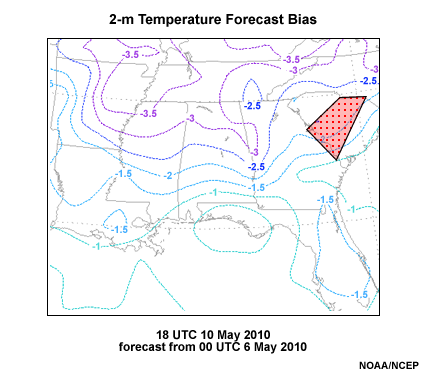
A plan view of a 114-hour 2-m temperature forecast bias in degrees Fahrenheit for the Southeast U.S. from the GFS valid 18 UTC 10 May 2010. The Columbia SC National Weather Service Forecast Office is highlighted with a red dotted polygon.
File Name:
t2mbias_2010050600f114.png
Credits:
NOAA/NCEP
Copyright Terms:
COMET Standard Terms
of Use
Description:
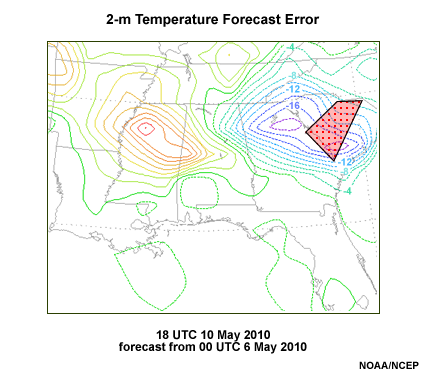
A plan view of the 114-hour 2-m temperature forecast error in degrees Fahrenheit for the Southeast U.S. from the GFS valid 18 UTC 10 May 2010. The Columbia SC National Weather Service Forecast Office is highlighted with a red dotted polygon.
File Name:
t2merror_2010050600f114.png
Credits:
NOAA/NCEP
Copyright Terms:
COMET Standard Terms
of Use
Description:
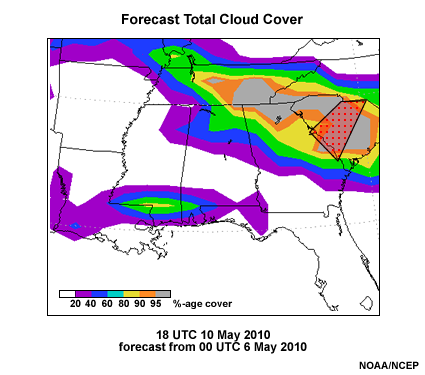
A plan view of the 114-hour total cloud cover forecast in percent coverage for the Southeast U.S. from the GFS valid 18 UTC 10 May 2010. The Columbia SC National Weather Service Forecast Office is highlighted with a red dotted polygon.
File Name:
tcld_2010050600f114.png
Credits:
NOAA/NCEP
Copyright Terms:
COMET Standard Terms
of Use
Description:
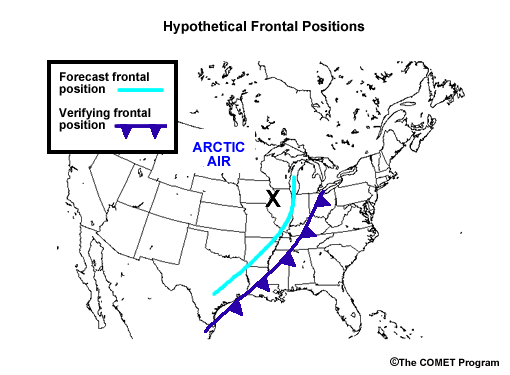
Forecast versus verification of frontal position for a hypothetical example of an arctic front advancing eastward across the Midwest. Forecast cold front is in light blue. Verification cold front in dark blue with cold front barbs pointing in direction of frontal movement. Forecast area of interest, Davenport IA area, is marked with a bold, black "X". Note label for Arctic air mass over the northern High Plains.
File Name:
timing.png
Credits:
©The COMET Program
Copyright Terms:
COMET Standard Terms
of Use
Description:
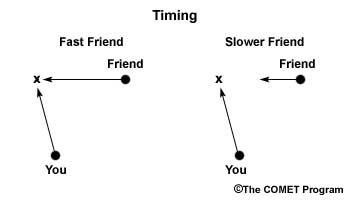
This image has two panels. The left panel shows the locations a pitcher needs to throw a ball in order for his running friend to catch it. The friend runs from right to left. The right panel shows the same situation but this time the friend is tired and runs slower. The pitcher will throw ahead of the friend and miss her.
File Name:
timing_baseball.jpg
Credits:
©The COMET Program
Copyright Terms:
COMET Standard Terms
of Use
Description:
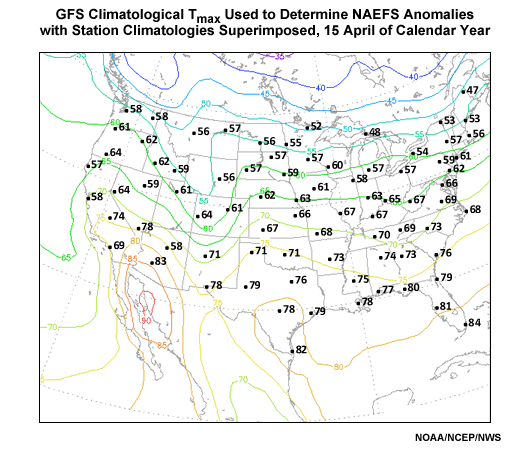
Long term contoured National Centers for Environmental Prediction model analysis climatology versus plotted NWS 1971-2000 30-year station climatologies for 15 April maximum 2-m temperature.
File Name:
tmax2m_15apr.png
Credits:
NOAA/NCEP/NWS
Copyright Terms:
COMET Standard Terms
of Use
Description:
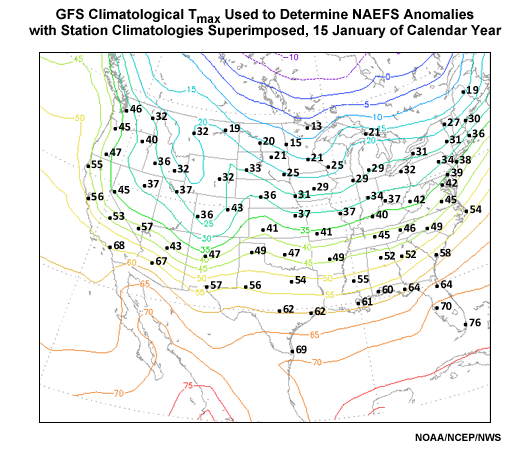
Long term contoured National Centers for Environmental Prediction model analysis climatology versus plotted NWS 1971-2000 30-year station climatologies for 15 January maximum 2-m temperature.
File Name:
tmax2m_15jan.png
Credits:
NOAA/NCEP/NWS
Copyright Terms:
COMET Standard Terms
of Use
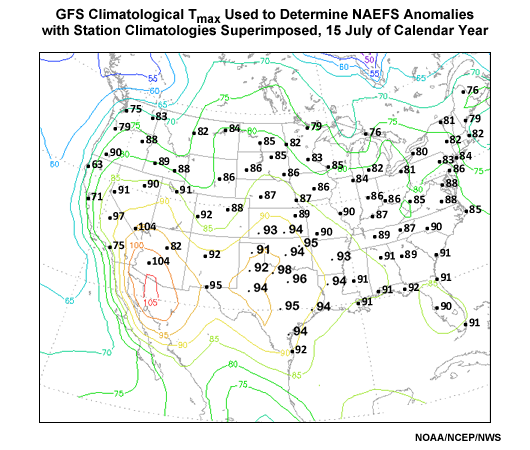
Description:
Long term contoured National Centers for Environmental Prediction model analysis climatology versus plotted NWS 1971-2000 30-year station climatologies for 15 July maximum 2-m temperature.
File Name:
tmax2m_15jul.png
Credits:
NOAA/NCEP/NWS
Copyright Terms:
COMET Standard Terms
of Use
Description:
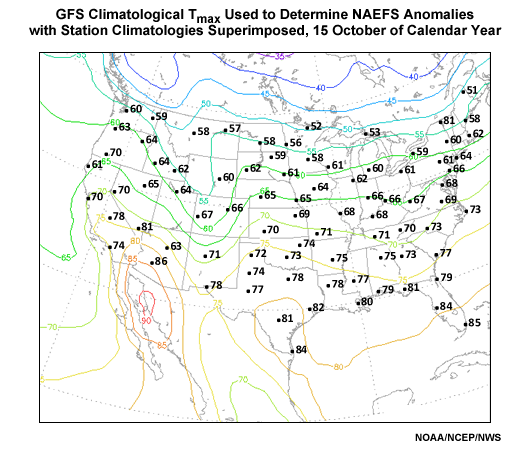
Long term contoured National Centers for Environmental Prediction model analysis climatology versus plotted NWS 1971-2000 30-year station climatologies for 15 October maximum 2-m temperature.
File Name:
tmax2m_15oct.png
Credits:
NOAA/NCEP/NWS
Copyright Terms:
COMET Standard Terms
of Use
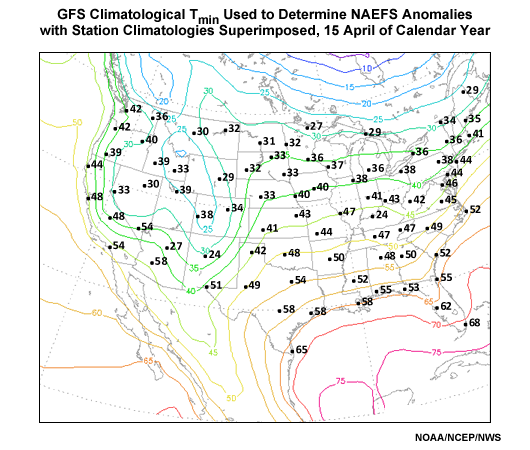
Description:
Long term contoured National Centers for Environmental Prediction model analysis climatology versus plotted NWS 1971-2000 30-year station climatologies for 15 April minimum 2-m temperature.
File Name:
tmin2m_15apr.png
Credits:
NOAA/NCEP/NWS
Copyright Terms:
COMET Standard Terms
of Use
Description:
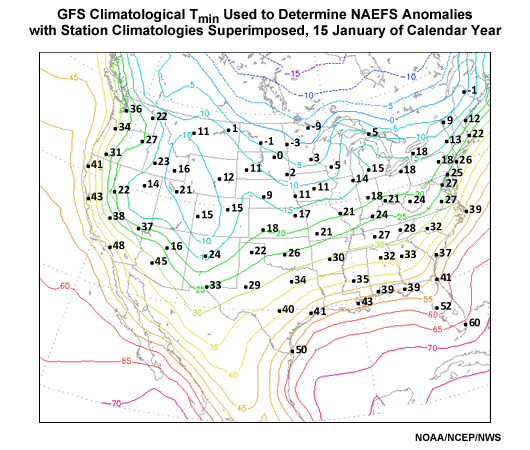
Long term contoured National Centers for Environmental Prediction model analysis climatology versus plotted NWS 1971-2000 30-year station climatologies for 15 January minimum 2-m temperature.
File Name:
tmin2m_15jan.png
Credits:
NOAA/NCEP/NWS
Copyright Terms:
COMET Standard Terms
of Use
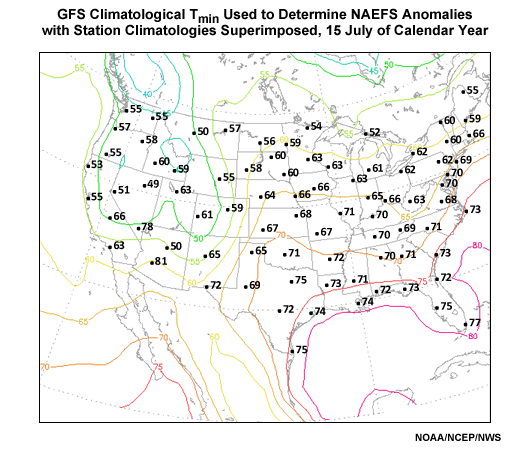
Description:
Long term contoured National Centers for Environmental Prediction model analysis climatology versus plotted NWS 1971-2000 30-year station climatologies for 15 July minimum 2-m temperature.
File Name:
tmin2m_15jul.png
Credits:
NOAA/NCEP/NWS
Copyright Terms:
COMET Standard Terms
of Use
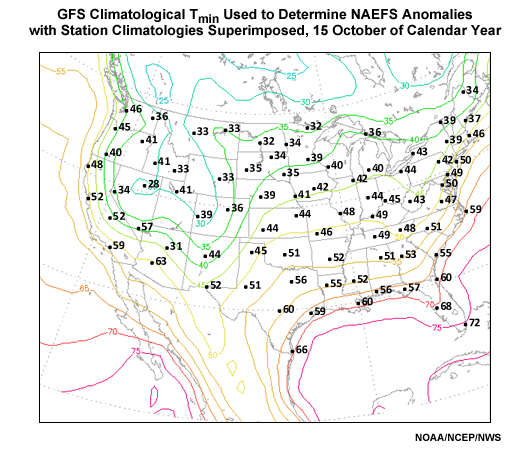
Description:
Long term contoured National Centers for Environmental Prediction model analysis climatology versus plotted NWS 1971-2000 30-year station climatologies for 15 October minimum 2-m temperature.
File Name:
tmin2m_15oct.png
Credits:
NOAA/NCEP/NWS
Copyright Terms:
COMET Standard Terms
of Use
Description:
Screen capture of National Weather Service Graphical Forecast Editor using BOIVerify to downscale maximum 2-meter temperature bias errors for the uncorrected GFS at 40-km resolution to the National Forecast Guidance Database Grid. Data is for September 2006.
File Name:
unadjGFS40_BOIVerify_BOI.png
Credits:
NOAA/NCEP/NWS
Copyright Terms:
COMET Standard Terms
of Use
Description:
Screen capture of National Weather Service Graphical Forecast Editor using BOIVerify to downscale maximum 2-meter temperature mean absolute error for the uncorrected GFS at 40-km resolution to the National Forecast Guidance Database Grid. Data is for September 2006.
File Name:
unadjGFS40MAE_BOIVerify_BOI.png
Credits:
NOAA/NCEP/NWS
Copyright Terms:
COMET Standard Terms
of Use
Description:
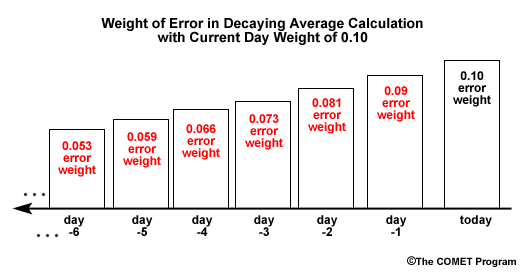
Histogram of the decreasing weights assigned to total error in the calculation of decaying average as one goes back in time from the present day. The red numbers within the boxes in the histogram indicate the weight given to that day's error in percent. The boxes are scaled in size relative to the present day weighting.
File Name:
wgtg_graphical.png
Credits:
©The COMET Program
Copyright Terms:
COMET Standard Terms
of Use