Media elements used in this module are protected by a variety of copyright licenses. Please use the "copyright terms" link associated with each item below for more information.
Description:
NOAA AMSU-A 50.3 GHz limb adjusted brightness temperature (K) 2218 UTC 17 Mar 2000: Showing storm center in the Davis Strait
File Name:
amsu53_18mar2000.gif
Credits:
Moore 2003
Copyright Terms:
COMET Standard Terms
of Use
Description:
NOAA AMSU-B 89.0 GHz brightness temperature (K) 2218 UTC 17 Mar 2000: Showing storm center in the Davis Strait
File Name:
amsu89_18mar2000.gif
Credits:
Moore 2003
Copyright Terms:
COMET Standard Terms
of Use
Description:
Potential Temperature Analysis of an Arctic Front
File Name:
analysis_arcticfront.gif
Credits:
Shapiro et al. 1989
Copyright Terms:
COMET Standard Terms
of Use
Description:
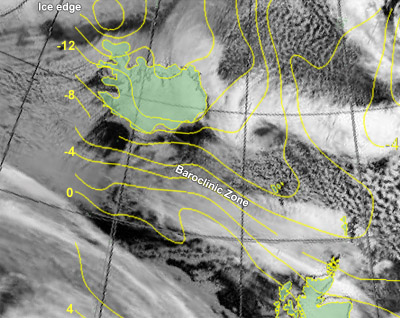
IR image showing the development of a polar low in the location of a strong baroclinic zone well away from the ice edge. Yellow lines show 850 hPa potential wetbulb temperature (C) .
File Name:
baroclinic_instability.jpg
Credits:
NOAA
Copyright Terms:
COMET Standard Terms
of Use
Description:
EOS-Terra MODIS 11 µm 0210 UTC 01 Dec 2000: Polar low development over Ungava Bay, Canada
File Name:
ch31_02dec2000.gif
Credits:
NASA-Goddard Space Flight Center
Copyright Terms:
COMET Standard Terms
of Use
Description:
EOS-Terra MODIS 11 minus 3.8 µm Difference 0210 UTC 01 Dec 2000: Polar low development over Ungava Bay, Canada
File Name:
ch31_20diff_02dec2000.gif
Credits:
NASA-Goddard Space Flight Center
Copyright Terms:
COMET Standard Terms
of Use

Description:
NOAA AVHRR 11 µm IR 0853 UTC 18 Dec 1994: Example of a merry-go-round signature with multiple polar lows or mesoscale cyclones
File Name:
ch4_18dec1994.gif
Credits:
Image courtesy of the University of Dundee
Copyright Terms:
COMET Standard Terms
of Use

Description:
NOAA-9 AVHRR 11µm IR 0854 UTC 28 Mar 1985: This image illustrates both stable and relatively unstable air masses separated by a secondary low-level baroclinic zone. The cloud band marks the baroclinic zone where polar low formation would be favored.
File Name:
ch4_28mar1985_0853utc.gif
Credits:
Image courtesy of the University of Dundee
Copyright Terms:
COMET Standard Terms
of Use
Description:
Relationship of comma cloud to major frontal cyclone
File Name:
comma_cloud.gif
Credits:
Businger and Reed 1989
Copyright Terms:
COMET Standard Terms
of Use
Description:
NOAA-AVHRR IR (11µm) 29 Nov 1992 showing comma cloud over the Gulf of Alaska
File Name:
comma_cloud_sat.gif
Credits:
NOAA
Copyright Terms:
COMET Standard Terms
of Use

Description:
Pre-development Synoptics for Polar Lows: Hudson Bay and Eastern Canada; map showing common winter synoptics with paths of winter cyclones and the location of the winter polar vortex
File Name:
east_canada_synoptics.gif
Credits:
COMET
Copyright Terms:
COMET Standard Terms
of Use
Description:
Sample NCEP Ensemble: Mean MSLP (hPa), 1000-500 hPa Thickness sing 12 MRF and 11 AVN runs
File Name:
ensemble_example.gif
Credits:
Environment Canada
Copyright Terms:
COMET Standard Terms
of Use
Description:
Cross section of GEM Regional potental vorticity 06 hr fcst valid 06 UTC 02 December 2000 during the initial phases of polar low development over Ungava Bay. The low-level area of 1.2 pv is in close veritcal aligment with the 1.2 pv associated with the upper-level trough.
File Name:
gem_pv_xsec_20001202.gif
Credits:
COMET
Copyright Terms:
COMET Standard Terms
of Use
Description:
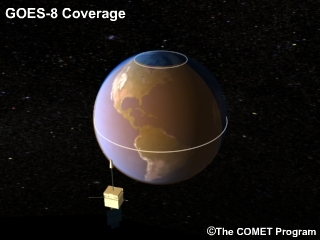
Conceptual image showing coverage of the GOES-8 geostationary satellite. Coverage is limited to 70ºN and 70ºS.
File Name:
goes_coverage.jpg
Credits:
COMET
Copyright Terms:
COMET Standard Terms
of Use
Description:
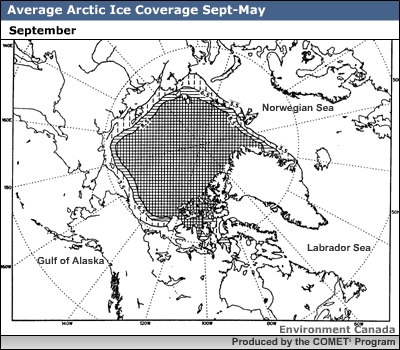
Animation showing average Arctic ice coverage from September through May
File Name:
ice_arctic_0001.htm
Credits:
Environment Canada
Copyright Terms:
COMET Standard Terms
of Use
Description:
Ice and sea surface temperature analysis over NE Atlantic and European waters from 5 February 2001. Norwegian Meteorological Institute
File Name:
icemap_norway.gif
Credits:
Norwegian Meteorological Institute
Copyright Terms:
COMET Standard Terms
of Use
Description:
NOAA-AVHRR IR (11µm) 29 Nov 1992 showing comma cloud over the Gulf of Alaska
File Name:
instant_occlusion.jpg
Credits:
NOAA
Copyright Terms:
COMET Standard Terms
of Use
Description:
Cold Air Vortices/Polar Low Days in Gulf of Alaska and Bering Sea 1975-1983: Based on the number of days per month when polar lows were observed on satellite imagery as recorded by Businger (1987)
File Name:
instant_occlusion_stats.gif
Credits:
Yarnal and Henderson 1989
Copyright Terms:
COMET Standard Terms
of Use
Description:
NOAA-15 AVHRR 11µm IR 2218 UTC 17 Mar 2000: Example of a polar low with a cloud-free eye
File Name:
ir_17mar2000_2218utc.gif
Credits:
Moore 2003
Copyright Terms:
COMET Standard Terms
of Use
Description:
Satellite IR imagery showing streamers of cumulus clouds as a result of cold air flowing over the Labrador Sea
File Name:
ir_1990feb26_labrador.gif
Credits:
NOAA
Copyright Terms:
COMET Standard Terms
of Use
Description:
NOAA-9 IR Ch4 27 Feb 1987: Polar Low over the Barents Sea
File Name:
plow_1987feb27.gif
Credits:
NOAA
Copyright Terms:
COMET Standard Terms
of Use
Description:
Examples of Polar Lows using NOAA-AVHRR IR (11µm)
File Name:
plow_examples.gif
Credits:
NOAA
Copyright Terms:
COMET Standard Terms
of Use
Description:
Steps outlining the formation of a polar low
File Name:
plow_formation.gif
Credits:
COMET
Copyright Terms:
COMET Standard Terms
of Use
Description:
Cold Air Vortices/Polar Low Days in Gulf of Alaska and Bering Sea 1975-1983: Based on the number of days per month when polar lows were observed on satellite imagery as recorded by Businger (1987)
File Name:
plow_freq_alaska.gif
Credits:
Environment Canada
Copyright Terms:
COMET Standard Terms
of Use
Description:
NOAA-AVHRR IR 11µm 20 Mar 1989: Polar low over the Labrador Sea along a fronatl zone of converging arctic air masses
File Name:
plow_labsea_19890320.gif
Credits:
NOAA
Copyright Terms:
COMET Standard Terms
of Use
Description:
Monthly frequency distribution for observed polar lows near Norway, based on combined results from two studies: 1971-1982 (Lystad, 1986) and 1999-2003 (Noer et al, 2003)
File Name:
plow_norway_frequency.gif
Credits:
Lystad 1986 and Noer et al. 2003
Copyright Terms:
COMET Standard Terms
of Use
Description:
Observed Polar Lows, North Atlantic 1999-2003: Positions of fully developed polar lows in the seasons 1999-2003.
File Name:
plow_obs_europe.gif
Credits:
Norwegian Meteorological Institute
Copyright Terms:
COMET Standard Terms
of Use
Description:
Frequency of Polar Lows over Eastern Canadian Waters by Month 1977-1994: Excludes events in Hudson Bay and Baffin Bay. Based on satellite observations collected by Hanley and Richards (1991) and Atmospheric Environment Service, Prairie and Northern RegionEnvironment Service, Prairie and Northern Region
File Name:
plows_easternstudy.gif
Credits:
Environment Canada
Copyright Terms:
COMET Standard Terms
of Use

Description:
500-hPa Temperature Accompanying Cold Air Vortices and Polar Lows in Northern and Eastern Canadian Waters: Excludes events in Hudson Bay and Baffin Bay. Based on observations collected by Hanley and Richards (1991) and Atmospheric Environment Service, Prairie and Northern Region
File Name:
plows_easternstudy500temps.gif
Credits:
Environment Canada
Copyright Terms:
COMET Standard Terms
of Use
Description:
Features on a 50 km grid: features smaller than 3 grid point will most likely not show up in the model.
File Name:
plows_grid.gif
Credits:
COMET
Copyright Terms:
COMET Standard Terms
of Use

Description:
Observed Polar Lows and Cold Air Vortices, Gulf of Alaska 1975-1983: The asterisks indicate the location of polar lows and cold air vortices observed during the period 1975-1983. The solid lines are 20-year mean January sea surface temperatures (ºC).
File Name:
plows_gulfalaskastudy.gif
Credits:
Businger 1987
Copyright Terms:
COMET Standard Terms
of Use
Description:
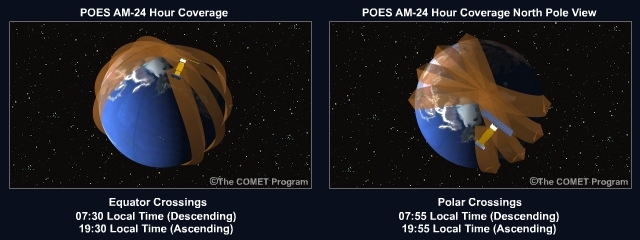
Conceptual image showing coverage of POES 24-hour coverage
File Name:
poes_coverage.jpg
Credits:
COMET
Copyright Terms:
COMET Standard Terms
of Use

Description:
QuikSCAT Wind Vectors Evening Passes 17 Mar 2000
File Name:
qscat_17mar2000.gif
Credits:
Remote Sensing Systems/NASA
Copyright Terms:
COMET Standard Terms
of Use
Description:
Reference Map for Polar Lows Climatology
File Name:
ref_map.gif
Credits:
Environment Canada
Copyright Terms:
COMET Standard Terms
of Use
Description:
Comparison of reverse and forward shear flow in the development of polar lows
File Name:
reverse_shear.gif
Credits:
Businger and Reed 1989
Copyright Terms:
COMET Standard Terms
of Use
Description:
Example of Reverse Shear Flow in the Davis Strait
File Name:
revshear_davisstrait.gif
Credits:
Environment Canada
Copyright Terms:
COMET Standard Terms
of Use
Description:
Charts showing reverse shear flow over the Norwegian Sea on January 30, 1983
File Name:
revshear_plows01.gif
Credits:
Businger and Duncan 1987
Copyright Terms:
COMET Standard Terms
of Use
Description:
NOAA-16 12UTC on 20 December 2002 with 700hPa wind data superimposed. The polar low off the Norwegian coast is expected to move towards the SE with a speed of 15-20 kt.
File Name:
sat_with_700_winds.gif
Credits:
Norwegian Meteorological Institute
Copyright Terms:
COMET Standard Terms
of Use
Description:
NOAA-15 IR (Ch4) 0554 UTC 23 Feb 2001 with 700 hPA Winds: The polar low to the north of Scotland is moving towards the soputh. The contours show the areas of strongest wind in knots. Strongest winds are right of the system relative to its movement.
File Name:
sat_with_700_winds.gif
Credits:
EUMETSAT
Copyright Terms:
COMET Standard Terms
of Use

Description:
DMSP SSM/I Wind Speed 0724 UTC 15 Oct 1993: SSM/I derived surface wind speeds over open sea for a polar low near 65 deg N, 2 deg E. The black arrow indicates storm center as estimated from IR imagery.
File Name:
ssmi_15oct1993.gif
Credits:
Remote Sensing Systems/NASA
Copyright Terms:
COMET Standard Terms
of Use

Description:
Vertical profile of potential temperature through a convective boundary layer produced by arctic air moving over a warmer sea
File Name:
vert_profile_arcticair.gif
Credits:
Agee 1989
Copyright Terms:
COMET Standard Terms
of Use
Description:
Estimated duration of cold airvortices based on 61 cases of cold air vortices observed with satellite imagery
File Name:
vort_duration.gif
Credits:
Environment Canada
Copyright Terms:
COMET Standard Terms
of Use

Description:
NOAA-9 VIS 07 Feb 1991: This series of vortices over the Labrador Sea formed along a frontal zone. This frontal zone separates cold arctic air streaming southward behind a synoptic system southeast of Greenland and a warmer air mass which has moved around this low and lies in a surface trough extending from the low up the west Greenland coast.
File Name:
vort_labsea_19910207.gif
Credits:
NOAA
Copyright Terms:
COMET Standard Terms
of Use
Description:
Time Span of Visibility of 61 Vortices in Satellite Imagery: Based on combined satellite observations of polar lows from Jan 1977 to Jan 1994 collected by Hanley and Richards (1991) and Atmospheric Environment Service, Prairie and Northern Region
File Name:
vort_visibility.gif
Credits:
Environment Canada
Copyright Terms:
COMET Standard Terms
of Use
Description:
NOAA-15 IR (channel 4) 1436 UTC, 20 May 2002 showing a polar low south of Svalbard in the Norwegian Sea. It shows wavelike patterns in the cirrus outflow to the north. The cloud tops are also higher in this area compared with those near the centre of circulation.
File Name:
wave_sat.gif
Credits:
NOAA
Copyright Terms:
COMET Standard Terms
of Use
Description:
Pre-development Synoptics for Polar Lows: Gulf of Alaska; map showing common winter synoptics with paths of cyclones and the general flow across the region
File Name:
west_canada_synoptics.gif
Credits:
COMET
Copyright Terms:
COMET Standard Terms
of Use