Produced by The COMET® Program
Case Profile
Case Overview
This case presents a winter storm forecasting challenge over the eastern foothills and high plains of northern Colorado from 17-20 March 2003. A key focus of this case is the challenge of forecasting the onset and dissipation of a barrier jet and its impact on precipitation types and distributions. You'll be asked to analyze observed and operational model data in order to forecast the impact of the barrier jet.
The case is presented in three parts:
Case Profile
An introduction to the case setting with a synoptic overview.
Case Challenge
A series of forecasting questions accompanied by a rich set
of data and background content.
Case Summary
A brief summary of the event as it unfolded.
Geographic Location: Eastern foothills and high plains of northern Colorado and southern Wyoming
Case Time Frame: 17-20 March 2003
Phenomenon of Interest: Barrier jet and its impact on precipitation type and snow totals
Forecasting Challenges:
- Investigate the mechanisms for extreme horizontal variation in snowfall
- Determine the key factors that led to the precipitation type distribution observed
- Learn how the synoptic and mesoscale processes must be considered when working a case like this
- Focus on small-scale terrain influences when making a forecast during a complex dynamical situation in this region
Geographic Setting
The setting for this case is the eastern foothills and western plains of northern Colorado. This area marks a geological transition from the western edge of the Great Plains to the eastern edge of the Rocky Mountains. The forecast area of interest stretches north from Denver approximately 50 miles (80 km) to Fort Collins and west to the Continental Divide. The area has a population of over 2 million, with many small towns, cities, and scattered developments in this former agricultural region. There are also a substantial number of people living at higher elevations in the foothills to the west.
The Rocky Mountains form an abrupt rise in elevation west of the plains. Some of the steepest and most abrupt terrain differences are in north-central Colorado, our area of interest.

Reference Map:

Local Terrain
Zooming in on our local forecast area, the dramatic change in elevation becomes more evident. Denver and areas to the north and just east of the foothills have an elevation of around 1615 meters (5300 ft). The elevated terrain rising out of the plains to the south of Denver is known as the Palmer Divide. To the north of the forecast area, along the Wyoming border, is another region of elevated terrain known as the Cheyenne Ridge. With elevations exceeding 3960 meters (13,000 ft), the Continental Divide looms to the west, in some places only 24 kilometers (15 mi) from the edge of the plains. This area is known locally the northern Front Range urban corridor.
A closer look at the topography in areas north of Boulder shows the complexity of the small-scale terrain features. As you can imagine, canyons, ridges, and other nonlinear characteristics play key roles in the development of precipitation-producing wintertime systems in this region.
Northeastern Colorado Content

Boulder/Longmont Area Content

Climatology
Here's Denver's climatology for monthly snowfall based on the last 35 years of data. Note that from a climatological standpoint, Denver experiences its snowiest month in March.
mm Content
 in Denver, CO")
inches Content
 in Denver, CO")
Regional Cool Season Rules of Thumb
Here's an objective list of simple forecaster aids, or rules of thumb, based on decades of snow forecasting in the region:
- Rain vs. snow: The threshold 1000-500 hPa thickness value is about 550 dam. During the spring and early fall this value is a bit lower.
- Northerly surges and cold fronts: Cold air tends to rush southward along the Front Range faster than the models predict. This has to do with smoothing of terrain within the models and inadequte low-level resolution.
- Upslope flow and heavy snow: Heavy snow events that are not primarily forced by convection require relatively deep, low-level easterly or upslope flow, i.e., depth extending upwards past 700 hPa.
- Northeasterly vs. southeasterly flow: Northeast surface winds tend to favor the north slope of the Palmer Divide in terms of snowfall, while southeasterly winds, though less frequent, favor the south slopes of the Cheyenne Ridge.
- Deep upslope flow: While 700-hPa flow is easterly during deep upslope events, below that level the winds typically are northerly and can be strong. This is a relatively favorable snowfall situation for the Front Range.
Reference Map:
Synoptic Setup: Developing Trough
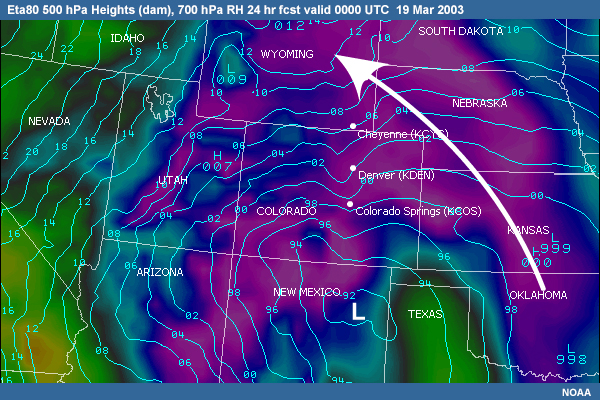
Let's take a look at the synoptic setting leading up to the case. During the period 15-18 March, strong, negatively-tilted troughing developed into the central and southern Rockies and the Great Basin. Intense mid- and upper-level jet energy originating from the central and northern Pacific Ocean impacted the California coast. The subsequent amplification of the long-wave pattern increased rapidly as downstream ridging built over the eastern U.S. The Eta80 analysis loop of the 300-hPa heights and winds as well as the water vapor imagery from the past 12 hours reveal this building pattern.
Eta80 00-hr Analyses Content
GOES Water Vapor Content
Synoptic Setup: Rapid Amplification
By 0000 UTC on 18 March, the large and deep trough has become well-organized over the southern Rockies as the amplification of the pattern increased rapidly. The main center of the cutoff low at 500 hPa has established itself over southern Utah. The associated strengthening circulation extends counterclockwise from northern Nevada to southern Arizona, western Kansas, and central Wyoming.
The water vapor imagery shows that a deep upslope flow has become established over the northern Front Range of Colorado and the adjoining high plains as low pressure at the surface developed over the southern Rockies and plains. Deep moisture has moved in over the central Rockies and wraps back around the low into the desert southwest. Significant, organized Gulf moisture transport has just begun to increase rapidly over the southern and central plains states in the low- and mid-levels. The signature of this transport has become well-established in the low-levels over the central and northern high plains (western South Dakota, Nebraska, Kansas, and eastern Wyoming and Colorado).
Eta80 00-hr Analyses Content
GOES Water Vapor Content
Case Challenge
Current Forecast Discussion
Current Time: 0300 UTC 18 March
The time is now 0300 UTC on 18 March. You're in the Boulder/Denver Forecast Office contemplating your next forecast update. The 0000 UTC model run has just become available. Let's get familiar with some of the details of the situation. Take a look at the latest forecast discussion, observations and current model data.
Denver NWS Forecast Discussion, 1520 MST (2220 UTC) 17 March 2003:
SHORT TERM DISCUSSION...INGREDIENTS ARE ALL COMING TOGETHER FOR SIGNIFICANT SNOW EVENT
WHICH WL CONT FOR THE NEXT COUPLE DAYS. MTN AREAS HAVE PICKED A FEW INCHES OF SNOW TDA FROM THE
SHOWER ACTIVITY IN THE UNSTABLE AMS TO THE N OF THE APPCHG UPR LVL LOW. SCT RAIN SHOWERS WITH A
FEW EMBEDDED T-STORMS HAVE ALSO BEEN MOVG WWD ACRS THE NE CO PLAINS...UNDERNEATH THE DEFORMATION
BAND THAT STRETCHES FM CENTRAL CO INTO WRN KS/SWRN NEBRASKA. A 987 MB SFC LOW IS NOW POSITIONED
OVR SERN CO WITH NLY WIND SPREADING SWRD ALG THE FRONT RANGE FTHLS. KCYS HAS BEEN ON THE VERGE
OF CHANGING OVR TO SNOW AND A SPOTTER NR FORT COLLINS REPORTS A LTL BIT OF MIXED RAIN AND SNOW.
THE MSTR AMNTS WITH THIS WX SYS ARE COPIOUS...TO SAY THE LEAST. MODELS CONT TO SHOW THE
VERTICALL STACKED UPR LOW WL MOVE VRY SLOWLY EWD THRU WED. DEEP ELY FLOW WL BE WELL ENTRENCHED
OVR THE FCST AREA THRU TONIGHT AND TUES. OROGRAPHIC SNOW MODEL SHOWS LIQUID WATER EQUIVALENTS OF
1.25-2.50 INCHES IN THE ZNS 35 AND 36 THRU TMRW AFTN. WITH SNOW RATIOS OF 12 TO 1...ONE TO TWO
FEET OF SNOW IS PSBL BY TMRW EVENING. ZNS 35 AND 36 WL BE HIT THE HARDEST TONIGHT BUT LOCATIONS
ON THE WRN SIDE OF ZNS 38 AND 39 COULD ALSO SEE HEAVY AMNTS. CURRNT WARNINGS AND WATCHES WL STAY
IN PLACE...BUT WL ADD PARK COUNTY...ZN 37...TO THE MTN WRNG.
ONE BIG QUESTION FOR THE PLAINS FCST IS WHETHER IT GETS COLD ENOUGH TO CHANGE TO SNOW OVR
LOCNS EAST OF THE METRO AREA. RIGHT NOW...LOW LVL TEMPS SHOW AFTN TEMPS ON THE PLAINS STILL IN
UPR 30S OR LOWER 40S. THIS AREA MAY SEE RAIN ALL NIGHT AND MUCH OF TMRW. WL STILL HOLD ON TO THE
WINTER STORM WATCH SINCE IF THE MODELS ARE TOO WARM THEN HVY SNOW AND GUSTY WINDS COULD STRETCH
TO THE ERN BRDR.
LONG TERM DISCUSSION...NOT MUCH CHANGE IN THE MODEL DEPICTION OF EVENTS FOR TUE NIGHT
THROUGH THU. WE STILL PREFER THE ETA DETAILS WHICH SHOW A GOOD SLUG OF ISENTROPIC
LIFT...INCREASING DEEP NE FLOW...AND CONTINUED INSTABILITY TUE NIGHT AND WED MAKING THIS THE
WORST PART OF THE STORM. WE STILL HAVE SOME QUESTION ABOUT THE MAGNITUDE OF THE EVENT...BUT THE
ETA HAS TYPICALLY DONE FORECAST STORM TOTAL SNOW ACCUMULATIONS FROM THE MODELS ARE HOLDING
STEADY...ETA HAS 30 TO 40 INCHES FOR DENVER...GFS IS HOLDING STEADY WITH 15 TO 20 INCHES. STILL
ALSO THINK THAT THE MODELS ARE TOO WARM OVER MUCH OF EASTERN COLORADO BY TUE NIGHT AS THE
SURFACE TEMPERATURE GRADIENT SHOULD BE VERY TIGHT...PARTICULARLY AS THE SYSTEM DROPS A BIT SOUTH
AND TILTS ALLOWING MORE NLY FLOW ALONG THE FRONT RANGE. STILL A LOT OF UNCERTAINTY ON RAIN/SNOW
QUESTION AND WHERE THE SHARP LINE BETWEEN BLIZZARD AND MOSTLY RAIN WILL BE. IN THIS PERIOD THERE
SHOULD BE ENOUGH WIND FOR BLIZZARD TYPE WORDING.
ETA GENERATES A BAND OF 80 INCHES OF SNOW IN THE HIGHER FOOTHILLS... SNOW MODEL GIVES
INCH PER HOUR RATES FROM NOW THROUGH WED NIGHT. THE 5 FOOT LIMIT IN THE FOOTHILLS DOES NOT
APPEAR TO BE ENOUGH. I WILL TRY 3 TO 8 FEET BUT THERE COULD BE SOME PRIME SPOTS THAT GET EVEN
MORE. I SUPPOSE THERES NO DIFFERENCE EXCEPT FOR THE RECORD BOOKS. SERIOUS SNOW STILL LOOKS TO
END SOMETIME WED NIGHT IN DENVER...MAY LINGER INTO THU MORNING ON THE PLAINS. NO CHANGE TO THE
EXTENDED.
DEN...WINTER STORM WARNING TONIGHT THRU WED FOR MTNS...FTHLS AND PARK CNTY...ZNS
31..33..34..35..36..37. WINTER STORM WARNING TONIGHT THRU WED FOR THE FRONT RANGE... ZNS
38..39..40..41..43. WINTER STORM WATCH TUESDAY THROUGH WEDNESDAY PORTIONS OF THE NORTHEAST
PLAINS...ZNS 42..44..45...46..47..49.
| Available Data | |
| Model Output | Observations and Forecasts |
|
Eta Planview
Loop Eta DEN Sounding Loop Eta Cross
Section Loop |
Station Observations Satellite Loop |
Rain or Snow
Question
Current Time: 0300 UTC 18 March
Take a look at the Eta-produced QPF fields for 1200-0000 UTC on 18-19 March generated by the model run initialized at 0000 UTC on 18 March (look at the 12-24 hr model forecasts). Two notable characteristics of the predicted precipitation pattern are present:
- The developing conveyor belt of moisture extending from eastern Oklahoma northwestward into the central and northern Rocky Mountains, and
- The enhanced precipitation over the eastern slope of the Rockies.
| Available Data | |
| Model Output | Observations and Forecasts |
|
Eta
Planview Loop Eta DEN Sounding Loop Eta Cross Section Loop |
Station Observations Satellite Loop |
| Supporting Topics |
|
Regional Cool Season Rules-of-Thumb Thickness Thresholds for Rain and Snow Boundary TROWAL: see the COMET Module "Mesoscale Banded Precipitation, section 3.3 Conveyor Belt Model" scroll down to section 3.3.5 Trowal (Warm Conveyor Belt) |
Look at the data fields that might be useful to determine precipitation type in the Denver area. Note that Denver's elevation is 1615 m (5300 ft) or about 840 hPa. Based on the surface temperature plot, would you expect the precipitation to be falling as rain or snow in the Denver vicinity at 0000 UTC on 19 March? Choose the best answer.
The correct answer is a).
For 0000 UTC 19 March, the Eta40 is predicting:
- Surface temperatures in the 3-4ºC (37-39ºF) range
- 850 hPa tempartures of about 5ºC (41ºF)
- 1000-500 hPa thickness of 549-550 dam (threshold thickness is about 548 dam during the spring months)
- The point sounding at DEN shows the surface dewpoint well above freezing and the low-level lapse rate just about moist adiabatic
All of these model parameters point towards a rain scenario for Denver at 0000 UTC on 19 March, except for the significant precipitation rate predicted by the model for that time and the current evidence of cold advection in the surface observations. Keep in mind that a heavier precipitation rate tends to lower the melting level, and NWP tends to underpredict cold advection in northerly flow. Also, the Eta model tends to overpredict surface temperatures for a storm scenario during the cool season in this region.
By 0000 UTC on 19 March, the model shows an established strong, deep cutoff low pressure system over the southern Rockies and central/southern plains. Looking backwards at how this scenario set up, for a period of about 48 hours, beginning at about 1200 UTC on 17 March, the water vapor imagery shows a classic warm, deep conveyor belt out in front of the cutoff transporting large amounts of moisture directly from the Gulf of Mexico northwestward into the central Rockies. In the northern portion of the cutoff system, a strong Trowal feature (see the reference in the Supporting Topics for more information on Trowals) sets up as the occlusion matures, and wraparound of the warm conveyor belt contributes to significant precipitation over the central and southern Rockies, well removed from the cutoff center off to the southeast. Evidence of the Trowal can be seen as the warm conveyor belt of moisture extending from the southern Mississippi Valley northwestward into the high plains, and extensive high moisture values on the northwestern quadrant of the center of the cutoff low.

Evidence of a Barrier Jet
Question
Current Time: 0300 UTC 18 March
| Available Data | |
| Model Output | Observations and Forecasts |
|
Eta
Planview Loop Eta DEN Sounding Loop Eta Cross Section Loop |
Station Observations Satellite Loop |
| Supporting Topics |
|
Refer to the generic barrier jet material here |
Do you see evidence in the model fields of a barrier jet on the eastern slopes of the Rockies during the first 36 hours of the model forecast? Choose the best answer.
The correct answer is b).
Note the nose of high pressure extending southward along the east slopes of the foothills over southeastern WY through eastern CO beginning at about 1500 UTC on 18 March and lasting through the period. Also, during the 0000-2100 UTC 18 March time period, note the enhanced northerly surface flow along the Front Range, especially over northern Colorado.

On the model cross section, a core of stronger wind speeds is clearly evident through the period beginning with the 6-hour forecast. The northerly wind plot ("Winds, v-component" in Eta Cross Section Loop) shows a core wind speed forecast to exceed 30 knots between 0000-1200 UTC on 19 March. The jet slopes upwards towards the barrier during most of the period. There is also a zone of reduced equivalent potential temperature within the barrier jet hugging the eastern slopes, beginning between 0600 and 1200 UTC on 18 March. This cold air becomes particularly strong and remains so from 0600 UTC on 19 March onward. Also, it's generally accepted by local forecasters that the operational products typically under-predict barrier jets in this region.
Causes of Ridging
Question
Current Time: 0300 UTC 18 March
| Available Data | |
| Model Output | Observations and Forecasts |
|
Eta
Planview Loop Eta DEN Sounding Loop Eta Cross Section Loop |
Station Observations Satellite Loop |
| Supporting Topics |
|
Refer to the generic barrier jet material here |
What is primarily responsible for the model-produced MSLP contours nosing (or ridging) southward in a wedge-shape down the eastern slopes of the Rockies from eastern WY to northeastern NM on 18 March? Choose the best answer.
The correct answer is d).
Since the model at least partially captures the development of a barrier jet, there should be a signature on the associated thermal fields. As air near the foothills accelerates southward, cooler air is drawn into the region from the north. This local reduction in temperature hydrostatically leads to local pressure rises; hence the locally higher surface pressure predicted along the foothills and adjacent plains.
Location of Significant Uplift
Question
Current Time: 0300 UTC 18 March
| Available Data | |
| Model Output | Observations and Forecasts |
|
Eta
Planview Loop Eta DEN Sounding Loop Eta Cross Section Loop |
Station Observations Satellite Loop |
Where is the most significant uplift in the model at 0000 UTC on 19 March? Choose the best answer.
The correct answer is a).
(Refer to the Eta X-section) The omega values are maximized over the sloped theta-e contours associated with the top of the blocked layer. The barrier jet resides within this layer. This location is just east of the northern Colorado foothills.
Northerly Flow Regime
Question
Current Time: 0300 UTC 18 March
| Available Data | |
| Model Output | Observations and Forecasts |
|
Eta
Planview Loop Eta DEN Sounding Loop Eta Cross Section Loop |
Station Observations Satellite Loop |
Thermally, what does the northerly flow regime represent at this time (0000 UTC on 19 March)? Choose the best answer.
The correct answer is d).
The blocking process and the barrier jet development create a surface-based layer of cold air characterized by primarily northerly flow. Warm, moist, easterly flow is running up and over this layer. In this case, arctic or modified arctic air is not involved but it may be present in other events.
Also, diabatic processes have contributed significantly to the cold temperatures in the low levels. Wraparound is developing, but the plains air that is wrapping up on the northern side of the cutoff low is actually ascending over the blocked layer.
Rain/Snow Boundary
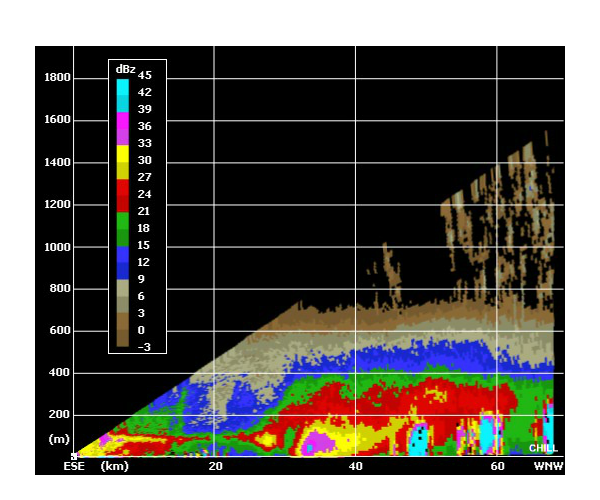
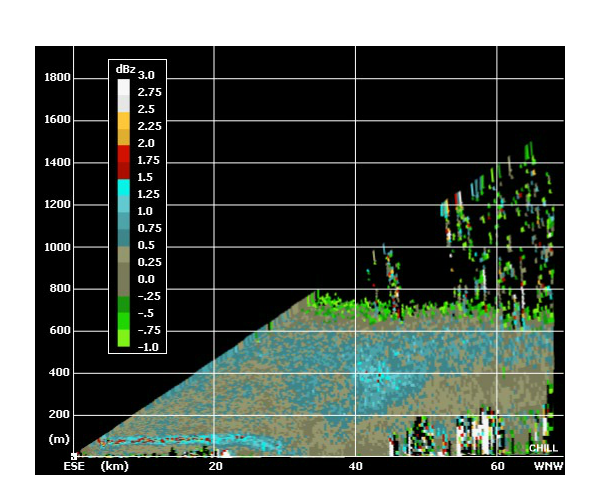
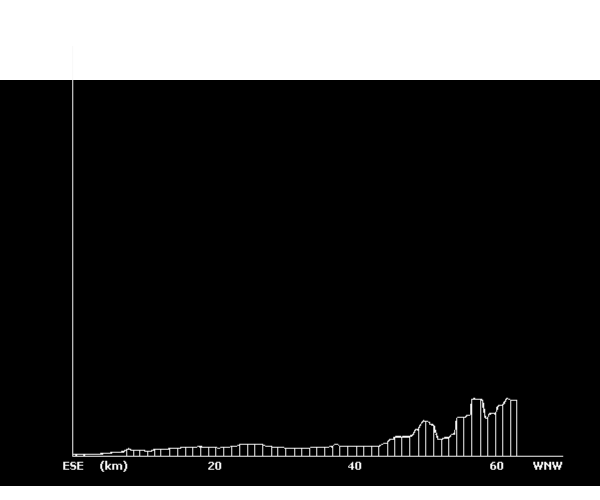
Question
Current Time: 0600 UTC 18 March
It's now 3 hours later. Approximate the location of the rain/snow boundary on the CHILL radar data cross-section at 0600 UTC on 18 March.
| Available Data | |
| Model Output | Observations and Forecasts |
|
Eta
Planview Loop Eta DEN Sounding Loop Eta Cross Section Loop |
Station Observations Satellite Loop CHILL Radar Scans |
| Supporting Topics |
|
Refer to the generic barrier jet material here Regional Cool Season Rules-of-Thumb |
What is likely a substantial contributor to cooling near the foothills besides terrain-induced uplift and cold advection? Choose the best answer.
What is opposing this cooling on the large-scale at this time? Choose the best answer.
The correct answer is b) and e).
The radar data shows not only that significant precipitation is falling over and near the foothills, but melting is a major factor in the precipitation process at this time, especially with surface temperatures slightly above freezing. Any liquid precipitation in this scenario originated as frozen hydrometeors, and the polarized data is clearly showing the melting level west of the radar. Synoptic-scale uplift is occurring, but is likely contributing much less to the cooling on the local scale.
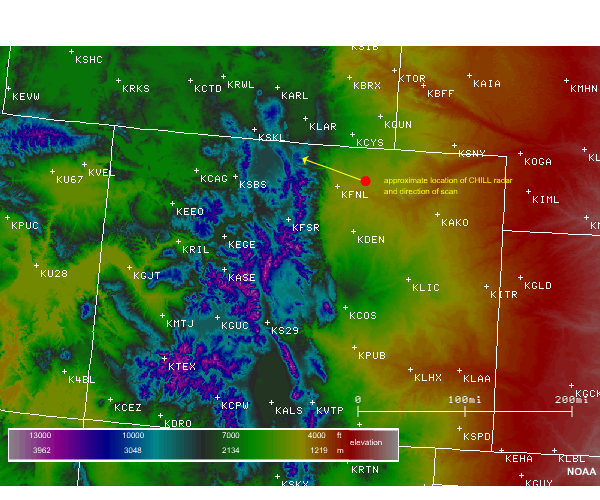
CHILL Radar Scans: 0603 UTC 18 Mar 2003
Reflectivity Content
Differential Reflectivity Content
Terrain Profile Content
CHILL Radar and Scan Location Content
A major mechanism for the precipitation production over and east of the foothills at this time is uplift of the warm conveyor belt over the barrier-jet layer. The surface observations well east of the blocked regime (over eastern Colorado, western Nebraska, and western Kansas) exhibit very warm, saturated air progressing westward. There are a few localized areas of downslope within the barrier-jet layer, but this is likely contributing to minor, localized warming, as opposed to the more important effect of warm advection aloft.
Moisture and Uplift
Question
Current Time: 2100 UTC 18 March
| Available Data | |
| Model Output | Observations and Forecasts |
|
Eta
Planview Loop |
Station Observations |
Moving forward in time again, it's now 2100 UTC and the precipitation in the region is now widespread. What is the most critical large-scale feature that is supplying moisture and providing uplift at 1800 UTC on 18 March, based on the available Eta model run? Choose the best answer.
The correct answer is a).
This is clearly evident on the 1000-500 hPa relative humidity plot on the Eta analysis at 1800 UTC. The warm, moist layer's signature is evident from the Oklahoma region northwestward into the central high plains. It is manifested in an arc-shape because of the deep low pressure over the southern high plains and southern Rockies.
Assess Cyclogenesis
Question
Current Time: 2100 UTC 18 March
| Available Data | |
| Model Output | Observations and Forecasts |
|
Eta
Planview Loop Eta Planview Analyses Loop |
Station Observations |
Assess the existence (or non-existence) of low-level cyclogenesis along the Rocky Mountain Front Range up to this time point. What process is primarily responsible for the tightening of the north-south, low-level pressure gradient north of the surface low? Choose the best answer.
The correct answer is c).
Examination of the Eta MSLP reveals no significant cyclogenesis over the southern plains or southern Rockies in this case. Instead, surface pressures are rising rapidly over the northern Rockies and northern plains. The diabatic effects are significant over the northern plains but are secondary to large-scale processes creating anticyclogenesis.
System-Relative Flow
Question
Current Time: 2100 UTC 18 March
| Available Data | |
| Model Output | Observations and Forecasts |
|
Eta
Planview Loop Eta Planview Analyses Loop |
Station Observations |
Would it be useful to look at the system-relative flow in the analysis of storm dynamics from 1200 UTC on 18 March through 0000 UTC on 19 March? Choose the best answer.
The correct answer is b).
The 700-hPa height chart from 1200 UTC on 18 March through 0600 UTC on 19 March shows little movement in the low center and only elongation of the trough in general. This is due to the fact that the amplification of the long-wave pattern aloft in general is increasing rapidly, a scenario not conducive to significant movement of the major storm system.
Isentropic Uplift
Question
Current Time: 2100 UTC 18 March
| Available Data | |
| Model Output | Observations and Forecasts |
|
Eta Planview Loop Eta Cross Section Loop Eta Planview Analyses Loop |
Station Observations |
| Supporting Topics |
|
Isentropic Analysis: see the COMET Module Isentropic Analysis |
Specify regions where isentropic uplift is significant at 1800 UTC on 18 March. What are the most important factors causing this uplift? Choose all that apply. (For more information on isentropic analysis, please visit the link in the Supporting Topics)
The correct answer is b), c) and e).
Positive pressure advection and moisture vectors point along the conveyor belt. A deep and potentially unstable layer is being lifted above the barrier jet layer.
Areas of Heavy Precipitation
Question
Current Time: 0300 UTC 19 March
We are now in the midst of the storm along the Front Range urban corridor. Snowfall rates of 1-3 in (2.5-7.6 cm) per hour are common in and just east of the foothills. Temperatures have fallen to the point that air and road travel in general has been reduced to a standstill.
| Available Data | |
| Model Output | Observations and Forecasts |
|
Eta Planview Loop Eta Cross Section Loop |
Station Observations |
Take a look at the Eta-produced QPF fields for the 0000-1200 UTC period for 19 March, generated by the model run initiated at 0000 UTC on 19 March. Over Colorado, what area is persistently characterized by the heaviest precipitation during the period 0000-1800 UTC? Choose the best answer.
The correct answer is b).
In general, surface observations at 0000 UTC on 19 March reveal a broad expanse of easterly-to-northeasterly flow over the plains, becoming intense and northerly near the Front Range. Note the temperature gradient between the foothills and the eastern plains of Colorado. Precipitation coverage has been significant over portions of the high plains and central/southern Rockies, but particularly intense along and near the head of the warm conveyor belt extending into northeastern Colorado.

The large, deep, and strong circulation around this cutoff system includes a deep layer of upslope (easterly) flow impinging on the Front Range of the Rockies. The Platteville profiler, north of Denver, shows the evolution of this layer from 0000 UTC on 18 March through 0000 UTC on 19 March. Generally, easterly flow at 35 to 55 knots was produced by the synoptic cutoff low in the deep layer from 700 to 300 hPa.

Wind Profiler
Question
Current Time: 0300 UTC 19 March
| Available Data | |
| Model Output | Observations and Forecasts |
|
Eta Planview Loop Eta Cross Section
Loop |
Station Observations NOWRAD
|
What does the surface-based layer of northerly flow at Platteville represent during the period 0000 UTC on 18 March through 0000 UTC on 19 March? Choose the best answer.
The correct answer is c).
Evidence of the barrier jet continues to be seen in the low-level northerly flow at Platteville. The barrier jet winds shown are particularly impressive when one considers that the lowest data point is more than 300 m from the ground, and the jet likely strengthens westward towards the foothills. Platteville is about 40 km (25 mi) east of the foothills.
Rain/Snow Line
Question
Current Time: 0300 UTC 19 March
| Available Data | |
| Model Output | Observations and Forecasts |
|
Eta Planview Loop Eta Cross Section Loop |
Station Observations NOWRAD
|
Where is the approximate location of the rain/snow line at this time over the northern Colorado, and what is its orientation? Choose the best answer.

The correct answer is b).
Surface temperatures and observed precipitation types indicate a north-south oriented rain/snow line just east of the urban corridor. This demarcation set up 36 to 48 hours earlier and has moved some distance eastward. Warm advection on the east side of the transition is offset by weak cold advection on the west side and strong latent cooling due to melting over the transition zone.. The west side cold advection is driven by the development of the barrier jet, and the latent cooling is driven by uplift generated by the barrier jet.
Dynamic Mechanisms
Question
Current Time: 0300 UTC 19 March
| Available Data | |
| Model Output | Observations and Forecasts |
|
Eta Planview Loop Eta Cross Section Loop |
Station Observations NOWRAD
Satellite Loop |
From 0000 to 1200 UTC on 19 March, do the Eta forecasts indicate that the primary dynamic mechanisms are weakening, getting stronger, or maintaining the same strength? Choose the best answer.
The correct answer is c).
There are no signs of significant changes in the two main dynamic mechanisms driving the precipitation during this time period. Both the barrier jet and the easterly upslope flow are maintaining their strength.
Movement of Precipitation Regimes
Question
Current Time: 0300 UTC 19 March
| Available Data | |
| Model Output | Observations and Forecasts |
|
Eta Planview Loop Eta Cross Section Loop |
Station Observations NOWRAD
|
Generally, are there static vs. transient precipitating regimes evident at this time? Choose the best answer.
The correct answer is a).
The persistent regions of high reflectivity are those associated with the quasi-stationary barrier jet and the associated induced uplift in the moist easterlies aloft.
Forecast Weakening of Storm
Question
Current Time: 0300 UTC 19 March
| Available Data | |
| Model Output | Observations and Forecasts |
|
Eta Planview Loop Eta Cross Section Loop |
Station Observations NOWRAD
|
When does the model forecast the most significant weakening of the barrier jet? Choose the best answer.
The correct answer is b).
The key ingredients are:
- The wind speed and direction over and just east of the foothills, and
- The cold thermal barrier as defined by the equivalent potential temperature contours.
The model indicates the core of northerly flow to be situated over and just east of the foothills through 1200 UTC on 19 March. The same holds true for the distinct, low-level thermal barrier over this region, sloping upwards to the west. The northerly flow and slope of the thermal barrier decrease rapidly after 1200 UTC on 19 March.
With the weakening of the barrier jet, the associated lift will weaken, and precipitation should taper off.
The End in Sight
Current Time: 1700 UTC 19 March
Just as the model forecasts indicated, after about 1200 UTC on 19 March the barrier jet breaks down and the pronounced Trowal structure that had been in place begins to weaken significantly.

By 1700 UTC on 19 March, the storm is decreasing in intensity over the Front Range of Colorado as the easterly component of wind aloft rapidly weakens. The direct connection to Gulf moisture weakens, and the influx of strong, precipitation-generating cells aloft advecting into the region from the east and southeast has ended. By this time, northern Colorado is experiencing northeasterly-to-northerly flow from the surface on up through the middle levels of the atmosphere. As a result, significant precipitating features are confined to the eastern foothills and the adjacent plains—essentially the final barrier jet signature. At 2100 UTC all but the southern portion of the urban corridor is free of snowfall.
With the storm now weakening, let's move on to a post-event analysis.
Case Summary
Assessment of Forecasts
Generally, this storm was well forecast. The models were fairly accurate at predicting the onset of a barrier jet and the depth of the easterly flow and moisture. The timing of the weakening of these dynamics was also generally well forecast. The key forecasting challenge centered on the rain/snow boundary and adjusting QPFs and snow totals. In these scenarios, local knowledge of how the barrier jet manifests itself helps in making these adjustments.
Let's take a closer look at these local effects and how snowfall amounts varied in the area. This particular case had some very interesting local terrain effects, which may be instructive in other geographic locations.

Extreme Mesoscale Snowfall Gradients
Local enhancements and reductions in snowfall amounts present large challenges for operational forecasters. When you consider the horizontal snowfall gradients observed after the storm, the situation was particularly challenging for this storm. Since the region is bisected by major interstate highways and contains a large population center with many outlying communities, the societal impacts of the gradient were huge.
The official storm totals show a record amount of accumulation in the foothills and mountains west of the metro area, with over 70 inches in some areas of the foothills and higher elevations. Snow totals quickly taper down to the east of the urban corridor but are still at a respectable 24-36 in. (61-91 cm) in the adjacent plains and city. Accumulations further east taper off to lesser amounts, since the changeover to snow occurred late in the precipitation phase of the storm.
There are obvious terrain effects to note in the distribution of snow totals. The orographic effects of the east-facing foothills and mountains are obvious factors. These were enhanced by the barrier jet and associated strong, easterly mid-level flow. More subtle terrain effects are also notable. Take a closer look at the area of low snow accumulations to the southeast of Lyons and west of Loveland (LVL). We'll explore this a bit further.

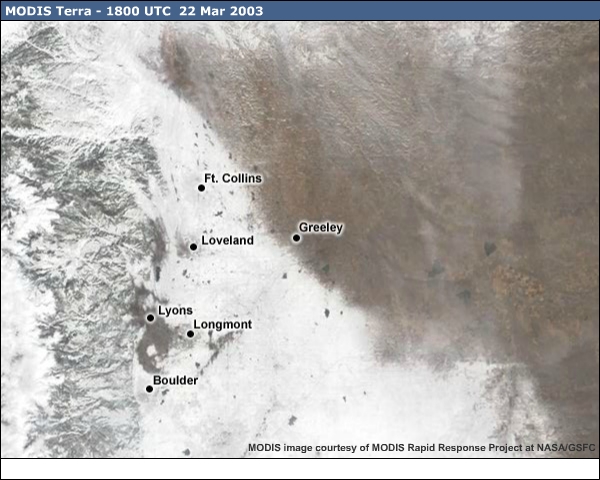
Satellite Imagery of Snow Cover
A satellite snapshot of this region a few days after the storm accentuates some of the mesoscale variations in snowfall. Note that some melting has occurred by this time as daytime maximum temperatures were reaching the 40s and 50s ºF (+5 to +15ºC) during the 21-22 March period over northeastern Colorado.
The first feature in the imagery that stands out is the NW-SE oriented snow/no-snow boundary reaching from north of Fort Collins near the Wyoming border all the way to the plains east of Denver—a boundary over 150 mi (~240 km) in length. The lack of snow in areas to the east is a result of the synoptic flow of warmer air from the southeast. Closer to the foothills, the barrier jet's cold air defines the rain/snow line.
But again take note of the two areas with very low snow totals to the southeast of Lyons and west of Loveland. Compare the MODIS imagery to the local terrain maps.
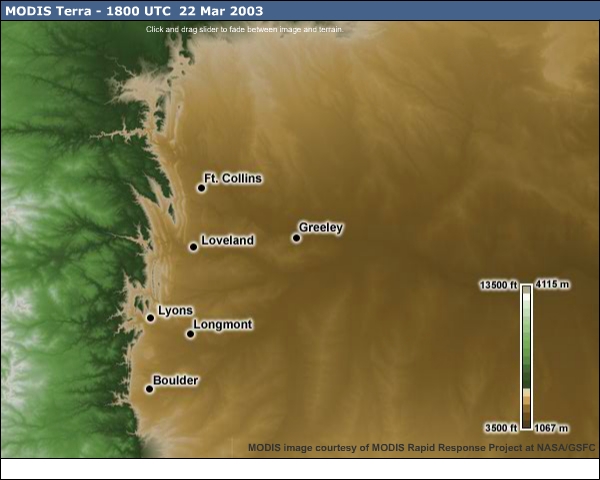
Causes of Snow Minima
Question
Based on the terrain plot, what might be the most likely contributors to the areas of snow minima west of Loveland and southeast of Lyons? Choose all that apply.
References Map:
The correct answer is b) and d).
Note the significant eastward protrusions of ridges just north and northeast of Lyons, as well as northwest of Loveland. These ridges of interest exhibit elevations on the order of 300-400 m higher than the plains immediately to their lee side. Northerly flow at the surface along these terrain features created some regions of local, low-level upslope and downslope conditions. The areas of downslope northerly flow match up well with the snowfall minima.
The critical question for the reduction in snowfall is whether the culprit is locally increased surface temperature, reduced precipitation, or both. Observations at a few locations within these regions did indicate surface temperatures just slightly higher (by 0.5-1.0°C) than those observed nearby. For example, at 0000 UTC on 19 March, the observed temperature at Lyons was 34°F (1.1ºC), while at Longmont and Boulder the values are 33°F (0.6ºC) and 32°F (0ºC), respectively. Winds were observed to be oriented approximately 340 degrees at Lyons, which is slight local downsloping off the higher terrain—a potentially warming scenario. Another area where local downsloping conditions played a role is the northernmost portion of the rain/snow boundary near Wyoming. It was likely defined by the barrier jet's downsloping flow off the Cheyenne Ridge.
With much of the region in a near 32ºF (0ºC) environment throughout the storm, it appears that relatively small terrain variations produced just enough local warming along the barrier jet to exert a profound effect on the snowfall distribution.
Summary
In closing:
- The barrier jet was the primary dynamic factor in the development of snowfall depths of historic proportions in this storm.
- Barrier jet development provided just enough cooling at the surface to force much of the precipitation to be snow instead of rain from the urban corridor westward.
- Local terrain influences on the barrier jet created very large snowfall gradients spanning areas of similar elevation.
Forecasting Challenges:
- A serious consideration of likely unprecedented and extreme (climatologically, a 1-in-50-to-100-year type of event) precipitation amounts forecast by the models well in advance was necessary, once the predicted extreme strength and depth of the upslope flow was recognized by the forecaster.
- An understanding of the key processes (diabatic cooling and lifting over the barrier jet) was necessary to forecast the location of the rain/snow boundary in this storm.
- Once the areas of northerly flow were anticipated over the urban corridor, recognition that relatively subtle terrain variations could make a very large difference in snowfall accumulation in a near-freezing environment was critical to making an accurate forecast.
This concludes this case exercise. As always, we appreciate your comments regarding the relevance and effectiveness of our modules. Please take a moment to fill out a User Survey.
References
Doesken, N., 2003: Just what the drought doctor ordered: A summary and observations of the March 17-20, 2003 snowstorm – a climatologist’s view. Colorado Climate: Water Year 2003, Vol. 4, No. 1-4, pp. 13-15.
Forbes, G.S., R. Anthes, and D. Thompson, 1987: Synoptic and mesoscale aspects of an Appalachian ice storm associated with cold-air damming.Mon. Wea. Rev., 115, 564-591.
Marwitz, J., and J. Toth. 1993: The Front Range blizzard of 1990. Part I: Synoptic and mesoscale structure.Monthly Weather Review: 2, pp. 402–415.
Meyers, M.P., J. Snook, D. Wesley and G. Poulos. 2003: A Rocky Mountain storm. Part II: The forest blowdown over the west slope of the northern Colorado mountains—Observations, analysis, and modeling.Weather and Forecasting: 18, pp. 662–674.
Parish. T.R., 1982: Barrier winds along the Sierra Nevada Mountains. Journal of Applied Meteorology: 21, No. 7, pp. 925–930.
Steenburgh, W.J., 2003: One hundred inches in one hundred hours: Evolution of Wasatch Mountain winter storm cycle.Weather and Forecasting: Vol. 18, No. 6, pp. 1018–1036.
Weaver, J.F., 2003: An unusually heavy snow fall in north central Colorado: Or odd things that happen during severe droughts – a meteorologist’s view. Colorado Climate: Water Year 2003, 4, No. 1-4, pp. 1-2 & 18-21.
Contributors
COMET Sponsors
- National Oceanic and Atmospheric Administration (NOAA)
- National Weather Service (NWS)
- Naval Meteorology and Oceanography Command (NMOC)
- Air Force Weather Agency (AFWA)
- National Environmental Satellite, Data, and Information Service (NESDIS)
- Environment Canada Meteorological Service of Canada (MSC)
- Australian Bureau of Meteorology (BoM)
Principal Science Advisor and Project Lead
- Dr. Doug Wesley — UCAR/COMET
Additional Science Contributors
- Scott Bachmeier — University of Wisconsin/CIMSS
Ron Goodson— MSC
Instructional Design
- Bruce Muller — UCAR/COMET
Multimedia Authoring
- Bruce Muller — UCAR/COMET
- Dan Riter — UCAR/COMET
Computer Graphics/Interface Design
- Steve Deyo — UCAR/COMET
- Heidi Godsil — UCAR/COMET
Audio Editing/Production
- Seth Lamos — UCAR/COMET
Audio Narration
- Dr. Greg Byrd — UCAR/COMET
Software Testing/Quality Assurance
- Mike Smith — UCAR/COMET
- Linda Korsgaard — UCAR/COMET
Copyrights Administration
- Mike Smith — UCAR/COMET
Data
- NOAA/NWS
- Colorado State University/NSF
COMET HTML Integration Team 2021
- Tim Alberta — Project Manager
- Dolores Kiessling — Project Lead
- Steve Deyo — Graphic Artist
- Ariana Kiessling — Web Developer
- Gary Pacheco — Lead Web Developer
- David Russi — Translations
- Tyler Winstead — Web Developer
COMET Staff, 2006
Director
- Dr. Timothy Spangler
Deputy Director
- Dr. Joe Lamos
Business Manager/Supervisor of Administration
- Elizabeth Lessard
Administration
- Lorrie Alberta
- Hildy Kane
- Linda Korsgaard
Graphics/Media Production
- Steve Deyo
- Heidi Godsil
- Seth Lamos
Hardware/Software Support and Programming
- Tim Alberta (IT Manager)
- James Hamm
- Karl Hanzel
- Ken Kim
- Mark Mulholland
- Dan Riter
- Carl Whitehurst
- Malte Winkler (student)
Instructional Design
- Patrick Parrish (Production Manager)
- Dr. Alan Bol
- Lon Goldstein
- Dr. Vickie Johnson
- Bruce Muller
- Dwight Owens
- Dr. Sherwood Wang
Meteorologists
- Dr. Greg Byrd (Project Cluster Manager)
- Wendy Schreiber-Abshire (Project Cluster Manager)
- Dr. William Bua
- Patrick Dills
- Tom Dulong
- Kevin Fuell
- Dr. Stephen Jascourt
- Matthew Kelsch
- Dolores Kiessling
- Dr. Arlene Laing
- Elizabeth Mulvihill Page
- Dr. Doug Wesley
Software Testing/Quality Assurance/Copyrights Administration
- Michael Smith (Coordinator)
Spanish Translations
- David Russi
NOAA/National Weather Service - Forecast Decision Training Branch
- Anthony Mostek (NWS COMET Branch Chief [acting] and Satellite Training Leader)
- Dr. Richard Koehler (Hydrology Training Lead)
- Brian Motta (IFPS Training)
- Dr. Robert Rozumalski (SOO Science and Training Resource [SOO/STRC] Coordinator)
- Shannon White (AWIPS Training)
Meteorological Service of Canada Visiting Meteorologists
- Phil Chadwick
- James Cummine