Scenario
Scenario » 0800 UTC (0400 LT) 23 July 2001
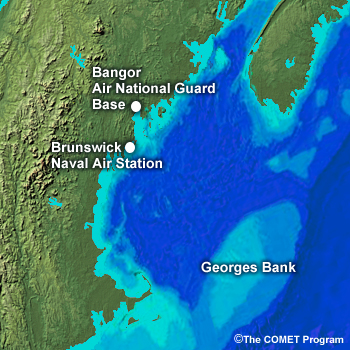
I'm working the forecast desk for the Naval Atlantic Meteorology and Oceanography Detachment at the Brunswick Naval Air Station in Maine.
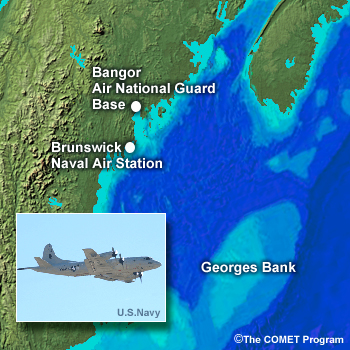
The air station is home to several P-3 surveillance squadrons. The Operations Officer of Patrol Squadron 26 just called. His squadron is being tasked for a mission in the vicinity of the Georges Banks.
A suspected drug smuggler has been transiting the area recently. Apparently, a suspicious radio communication was intercepted from a ship located approximately 200 nm southeast of the base. A Coast Guard patrol boat is already in the area looking for the culprit. They want air support for the search effort. This is to be a joint operation with a squadron from the Bangor Air National Guard Base joining the air search.
The Operations Officer, who is coordinating the air search, wants an update on weather conditions for flight departure by 1000 Z. He also wants information on the in-flight conditions to the search area and conditions at the search area starting at 1100 Z. He needs to decide whether his P-3's will be effective in searching for the suspect ship. That means he’ll need accurate analyses and forecasts for ceilings and visibility. He's also going to need continuous updates on expected forecast conditions until dark when operations will be suspended until the next day. So he'll need an forecast outlook for tomorrow as well.
Looks like I have a challenging forecast ahead.
Scenario » Establishing Situational Awareness
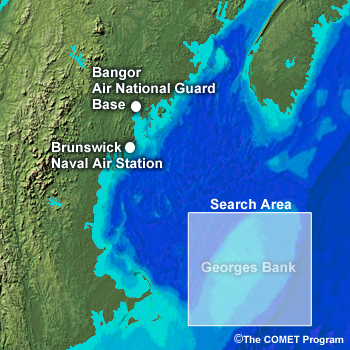
I quickly head over to my workstation to review recent observations and trends. The search area encompasses the region near and north of the Georges Bank.
I assess what the needs of the operation are going to be. Let's see, we've got aircraft taking off and landing from shore points with in-flight ops over the marine environment. I have to carefully assess and monitor cloud cover and vertical visibility as well as horizontal visibility at flight level. I also need to monitor potential ceiling and visibility restrictions at the airfields involved.
Scenario » SSTs
This is a tricky area because of the strong sea surface temperature gradients that exist in the region. The SST gradient is especially noteworthy along the southern edge where the Gulf Stream interacts with the cold Labrador Current. As a result, this area is well known for its extensive and persistent fog and stratus events.
Scenario » Surface Observations
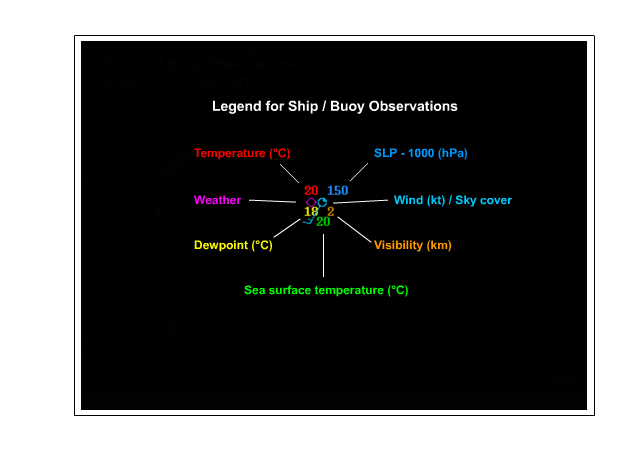
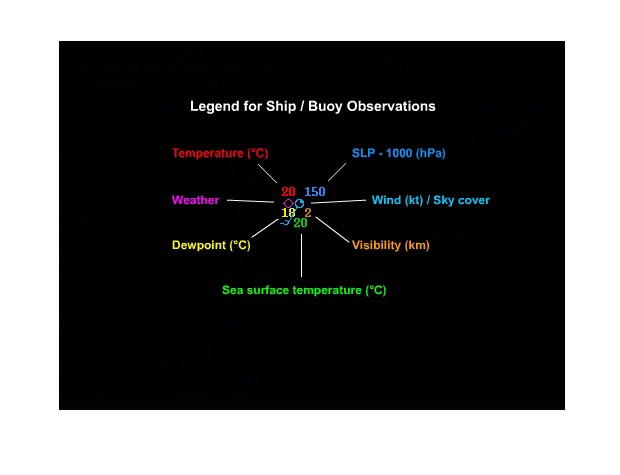
Legend for graphic:
upper-left, red = temperature
lower-left, yellow = dewpoint
upper-right, blue = SLP - 1000 hPa
bottom-center, green = SST
lower-right, brown = visibility in nm
I take a quick look at the ship, buoy, and surface METAR data for the previous overnight period. No fog is being reported over the entire region. Visibilities are running 1 to 2 nm and temperature-dewpoint spreads are about 3°C near the New England coast. They decrease to about 1°C well offshore, especially southeast of Cape Cod. Dewpoints are also generally lower than the SSTs over the Gulf of Maine region. So far, so good, at least for the search area.
Farther south, along the mid-Atlantic, dewpoints are considerably higher, running anywhere from 22 to 25°C. Some reports show dewpoints higher than the SSTs with temperature-dewpoint spreads of 0°C. I'll have to watch this area of moist air since the winds are coming from the southwest and may advect this higher dewpoint air over the region later today.
A look at a more localized view shows a similar story. Visibilities running 1 to 2 nm, no fog reported, and temperture-dewpoint spreads of 2 to 3°C.
I also need to check local observations to make sure there are not any restrictions at any of the local airfields. The sequence of hourly observations from last night to the present doesn’t indicate any problems. Even along the coast visibilities remain in the 5 to 10 nm range and ceilings are unlimited.
Scenario » Satellite Observations
Satellite imagery can tell me if there are more localized areas of fog not being picked up by the surface obs.
The first visible imagery of the day just arrived. Examining it, it looks like there is some multilayered cloudiness both over the coastal region and the search area, but the sun angle is still a bit too low to tell if low clouds or fog are present.
Scenario » Synoptic Forecast - NOGAPS
I pull up the analysis for the latest available NOGAPS run. It looks like we're under southwesterly flow at the surface with more zonal flow aloft at 700 mb. Low-level relative humidity in the search area is well below saturation, but higher values exist upstream to the southwest. The air aloft is drier.
A model sounding from out in the search area reveals a surface-based inversion with a 3°C dewpoint depression at the surface. The inversion is capped by relatively dry air at 975 mb. With a relatively moist boundary layer capped by drier air, the potential for fog is there. We'll just have to keep an eye on things.
Scenario » The Forecast
Okay, it is now 1030 Z, better get back to the Operations Officer with my assessment of the current conditions.
AG1 Campbell: Commander, this is Petty Officer Campbell at the Navy Weather Detachment. I'm ready to give you a briefing of the current conditions.
Commander: Go ahead Petty Officer.
AG1 Campbell: After examining the latest data and the trends from last night, I'd say your aircraft won't have any restrictions for takeoff. However, they will encounter areas of midlevel cloudiness with patchy stratus and areas of fog mostly along the southern edge of the search area. These conditions may restrict vertical visibility from time to time, but overall I believe you'll have sufficient conditions to begin the search.
I still have to get the updated data for the forecast, but based on last night's forecast you should be okay through this afternoon. We do have to watch for increasing moisture from the southwest, which may impact the area later today and into tomorrow. Give me a couple hours and I'll have the new model runs and updates for you. If I see anything in the meantime that is different I'll give you a call immediately.
Commander: Very well, let's get that forecast by 1400 Z. With the information you just provided, I'll order the go-ahead for the aircraft to head toward the search area. Thanks for the briefing.
Scenario » 1230 UTC - Assess New Incoming Data
Time to take a look at the latest data before the model runs get in.
The latest visible satellite data confirm that cloud cover is only patchy and that the only fog or stratus appears to be off the eastern and southern coasts of Cape Cod. This is not really in our search area, but I'll have to watch what happens with it during the course of the morning.
Surface observations indicate surface visibilities of about 1 nm throughout the region with light winds. One important note is the ship observation reporting fog southeast of Cape Cod. Although this is still south of our search area, I'll need to monitor this feature in the data. The higher dewpoint air along the mid-Atlantic coast will also have to be watched. Winds are generally from the south and southwest and the long over-water fetch and trajectories may moisten up the atmosphere in the search area later today.
Scenario » Maine Coast Sounding
Some of 1200 Z soundings are in from the region and I want to examine them to determine the temperature and moisture structure of the atmosphere, both locally and upstream. The actual sounding from Portland, Maine was not available, but looking at the model sounding for 1200 Z I'd say things are fairly dry. There is a surface-based inversion, but it does not look to be saturated. This coordinates well with the generally good visibilities along the Maine coast.
Scenario » Other Soundings
Next, I look at a couple of other soundings to round out my view of the boundary layer. One is located upstream at Chatham, Massachusetts, on Cape Cod, and the other is from Sable Island, offshore of Nova Scotia. It is more representative of the marine environment. Both soundings show a shallow, saturated, surface-based inversion with drier air immediately above it and a couple of shallow moist layers aloft. The dry air above the inversion supports favorable conditions for fog. The midlevel moist layers support the patchy mid level cloudiness we are seeing over the region right now. We'll have to watch how this low-level moisture evolves today.
With daytime heating, it looks like we are going to be okay for the next few hours. I'll give the Operations Officer another call to update him on the conditions and then turn my attention to the incoming model forecast data.
Scenario » Boundary Layer Evolution
I'm not yet convinced that fog or stratus is going to be a problem today for the search operations. I need more information on the amount of moisture that will be available in the marine boundary layer. Let's take a look at some model forecast soundings to see if there are any further clues that may be helpful. But first I need to consider air parcel trajectories and the characteristics of these parcels.
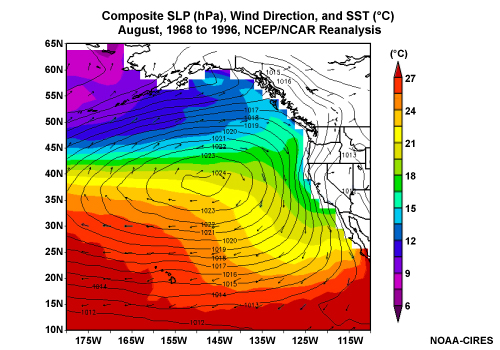
The surface flow for the past 12 hours is shown by the surface pressure and wind charts. Based on this information I can estimate the trajectory and source region of air that will move over the search area today. The flow is expected to remain from the southwest throughout the day.
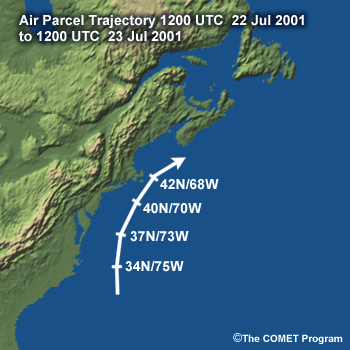
Based on this information I establish a general parcel trajectory for the past 24 hours.
Now I can assess the characteristics of the air mass being advected into the search area. NOGAPS model soundings along the trajectory are shown here for each point on the trajectory.
What stands out in this sequence of soundings is the decrease in surface temperature and dewpoint as air is advected northeastward. This low-level inversion is also strengthening as the air parcels advect northeast. The current presence of a low-level inversion, shallow, nearly saturated conditions over the search area, and advection of moist air from the south are of considerable concern for potential visibility and ceiling restrictions for later today or this evening.
Scenario » Sea Surface Temperatures
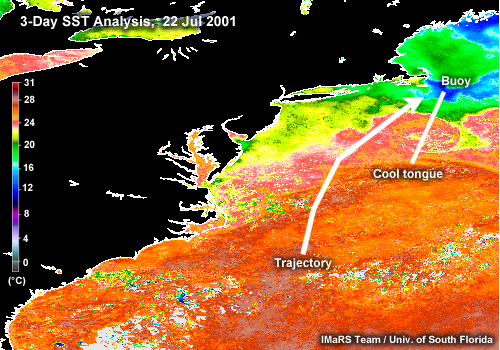
Looking at SSTs for the region, I can see a cool tongue over the southern portion of the search area where the temps are running in the mid to lower teens. The SSTs are lower than the dewpoints for air advecting into the region. With these conditions, it seems that the question is not if fog will form, but when and where.
Scenario » Current Satellite
Turning my attention back to the satellite imagery, I can see that fog appears to be forming from Long Island to Cape Cod and it is starting to advect out over the search area.
I call the Operations Officer back and let him know that while conditions will likely remain clear closer to land, visibility will probably deteriorate toward late afternoon or evening. Then I sit back and continue to monitor the surface and satellite obs.
Scenario » The Next Day
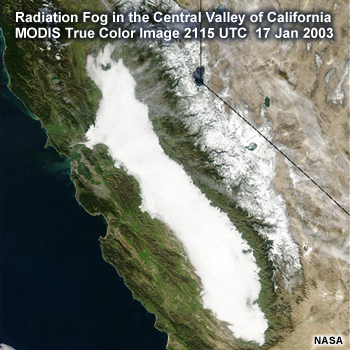
About an hour later the Operations Officer calls to let me know that they caught the smugglers. A good thing, too. Fog is forming along the southern portion of the search area and beginning to advect northward. By morning, much of the search area [below] will be blanketed.
Concepts
At the end of this section you should be able to do the following things:
With regard to the general features of dynamically forced fog and stratus:
- Describe the differences in boundary layer characteristics and evolution for advection, West Coast, and steam fog in a marine environment
- Describe the differences in synoptic environments for advection, West Coast, and steam fog in a marine environment
- Describe the relationship of sea surface temperature to fog formation for advection, West Coast, and steam fog in a marine environment
With regard to advection fog:
- Describe the general synoptic environment that is conducive to fog formation
- List at least 2 ways that subtropical high pressure systems contribute to the formation of advection fog
- Describe the evolution of the boundary layer along an air parcel trajectory that leads to advection fog
- Describe how sea surface temperature changes along an air parcel trajectory that leads to advection fog
- Recall the origins of strong sea surface temperature gradients
- On a world map, identify areas prone to advection fog
- Recall the seasonality of advection fog
With regard to West Coast fog and low stratus:
- Describe the general synoptic environment that is conducive to fog formation
- List at least 2 ways that subtropical high pressure systems contribute to the formation of West Coast fog and low stratus
- Describe the evolution of the boundary layer along an air parcel trajectory that leads to West Coast fog and low stratus
- List at least 2 ways that the boundary layer cools to saturation in a West Coast fog/stratus event.
- Recall the role of upwelling in the formation of West Coast fog and low stratus
- On a world map, identify areas prone to West Coast fog and low stratus
- Recall the seasonality of West Coast fog and low stratus
With regard to steam fog:
- Describe the general synoptic environment that is conducive to fog formation
- Describe the characteristics and evolution of the boundary layer along an air parcel trajectory that leads to steam fog
- On a world map, identify areas prone to steam fog
- Recall the seasonality of steam fog events
Concepts » Introduction
Concepts » Introduction » Introduction
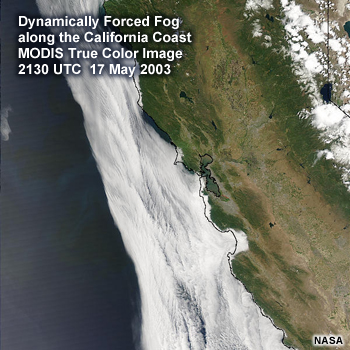
This module focuses on marine fog and stratus events that are forced by dynamic processes with radiative processes taking a secondary role. There are three types of dynamically forced fog or stratus that are addressed. These are:
- Advection fog/stratus
- West Coast type fog/stratus
- Steam fog
We look at the different synoptic and mesoscale conditions that result in each of the three types of dynamically forced fog or marine stratus events. The module then addresses in more detail how the boundary layer evolves for each type.
Through examination of a case event and other examples we address the mechanisms and processes contributing to the evolution of DFF events over oceanic regions and coastal zones and the evolution of marine stratus events. We establish a forecast process that will enable you to consider all parameters for an upcoming event (or non-event) and provide the best forecast support possible.
Concepts » Introduction » Role of Radiative Cooling
Specific details on fog events dominated by radiative processes are not specifically addressed in this module. However, radiative processes contribute to nearly all fog events to some degree. In particular, the maintenance of all fog events depends in large part on radiative fog-top cooling. The process of stratus lowering, which is of particular concern in West Coast fog events, similarly depends heavily upon radiative cloud-top cooling. If you are unfamiliar with this process or wish to review the concepts, see the brief background topic on Fog-Top Radiative Cooling.
Concepts » Introduction » Critical Factors
In the fog events considered here, the crucial factors that cause fog are associated with the dynamic evolution of the boundary layer. Radiative processes contributing to DFF and marine stratus events will be addressed along with the dynamics that lead to saturation of the boundary layer and the production of fog. In addition, we address the roles of terrain, upslope flow, and other mesoscale processes that can influence DDF and marine stratus events, especially along the coastal zone.
The previously-released COMET module, West Coast Fog, describes many of the physical process associated with moistening of the boundary layer and development of a strong inversion capping the boundary layer in these events. Completion of the West Coast Fog module will enhance your understanding of the material presented in this module.
Open the West Coast Fog module in a new window (https://www.meted.ucar.edu/fogstrat/ic31/ic313/)
Concepts » Introduction » Definitions
In order to understand the concepts presented in this module, make sure you know the definitions of the terms listed below. These terms are referred to frequently in the module.
- Meteorological Definition of Fog
- A ground-based cloud layer.
- Operational Definition of Fog
- A reduction in surface-based visibility to 1 km or less by atmospheric water droplets exhibiting diameters from a few to several tens of micrometers.
- Marine Stratus
- Marine stratus is a low-level cloud with a rather uniform cloud base that forms within the marine boundary. The cloud formation has little structure and is similar to fog, except that it is above the ground. Marine stratus does not usually produce precipitation, but when it does occur it is in the form of minute particles such as drizzle, ice crystals, or fine snow grains.
- Radiation
- A form of energy that propagates through the atmosphere. All objects that do not have a temperature of absolute zero emit radiation produced by the agitation of their molecules. All objects also absorb radiation. The primary forms of radiation important to fog are radiation emitted by the sun (solar radiation) and longwave radiation emitted by the earth's surface and by fog itself.
- Advection
- The predominantly horizontal transport of heat, moisture, or any other atmospheric property solely by mass motions in the atmosphere, in other words, the wind field as shown on a synoptic chart.
- Conduction
- The transfer of heat energy through one or more substances in contact with each other. Heat moves from a higher- to a lower-temperature region.
- Convection
- The process by which heat is vertically mixed by a fluid in motion. In the atmosphere, convection is produced by the mass movement of warmer (lighter) air upwards due to buoyancy.
- Entrainment
- The mixing of drier air into a cloud, typically at its edges. It is produced by turbulent mixing and is enhanced by wind shear at or near the cloud edges.
- Radiation Fog
- Fog generated primarily by nocturnal radiative cooling. It is most common during the early morning hours and during the cool season. Duration of events is typically a few hours although cases lasting several days have been observed. Occasional events that last more than a couple of days include late winter and springtime events in New England and the mid-Atlantic states as well as wintertime events over the western U.S. valleys, the Gulf Coast states, central Europe, and the Po Valley in northern Italy.
- Well-mixed Boundary Layer
- The layer of the atmosphere that is in contact with the surface of the earth, which experiences turbulent mixing through its interaction with the surface. A well-mixed boundary layer will display a relatively uniform potential temperature and mixing ratio through its depth.
Concepts » Introduction » Dynamically Forced Fog
Dynamically forced fog is generated primarily by the cooling of moist near-surface air by dynamic processes. Dynamic processes may include advection and vertical mixing processes that lead to changes in the boundary layer temperature or moisture characteristics.
Perhaps most familiar is advection fog, which is a ground-based cloud caused by the cooling of an air mass to the saturation point as it moves over a colder surface. That surface may be cold ground, snow cover, water, or ice. Advective fog events in the marine environment tend to occur most often where a warm air mass moves over much cooler ocean water. Regions where this is common include:
- Along the west coast of the North and South America and more infrequently along the west coast of Africa during the cool season
- Over the northeast and northwest Atlantic north of the Gulf Stream and over the northwest Pacific north of the Kuroshio Current during the warm season
Another important type of dynamically forced fog occurs when changes to boundary layer depth, moisture, and temperature structure result in boundary layer condensation and marine stratus or fog. The conditions that form marine stratus or fog in these events differ substantially from simple advection although they often occur in the same region. The different conditions also tend to determine whether fog or stratus will develop.
Fog episodes are preconditioned on the synoptic scale, but are manifested predominantly on the mesoscale and microscale, both in time and space. Horizontal variability is often quite large and is dependent on small-scale dynamic and terrain effects. Temporal variations are also frequently high, with the time of dissipation or fog transition into stratus presenting a particularly difficult but critical forecast parameter. Due to the small spatial (less than one km) and temporal (a few minutes) scales of fog variability, operational numerical models have difficulty resolving and predicting these events. As a result, the forecaster must often rely heavily on conceptual models, observational tools, and empirical approaches when dealing with a potential fog situation.
Concepts » Introduction » Dynamically Forced Fog Types
The key ingredient in fog formation along coastal regions and in the maritime environment is cooling of the near-surface air to saturation. Under some circumstances, a large temperature difference between the water surface and the lowest portions of the atmosphere produces this cooling. Under other circumstances, fog and marine stratus form where the temperature difference between the water and overlying air is near zero. Advective fog and steam fog are examples of fogs with a large air-sea temperature difference while typical West Coast fog and marine stratus often occur with only a small air-sea temperature difference.
In order to understand and forecast the different types of dynamically forced fog we must grasp how the boundary layer evolves for each type. In the following section we will examine the fundamental differences in the processes that are associated with advective fog, steam fog and West Coast fog and from a simple conceptual viewpoint address the basic differences in how the boundary layer evolves in each case. Subsequent sections will go into more detail on boundary layer characteristics, and address mesoscale factors and influences such as coastal jets, terrain, and SST anomalies.
In this section, we briefly describe advection, steam, and West Coast fogs in terms of their characteristics, general synoptic conditions, and typical duration and extent. A discussion of the fundamental boundary layer evolution is illustrated through a conceptual animation of a typical skew-T for each type of event.
Concepts » Advection Fog
Concepts » Advection Fog » General Synoptic Conditions
Advection fogs form under synoptic patterns that promote the advection of warm, moist air over cold surface. For example, this figure shows the northward advection of warm air over the Gulf Stream. This scenario frequently results in fog formation due to the cooling of the surface air by the colder water to the north.
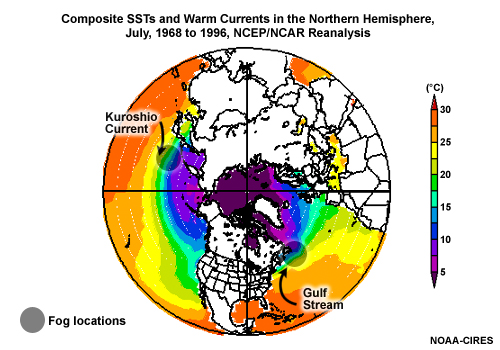
Advective fogs frequently develop over oceanic regions where major ocean currents cause strong SST gradients. Example shown here include the areas north of the Gulf Stream in the North Atlantic and north of the Kuroshio Current in the Northwest Pacific. In these areas, warm northward flowing currents meet cold southward flowing currents. The fog and stratus most often form over the cold-water regions in these areas.
Let's examine in a little more detail one of these regions where maritime influences strongly affect fog and stratus development over both the open ocean as well along adjacent coastal and inland areas. The area we will focus on is over the Northeast U.S. and the Canadian Maritimes. In this area, warm advection passes over strong SST gradients created by the juxtaposition of the warm Gulf Stream next to the cold Labrador Current. This contrast is illustrated here in a typical SST image from the GOES satellite.
Warm advection of moist air over this strong SST gradient produces fog and low stratus through surface cooling. These events are some of the most persistent, expansive, and frequently occurring in the world. Contrary to what we might expect over land, it is not uncommon for marine fog events to occur with winds as high as 30 or 40 knots The presence of a more stable boundary layer and the lack of terrain features in the marine environment are factors that contribute to the ability of fog events to occur in high wind situations. These fog events can occur almost any time of year, but are most frequent and prevalent in the warm season when the Atlantic subtropical ridge strengthens and provides frequent periods of large-scale southerly flow over the region of strong SST gradients. The presence of moderate-to-strong flow also advects the marine fog and stratus over the New England and Canadian Maritime coasts.
A common offshore fog event is shown in the visible imagery. Note its development over the colder SST regions extending from coastal southern New England northeast into the Gulf of Maine and Canadian Maritimes. In this case, a large subtropical high pressure system is anchored over the western Atlantic near Bermuda, as shown in the right panel. Note the much colder temperatures in the large-scale analysis in the area where the fog is occurring.
Concepts » Advection Fog » Frequency, Duration, and Extent
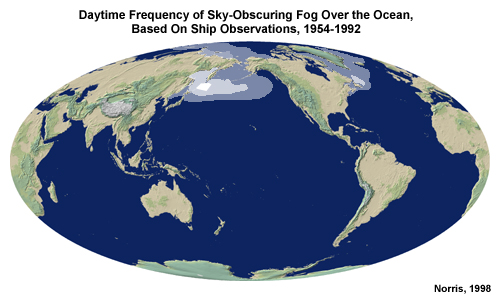
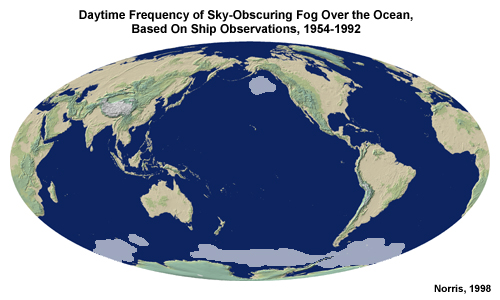
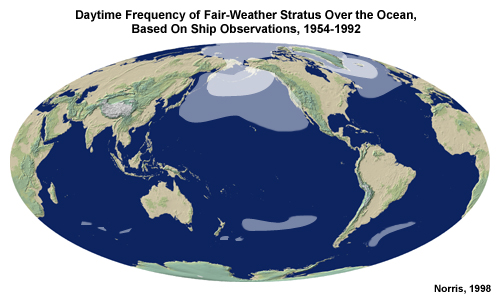
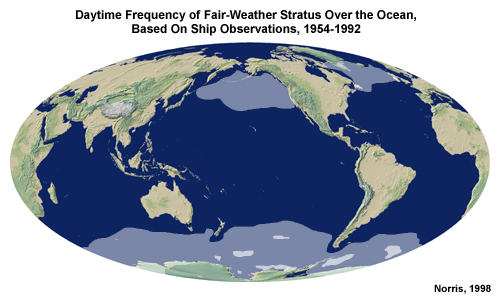
Advection fog events occur most frequently in the warm season when oceanic ridges are persistent. Advection fog or stratus then forms in response to poleward flow around the western periphery of the oceanic ridges. This is especially true if the climatologically favored flow follows long trajectories over a warmer ocean environment before passing over rapidly cooling SSTs. Thus, regions with strong SST gradients characterize high frequency areas of extensive marine fog and stratus. This plot shows the frequency of sky obscuring fog over the world's oceans. Note the high frequency of fog over the northwest Atlantic and northwest Pacific in June-July-August and southwest Atlantic in December-January-February.
Advection fog and stratus events can cover 100s to 1000s of square kilometers and can last anywhere from a couple of days to several days or even a week, depending on the persistence of the supportive synoptic conditions.
Concepts » Advection Fog » Boundary Layer Changes
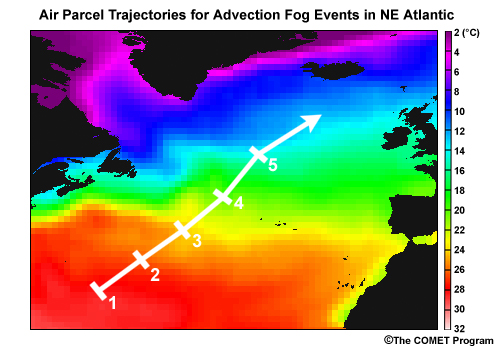
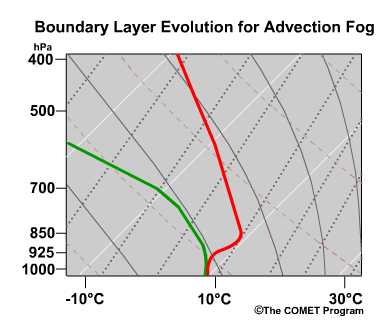
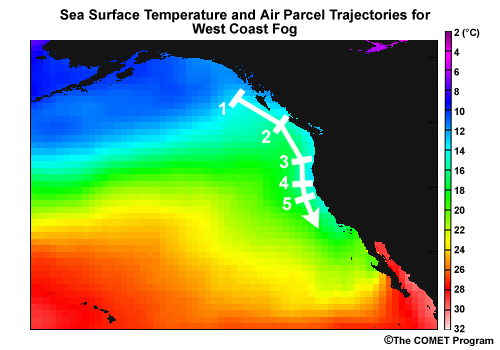
The skew-T sequence shown here is a conceptual example of how the boundary layer of an air parcel evolves over time as it moves over a cooler sea surface environment. A hypothetical air parcel trajectory is shown on the map by the white line. The numbers indicate the location of the air parcel for each stage below.
For the typical case of advection fog, the temperature profile of the lower boundary layer changes significantly as the air parcel moves over the cooler surface. Note how the boundary layer progressively approaches saturation as the air parcel tracks over the cooler SSTs.
The conceptual skew-T diagram illustrates in a simple way how saturation is achieved in the marine environment as a result of boundary layer cooling, even in the absence of moisture advection. Of course, positive moisture advection will only enhance the probability of saturation and fog.
Stage 1
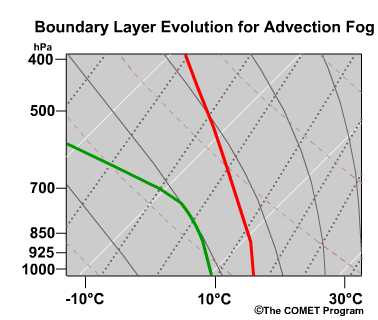
- Over warmer ocean waters, BL may be neutral or even slightly unstable
- Drier conditions exist aloft
Stage 2
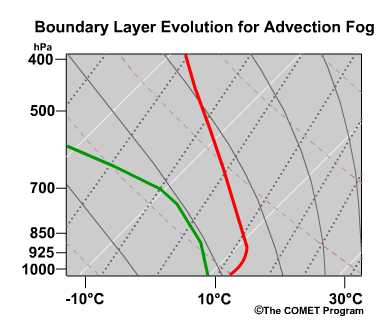
- Parcel moves over cooler SSTs
- Lower BL begins to cool
- Weak surface-based inversion develops
Stage 3
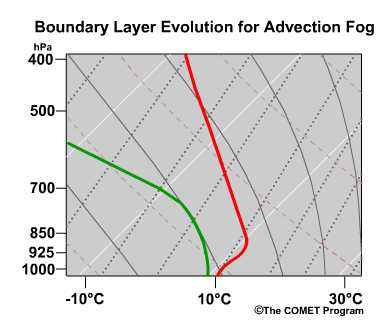
- Continued cooling of lower BL
- Lower BL RH increases due to cooling
- Inversion strengthens
Stage 4
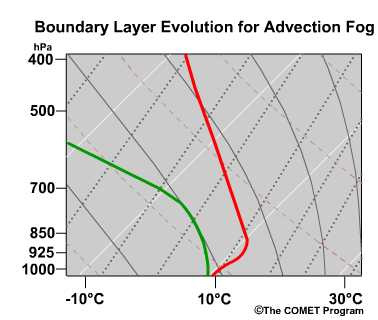
- Temperature approaches dewpoint in lower BL
- Saturation begins near the surface
- Inversion strengthens further
- Fog formation may begin
Stage 5
- Saturated layer becomes deeper
- Growth of fog layer occurs
- Radiative cooling occurs at fog top, deepening the fog layer
Concepts » Advection Fog » Key Point
Key Point:
For advection fog, the temperature of the underlying
surface (SST) must be less than the air parcel's initial dewpoint temperature in order to
achieve saturation. Saturation is achieved primarily through cooling with little change in
the dewpoint profile.
The exception to this general rule occurs when the air parcel moistens along its trajectory. Under those circumstances, less cooling is required to reach saturation, allowing for a warmer SST.
Concepts » Advection Fog »
Question 1
The primary process that leads to saturation of the boundary layer in many marine advection fog events is _____. Choose the best answer.
The correct answer is c).
Many advection fog events are a result of cooling of the BL air. Saturation often occurs without any moisture advection into the environment. Recall the conceptual skew-T evolution for advection fog where it is the temperature profile that shifts toward the dewpoint profile within the boundary layer.
Concepts » Advection Fog »
Question 2
In the absence of moisture advection, what conditions are necessary in order for boundary layer saturation to occur in a potential advection fog scenario? Choose all that apply.
The correct answers are b), d), and e).
In order for fog to form in an advection fog scenario without moisture advection, the SST over which the air is being advected must be lower than the air parcel dew point. Otherwise cooling will not reach the dewpoint and saturation will not occur. In order for the boundary layer to saturate it must become stably stratified so that deep mixing does not prevent saturation of the layer. In order for this to happen the layer must be capped by an inversion.
Concepts » Advection Fog »
Question 3
Which of the following features help promote marine advective fog or stratus development? Choose all that apply.
The correct answers are a), b), d), and e).
The combination of warm ocean currents flowing toward the poles and cold ocean currents flowing toward the equator leads to strong SST gradients where the currents meet. When Surface winds flow across strong, warm-to-cold SST gradients, the boundary layer cools rapidly. This cooling provides one key ingredient for the formation of advection fog. In a similar fashion, cold SST anomalies or cold pools also promote boundary layer cooling and fog formation.
Concepts » Advection Fog »
Question 4
Select the correct words to complete the sentence.
The correct answers are shown above.
The subtropical ridges that drive marine advection fog events are persistent synoptic features, leading to long duration events. The ridges strengthen in the warm season, as do SST gradients, which leads to more frequent marine advection fog at that time.
Concepts » West Coast Fog
Concepts » West Coast Fog » Introduction
Fog and marine stratus events along the west coasts of continents result from a highly complex process. The development, day-to-day variations, and spatial distribution of west coast fog depend on small changes in the boundary layer, which lead to either clear or cloudy conditions.
Some researchers have classified these fogs as advection fog because they occur over a relatively cool ocean surface. However, surface cooling is typically absent to any appreciable degree. Thus, other processes are required for fog or stratus formation.
Concepts » West Coast Fog » Synoptic Setting
West Coast-type fogs or stratus events are generally located in areas dominated by oceanic subtropical high pressure systems. Note the positions and movements of the subtropical highs positioned off the west coasts of the U.S., South America, and southern Africa. Fog events persistently occur in these areas.
The graphic shown here illustrates a typical synoptic pattern associated with a West Coast fog/stratus event. Note the large high pressure pattern and the air parcel trajectories associated with the flow around the high.
The trajectories associated with West Coast fog events differ from those associated with advection fog events in a profound way. Along the west coasts of continents the air flows toward the equator. Flow associated with advection fog events typically flows toward the poles. Thus, along the west coasts, air typically moves over progressively warmer water, while marine advection fog events are triggered by flow over progressively colder water.
Concepts » West Coast Fog » Boundary Layer Changes
So how does fog form along west coasts? The long trajectory of air parcels over coastal waters allows modification to occur in conjunction with the large-scale subsidence. Gradual cooling and moistening of the near-surface air can occur with a sufficiently long fetch over water. To learn more about these processes see the brief review on Moistening of the Marine Boundary Layer
The development of a capped boundary layer is another critical factor in the development of West Coast fog or stratus events. The cap results from subsidence associated with the large high pressure environment. This restricts vertical mixing and thereby allows the boundary layer to approach saturation. With a moist, well-mixed boundary layer, saturation is reached with only modest cooling. Next we will look at how that occurs.
Stage 1
- Weak capping inversion exists
- Air temperature > SST
- Surface heat and moisture fluxes exist
Stage 2
- Capping inversion strengthens
- Well-mixed boundary layer develops
- Surface fluxes negligible
Stage 3
- Well-mixed boundary layer exists
- Moderate-to-strong capping inversion
- Surface fluxes negligible
- Boundary layer near, but not at, saturation
Stage 4
- Boundary layer depth increases by lifting, caused by weak disturbance
- Lifting promotes cooling of layer and saturation near base of inversion
- Stratus formation occurs near base of inversion
- Stratus formation can be sudden
Stage 5
- Cloud-top cooling occurs
- Stratus lowering process begins in response to cloud-top radiative cooling
- Depth of saturated portion of boundary layer increases
- Saturation of entire boundary layer results in fog at the surface
Stage 6
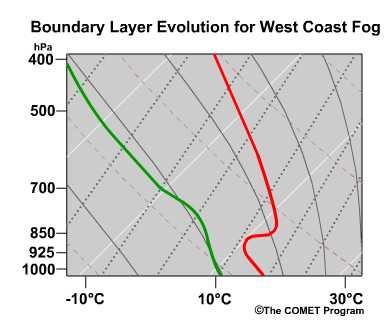
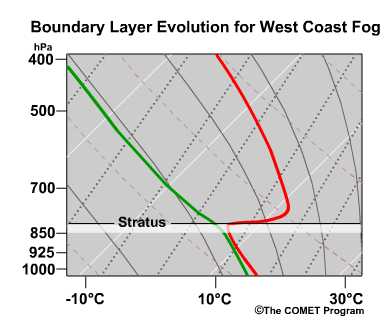
The skew-T sequence shown here is a conceptual example of how the boundary layer evolves over time as it follows a trajectory similar to the one shown by the white line on the map. The numbers indicate the location of an air parcel for each stage in the animation.
Initially, a capping inversion prevents mixing of the boundary layer with the free atmosphere. This inversion allows the underlying air to slowly cool and become moister due to heat and moisture exchange with the underlying ocean.
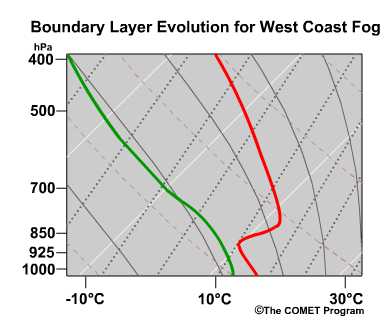
With a moderate to strong capping inversion, a well-mixed marine boundary layer develops in response to moisture and heat fluxes at the surface. The resulting mixed layer is near, but not at saturation. Eventually, the boundary layer reaches equilibrium with the sea surface and the exchange of heat and moisture becomes negligible.
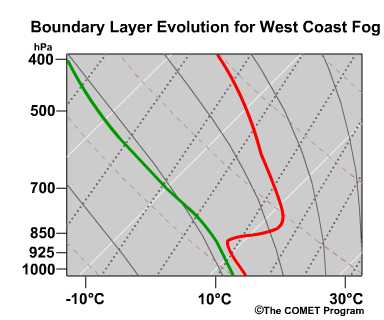
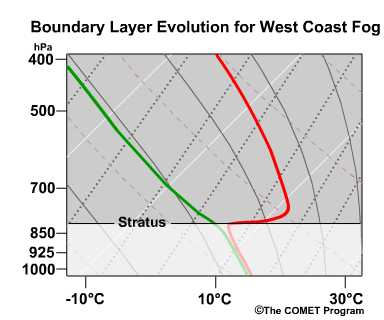
In the next stage, the depth of the mixed layer increases in response to a weak disturbance. A disturbance in the midlevels of the atmosphere will provide added lift in the atmosphere that will often have the effect of increasing the depth of the boundary layer. When this occurs, saturation begins near the inversion base as the layer is lifted and cooled while the dewpoint remains unchanged. This process results in formation of a stratus deck whose onset can be sudden and extend over a large area. However, the presence of a strong disturbance can provide too much lift and mixing, resulting in a boundary layer that is too deep and too unstable to saturate.
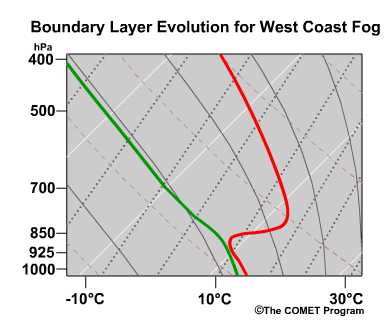
Finally, cloud-top cooling of the stratus thickens the saturated portion of the boundary layer, lowering the base of the stratus. Eventual saturation of entire layer results in fog at the surface.
Review of Fog-Top
Radiative Cooling
Review of Moistening of the
Marine Boundary Layer
Concepts » West Coast Fog » Key Point
Key Point:
During the West Coast fog process, both the temperature and
dewpoint profiles will cool/moisten in the initial stages once a capping inversion is
formed, but will then change little once equilibrium is reached. Further cooling will be
noted near the inversion base in conjunction with an increase in the inversion height.
Concepts » West Coast Fog » Upwelling and Fog Formation
In the previous section, we examined how subsidence combined with a long trajectory across water leads to a moist, well-mixed boundary layer capped by a strong inversion. Stratus or fog formation then requires cooling to saturate some portion of the boundary layer. As we have discussed, lifting of the capping inversion can cool the top of the boundary layer, leading to stratus formation. We can eventually achieve fog at the surface with sufficient stratus lowering.
Another way to generate fog would be to cool the lower parts of the boundary layer. However, after a long trajectory over water, surface fluxes of heat and moisture drop to negligible levels. In addition, flow from higher to lower latitudes typically leads to warmer sea surface temperatures. Upwelling can change that.
During upwelling, low-level winds push surface water offshore. Deeper, colder ocean water rises to the surface to replace it. Thus, air parcels moving down the coast may encounter cooler sea surface temperatures. Upwelling regions can enhance the occurrence of West Coast-type fog and marine stratus events by cooling the lower boundary layer, bringing it to or saturation, or close to it.
This map shows those areas around the globe where coastal upwelling occurs. These regions commonly coincide with areas of frequent fog. Thus, just as with advection fogs, the forecaster should closely monitor sea surface temperatures when conditions appear favorable for fog.
Concepts » West Coast Fog » Frequency, Duration, and Extent
West Coast-type fog and stratus events can occur most any time of the year. However, distinct variations in the climatology of West Coast fog occur depending upon the location of the recording station.
The available climatological data from cities along the U.S. West Coast show a distinct maximum in the autumn. As this plot shows, monthly frequencies of fog at inland stations near the coast begin to rise sharply by August, with a subsequent sharp decline beginning in the early winter months. However, most of these reporting stations are located away from the coast and do not record conditions in the marine environment.
Along the U.S. West Coast and over the coastal ocean, stratus/fog and low stratus are typically most prevalent in June-July-August along the central and northern California coast. There are numerous along-coast variations due to mesoscale effects, particularly close to shore.
South of Point Conception in southern California most dense fogs occur in winter, from September through March, while most low ceilings occur in summer, from June through September. This pattern results from warm southerly ocean currents that inhibit the stratus-lowering process during the warm season in that area..
These observations of the climatology reveal how important it is to have an knowledge of local conditions and an understanding of synoptic circulations. For a given station the climatological data can help in fog forecasting for a specific site. However, generalizing those observations over a broad region is a risky endeavor.
Warm season fog and low stratus events along the U.S. West Coast exhibit a distinct diurnal cycle, with a maximum in low ceiling occurrences during the early-to-midmorning hours and a minimum during the late afternoon.
The extent of these events can vary widely from case to case. Some events will occur over small areas in the coastal zone with local and mesoscale influences controlling the extent and duration. In other cases, stratus can appear over vast areas of the ocean and adjacent coastal zone over a very short period of time.
Concepts » West Coast Fog »
Question 5
What are the key features in West Coast fog and stratus events? Choose all that apply.
Correct answers are a) and e).
A capping inversion is necessary to allow the boundary layer to become cool and moist in the early stages of a West Coast fog/stratus event. Without the capping inversion the boundary layer is not able to become preconditioned for fog or stratus. The capping inversion is typically a result of the subsidence associated with the large-scale oceanic high pressure environment.
Concepts » West Coast Fog »
Question 6
Surface fluxes are important throughout the West Coast fog and stratus development process and ultimately are the primary cause of its development. Choose the best answer.
The correct answer is False.
Surface fluxes play some role early in the boundary evolution but become negligible once the layer reaches equilibrium. The equilibrium or well-mixed layer is often insufficient to produce fog or stratus, and it takes a lifting mechanism, such as a weak disturbance, to cause the additional cooling necessary for saturation.
Concepts » Steam Fog
Concepts » Steam Fog » Introduction
This type of fog is known by several names including "sea smoke," "evaporation fog," and "steam fog." No matter what its label, the processes that control its formation, maintenance, and dissipation are similar and tend to occur in a shallow layer within the boundary layer.
Typically when air parcel trajectories move over progressively warmer waters, any existing fog or stratus will tend to dissipate. However, there are several higher latitude oceanic environments around the globe where fog will form when the water temperature is significantly warmer than the air being advected over it. Regions where this type of fog occurs include southwest Alaska, the Canadian Maritime Provinces, and northeast Asia.
These fogs also occur over much of the Great Lakes and smaller water bodies during arctic outbreaks. They also occur even at lower latitudes mostly in the autumn and early winter when cold dry air masses move over waters that are still warm. This creates the large water/air temperature contrast necessary to form this type of fog.
Concepts » Steam Fog » Synoptic Conditions
The graphic shows a typical synoptic pattern favorable for steam fog development. Cold, dry continental-polar air flows over water surfaces that are generally 10 to 12°C warmer.
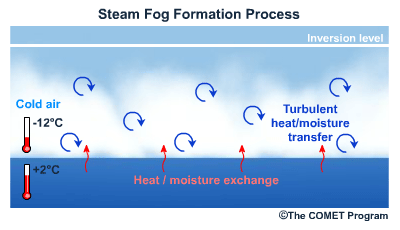
Steam fogs occur when intensely cold, dry air advects rapidly over the warmer water surface absorbing heat and evaporating moisture from the water surface by conductive, convective, and turbulent transfer processes. Heat transfer from the water causes convective turbulent eddies. Water vapor condenses as it mixes into the much colder air. Fog forms in vertical columns or patches because of significant convective turbulence resulting from the warm and moist underlying surface. These fogs can become extensive and thick, especially if the mixed layer is capped by an inversion and becomes saturated.
Steam fog often occurs even in the presence of strong surface winds. The strong turbulence actually increases the heat and moisture exchange between the atmosphere and the sea surface.
However, steam fog also occurs under conditions where the boundary layer is not very turbulent, but the air and sea surface temperatures differ by a large amount. Under such conditions, a shallow surface-based inversion exists which caps the saturated layer below. In these cases the fog will be very shallow, usually on the order of a few meters to several tens of meters thick.
Concepts » Steam Fog » Boundary Layer Changes
The presence of cold air over warm water stimulates large transfers of sensible and latent heat from water to air. Vapor pressure at the water surface is much higher than that of the cold air creating a strong vapor pressure gradient that promotes rapid transfer of vapor from water to air. During cold outbreaks, this transfer occurs so rapidly that saturation is reached before there is any significant moderation in the air temperature.
The skew-T sequence shown here is a conceptual example of how the boundary layer of an air parcel evolves over time as the air parcel trajectory takes it from over the dry cold landmass to the ocean as depicted by the white lines on the map. The numbers indicate the location of the air parcel for each stopping point (stage).
Stage 1
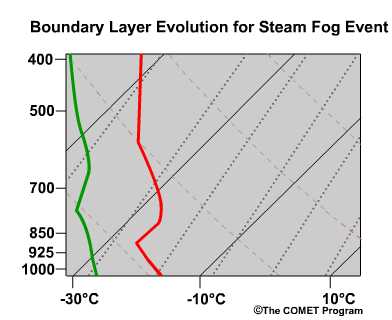
- Very cold dry air mass
- Boundary layer is well mixed
- Elevated inversion may exist
- Flow from land toward ocean
Stage 2
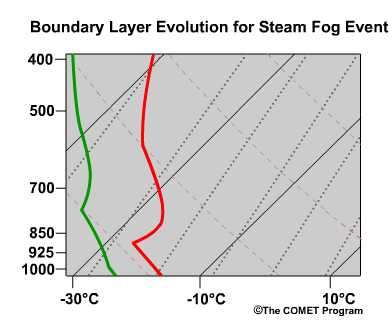
- Air parcel immediately over coast
- Little change in temperature profile
- Vapor pressure gradient increases
- Moistening in lowest layer
Stage 3
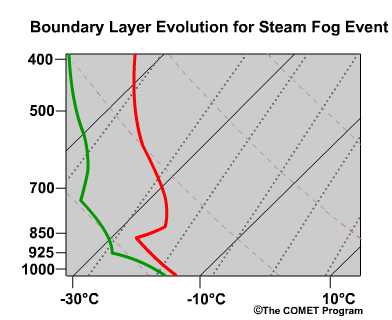
- Air parcel just offshore
- Strong vapor pressure gradient
- Rapid moistening of lowest layer
- Lower BL somewhat unstable
Stage 4
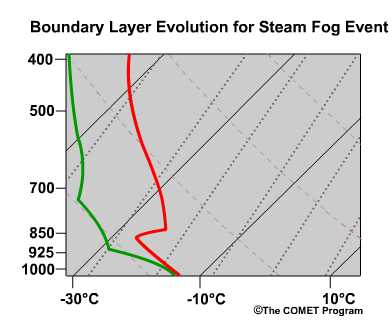
- Air parcel offshore
- Saturation in lower BL
- Steam fog formation
- BL remains unstable
- Possibly capped by elevated inversion
Concepts » Steam Fog » Key Point
Key Point:
For steam fog formation it is necessary for rapid
saturation (increasing dewpoint at and near the surface) to occur without any significant
air temperature change (little change in the temperature profile).
Concepts » Steam Fog » Frequency, Duration, and Extent
Over the marine environment steam fog tends to occur primarily during the winter when cold and dry arctic air masses descend southward with minimal warming. At the same time, sea surface temperatures remain relatively warm, i.e., above freezing. This leads to a significant air/sea temperature differential during arctic outbreaks.
At lower latitudes and over inland water bodies such as small lakes, steam fog occurs most often in the late fall and early winter when the difference between lake and air temperatures is greatest. Later in winter, the lake may freeze or become cold enough to reduce the lake/air temperature difference, thereby reducing the potential for steam fog development. Steam fog over small lakes and other small water bodies often occurs under calm conditions and is typically very shallow.
Many events occur in the post-cold front environment and are short-lived, although some can persist for a week or more. Persistence of larger scale events of sea smoke or steam fog require the steady advection of cold, dry air over the warm water because this helps maintain the large air-sea temperature differential. As soon as the advection abates, the air-sea temperature differential decreases due to mixing and heat/moisture exchange and the fog rapidly dissipates. The fog will also dissipate as it moves over land or ice cover.
The extent of steam fog events will vary considerably from region to region. In the marine environment steam fog, though often shallow, can cover very large areas and it can be a significant hindrance to maritime operations. Due to the turbulent environment steam fog forms in, visibilities can vary substantially on both temporal and spatial scales. In addition to restricted visibility, significant icing on ship structures and antennae can occur. The restricted visibility and icing hazards make planning for operations within this environment very difficult.
Concepts » Steam Fog »
Question 7
What factors are necessary for the formation of steam fog? Choose all that apply.
Correct answers are b), c), and e).
Rapid moisture flux into the boundary layer is necessary, and this results from large water/air temperature differences and a strong vapor pressure gradient between very cold dry air and the water surface. Rapid moistening must be accomplished prior to significant air temperature modification. Recall that it is the dewpoint profile that shifts toward the temperature profile in the conceptual skew-T model for steam fog events.
Concepts » Steam Fog »
Question 8
Boundary layer conditions often associated with steam fog events include which of the following? Choose all that apply.
Correct answers are a), d), e), and g).
Steam fog events require a strong vapor pressure gradient. This occurs when relatively cold, dry air flows across warm water. The rapid moistening that results from the strong vapor pressure gradient leads to unstable conditions in the boundary layer. Turbulence enhances the rapid moistening of the boundary layer, further promoting steam fog formation.
Concepts » Questions
Concepts » Questions »
Question 9
Air trajectories associated with West Coast fog events are typically _____ while air trajectories associated with advection fog events are typically _____. Choose the best answer.
The correct answer is b).
Advection fog forms in response to cooling of the MBL due to cooler SSTs, which typically lie at higher latitudes. Thus, marine advection fog typically forms in response to poleward flow. Conversely, West Coast fog forms with little cooling, but with long trajectories over cool water, which leads to a cool, moist boundary layer capped by a strong inversion. This happens most commonly with flow toward the equator along the west coasts of continents.
Concepts » Questions »
Question 10
The influence of a weak disturbance increasing the inversion height and the process of stratus lowering are features most often associated with which type of marine fog events? Choose the best answer.
The correct answer is c).
West Coast fog frequently forms when a cool, moist boundary layer, near saturation, is perturbed by a small disturbance. A relaxation of the subsidence allows the capping inversion to rise. In response, the top of the boundary layer cools adiabatically. Radiative cloud-top cooling results in stratus lowering and fog at the surface. Advection fog forms in response to surface-based cooling, while steam fog forms in response to rapid surface-based moistening.
Concepts » Questions »
Question 11
Many warm season marine fog events occur under the influence of which of the following large-scale meteorological features? Choose the best answer.
The correct answer is a).
The subsidence associated with subtropcial oceanic ridges typically results in an inversion capping the marine boundary layer. This inversion inhibits mixing of the boundary layer with the free atmosphere, which allows saturation and fog formation.
Concepts » Questions »
Question 12
Each of the hypothetical soundings shown here depicts boundary layer conditions associated with a different type of marine fog or stratus event.
Use the pull-down menu to choose the best answer.
The correct answers are highlighted above.
Sounding A shows an unstable BL with cold, dry air aloft, indicating a steam fog event. Sounding B shows a cool, well-mixed BL capped by a strong inversion, characteristic of West Coast fog. Sounding C indicates surface-based cooling, and thus advection fog.
Examples
At the end of this section you should be able to do the following things:
- Describe the differences in boundary layer characteristics and evolution for advection, West Coast, and steam fog in a marine environment
- Describe the differences in synoptic environments for advection, West Coast, and steam fog in a marine environment
- Describe the relationship of sea surface temperature to fog formation for advection, West Coast, and steam fog in a marine environment
Examples » Advection Fog Example
Examples » Advection Fog Example » Introduction
The following example shows how advection fog over the marine environment generally forms in warm moist air that is cooled to saturation as it moves over colder water. This example takes place over the northern Atlantic during 07 to 09 April 2004. In similar cases the trajectory of an air mass is an important factor in fog formation. This was illustrated in the previous section.
Examples » Advection Fog Example » Trajectory and SST Considerations
Question 13
This loop shows wind, temperature, and MSLP over the North Atlantic for 6 - 7 April 2004.
What factors are likely to play a role in fog formation? Choose all that apply.
The correct answers are b) and d).
In this case we see that a strong pressure gradient over the central Atlantic around the western periphery of a high pressure system. This causes strong surface winds that advect warmer air rapidly northward. These winds are oriented nearly perpendicular to isotherms, which results in rapid cooling of the advected air. The rate of temperature decrease depends on both the spacing of the isotherms and the velocity of the air perpendicular to those isotherms.
Generally, in poleward-moving air masses or in air masses that have previously traversed a warm ocean current, the dewpoint of the air is initially higher than the water temperature at higher latitudes. Fog will form given a sufficient fetch over both warm and cold water along with supportive boundary layer mixing and turbulence.
In addition, the high pressure in the northeast Atlantic results in subsidence, which promotes fog formation by restricting mixing between the boundary layer and the free atmosphere.
Examples » Advection Fog Example » Key Point
Key Point:
Large-scale high pressure is typically the dominant
synoptic-scale feature that drives air parcel trajectories. In an advection marine fog or
stratus event, air parcels typically move from south to north, or from warmer to colder
water.
Examples » Advection Fog Example » Air Parcel Trajectory
Question 14
It is typically not enough for the flow to come from a southerly direction to produce fog and stratus. This plot shows sea surface temperatures along with a trajectory for the 48 hour period from 1200 UTC on 06 April to 1200 UTC on 08 April.
What the sea surface temperature at each point? (Enter your responses and select Done.)
The correct answers are a) 20°C, b) 18°C, c) 13°C, d) 5°C, and e) 9°C
Note how the path takes the air parcels over progressively colder waters, especially just north of 40°N where SSTs drop from about 18°C to about 8° over a distance of only a few hundred nautical miles. This strong SST gradient coincides with where the low stratus and fog begin to appear.
For fog to form, the trajectories of the air parcels must be such that they track over progressively colder water surfaces. Moreover, the air parcels must have initial dewpoints that exceed the coolest sea surface temperatures along their trajectory. If the dewpoint of the air mass is initially higher than the coldest water to be crossed, and if the cooling process continues long enough, the temperature of the air ultimately falls to the dewpoint, resulting in saturation and fog formation. However, if the initial dewpoint is less than the coldest water temperature, saturation will not be reached and fog formation is unlikely.
Examples » Advection Fog Example » Boundary Layer Changes
Let's examine model forecast soundings for several points along the trajectory. This will allow us to follow changes to the boundary layer as it moves northwestward around the periphery of the large-scale high pressure system anchored over the east central Atlantic.
Question 15
The skew-T shown here is for point 1 at 1200 UTC on 06 April. How would you characterize the boundary layer? Choose the best answer.
The correct answer is d).
Note the well-mixed boundary layer is fairly moist but not at saturation. Also note the dewpoint of 14 to 15°C, which is well below the sea surface and surface air temperatures, which sit at about 18 °C. Although the boundary layer is unsaturated, its moist and warm character will set the stage for advection fog and marine stratus formation as it subsequently advects over a cooler surface.
Examples » Advection Fog Example » Boundary Layer: 0000 UTC on 7 April 2004
Question 16
Looking 12 hours later at point 2, approximately 360 nm farther north along the parcel trajectory, how has the boundary layer changed?
Use the pull-down menu to choose the best answer.
The correct answers are highlighted above.
The temperature has dropped to about 15°C, while the dewpoint has fallen slightly as well, to about 13°C. So now we have boundary layer with only about a 2 to 3°C dewpoint depression and SSTs are running about 15 to 16°C.
The boundary layer is still fairly moist and well-mixed and has deepened a bit. Note that the boundary layer is capped by a slightly less mixed and drier layer, which is a condition often found with marine stratus and fog development. However, there has not been quite enough cooling for fog to develop yet.
Examples » Advection Fog Example » Boundary Layer: 1200 UTC on 7 April 2004
Question 17
Twelve hours later at point 3, some 400 nm north of point 2. What features do you see in the sounding?
Use the pull-down menu to choose the best answer.
The correct answers are highlighted above.
This sounding indicates that the upper boundary layer is saturated while the lower boundary layer is not. The boundary layer is capped by an isothermal layer from about 800 to 900 hPa that forms the base of a deep dry layer. Thus, the sounding indicates the presence of a low-level stratus deck.
Question 18
What influences do you think are preventing fog development and have resulted in stratus instead? Choose the best answer.
The correct answer is c).
Based on the strong surface winds of 25 to 30 knots, it is likely that there is considerable turbulent mixing going on within the boundary layer. This has resulted in the lower boundary remaining too well mixed for it to saturate, and has kept the saturated layer elevated.
The weak isothermal layer above the saturated layer supports the idea of stratus and may be the start of a capping inversion. The SSTs over this area have dropped considerably to about 10°. Both the dewpoint and temperature are above this value, which suggests both strong warm advection must be occurring and considerable heat exchange must also be taking place within the lower boundary layer. This MODIS image confirms the presence of stratus over the region surrounding point 3.
Examples » Advection Fog Example » Boundary Layer: 0000 UTC on 8 April 2004
Question 19
Air parcels continue to advect northward to point 4 on the trajectory.
At this time, what condition is indicated? Choose the best answer.
The correct answer is a) Fog.
The sounding shows that the boundary entire boundary layer has become saturated despite continued strong winds and turbulence. There is also a weak inversion capping the saturated layer above 900 hPa.
Question 20
Note that the boundary layer is about 100 hPa thick, slightly less than at point 3 and considerably less than at point 2. Which of these factors is most responsible for the thinning boundary layer? Choose the best answer.
The correct answer is c).
The shallower boundary layer most likely results from large-scale subsidence caused by the large oceanic ridge to the southeast. This subsidence can contribute to the saturation of the boundary layer by decreasing the extent of vertical mixing of moisture. For a given flux of moisture into the boundary layer, a more shallow boundary layer can reach saturation more easily. The GFS model cross section of vertical velocity and humidity shows weak subsidence near point 4 and a shallow moist layer coinciding nicely with expectations and observations.
Examples » Advection Fog Example » Observations: 0000 UTC on 08 April 2004
Ship observations support the presence of fog with a visibility of 0.6 nm reported at 0000 UTC. Note however, that during the daylight hours some heating occurs, but the low visibilities persist. If we had dewpoint reports they would probably show those values remaining above the water temperatures and possibly increasing due to the moist southerly flow and upstream higher dewpoints. This is what is likely maintaining a saturated condition.
| ID | UTC | Lat | Long | Dist | hdg | wdr | wspd | press | ptdy | atmp | wtmp | vis |
|---|---|---|---|---|---|---|---|---|---|---|---|---|
| SLCI | 00 | 55.9 | -36.9 | 131 | 331 | 180 | 11.1 | 30.34 | +0.00 | 44.6 | 44.6 | 0.6 |
| SLCI | 06 | 55.2 | -38.6 | 144 | 301 | 160 | 24.1 | 30.24 | -0.07 | 48.4 | 44.2 | 0.1 |
| SLCI | 12 | 54.5 | -40.2 | 140 | 17.1 | --- | --- | 30.11 | -0.06 | 46.4 | 42.8 | 1.2 |
| SLCI | 18 | 53.7 | -41.6 | 140 | 29.9 | --- | --- | 30.03 | -0.04 | 47.8 | 43.3 | 0.6 |
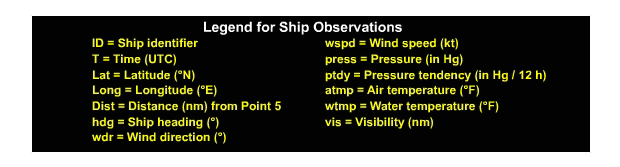
Legend for Ship Observations
- ID = Ship identifier
- T = Time (UTC)
- Lat = Latitude (°N)
- Long = Longitude (°E)
- Dist = Distance (nm) from Point 5
- hdg = Ship heading (°)
- wdr = Wind direction (°))
- wspd = Wind speed (kt)
- press = Pressure (in Hg)
- ptdy = Pressure tendency (in Hg/12 h)
- atmp = Air temperature (°F)
- wtmp = Water temperature (°F)
- vis = Visibility (nm)
Visible satellite imagery from METEOSAT from 1700 UTC the previous evening shows point 4 in the thick of a large and extensive low stratus/fog region.
Examples » Advection Fog Example » Boundary Layer: 1200 UTC on 08 April 2004
Question 21
What condition does the model skew-T for 1200 UTC on 8 April indicate? Choose the best answer.
The correct answer is b) Stratus.
The model skew-T for 1200 UTC on 08 April shows a slightly elevated saturated layer with unsaturated conditions at the surface, again suggesting the presence of stratus rather than fog. The strong westerly winds of 30 knots or so are probably keeping the stratus deck off the surface. Note how the capping inversion has become established with drier air remaining aloft.
Ship reports verify the presence of stratus versus fog with visibilities ranging from 2.5 to 6.2 nm in the region. Also note at 1200 and 1800 UTC ships UIDS and OXYH report air temperatures significantly warmer than the water temperatures. This is probably the result of a combination of daytime heating and warm advection. In this scenario the fog lifts to stratus during the day and will likely lower to fog again in the evening provided conditions do not change significantly.
| ID | T | Lat | Long | Dist | hdg | wdr | wspd | press | ptdy | atmp | wtmp | vis |
|---|---|---|---|---|---|---|---|---|---|---|---|---|
| UIDS | 12 | 61.0 | -28.40 | 76 | 38 | 240 | 25.0 | 30.05 | -0.02 | 48.9 | 44.1 | 2.5 |
| OXYH | 18 | 60.1 | -28.50 | 45 | 82 | 240 | 24.1 | 30.24 | -0.00 | 47.3 | 45.1 | 2.5 |
| UIAI | 18 | 61.2 | -28.50 | 84 | 31 | 240 | 38.9 | 30.01 | +0.04 | 42.8 | 41.9 | 6.2 |
Legend for Ship Observations
- ID = Ship identifier
- T = Time (UTC)
- Lat = Latitude (°N)
- Long = Longitude (°E)
- Dist = Distance (nm) from Point 5
- hdg = Ship heading (°)
- wdr = Wind direction (°))
- wspd = Wind speed (kt)
- press = Pressure (in Hg)
- ptdy = Pressure tendency (in Hg/12 h)
- atmp = Air temperature (°F)
- wtmp = Water temperature (°F)
- vis = Visibility (nm)
Examples » Advection Fog Example » Summary
In review, the critical processes for advection fog are as follows:
- Synoptic-scale high pressure drives air parcel trajectories toward higher latitudes, from warmer to colder water.
- Large-scale subsidence aloft inhibits mixing of atmosphere above the boundary layer.
- Surface air temperature decreases due to heat loss to the ocean as air parcels move over colder water
- Saturation occurs when the air temperature and dewpoint fall to the sea surface temperature.
- The saturated layer may be elevated due to strong turbulent mixing within the boundary layer. Turbulence may arise from strong winds that occur in response to strong pressure gradients along the periphery of oceanic high pressure systems.
- A relatively shallow boundary layer is preferred for fog development. Otherwise, mixing may occur over too deep a layer for fog to occur, leading to stratus instead.
- Boundary layer changes due to even limited diurnal heating through the fog/stratus layer may be sufficient to lift or dissipate fog to a stratus layer.
- The difference between advection fog or stratus development depends upon small changes in the amount of turbulent mixing within the boundary layer. This creates challenges to the forecaster as relatively small changes (even those induced by diurnal heating) can be enough to cause fog instead of stratus and such minor changes are often not readily apparent in model forecast products.
- Based on this discussion, the critical factors to monitor when forecasting marine
advection stratus and fog are as follows.
- A moist boundary layer
- Cooling of the surface temperature due to passage over colder water
- Large-scale subsidence aloft
Examples » West Coast Fog Example
Examples » West Coast Fog Example » Introduction
The following example depicts the typical evolution of the boundary layer along the U.S. West Coast that commonly leads to the dynamic development of fog and marine stratus. This is not the only scenario by which the boundary layer can achieve saturation, but it is a rather common one.
In this case fog and stratus developed rapidly along the California Coast over a 24-hour period from 11 March to 12 March 2004.
To assess the potential of fog and marine stratus the forecaster must consider the following parameters to get a clear picture of the sometimes subtle boundary layer changes that can cause a fog or stratus event. These include the following:
- Air parcel trajectories
- Temperature and humidity changes
- Boundary layer depth changes
Examples » West Coast Fog Example » Trajectories
Question 22
Let's start this case by characterizing air parcel trajectories. The figure above shows the visible satellite image for 0000 UTC 11 March along with the 925 hPa streamlines. How would you characterize conditions along the West Coast? Use the pull-down menu to choose the best answer.
The correct answers are highlighted above.
Notice that conditions over the Eastern Pacific are generally clear and characterized by offshore flow.
Question 23
Examining the same products 24 hours later, how would you characterize conditions along the West Coast? Use the pull-down menu to choose the best answer.
The correct answers are highlighted above.
At this time, we see an extensive area of marine fog/stratus along the coast from north of San Francisco down down to Mexico, with some clear areas embedded. The low-level flow has changed from offshore to along the coast from the northwest.
Examples » West Coast Fog Example » Heat and Moisture Fluxes
The question is what changes have occurred to cause the development of fog in this region? We will focus on a point just out from the Monterey Bay at 36.4°N/125.0°W where marine fog/stratus developed over this 24 hour period.
Clearly the low-level flow direction has changed from originating over land to originating over the water. In fact, if trajectories of the air reaching 36.4°N / 123.6°W are considered, the clear conditions off Monterey on March 11 are associated with air that started inland over eastern Oregon 24 hours earlier.
On March 12, the air reaching this same point off Monterey originated over western Oregon. It then moved offshore just north of California and followed the coast down to Monterey. This results in an much longer trajectory over water compared to the previous day.
So why does the fog form? Both trajectories start out rather dry and warm. To form fog, we need to cool and moisten the air along its trajectory. How does that occur?
On March 11, the offshore flow that passes over Monterey moistens and cools as it moves southward. This leads to the development of stratus cumulus clouds (associated with positive surface fluxes) as opposed to stratus or fog. However, it must travel 500 km or more offshore before it reaches saturation. In this plot, note the clouds well offshore downstream of Monterey.
Thus we can infer that after some initial near-coast cooling, surface fluxes of heat and moisture both tend to be upward as the air moves southward towards warmer sea surface temperatures.
How does this compare to the next day? On March 12, the air moves offshore from Oregon then down the coast about 400 - 500 km.
Question 24
This plot shows the sea surface temperatures off of California for 12 March. Based on this plot, would you expect strong cooling of the marine boundary layer as a parcel travels along the trajectory shown?? Choose the best answer.
The correct answer is b) No.
This down-coast trajectory tends to cross over only a very weak SST gradient. The same initial cooling takes place as the air moves offshore from Oregon. However, we expect little surface cooling as the air moves south along the coast. In fact, sea surface temperatures warm slightly to the south. Therefore, surface cooling cannot explain the formation of fog and stratus. In order to bring the boundary layer to saturation, the air must either cool by some other process, moistening must proceed rapidly, or both.
Examples » West Coast Fog Example » Temperature and Humidity Changes
Now consider the low-level temperature and humidity structure from the Eta Model on 11 March and then 24 hours later on 12 March. The low-level flow shows that the eastern Pacific is characterized by cold temperature advection and dry humidity advection at 00 UTC 11 March.
Looking at the low-level temperature and humidity 24 hours later, we see that near-surface air temperatures have risen farther offshore while right along the coast cooling has occurred. The temperature rise is associated with the positive heat fluxes occurring farther offshore. The near-coast cooling is basically the effect of advection in the presence of little surface heat flux. It is important to note that air that is foggy on 12 March with a temperature of 10 - 12°C had the same temperature and no fog 24 hours earlier up the coast. This clearly indicates that the moisture content has changed, not the surface temperature.
Examples » West Coast Fog Example » Atmospheric Profiles
Question 25
The Eta Model fails to depict the moistening, as the relative humidity tends to stay rather low along the entire coast. To begin to understand what changes have taken place to result in fog, consider a sounding at the same location of 36.4°N / 123.6°W, west of Monterey. This plot shows model soundings for 0000 UTC on 11 March in red and green and for 0000 UTC on 12 March in blue. What does the plot indicate? Use the pull-down menu to choose the best answer.
The correct answers are highlighted above.
The Eta Model shows a small decrease in surface temperature but little moisture increase as noted on the horizontal plots. Otherwise, the boundary layer remains essentially unchanged through 24 hours.
Question 26
Now let's compare the Eta Model sounding to a similar profile from the MM5 Model, which depicts the boundary layer better. What does the MM5 show? Use the pull-down menu to choose the best answer.
The correct answers are highlighted above.
The MM5 shows surface cooling and boundary layer deepening, but still only minimal surface moisture at this fixed location.
Question 27
An important distinction emerges when we look back upstream along the trajectory leading to the location near Monterey. Looking at this figure, the blue lines show the 0000 UTC 12 March sounding from near Monterey. The red and green lines show a sounding from an upstream location off northern California for a time 12 hours earlier. What changes occur over 12 hours as the boundary layer advects southward? Use the pull-down menu to choose the best answer.
The correct answers are highlighted above.
The surface temperatures along the trajectory are nearly identical indicating no surface heating or cooling. However, the boundary layer deepens over time. The surface humidity increases over the 12 hours due to the positive moisture flux. However, the MM5 Model still fails to reach saturation.
Examples » West Coast Fog Example » Boundary Layer Depth Considerations
The important features of the evolution of the boundary layer along the trajectory are moistening of the layer and the development of a deeper cool layer. If the near-surface air were initially closer to saturation, the deepening layer and associated vertical mixing would form a cloud layer and possibly fog. This process is fairly common in many fog and marine stratus events where the surface heat flux is near zero and there is a positive moisture flux. The critical element seems to be the development of a slightly deeper mixed layer. The deepening causes adiabatic cooling at its top, which leads to saturation and condensation.
So what causes the layer to deepen? In this case, as well as many others, the deepening is the result of a relaxation of large-scale subsidence. This can be seen by comparing the vertical velocity profile from the Eta Model at 0000 UTC on 11 March and again 12 hours later.
The 0000 UTC 11 March profile (green curve) shows subsidence down to the surface, which results in a surface-based inversion. The 1200 UTC 11 March profile shows that the subsidence has changed to weak ascent, which allows the layer to deepen, given positive buoyancy from the surface.
What causes the change in vertical velocity? In this case, the change from subsidence to weak ascent is associated with the eastward shift and weakening of the 500 hPa ridge axis.
Examples » West Coast Fog Example » Wind Profiler Observations
The impact of this relaxation of subsidence is also evident in the wind profiler plot from Pt. Piedras Blancas. Note the deepening cool layer. The buoyancy required to drive the deepening depends upon the moisture flux and radiative processes, particularly as clouds begin to form.
Examples » West Coast Fog Example » Conclusions
- In West Coast fog events, fog may form with little or no cooling at the surface. Thus, the important processes to monitor are moistening and deepening of the marine boundary layer along a trajectory.
- Moistening of the boundary layer needs to be assessed through surface fluxes or along-trajectory humidity changes.
- Deepening of the boundary layer is typically associated with a relaxation of subsidence.The subsidence is best assessed from 500 hPa charts and the relative forcing of synoptic-scale vertical motion.
- This model of fog/stratus development depends upon small changes in the marine boundary layer. This creates challenges for the forecaster as even minor changes may be enough to cause fog. Such minor changes are often not readily apparent in model forecast products. Note that clouds and radiative processes are also important to fog and stratus formation and maintenance. These topics have not been addressed in this section.
Examples » Steam Fog Example
Examples » Steam Fog Example » Introduction
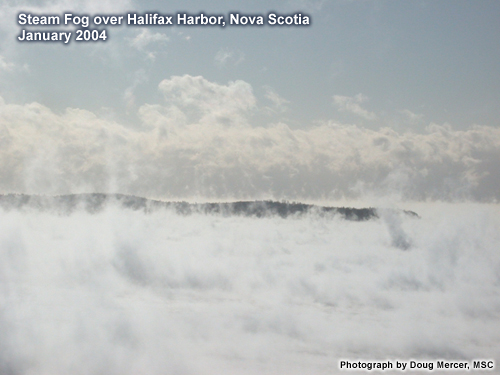
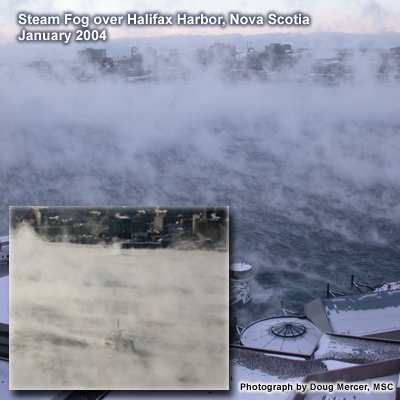
In this example we examine the evolution of the boundary layer during a steam fog event that occurred in Halifax Harbor, Nova Scotia in January 2004. Steam fog events occur most often over polar regions but the potential exists anytime a very strong arctic outbreak results in very cold dry air moving over much warmer water.
To assess the potential for steam fog, a forecaster must get a clear picture of the boundary layer evolution. In particular, they must monitor and evaluate these parameters:
- Air parcel trajectories
- Temperature and humidity changes
- Boundary layer stability and fluxes
Examples » Steam Fog Example » Trajectory Considerations
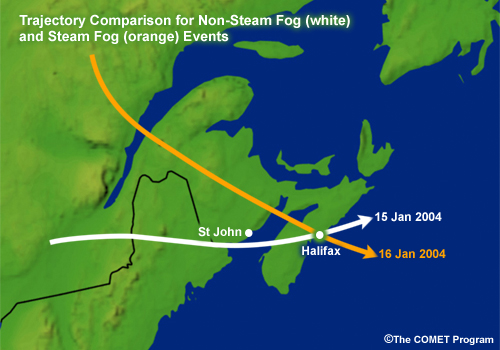
Steam fog developed rapidly and filled Halifax Harbor on the morning of 16 January 2004. Yet similar synoptic conditions existed on 15 January and steam fog did not form. Let's examine some of the differences between the two days that made the difference in fog versus no fog.
This figure shows the general trajectory vectors for both 15 and 16 January. One important difference in the trajectories is the longer overwater fetch on 15 January. The longer residence time over water probably allowed air parcels to warm and moisten before they reached Halifax. Since steam fog requires a strong temperature difference between the colder air and warmer water, the modified air mass may have all ready warmed too much by the time it reached Halifax.
Examples » Steam Fog Example » Atmosphere at Halifax Prior to Fog
Examining the skew-T profile over Halifax Harbor for the morning of 15 January shows that the surface temperature is about -12°C while the water temperature is about 1.5°C. Although the temperature difference is fairly large, it's right on the edge for the 12-14°C minimum differential typically associated with steam fog formation.
Also note the boundary layer is unstable, which is typical in a steam fog scenario where strong heat and moisture fluxes from the water to the atmosphere result in strong convective mixing and turbulence. The instability of the boundary layer is a significant difference in conditions found during steam fog events as compared to other dynamic fog events such as West Coast and advection fogs. However, another inhibiting factor on 15 January is that the boundary layer is about 150 hPa thick, perhaps too thick to result in saturation even at the surface as moisture and heat is rapidly mixed through the entire layer.
Examples » Steam Fog Example » Trajectory Changes
By 0000 UTC (2000 LT) on 16 January, the air parcel trajectories have changed slightly to a more northwest direction as a weak trough passes across the area and a low pressure area intensifies to the southeast. Cold advection also intensifies in the wake of the trough passage.
Examples » Steam Fog Example » Upstream Conditions at St. John
Let's examine an upstream profile, which is located to the northwest of Halifax near St. John, New Brunswick. This profile is taken from the harbor near St. John and shows a colder air mass with surface temperatures near -21°C. Also note the shallower unstable layer with a depth of about 75 hPa capped by an elevated weak inversion layer. The shallower layer will limit the depth that the strong surface fluxes can mix.
Examples » Steam Fog Example » Atmosphere at St. John During Fog
Examining the skew-T over Halifax Harbor on the morning of 16 January, we can discern a few important differences from the previous day. First of all the colder air mass has reached the area on stronger NW winds of about 30 knots near the surface. The air parcels temperature from St. John Harbor 12 hours earlier has changed little with a surface temperature near -19°C in Halifax Harbor. The temperature differential between air and water is now about 20°C, plenty cold enough for steam fog.
Note that the boundary layer is deeper than it was over St. John. It is now about 150 hPa deep, similar to the previous morning. However, because of the much larger air/water temperature difference, the fluxes of water vapor and heat are strong and rapid enough to begin saturating the lowest layer of the boundary layer almost immediately after the air crosses over the water surface. This is suggested by the rapid increase in the dewpoint near the surface. The subtle shallow moist layer near the surface is the indication of the presence of steam fog. The model appears to depict this despite the apparent lack of sufficient vertical resolution in the boundary layer.
Examples » Steam Fog Example » Halifax Harbor: Eta Perspective
Now, let's look at a skew-T for Halifax Harbor from the Eta Model, which has better boundary layer resolution. In the sounding, we see steeper lapse rates indicating a more unstable lower boundary layer capped by a stronger inversion above 925 hPa. Note, however, that the model does not show saturated conditions at the surface. This likely reflects the model's inability to define the boundary with sufficient detail to depict the shallow processes involved in many steam fog events.
Examples » Steam Fog Example » Conclusions
Based on this discussion, the critical factors to monitor when forecasting steam fog are as follows.
- The tendency for preferable trajectories that allow the cold air mass to maintain its temperature and moisture characteristics as much as possible prior to passing over the water
- Rapid moistening of the lower boundary layer due to a strong water vapor pressure gradient between water surface and adjacent atmosphere
- Unstable conditions in the lower boundary that allow rapid transport and mixing of surface fluxes
- Capping of boundary layer by an elevated inversion is helpful in allowing the lower boundary layer to saturate
Mesoscale Factors
At the end of this section you should be able to do the following things:
- Describe the effects of coastal topography in fog formation
- Describe how coastal jets affect fog formation and dissipation
- Describe how sea breezes affect fog formation and dissipation
- Describe the impact of local variations in sea surface temperature on fog formation and dissipation
Mesoscale Factors » Introduction
Local and mesoscale influences can make or break your marine fog or stratus forecast. Influences of coastal shape, topography, and characteristics of the sea surface on the lower atmosphere can play a vital role in the development, duration, and intensity of these events. This section examines several of these influences and discusses how they enhance or inhibit a fog or stratus event. The features and processes discussed here include:
- Coastal jets
- Sea breezes
- Local SST variations
Mesoscale Factors » Coastal Jets
Mesoscale Factors » Coastal Jets » Coastal Jet Basics
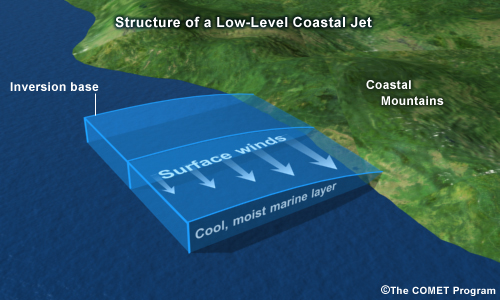
The presence of the low-level jet found along the California coast and other coastal locations such as the west coast of South America and the Somali coast in Africa can have a profound influence on fog and stratus events in these regions.
Characteristics of these jets are shown in the schematic and include the following:
- Caused by baroclinicity between inland areas and coastal waters
- Baroclinicity also causes a slope in the marine boundary layer, which contributes to jet development
- Marine boundary layer is deeper offshore than closer to the coast
- The core of the low-level jet is typically located just below the inversion base and most intense in the afternoon around the time of maximum heating and baroclinicity
- There are local maxima in the low-level jet along the coast associated with the lee of capes and points
- The dynamics of the low-level jet dynamics may locally impact fog/stratus depth, intensity, and duration.
A more detailed discussion of coastal jet structure can be fund in the COMET Mesoscale Primer module Low-Level Coastal Jets
Mesoscale Factors » Coastal Jets » Climatology of Coastal Jets
Coastal jets tend to be more frequent in a particular region when the climatological mean winds increase in that region. This animation presents a monthly global MSLP/wind climatology. Note that flow along the west coasts of continents tends to be strongest in the warm months, in conjunction with the intensification of the mid-oceanic ridges. This flow tends to be directed toward lower latitudes and corresponds to the maximum frequency of occurrence of coastal jets in these regions.
Mesoscale Factors » Coastal Jets » Implications for Fog Forecasting
When forecasting marine stratus and fog, you may need to anticipate a coastal jet and consider the degree to which it may mix down to the surface. There are two important ways the coastal jet can influence West Coast type fog/stratus events.
The structure of coastal jets in the vertical typically places the strongest winds at the base of the marine layer inversion. However, changes in the boundary layer stratification may induce stronger or weaker mixing to the surface depending on the stability. All other factors being equal, a slightly warmer sea surface temperature may lead to less stability in the marine layer. The decrease in stability may result in greater vertical mixing, resulting in regions where the fog and stratus readily mix out.
The structure of the coastal jet is such that the marine boundary layer is shallower near the coast and downwind of capes and points. The depth of the boundary layer in these regions has an important impact on the potential cloud base and the type of stratus that may occur. Thus coastal topography may determine whether we see low stratus or stratocumulus clouds.
Mesoscale Factors » Coastal Jets » Points and Capes
Several studies have also shown that coastal topographical features such as points and capes can strongly influence the depth of the marine boundary layer both upwind and downwind of the feature. This is important because changes in the marine layer depth will closely correspond to fog and stratus depth if present.
The illustration shown here is from a field study conducted by Koracin and Dorman. Using both aircraft measurements and model simulations, they identified localized areas of wind divergence and boundary layer depth changes induced by coastal topography. The graphic shows how model simulations indicate areas of increased convergence upwind of capes and points and increased divergence downwind of these same features.
Note the areas of divergent winds downstream of the capes and points and the convergent areas upstream. Koracin and Dorman found that upstream, the marine boundary layer depth increased, which resulted in a thicker layer of fog or stratus. Downstream, the marine boundary layer was thinner, with stratus and fog tending to dissipate.

This image shows a satellite-derived average cloud albedo for all of June 1996, the same period as the field study. The colors represent cloud albedo with clear areas showing up as magenta. The blue regions along the coast are low clouds and fog. Note the mean clear areas downstream of the capes and points and mean cloudy areas upstream of these features. These are important local effects that need to be considered if your forecast region involves the coastal environment.
Mesoscale Factors » Coastal Jets » Coastal Jet Detection
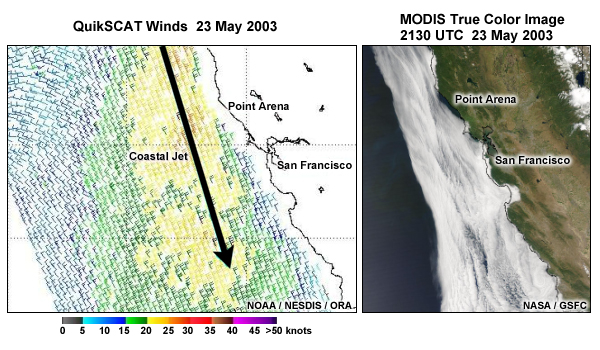
Recently available polar satellite information may be used to improve the diagnosis and monitoring of coastal jets for their impact on coastal fog and stratus. This figure shows the QuikSCAT wind field and reveals a low-level jet. Note the local wind field maxima downwind of Cape Mendocino and Point Arena off the northern California coast.
This MODIS image comes from the same time period. Note the clearing areas in the downwind regions of the capes and points. This is consistent with the possible lowering of the marine inversion and/or significant vertical mixing and subsidence, dissipating or preventing the formation of low clouds and fog in these areas.
Mesoscale Factors » Sea Breeze
Mesoscale Factors » Sea Breeze » Introduction
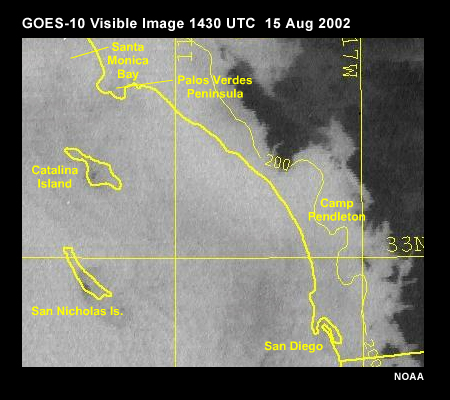
The sea breeze and its close relatives, land, lake, and river breezes, are thermally-forced circulations that arise along nearly every coastal boundary around the world. However, the local circulations associated with the sea breeze vary almost as widely as the locations in which they arise. Consequently, understanding and forecasting the sea breeze requires knowledge of the local environment, including the coastline shape, mountain and valley locations, land cover, and prevailing synoptic-scale weather patterns.
Details of the dynamics, structure, and evolution of the sea breeze will be discussed in this module only as they pertain to marine and coastal fog and stratus events. For a more complete presentation on the sea circulation, see the Mesoscale Primer module: Thermally-forced Circulations I: Sea Breezes.
Open Sea Breeze module in a new window (https://www.meted.ucar.edu/mesoprim/seabreez/).
Mesoscale Factors » Sea Breeze » Coastline Shape - Florida
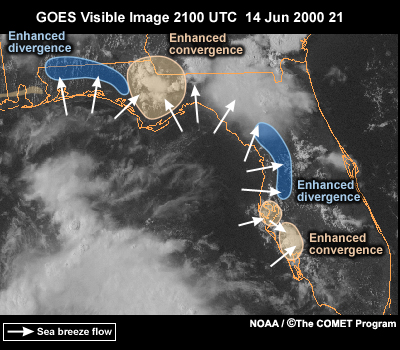
Sea breeze circulation can have a significant effect on coastal stratus and fog events. Factors like the shape and orientation of the coastline, presence of coastal mountains, and the presence and strength of low-level inversions tend to determine many of the important local circulations associated with the sea breeze and where fog or stratus will tend to be enhanced or inhibited.
Coastal shape plays an important role in creating localized areas of convergence or divergence. The graphic shown here illustrates the concept. Concave coastal areas (bays and inlets) enhance low-level divergence and convex coastal areas (points and headlands) enhance low-level convergence. Divergent flow works against the convergence and uplift found along the sea breeze front. However, for a convex coastline, onshore flow becomes convergent, enhancing convergence and uplift along the sea breeze front. As a result, convex coastlines tend to experience more fog than concave coastlines.
Mesoscale Factors » Sea Breeze » Coastline Shape - California
Along the U.S. West Coast, we typically find a shallow marine boundary layer capped by a strong, low-level inversion. In this environment, marine stratus and fog tend to clear first in regions of enhanced divergence, both offshore and onshore. On the other hand, regions of enhanced convergence can produce persistent marine stratus because the forced vertical motion is unable to penetrate the strong, low-level inversion. In the animation shown here, we see clearing first along concave shorelines. We also see enhanced stratus near the Palos Verdes Peninsula, and farther south, near San Diego.
Mesoscale Factors » Sea Breeze » Mountain/Valley Winds
Mountains and associated valleys may contribute to early sea breeze development by producing mountain valley circulations that add to the sea breeze. The mountains and valleys tend to determine the distribution of heating and the locations into which the sea breeze front can penetrate. Afternoon hot spots located over inland valleys tend to draw the sea breeze inland. This results from the temperature and pressure gradients created by differential heating of inland and coastal locations. In such cases, the marine boundary layer is drawn inland and with it any associated fog or stratus. Some dissipation of the fog or stratus can also occur especially if preconditions were particularly hot and dry.
This animation showing the evolution of the winds in Monterey Bay illustrates the idea. Note how the onshore flow associated with the developing sea breeze is able to penetrate well inland across the central portion of the Monterey Bay and far into the inland valleys to the south. This inland penetration is the result of advection of cooler, nearly-saturated, marine air. In these regions, fog and marine stratus typically form again at night in response to radiative cooling. Often these regions are also slow to clear during the daytime.
Mesoscale Factors » Local SST Variations
Mesoscale Factors » Local SST Variations » Discussion
SST variations on the mesoscale can result from several processes. These include:
- Enhanced local upwelling due to increased surface wind stress resulting from interaction of alongshore or offshore flow with local topography.
- Coastal jet enhancement and mixing of momentum to the surface due to local topography.
- Cold or warm pools that migrate out of their source region, usually along edges of major currents such as the Gulf Stream or Kuroshio. These excursions can cause localized SST anomalies that vary significantly from climatology.
Any of these processes can impact local fog and stratus events on the meso and local scales. For example, local upwelling and the resulting cooling can help enhance local fog formation if moisture advection follows. Conversely, the presence of a warm pool may inhibit formation of fog or cause increased mixing of the lower boundary layer and result in a stratus event. These smaller events tend to be more short-lived than their larger-scale counterparts, but they can occur along most coastal areas or even over open water regions. Therefore, it is important to be aware of local water surface temperature conditions and to consider their possible roles in subsequent fog or stratus formation.
Questions
Questions »
Question
Fog and stratus are more likely to form where the near-coast flow is characterized by _____. (Choose the best answer.)
The correct answer is a.
Localized convergence can lead to enhanced uplift, resulting in cooling, saturation, and cloud formation. Consequently, regions that favor convergence should be watched closely for fog and stratus.
Questions »
Question 27
Use the pull-down menus below to answer the following question.
The correct answers are highlighted above.
The structure of the coastal jet is such that the marine boundary layer is shallower downind of capes and points. Wind tends to accelerate in this region, which promotes fog and dissipation.
Questions »
Question
With a sea breeze, fog tends to _____ first at points and capes. (Choose the best answer.)
The correct answer is a.
Concave coastal areas (bays and inlets) enhance low-level divergence and convex coastal areas (points and headlands) enhance low-level convergence. As a result, convex coastlines tend to experience more fog than concave coastlines.
Questions »
Question
A region of anomalously warm sea surface temperatures will tend to _____ fog formation. (Choose the best answer.)
The correct answer is a.
The presence of a warm pool may inhhibit formation of fog or cause increased mixing of the lower boundary layer and result in a stratus event.
Forecasting DFF
At the end of this section you should be able to do the following things:
- Describe the general approach to forecasting fog
- List at least 4 critical atmospheric fields to monitor in plan view when forecasting fog
- List at least 4 critical atmospheric fields to monitor in vertical profiles when forecasting fog
- Describe the limitations of NWP models in fog forecasting
Forecasting DFF » Methodology
Forecasting DFF » Methodology » Introduction
In this section we discuss a suggested forecast approach to the fog and marine stratus problem. The follow-on sections then addresses model forecast products, observations, and remote sensing tools useful in assessing fog and marine stratus potential. Specifically, we address tools and products that are used to assess the synoptic-scale potential for fog events, the boundary layer processes, and the area of coverage.
Forecasting DFF » Methodology » Forecast Methodology
There are many ways to approach the forecasting of fog and stratus, but any approach should incorporate the following basic steps and concepts.
- First and foremost have good situational awareness.
- Examine observations: Assess past and current conditions and how they have evolved during the past 6 to 12 hours, both over your location and upstream
- Be aware of local and/or regional mesoscale features that may influence your forecast such as ocean currents, SST anomalies, coastal terrain, etc.
- Be knowledgeable of the fog/stratus climatology in your region.
- Understand the needs of the operations you are supporting and the potential impacts a fog or stratus event would have on them.
- Examine remote sensing data such as satellite and radar imagery when available to assess any cloud or precipitation trends that have influenced or may influence your forecast region.
- Review model forecast data to assess the overall evolution of the synoptic
pattern during your period of interest
- Assess synoptic patterns for fog/stratus pattern recognition (Moisture, temperature advection, trajectories, stability, etc.)
- Does the expected synoptic evolution tend to promote or inhibit fog/stratus events in your area?
- Have a basic understanding of typical model performance and biases in your region.
- Make initial assessment for fog/stratus potential applying your knowledge of fog/stratus physics, expected conditions, and local climatology.
- Monitor boundary layer changes for temperature, winds, stability,
moisture, and cloud cover as the forecast issue time approaches
- Compare to model forecast and earlier expectations and reassess your expectations if necessary
- Issue forecast
- Don't be afraid to issue a forecast that brings ceiling and visibility conditions down below minimums if that is what you expect!
- Monitor conditions and reassess forecast as necessary based on changes that veer away from earlier expectations and make adjustments.
Forecasting DFF » Products
Forecasting DFF » Products » Introduction
In this section we review some of the model forecast products that are useful in the forecasting of dynamically forced fog and stratus over the marine environment. This is not meant to be an all-inclusive presentation, but meant to provide information on a few useful products. You will undoubtedly find more products that are useful for your particular situation or region.
Difficulties in forecasting marine fog and stratus events stem from several factors. These include
- Dependence on subtle, mesoscale changes that occur in the marine boundary layer
- Sparse direct atmospheric observations available over the marine environment
- Lack of thorough understanding and emulation of the microphysical processes involved in the development and dissipation of fog.
- Difficulties numerical models have in resolving boundary layer features and physical
processes important to fog and stratus development include the following:
- Vertical model resolution is often insufficient to depict BL subtleties important to fog and stratus processes
- Parameterization of BL and surface physics fail to emulate the complex cloud physics that play an important role in fog and stratus events
- Mesoscale models may improve the ability to resolve smaller-scale features and processes, but limitations still arise due to the complex physics being parameterized
Due to the lack of direct atmospheric measurement over the oceans we must rely on indirect observations from satellite imagery and products and on products derived from the various numerical forecast models available to us. What follows is an overview and illustration of a few model product types and their application in diagnosing and forecasting boundary layer evolution
Forecasting DFF » Products » Model Plan Projections
Model plan projection products are numerous and can provide an overview of both the mesoscale and larger-scale features that are influencing the potential for fog and stratus. Particularly useful products and their potential application to fog/stratus forecasting are found in the following table:
 |
|
| Product | |
| Wind fields and streamlines | |
| Location | |
| Within the boundary layer and above | |
| Purpose/ What to look for | |
| Determining trajectories, wind speeds, and inferring degree of turbulence. | |
 |
|
| Product | |
| Vertical motion fields | |
| Location | |
| Within boundary and at 850 and 700 mb | |
| Purpose/ What to look for | |
| Determining large-scale subsidence and mixing. Weak subsidence often present in both advection and West Coast fog events, while shallow convective mixing often present with steam fog. | |
 |
|
| Product | |
| Moisture fields, RH, mixing ratio | |
| Location | |
| Within boundary layer and above | |
| Purpose/ What to look for | |
| Overlaid with wind fields allows inference of moisture advection. Fog/stratus events often feature a moist boundary layer with dry air above the inversion level. | |
 |
|
| Product | |
| Temperature, wind fields | |
| Location | |
| Within boundary layer | |
| Purpose/ What to look for | |
| Good for determining temperature advection and temperature gradients. This is important in all 3 fog types. Look for warm advection for advection fog, nearly neutral for West Coast fog and strong cold advection and strong temperature gradients for steam fog. |
Forecasting DFF » Products » Model Vertical Products
Vertical and cross section products are very useful in fog and stratus forecasting because they provide a view of the structure of the atmosphere from the surface to the upper levels. There are many useful products that provide important information for forecasting these events. A few of them are presented in the table below.
 |
|
| Product | |
| Model skew-T | |
| Location | |
| Surface to at least 500 mb | |
| Purpose/What to look for | |
| Provides information on temperature, moisture, inversion level, stability, and winds. Look for stable, moist boundary layers, capping inversions, and dry air aloft (especially true for advection and West Coast-type events). Steam fog events often show shallow, unstable, moist, surface layer sometimes capped by a weak elevated inversion. | |
 |
|
| Product | |
| Omega cross section | |
| Location | |
| Surface to at least 500 mb | |
| Purpose/What to look for | |
| Good for determining changes in vertical motions both in the boundary layer and above. Subtle increases in upward motion can often mean the difference between fog or no fog in West Coast-type events by changing boundary layer depth. | |
 |
|
| Product | |
| RH, mixing ratio cross section | |
| Location | |
| Surface to at least 500 mb | |
| Purpose/What to look for | |
| Useful in determining vertical structure of moisture within and above the boundary layer. High moisture in boundary layer and dry air aloft are typically present in most fog types. | |
 |
|
| Product | |
| Time-height products | |
| Location | |
| Surface to at least 500 mb | |
| Purpose/What to look for | |
| Good for determining the evolution of parameters such as omega, RH, moisture, and stability over time. Increasing values often mean more favorable fog/stratus conditions. |
Forecasting DFF » Products » Derived Products
Example of a cloud-base forecast from the 15-km MM5
Example of a visibility forecast from the 15-km MM5
There are numerous model-derived products that can be useful in assessing fog and stratus potential; however, all of these have significant limitations due to the fact that they are derived from other model forecast parameters that are, in and of themselves, only an estimate of real atmospheric processes. Some of these products include the following:
- Cloud-base forecasts
- Cloud-depth forecasts
- Visibility forecasts
Forecasting DFF » Products » Use of Model Products
The use of model products helps to:
- Identify and anticipate the occurrence of synoptic conditions that are conducive to fog and stratus development
- Identify and assess airmass characteristics and their changes over time
- Identify and assess air parcel trajectories and their changes over time
- Identify and anticipate synoptic features that will dissipate the fog regime
- Identify and anticipate boundary layer conditions that promote fog and stratus development
- Identify and anticipate boundary layer conditions that tend to dissipate or inhibit fog and stratus
Model products do not add much reliable information about:
- Microscale and many mesoscale physical processes that are involved in fog and stratus development
- Local scale topographic effects on fog and stratus
- Local and regional scale effects of SST gradient on fog and stratus
Mesoscale model products can add valuable information to larger-scale model products by:
- Providing better boundary layer resolution and more detail on boundary layer characteristics that may affect fog and stratus development
- Providing better resolution for topographic and coastal influences
- If using an ocean/atmosphere coupled model, may provide improved air/sea flux interactions
However, it is important to note that mesoscale models still do not have sufficient detail and physics to forecast the smaller-scale dynamic, thermodynamic, and cloud processes important to fog and stratus development. Many of these processes are still parameterized in models and are not forecast directly.
Summary
General Comments:
- Advection fog and steam fog are examples of fogs with a large air-sea temperature difference, while typical West Coast fog and marine stratus often occur with only a small air-sea temperature difference.
- The trajectories associated with West Coast fog events differ from those associated with advection fog events in a profound way. Along the west coasts of continents the air flows toward the equator. Flow associated with advection fog events typically flows toward the poles. Thus, along west coasts, air typically moves over progressively warmer water, while marine advection fog events are triggered by flow over progressively colder water.
Advection Fog:
- Advection fogs form under synoptic patterns that promote the advection of warm, moist air over cold surfaces. Advective fogs frequently develop over oceanic regions where major ocean currents cause strong SST gradients. These fog events can occur almost any time of year, but are most frequent and prevalent in the warm season.
- For advection fog, the temperature of the underlying surface (SST) must be less than the air parcel's initial dewpoint temperature in order to achieve saturation. Saturation is achieved primarily through cooling with little change in the dewpoint profile. The exception to this general rule occurs when the air parcel moistens along its trajectory. Under those circumstances, less cooling is required to reach saturation, allowing for a warmer SST.
West Coast Fog:
- West Coast-type fogs or stratus events are generally located in areas dominated by oceanic subtropical high pressure systems. Subsidence associated with the large high pressure environment leads to the development of a capped boundary layer. This restricts vertical mixing and thereby allows the boundary layer to moisten. With a moist, well-mixed boundary layer, saturation is reached with only modest cooling.
- If the depth of the mixed layer increases in response to a weak disturbance, then the inversion base is lifted and the layer is cooled. This process results in saturation and formation of a stratus deck. Cloud-top cooling of the stratus thickens the saturated portion of the boundary layer, lowering the base of the stratus. Saturation of entire layer results in fog at the surface.
- Upwelling regions can enhance the occurrence of West Coast-type fog and marine stratus events by cooling the lower boundary layer, often bringing the boundary layer to saturation.
- West Coast-type fog and stratus events can occur almost any time of the year, but fog tends to occur most frequently during autumn and stratus during the warm season.
Steam Fog:
- Steam fogs occur when intensely cold, dry air advects rapidly over a warmer water surface. Vapor pressure at the water surface is much higher than in the cold air. This creates a strong vapor pressure gradient that promotes the rapid transfer of vapor from water to air. The water vapor then condenses as it mixes into the much colder air.
- The typical synoptic pattern favorable for steam fog development occurs when cold, dry continental-polar air flows over water surfaces that are generally 10 to 12°C warmer.
- For steam fog formation rapid saturation must occur without any significant air temperature change. On a sounding, the low-level dewpoint increases with little change in the temperature profile.
Mesoscale Influences:
- Mesoscale variations in the coastal shape, topography, and sea surface temperature influence the development, duration, and intensity of fog events.
- Upstream of points and capes, the marine boundary layer depth increases, which results in a thicker layer of fog or stratus. Downstream, the marine boundary layer thins, with stratus and fog tending to dissipate.
- Concave coastal areas (bays and inlets) enhance low-level divergence and convex coastal areas (points and headlands) enhance low-level convergence. As a result, convex coastlines such as capes and points tend to experience more foggy conditions than concave coastlines such as inlets and bays.
- Local upwelling and the resulting cooling can help enhance local fog formation if moisture advection follows. Conversely, the presence of a warm pool of water may inhibit formation of fog or cause increased mixing of the lower boundary layer and result in a stratus event.
Forecasting Dynamically Forced Fog:
Forecasting fog and stratus should incorporate the following basic steps and concepts:
- Have good situational awareness.
- Examine remote sensing data, such as satellite and radar imagery.
- Review the model forecast data to assess the overall evolution of the synoptic pattern during your period of interest.
- Make an initial assessment for fog/stratus potential applying your knowledge of fog/stratus physics, expected conditions, and local climatology.
- Monitor the boundary layer for changes in temperature, winds, stability, moisture, and cloud cover.
- Don't be afraid to issue a forecast that brings ceiling and visibility conditions down below minimums!
- Monitor conditions and reassess forecast as necessary based on changes that veer away from earlier expectations.
Model plan projection products can provide an overview of both the mesoscale and larger-scale features that influence the potential for fog and stratus. Useful fields include the following:
- Wind fields and streamlines
- Vertical motion fields
- RH and mixing ratio
- Temperature and wind fields
Vertical and cross section products provide a view of the structure of the atmosphere from the surface to the upper levels. Useful products include the following:
- Model skew-T diagrams
- Omega profiles and cross sections
- RH, mixing ratio cross sections
- Time-height products
Model-derived products can be useful in assessing fog and stratus potential; however, all of these have significant limitations due to the fact that they are derived from other model forecast parameters that are, in and of themselves, only an estimate of real atmospheric processes. Useful products include the following:
- Cloud-base forecasts
- Cloud-depth forecasts
- Visibility forecasts
Bibliography
Bridger, Alison F. C., William C. Brick, and Peter F. Lester, 1993. The Structure of the Marine Inversion Layer off the Central California Coast: Mesoscale Conditions. Mon. Wea. Rev., 121, 335-351.
Burk, Stephen D., and W. T. Thompson, 1996. The Summertime Low-Level Jet and Marine Boundary Layer Structure along the California Coast. Mon. Wea. Rev., 124, 668-686.
Burk, Stephen D,. and T. Haack, 2000. The Dynamics of Wave Clouds Upwind of Coastal Orography, Mon. Wea. Rev., 128, 1438-1455.
Clark, D. A., and F. W. Wilson, 1996: The Marine Stratus Initiative at San Francisco International Airport. Project Rep. ATC-252, Massachusetts Institute of Technology, 41 pp. [Available from National Technical Information Service, 5285 Port Royal Rd., Springfield, VA 22161.]
Kalnay, E. et al., 1996. The NCEP/NCAR Reanalysis 40-year Project. Bull. Amer. Meteor. Soc., 77, 437-471.
Koracin, D., and Clive E. Dorman, 2000. Marine Atmospheric Boundary Layer Divergence and Clouds along the California Coast in June 1996. Mon. Wea. Rev., 129, 2040-2056.
Koracin, D., J. Lewis, W. T. Thompson, C. E. Dorman, and J. A. Businger, 2000. Transition of Stratus into Fog along the California Coast: Observations and Modeling., J. of Atmos. Sci., 58, 1714-1731.
Norris, Joel R., 1998. Low Cloud Type over the Ocean from Surface Observations. Part II: Geographical and Seasonal Variations. J. of Climate, 11, 383-403.
Relevant COMET Modules:
Contributors
The following have contributed to the development of Dynamically Forced Fog.
Sponsors
- National Oceanic and Atmospheric Administration (NOAA)
- National Weather Service (NWS)
- Naval Meteorology and Oceanography Command (NMOC)
- Air Force Weather Agency (AFWA)
- National Environmental Satellite Data and Information Service (NESDIS)
- National Polar-orbiting Operational Environmental Satellite System (NPOESS)
- Meteorological Service of Canada (MSC)
Project Contributors
Principal Science Advisors
- Richard Cianflone
- Dr. Wendell Nuss - Naval Postgraduate School
Additional Science Advisors
- CDR Berdequez - Naval Meteorology and Oceanography Professional Development Center (NAVMETOCPRODEVCEN)
- Staff at HQ AFWA/DNT 28th OWS Training Flight - Shaw AFB
- Ron Englebretson - Naval Research Laboratory - Monterey
Project Co-lead/Instructional Design/Multimedia Authoring
- Dr. Alan Bol - UCAR/COMET
Project Co-lead/Project Meteorologist
- Dr. Doug Wesley - UCAR/COMET
Illustration/Multimedia Authoring
- Steve Deyo - UCAR/COMET
Graphic Interface Design/Illustration/Multimedia Authoring
- Heidi Godsil - UCAR/COMET
Audio Editing/Production/Multimedia Authoring
- Seth Lamos - UCAR/COMET
Audio Narration
- Steven Saint James
- Wendy Abshire - UCAR/COMET
Software Testing/Editing/Quality Assurance
- Linda Korsgaard - UCAR/COMET
- Michael Smith - UCAR/COMET
Copyright Administration
- Lorrie Alberta - UCAR/COMET
Images and Photographs Provided by
- Doug Mercer, Meteorological Service of Canada
- Naval Postgraduate School
- Naval Research Laboratory - Monterey
- NOAA
- U.S. Navy
COMET HTML Integration Team 2021
- Tim Alberta — Project Manager
- Dolores Kiessling — Project Lead
- Steve Deyo — Graphic Artist
- Ariana Kiessling — Web Developer
- Gary Pacheco — Lead Web Developer
- David Russi — Translations
- Tyler Winstead — Web Developer
COMET Staff, Spring 2005
Director
- Dr. Timothy Spangler
Deputy Director
- Dr. Joe Lamos
Meteorologist Resources Group Head
- Dr. Greg Byrd
Business Manager / Supervisor of Administration
- Elizabeth Lessard
Administration
- Lorrie Alberta
- Heather Hollingworth
- Linda Korsgaard
- Bonnie Slagel
Graphics / Media Production
- Steve Deyo
- Heidi Godsil
- Seth Lamos
- Dan Riter
Hardware / Software Support and Programming
- Tim Alberta (Supervisor)
- James Hamm
- Karl Hanzel
- Ken Kim
- Mark Mulholland
- Carl Whitehurst
Instructional Design
- Patrick Parrish (Supervisor)
- Dr. Alan Bol
- Lon Goldstein
- Dr. Vickie Johnson
- Bruce Muller
- Katherine Olson
- Dwight Owens
- Dr. Sherwood Wang
Meteorologists
- Dr. William Bua
- Patrick Dills
- Tom DuLong
- Kevin Fuell
- Patrick Hofmann (Student Assistant)
- Dr. Stephen Jascourt
- Matthew Kelsch
- Dolores Kiessling
- Dr. Arlene Laing
- Elizabeth Page
- Wendy Schreiber-Abshire
- Dr. Doug Wesley
Software Testing / Quality Assurance
- Michael Smith (Coordinator)
National Weather Service COMET Branch
- Dr. Rick Koehler
- Anthony Mostek (National Satellite Training Coordinator)
- Brian Motta
- Dr. Robert Rozumalski (SOO/SAC Coordinator)
Meteorological Service of Canada Visiting Meteorologists
- Peter Lewis
- Garry Toth