Media Gallery
Media elements used in this module are protected by a variety of copyright licenses. Please use the "copyright terms" link associated with each item below for more information.
Description:
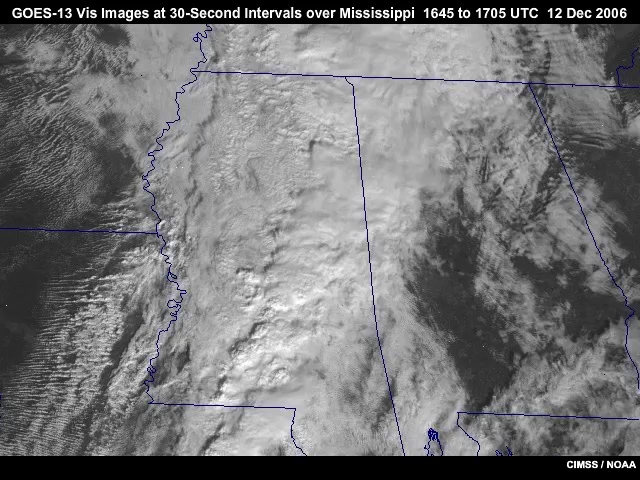
GOES-13 SRSO (Super Rapid Scan Operations) 30-second interval visible imagery showing convection over Mississippi from 16:45:16 to 17:05:52 UTC on 23 December, 2006.
File Name:
061212_g13_vis_srso.mp4
Credits:
CIMSS / NOAA
Copyright Terms:
COMET Standard Terms of Use
Description:
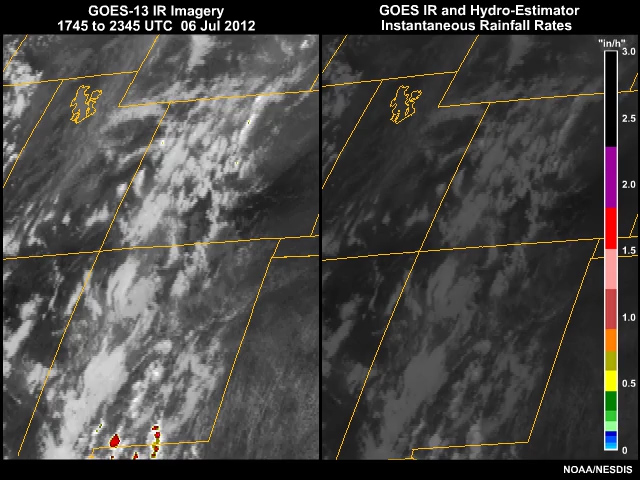
A GOES-13 2-panel animation showing color enhanced infrared imagery (left panel) and infrared with NOAA-NESDIS Hydroestimator instantaneous rainfall rate product overlay (right panel) of developing convection over the mountainous terrain in the Southwest U.S. from 1745 to 2345 UTC on July 6, 2012.
File Name:
06jul12_g13_ir4_hydroest_ani.mp4
Credits:
NOAA/NESDIS
Copyright Terms:
COMET Standard Terms of Use
Description:
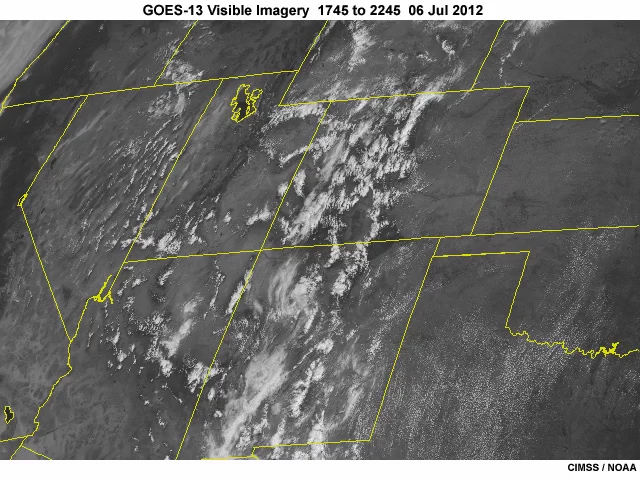
A GOES-13 visible imagery animation of developing convection over the Southwest U.S. from 1745 to 2245 UTC on July 6, 2012.
File Name:
06jul12_g13_vis_ani.mp4
Credits:
NOAA
Copyright Terms:
COMET Standard Terms of Use
Description:
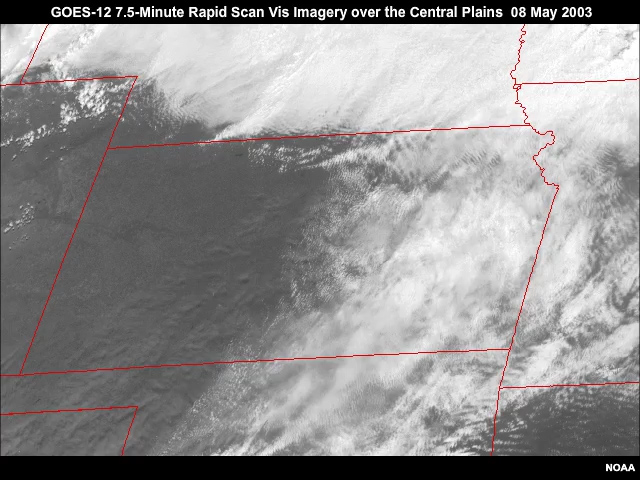
GOES-12 visible imagery 7.5 minute rapid scan animation showing convection developing in advance of cold front and dryline over the Central Plains Region during the afternoon hours of 8 May, 2003.
File Name:
08may03_g12_vis_ani.mp4
Credits:
NOAA
Copyright Terms:
COMET Standard Terms of Use
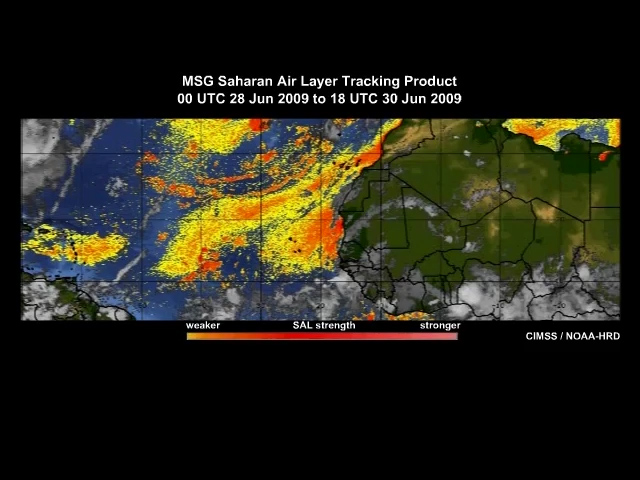
Description:
SAL tracking product produced using Meteosat-9 data showing the Saharan air layer moving across the Atlantic Ocean from 28 to 30 June 2009.
File Name:
090630_met9_sal_anim.mp4
Credits:
CIMSS / NOAA-HRD
Copyright Terms:
COMET Standard Terms of Use
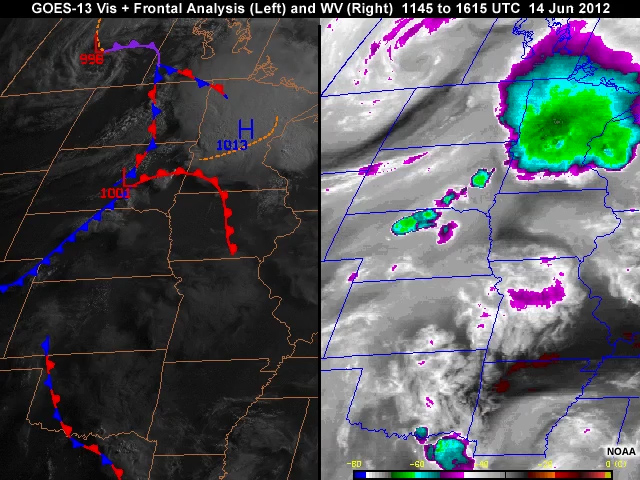
Description:
GOES-13 routine 15-minute visible and water vapor imagery with frontal analysis overlay showing the preconvective environment across the Central Plains states during the morning hours from 1145 to 1615 UTC on June 14, 2012.
File Name:
14jun12_g13_ani1.mp4
Credits:
NOAA (above colorbar bottom right corner)
Copyright Terms:
COMET Standard Terms of Use
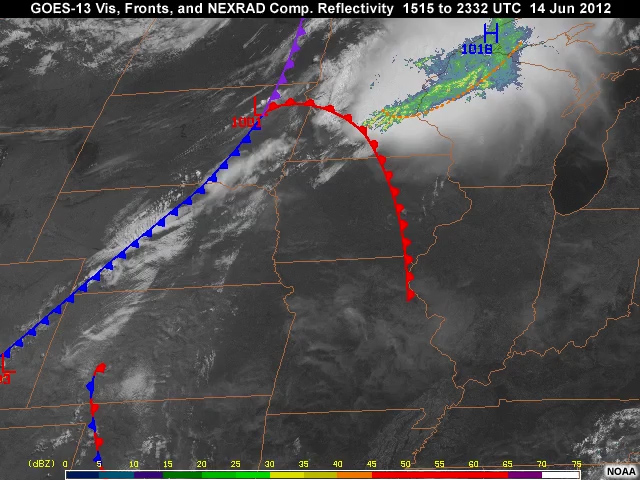
Description:
GOES-13 routine 15-minute visible and water vapor imagery with frontal analysis overlay showing the preconvective environment across the Central Plains states during the morning hours from 1145 to 1615 UTC on June 14, 2012.
File Name:
14jun12_g13_ani2.mp4
Credits:
NOAA (to right of colorbar)
Copyright Terms:
COMET Standard Terms of Use
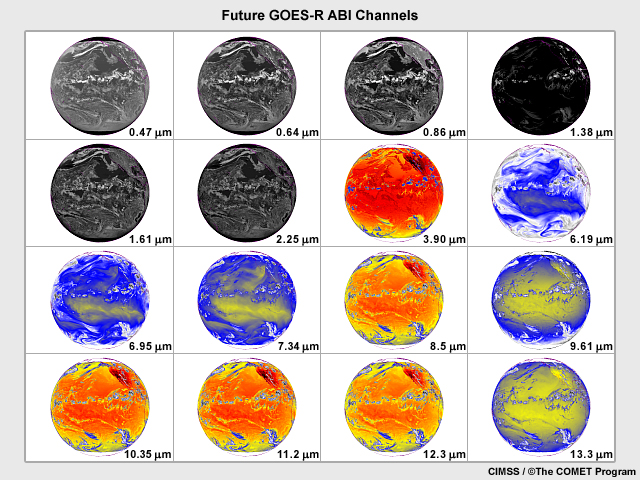
Description:
The sixteen spectral channels on the future GOES-R ABI imager showing the same scene for each channel of the full Earth disk over the eastern Pacific region simulated from numerical model data for June 26, 2008.
File Name:
16_future_goesr_channels_epac.jpg
Credits:
CIMSS / �The COMET Program
Copyright Terms:
COMET Standard Terms of Use
Description:
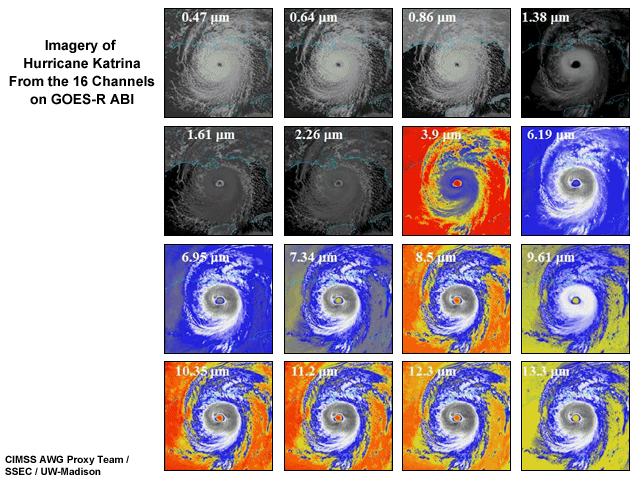
Graphic showing simulated imagery of Hurricane Katrina from the 16 channels on the GOES-R ABI instrument
File Name:
16_vs_5_bands_katrina_abi.jpg
Credits:
AWG Proxy Team / SSEC / UW-Madison
Copyright Terms:
COMET Standard Terms of Use
Description:
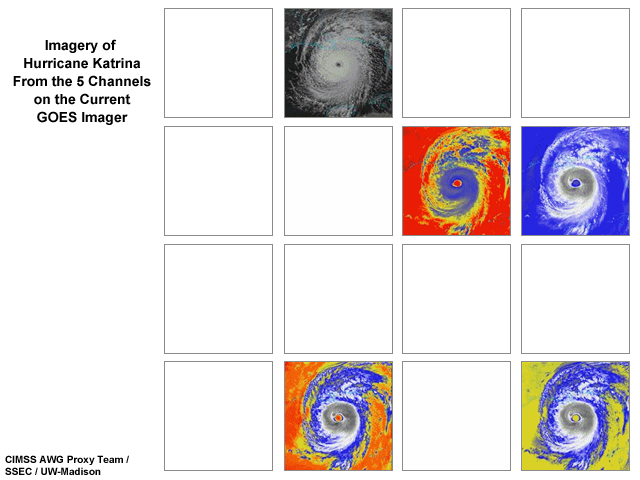
Graphic showing imagery of Hurricane Katrina from the 5 channels on current GOES satellites
File Name:
16_vs_5_bands_katrina_goes.jpg
Credits:
AWG Proxy Team / SSEC / UW-Madison
Copyright Terms:
COMET Standard Terms of Use
Description:
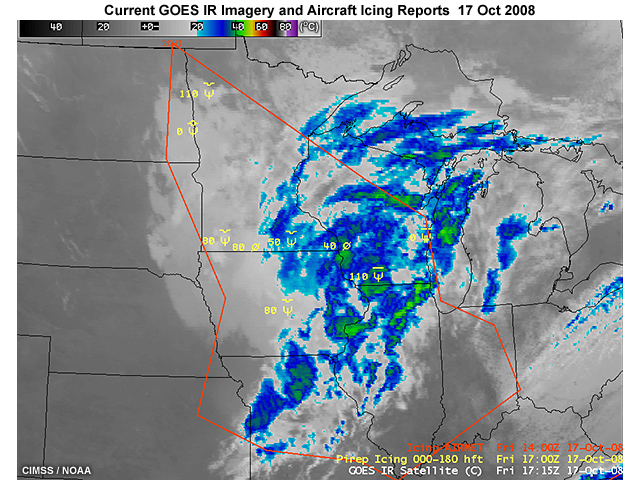
A GOES-12 infrared window channel image with icing AIRMET boundaries and PIREP aircraft icing reports overlain, for 0945 to 1731 UTC on October 17, 2008.
File Name:
17oct08_g12_ir_icing_1715utc.jpg
Credits:
CIMSS / NOAA
Copyright Terms:
COMET Standard Terms of Use
Description:
A GOES-12 animation of infrared window channel imagery with icing AIRMET boundaries and PIREP aircraft icing reports overlain, for 0945 to 1731 UTC on October 17, 2008.
File Name:
17oct08_g12_ir_icing_ani.mp4
Credits:
CIMSS / NOAA
Copyright Terms:
COMET Standard Terms of Use
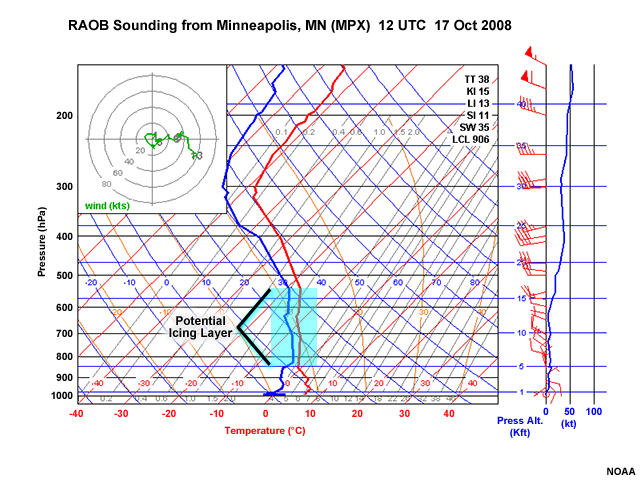
Description:
A RAOB sounding plot at Minneaplis, MN taken at 12 UTC on October 17, 2008, showing a potential icing layer.
File Name:
17oct2008_raob_sounding_minneapolis.jpg
Credits:
NOAA
Copyright Terms:
COMET Standard Terms of Use
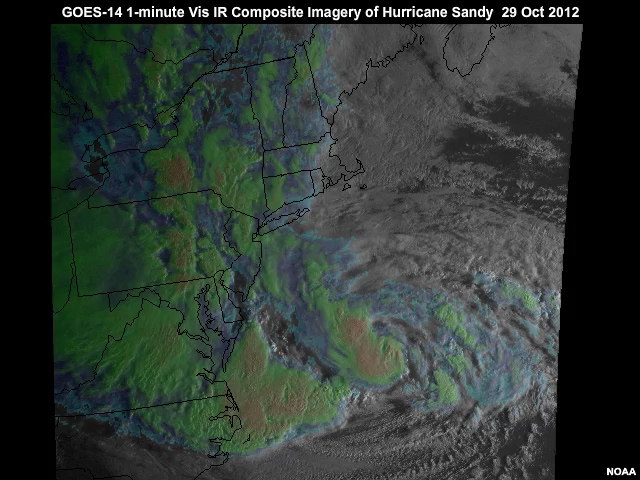
Description:
A one hour animation of GOES-14 composited visible and infrared 1-minute interval imagery taken prior to landfall of hurricane Sandy along the Mid-Atlantic coastline of the U.S. from 12:00 to 13:10 UTC on October 29, 2012.
File Name:
1min_visir_sandy_29oct12.mp4
Credits:
NOAA / The COMET Program
Copyright Terms:
COMET Standard Terms of Use
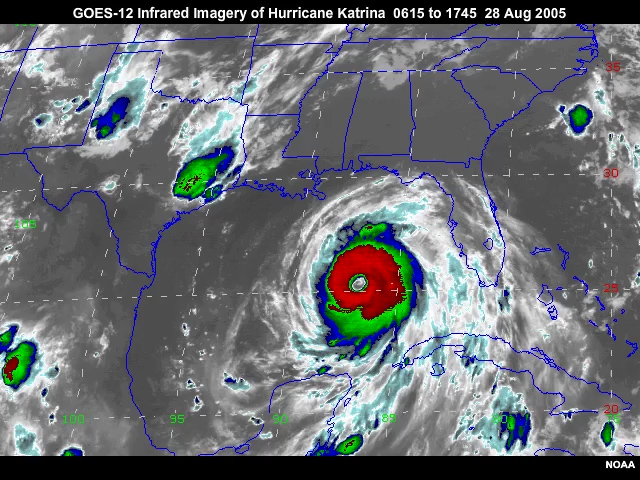
Description:
A GOES-12 10.7 micrometer infrared imagery animation of hurricane Katrina over the Gulf of Mexico as the storm approaches maximum intensity from 0615 to 1745 on August 28, 2005.
File Name:
28aug05_g12_ir4_katrina_ani1.mp4
Credits:
NOAA
Copyright Terms:
COMET Standard Terms of Use
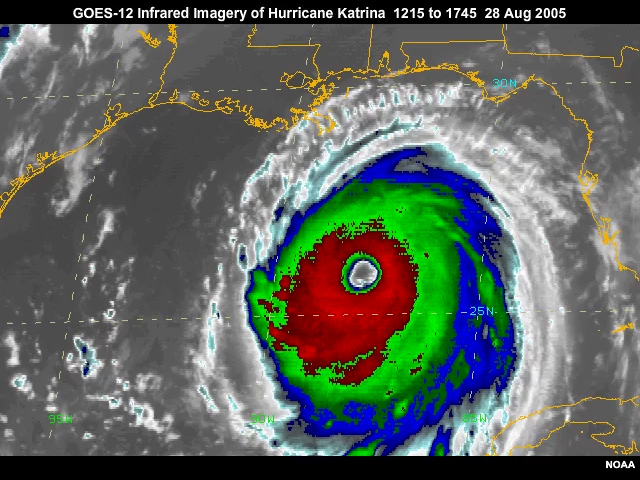
Description:
A GOES-12 full resolution 4km 10.7 micrometer infrared imagery animation of hurricane Katrina over the Gulf of Mexico as the storm approaches maximum intensity from 1215 to 1745 on August 28, 2005.
File Name:
28aug05_g12_ir4_katrina_ani2.mp4
Credits:
NOAA
Copyright Terms:
COMET Standard Terms of Use
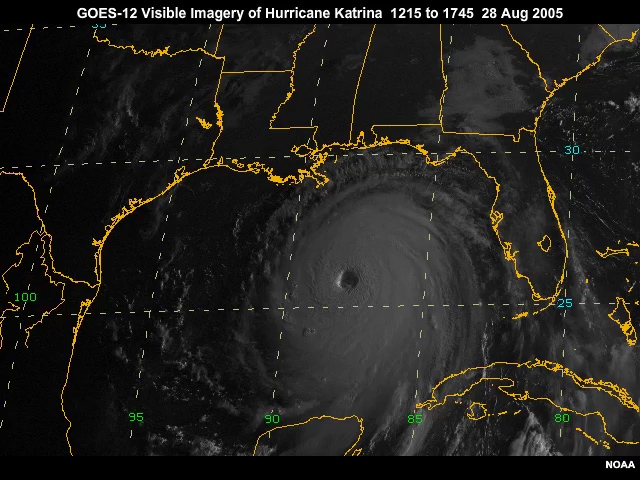
Description:
A GOES-12 visbile imagery animation of hurricane Katrina over the Gulf of Mexico as the storm approaches maximum intensity from 1215 to 1745 on August 28, 2005.
File Name:
28aug05_g12_vis_katrina_ani.mp4
Credits:
NOAA
Copyright Terms:
COMET Standard Terms of Use
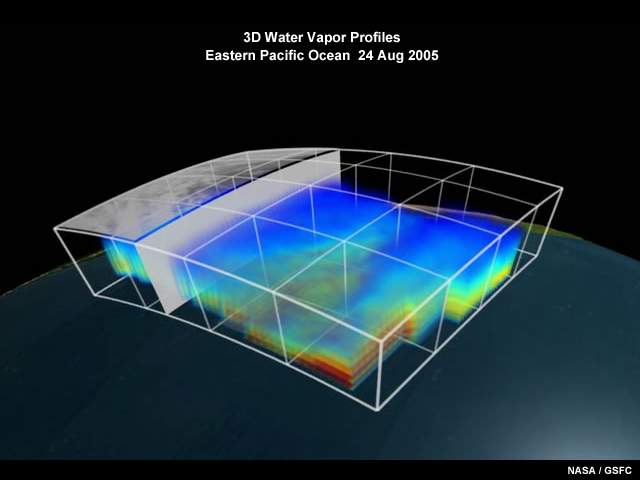
Description:
Three dimensional view of water vapor profiles constructed from the NASA AIRS hyperspectral sounder taken on 24 August, 2005.
File Name:
3d_water_vapor.jpg
Credits:
NASA / GSFC
Copyright Terms:
COMET Standard Terms of Use
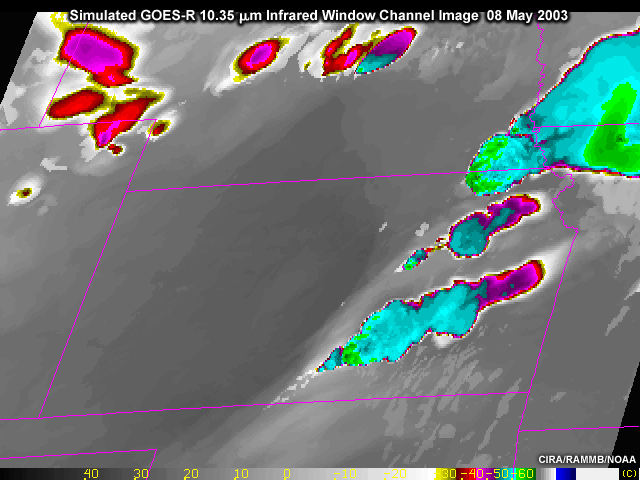
Description:
A simulated GOES-R 10.35 micrometer infrared window channel image for 2325 UTC on May 8, 2003. Image shows multiple mature thunderstorms with overshooting tops and "enhanced V" signatures indicating the potential for severe thunderstorm conditions.
File Name:
8may2003_sim_goesr_1035ir.jpg
Credits:
CIRA/RAMMB/NOAA
Copyright Terms:
COMET Standard Terms of Use
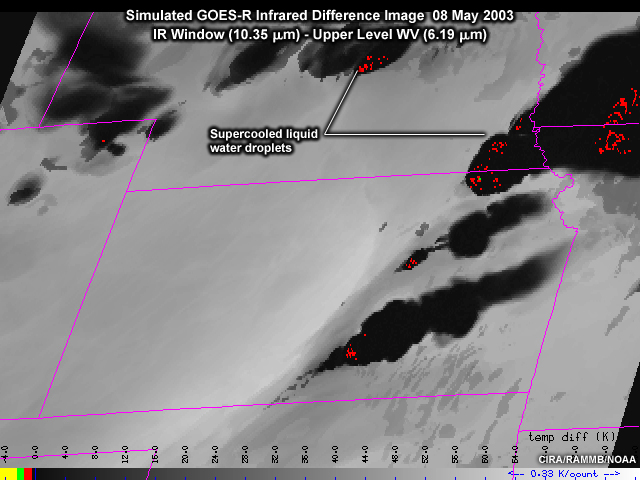
Description:
A simulated GOES-R difference image of the 10.35 and 6.19 micrometer infrared channels for 2325 UTC on May 8, 2003. Image shows multiple mature thunderstorms with overshooting tops and areas where cloud tops contain supercooled liquid water droplets (red coloring).
File Name:
8may2003_sim_goesr_cloud_top_diff.jpg
Credits:
CIRA/RAMMB/NOAA
Copyright Terms:
COMET Standard Terms of Use
Description:
Movie discussing how the GOES-R ABI will improve air quality monitoring
File Name:
abi_airquality.mp4
Credits:
The COMET Program...
Copyright Terms:
COMET Standard Terms of Use
Description:
Movie discussing how the GOES-R ABI will improve the forecasting of cloud icing for aviation
File Name:
abi_aviation.mp4
Credits:
The COMET Program...
Copyright Terms:
COMET Standard Terms of Use
Description:
Movie discussing how the GOES-R ABI will improve climate monitoring
File Name:
abi_climate.mp4
Credits:
The COMET Program...
Copyright Terms:
COMET Standard Terms of Use
Description:
Movie discussing how the GOES-R ABI will improve coastal and marine monitoring and forecasting
File Name:
abi_coastmarine.mp4
Credits:
The COMET Program...
Copyright Terms:
COMET Standard Terms of Use
Description:
Movie discussing how the GOES-R ABI will improve the nowcasting of convection
File Name:
abi_convection.mp4
Credits:
The COMET Program...
Copyright Terms:
COMET Standard Terms of Use
Description:
Movie discussing how the GOES-R ABI will improve the monitoring of wildfires
File Name:
abi_fire.mp4
Credits:
The COMET Program...
Copyright Terms:
COMET Standard Terms of Use
Description:
Movie discussing how the GOES-R ABI will improve the forecasting of flood potential
File Name:
abi_flood.mp4
Credits:
The COMET Program...
Copyright Terms:
COMET Standard Terms of Use
Description:
Movie discussing how the GOES-R ABI will improve the nowcasting of fog and low visibility
File Name:
abi_fog.mp4
Credits:
The COMET Program...
Copyright Terms:
COMET Standard Terms of Use
Description:
Movie discussing how the GOES-R ABI will improve the monitoring and forecasting of hurricanes
File Name:
abi_hurricane.mp4
Credits:
The COMET Program...
Copyright Terms:
COMET Standard Terms of Use

Description:
Movie introducing the GOES-R ABI module
File Name:
abi_intro.mp4
Credits:
The COMET Program...
Copyright Terms:
COMET Standard Terms of Use
Description:
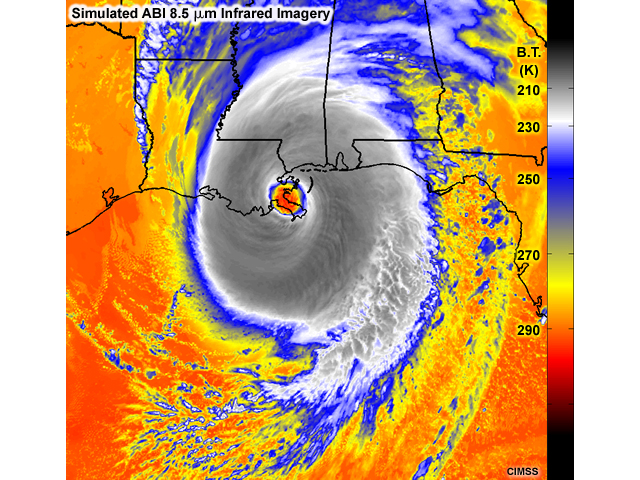
Simulated GOES-R Advanced Baseline Imager (ABI) 8.5 micrometer infrared ch. 11 image of hurricane Katrina as it is making landfall in southeast Louisiana on 29 August 2005.
File Name:
ABI_Katrina.jpg
Credits:
CIMSS
Copyright Terms:
COMET Standard Terms of Use
Description:
Movie discussing how the GOES-R ABI will improve the monitoring of land cover
File Name:
abi_land.mp4
Credits:
The COMET Program...
Copyright Terms:
COMET Standard Terms of Use
Description:
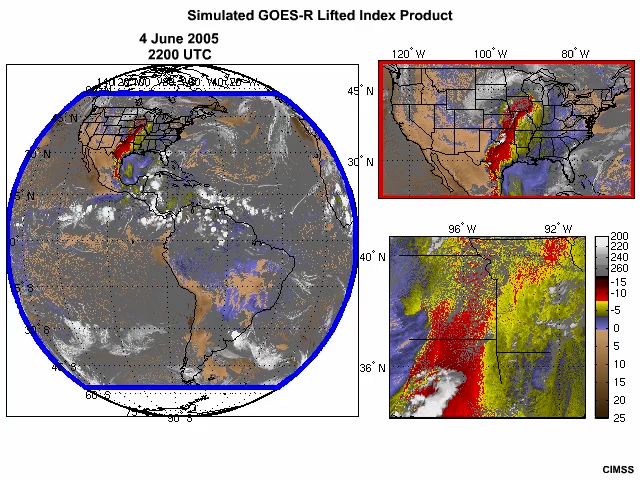
Simulated GOES-R lifted index derived product imagery comparing full disk, Conus, and mesoscale sector coverages and update rates for a two period on June 4, 2005.
File Name:
abi_lidpi_flexmode3_scanning.mp4
Credits:
CIMSS
Copyright Terms:
COMET Standard Terms of Use
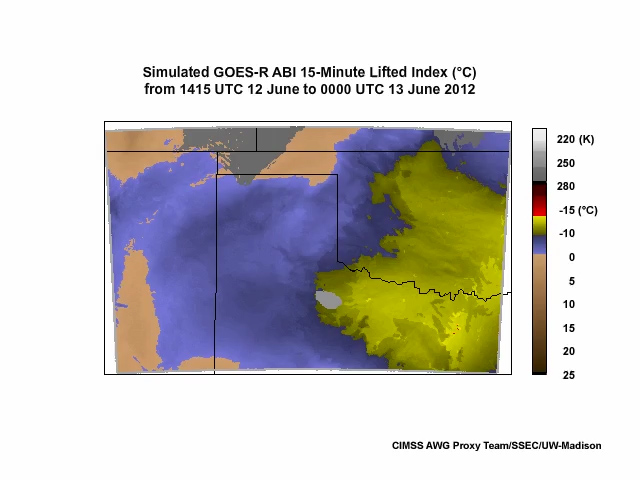
Description:
Simulation of GOES-R ABI Lifted Index from 1415 UTC 12 June 2002 to 0000 UTC 13 June 2002
File Name:
abi_simulated_lifted_index_june2002.mp4
Credits:
CIMSS AWG Proxy Team/SSEC/UW-Madison
Copyright Terms:
COMET Standard Terms of Use
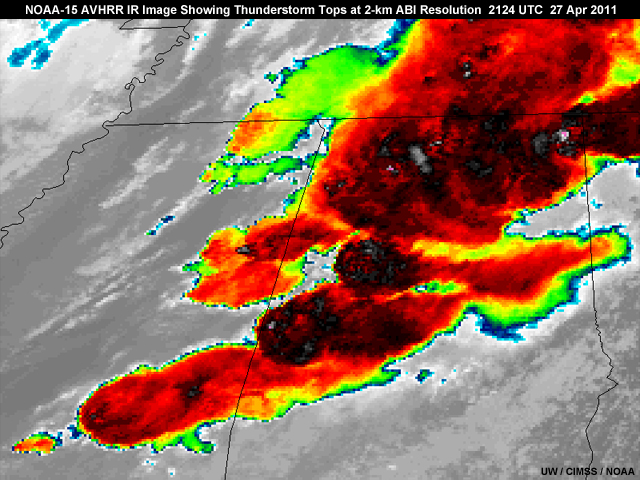
Description:
NOAA-15 AVHRR IR image showing thunderstorm tops at the GOES-R ABI 2-km IR resolution, taken at 2124 UTC, on April 27, 2011
File Name:
abi_vs_goes_ir_thunderstorm_tops_abi.jpg
Credits:
UW/CIMSS/NOAA
Copyright Terms:
COMET Standard Terms of Use
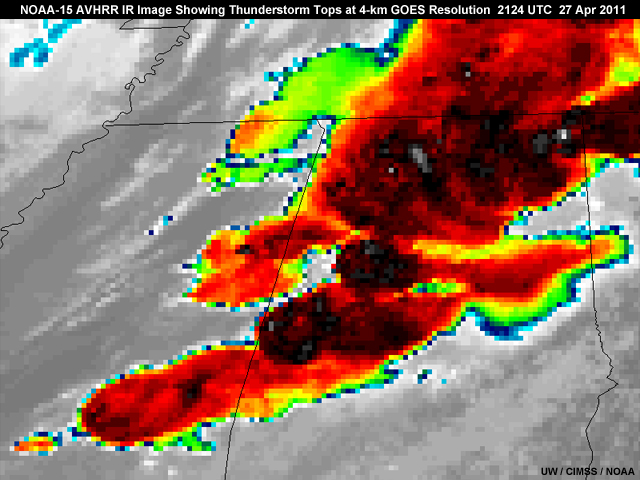
Description:
NOAA-15 AVHRR IR image showing thunderstorm tops at the GOES (8-15) 4km IR resolution taken at 2124 UTC, on April 27, 2011.
File Name:
abi_vs_goes_ir_thunderstorm_tops_goes.jpg
Credits:
UW/CIMSS/NOAA
Copyright Terms:
COMET Standard Terms of Use
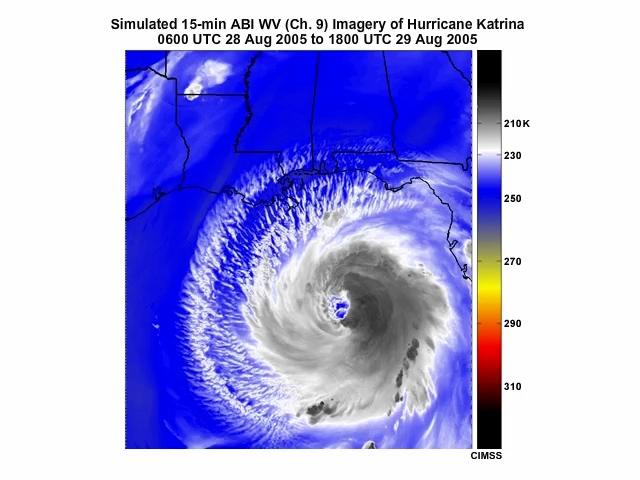
Description:
Animation of simulated ABI 6.95 micrometer (channel 9) water vapor imagery showing Hurricane Katrina from 0600 UTC 28 Aug 2005 to 1800 UTC 29 Aug 2005.
File Name:
abi_wv_ani_katrina_0828_0829_2005.mp4
Credits:
CIMSS
Copyright Terms:
COMET Standard Terms of Use
Description:
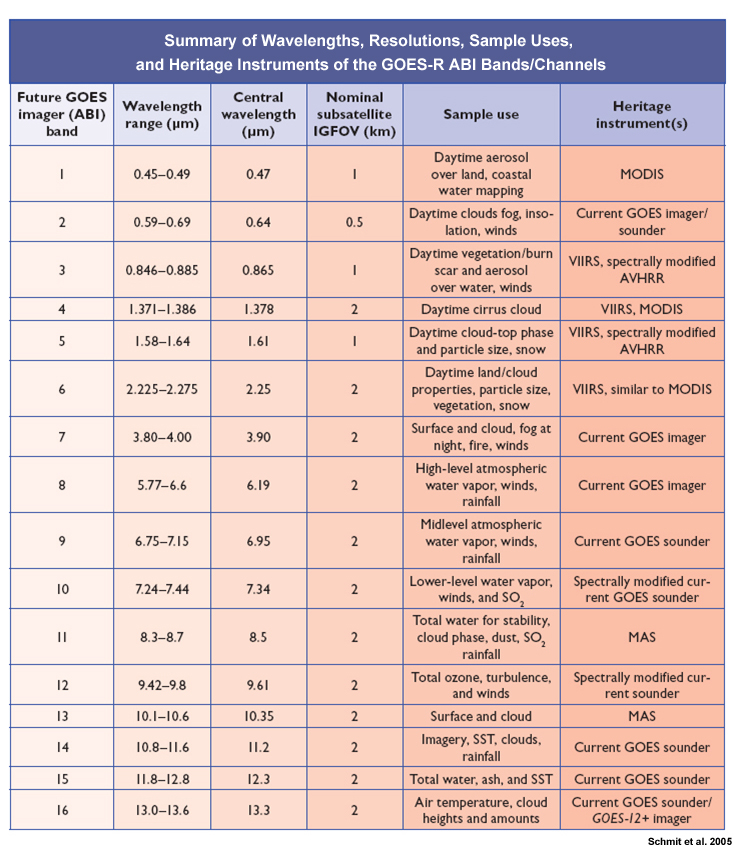
Table summarizing the wavelengths, resolutions, sample uses, and heritage instruments of the GOES-R ABI bands/channels.
File Name:
ABI-tech-summary.jpg
Credits:
Schmit et al. 2005
Copyright Terms:
COMET Standard Terms of Use
Description:
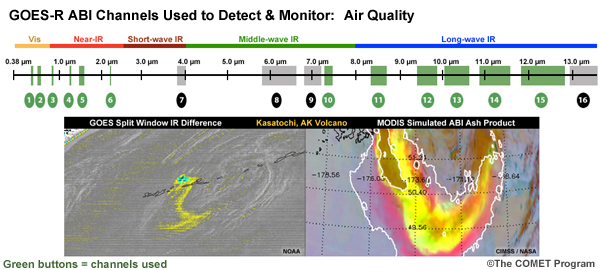
Information about the GOES-R ABI channels used to detect and monitor air quality with sample images showing anticipated improvements (a GOES split window IR difference vs. a MODIS simulated ABI ash product showing the Kasatochi AK volcano)
File Name:
application_channels_airqual.jpg
Credits:
The COMET Program, NOAA, CIMSS, NASA
Copyright Terms:
COMET Standard Terms of Use
Description:
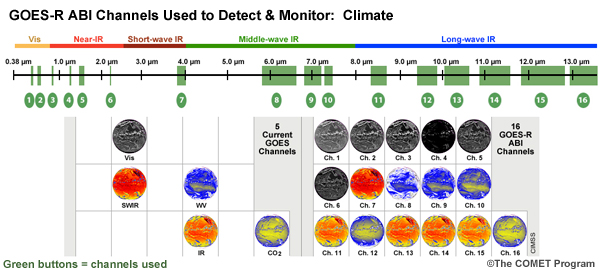
Information about the GOES-R ABI channels used to detect and monitor climate with images showing the 5 current GOES channels and the 16 GOES-R ABI channels
File Name:
application_channels_climate.jpg
Credits:
The COMET Program, CIMSS
Copyright Terms:
COMET Standard Terms of Use
Description:
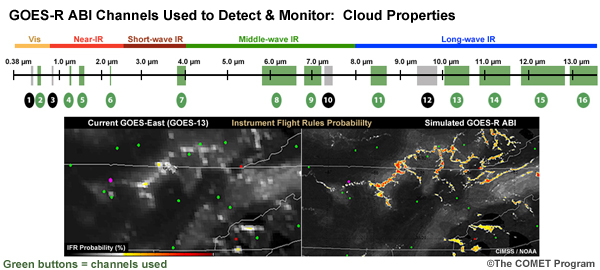
Information about the GOES-R ABI channels used to detect and monitor cloud properties with sample images showing anticipated improvements (current GOES-East and simulated GOES-R ABI images showing instrument flight rules probabilities)
File Name:
application_channels_cloudprop.jpg
Credits:
The COMET Program, CIMSS/NOAA
Copyright Terms:
COMET Standard Terms of Use
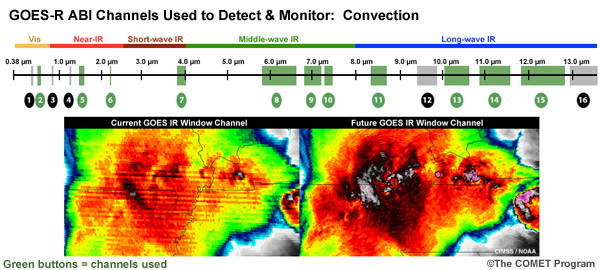
Description:
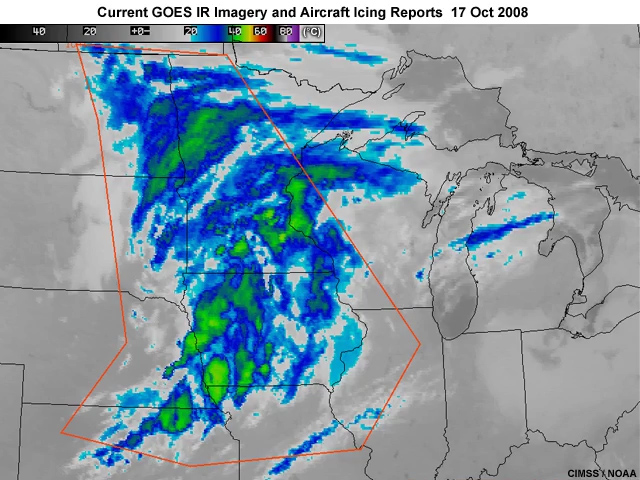
Information about the GOES-R ABI channels used to detect and monitor convection with sample images showing anticipated improvements (current vs future GOES IR window channel images of a thunderstorm complex in the Midwest on May 25, 2000)
File Name:
application_channels_convection.jpg
Credits:
The COMET Program, CIMSS, NOAA
Copyright Terms:
COMET Standard Terms of Use
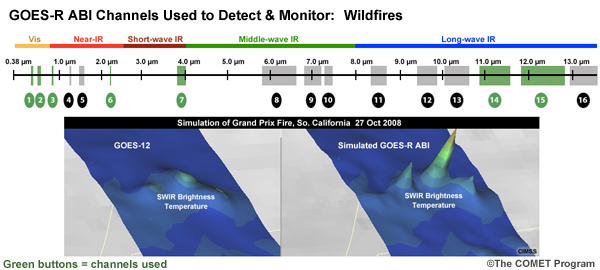
Description:
Information about the GOES-R ABI channels used to detect and monitor wildfires with sample images showing anticipated improvements (GOES-12 vs simulated GOES-R ABI simulations of the Grand Prix fire in Southern CA on 27 Oct 2008)
File Name:
application_channels_fires.jpg
Credits:
The COMET Program, CIMSS
Copyright Terms:
COMET Standard Terms of Use
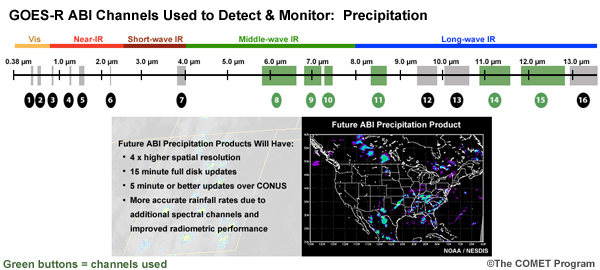
Description:
Information about the GOES-R ABI channels used to detect and monitor precipitation with an image showing a future ABI precipitation product
File Name:
application_channels_precip.jpg
Credits:
The COMET Program, NOAA, NESDIS
Copyright Terms:
COMET Standard Terms of Use
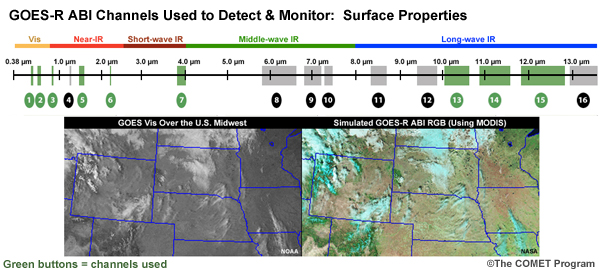
Description:
Information about the GOES-R ABI channels used to detect and monitor surface properties with sample images showing anticipated improvements (a GOES visible image over the U.S. Midwest and a simulated GOES-R ABI RGB made from MODIS over the same area)
File Name:
application_channels_sfcprop.jpg
Credits:
The COMET Program, NOAA, NASA
Copyright Terms:
COMET Standard Terms of Use
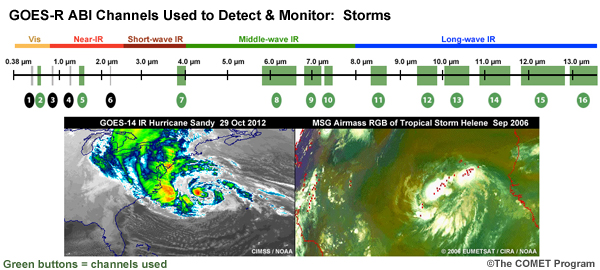
Description:
Information about the GOES-R ABI channels used to detect and monitor storms with sample images showing anticipated improvements (a GOES-14 IR image of Hurricane Sandy on 29 Oct 2012 and an MSG Airmass RGB of tropical storm Helene in Sept 2006)
File Name:
application_channels_storms.jpg
Credits:
The COMET Program, CIMSS, NOAA, CIRA, EUMETSAT
Copyright Terms:
COMET Standard Terms of Use
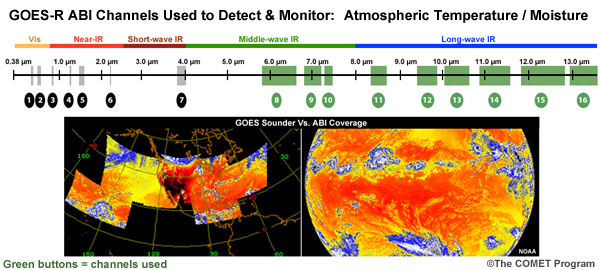
Description:
Information about the GOES-R ABI channels used to detect and monitor atmospheric temperature and moisture with sample images showing anticipated improvements (GOES sounder vs. ABI coverage)
File Name:
application_channels_tempmoist.jpg
Credits:
The COMET Program, NOAA
Copyright Terms:
COMET Standard Terms of Use
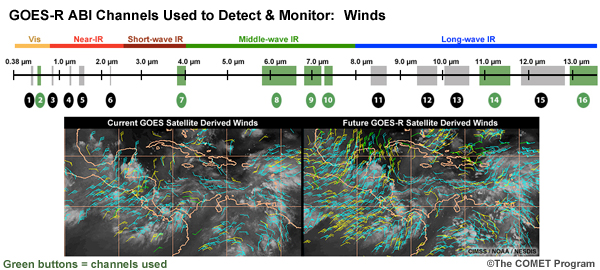
Description:
Information about the GOES-R ABI channels used to detect and monitor winds with sample images showing anticipated improvements (current GOES vs future GOES-R satellite derived winds)
File Name:
application_channels_winds.jpg
Credits:
The COMET Program, CIMSS, NOAA, NESDIS
Copyright Terms:
COMET Standard Terms of Use
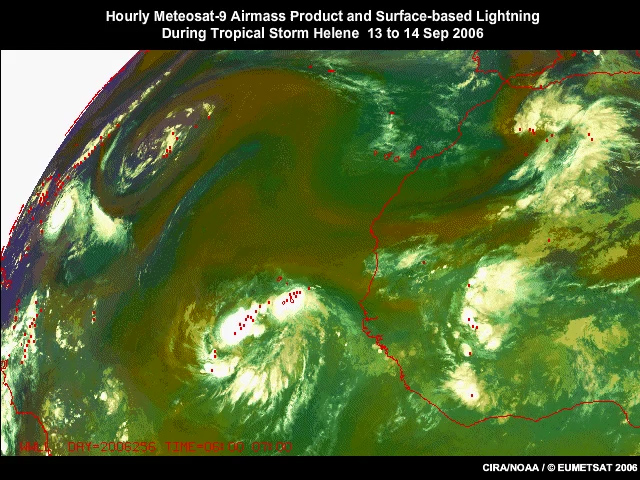
Description:
Hourly animation of the Meteosat-9 SEVIRI airmass RGB product and surface based lightning during tropical storm Helene from 13 to 14 September, 2006.
File Name:
atl_hurr_lightning_ani.mp4
Credits:
CIRA/NOAA/� EUMETSAT 2006
Copyright Terms:
COMET Standard Terms of Use
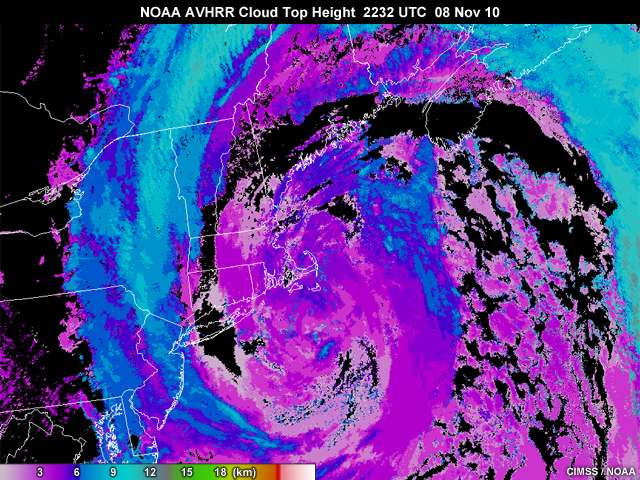
Description:
A northeast U.S. coastal storm as seen with a cloud top height product produced from the NOAA AVHRR at 22:32 UTC on 8 November, 2010.
File Name:
avhrr_cloud_layers_08nov10.jpg
Credits:
CIMSS / NOAA
Copyright Terms:
COMET Standard Terms of Use
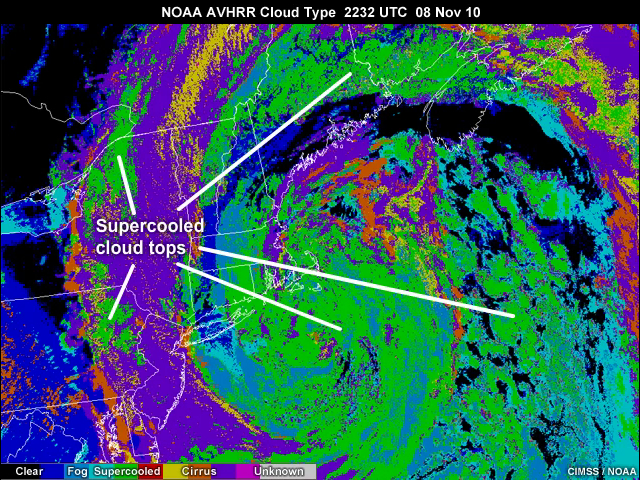
Description:
A northeast U.S. coastal storm as seen with a cloud type product produced from the NOAA AVHRR at 22:32 UTC on 8 November, 2010.
File Name:
avhrr_cloud_type_08nov10.jpg
Credits:
CIMSS / NOAA
Copyright Terms:
COMET Standard Terms of Use
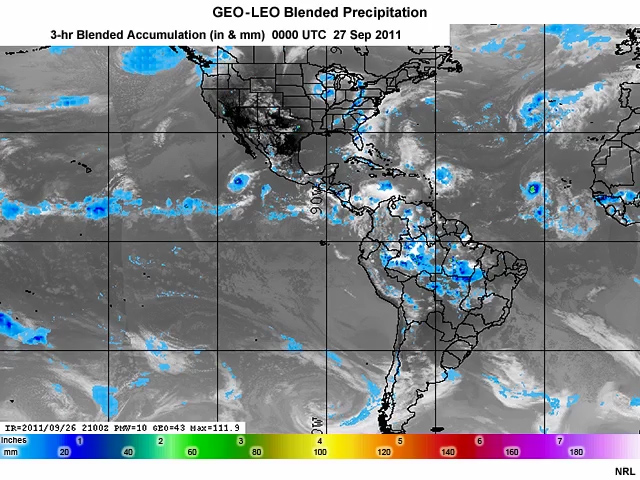
Description:
Three-hourly blended geostationary and polar-orbiting satellite rainfall accumulation product animation every three hours from 00 to 00 UTC, September 27 to 28, 2011.
File Name:
blended_rainrate_ani.mp4
Credits:
NRL
Copyright Terms:
COMET Standard Terms of Use
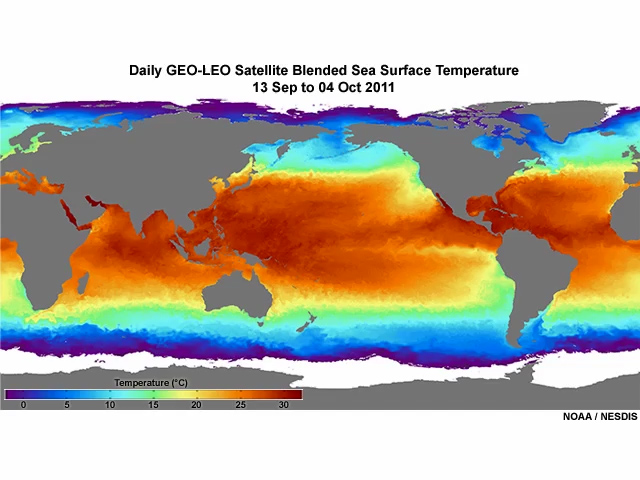
Description:
30-day blended geostationary and polar-orbiting satellite sea surface temperature analysis animation for September 13 to October 04, 2011.
File Name:
blended_sst.mp4
Credits:
NOAA / NESDIS
Copyright Terms:
COMET Standard Terms of Use
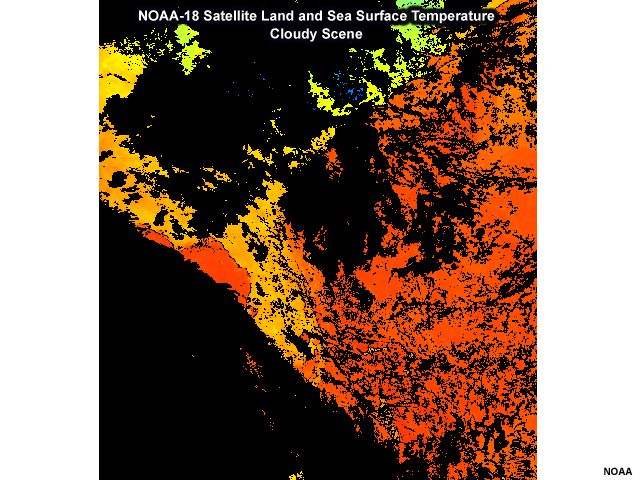
Description:
Southeast U.S. view of sea surface temperatures from NOAA-18 AVHRR. The scene is contaminated with cloud cover, leaving only a small area of the image to contain sea surface temperatures.
File Name:
cloudy_SST_scene_NOAA18.jpg
Credits:
NOAA
Copyright Terms:
COMET Standard Terms of Use
Description:
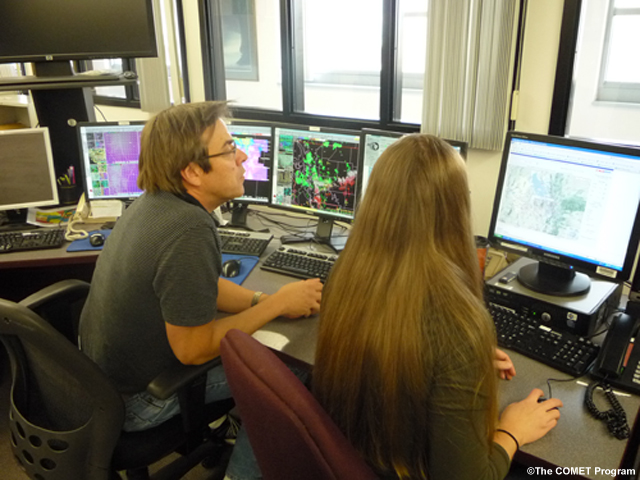
photo of forecasters on shift at National Weather Service Weather Forecast Office
File Name:
comet_P1010080.jpg
Credits:
�The COMET Program
Copyright Terms:
COMET Standard Terms of Use
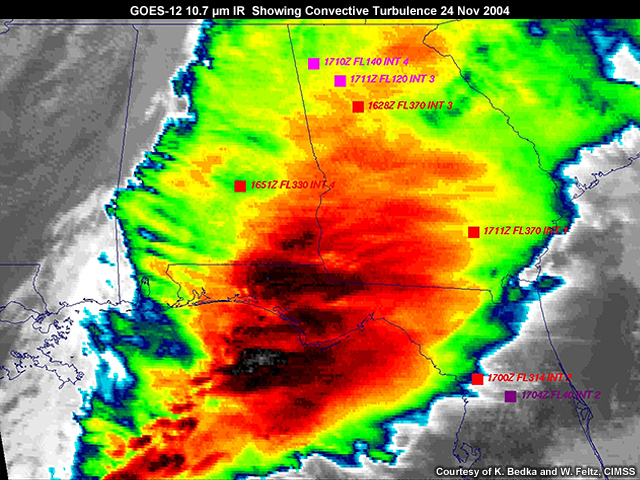
Description:
GOES-12 10.7 micrometer IR image showing convective turbulence on 24 Nov 2004.
File Name:
conv_turbulence_sim_abi_ir_24nov04_ir.jpg
Credits:
Courtesy of Bedka and Feltz, CIMSS
Copyright Terms:
COMET Standard Terms of Use
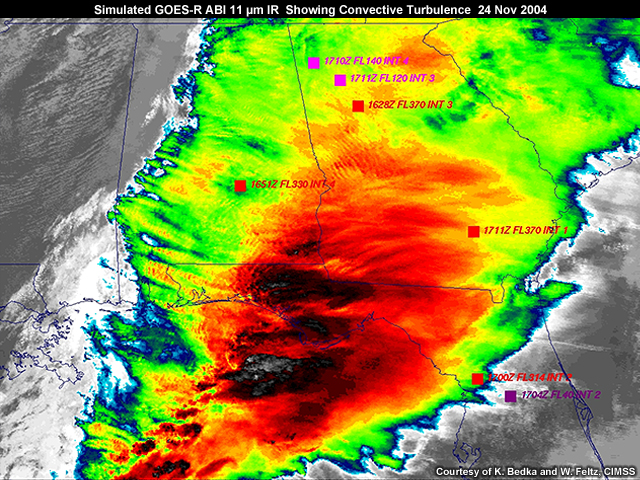
Description:
Simulated GOES-R ABI 11 micrometer IR image showing convective turbulence on 24 Nov 2004.
File Name:
conv_turbulence_sim_abi_ir_24nov04_simIR.jpg
Credits:
Courtesy of Bedka and Feltz, CIMSS
Copyright Terms:
COMET Standard Terms of Use
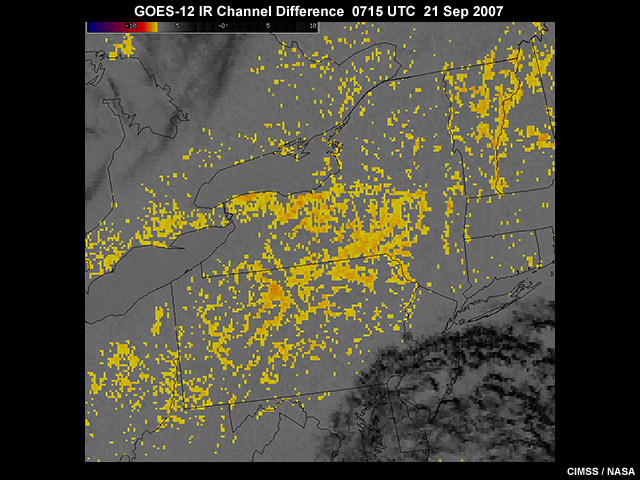
Description:
GOES-12 10.7 minus 3.9 micrometer channel difference product showing valley fog image over the Northeast U.S. at 07:15 UTC on September 21, 2007.
File Name:
Current_vs_Future_GOES_Fog_1.jpg
Credits:
CIMSS / NOAA
Copyright Terms:
COMET Standard Terms of Use
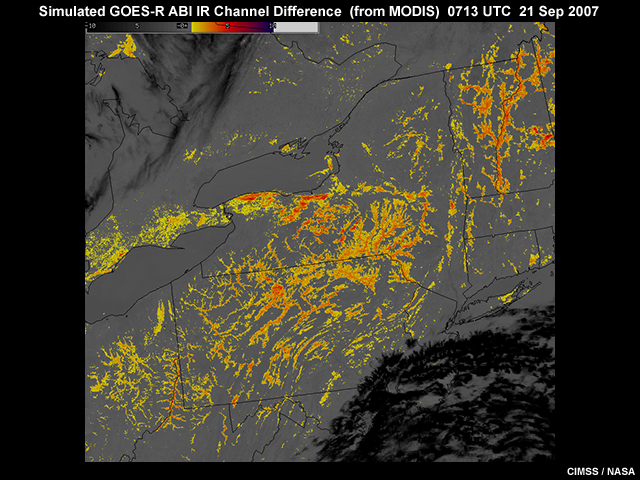
Description:
Simulated GOES-R 3.7 minus 11 micrometer channel difference product (from Aqua MODIS) showing nighttime valley fog over the Northeast U.S. at 07:13 UTC on September 21, 2007.
File Name:
Current_vs_Future_GOES_Fog_2.jpg
Credits:
CIMSS / NASA
Copyright Terms:
COMET Standard Terms of Use
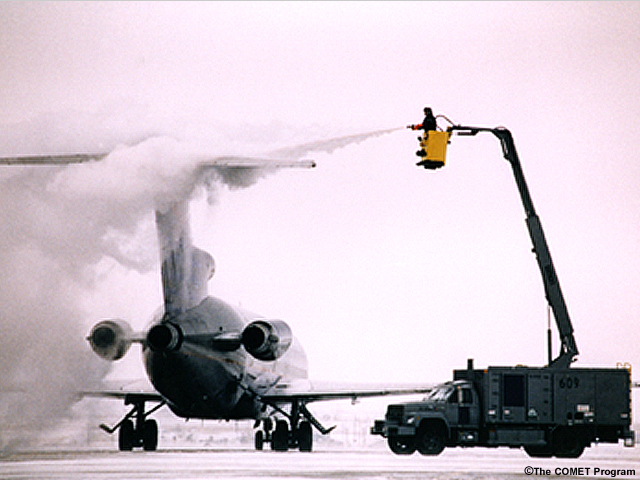
Description:
Person spraying deicer on a plane.
File Name:
deice2.jpg
Credits:
� The COMET Program
Copyright Terms:
COMET Standard Terms of Use
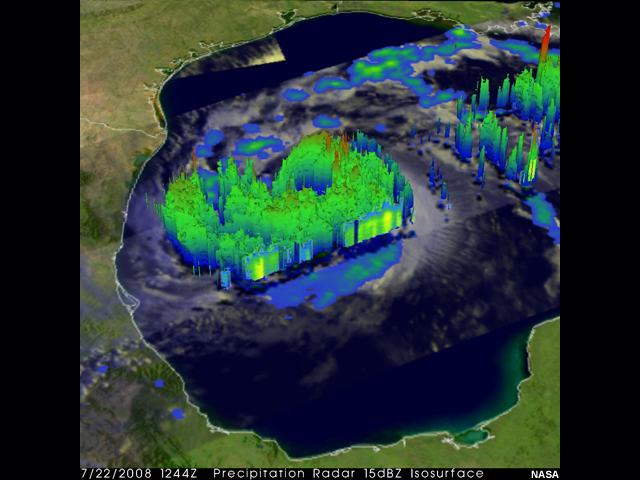
Description:
Satellite derived data showing Hurricane Dolly over the Gulf of Mexico nearing the Texas Coast. The 15dBZ isosurface is outlined three-dimensionally showing the different areas of the storm where the reflectivity is large, really emphasizing the structure of the storm.
File Name:
Dolly_TRMM_PR_15dbz_isosurface.jpg
Credits:
NASA
Copyright Terms:
COMET Standard Terms of Use
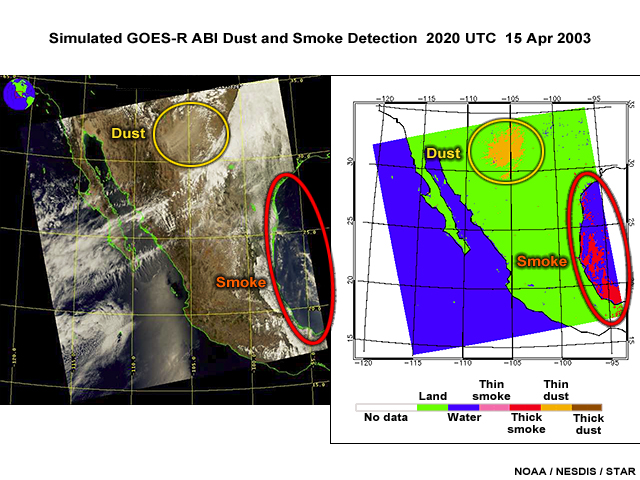
Description:
On the left, an Aqua MODIS rue color image showing indications of dust and smoke over portions of Mexico on April 15, 2003 at approximately 20:20 UTC. On the right, the results of the dust test where pixels flagged as dusty are colored orange and those flagged as smokey are colord red.
File Name:
dust_smoke_products_15apr03.jpg
Credits:
NOAA / NESDIS / STAR
Copyright Terms:
COMET Standard Terms of Use
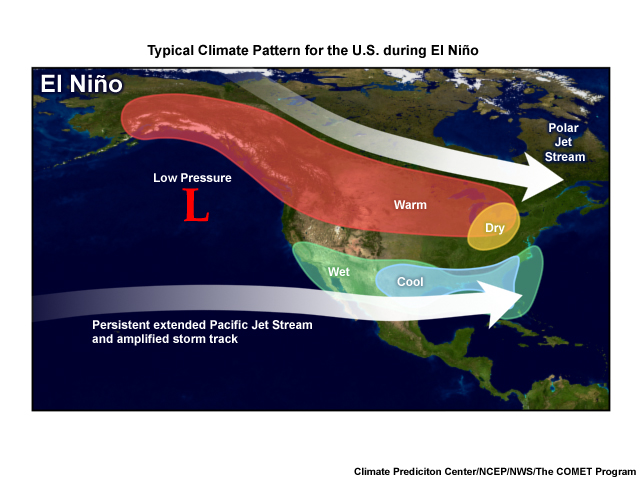
Description:
Typical climate patterns over the United States during El Ni�o situations. This includes warmer conditions in the Northern Tier and Great Lakes states all the way up to southern Alaska. Drier conditions prevail in the Southern Great lakes. The southern third of the US experiences wetter conditions and the Southeast US experiences cooler than average temperatures.
File Name:
El_nino_wx_patterns.jpg
Credits:
Climate Prediciton Center/NCEP/NWS/The COMET Program
Copyright Terms:
COMET Standard Terms of Use
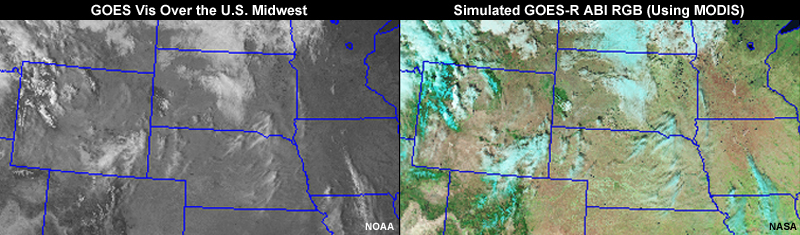
Description:
GOES-13 visible image (left) and simulated GOES-R ABI RGB (using MODIS) over the Midwest U.S. for 1945 UTC on October 31, 2012.
File Name:
explore_sfc_properties.jpg
Credits:
NOAA (left panel) NASA (right panel)
Copyright Terms:
COMET Standard Terms of Use
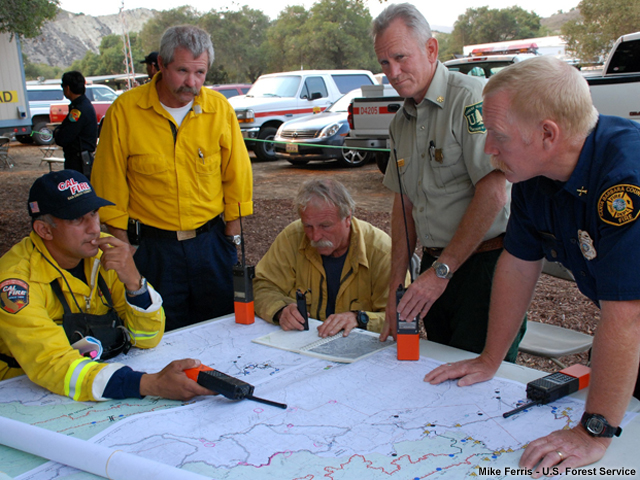
Description:
Fire managers and fire fighters planning preparations for the remainder of the day over maps.
File Name:
Fire_Manager_planning.jpg
Credits:
Mike Ferris - U.S. Forest Service
Copyright Terms:
COMET Standard Terms of Use
Description:
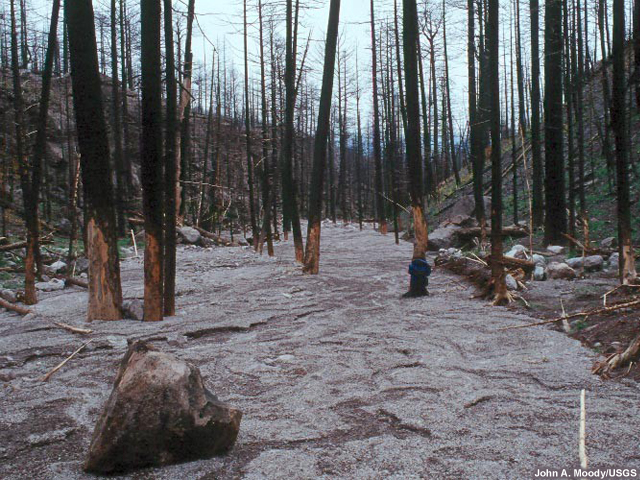
Flash flood damage in burn area with mud and rock layered over the ground.
File Name:
Flash_Flood_mud_through_burn_scar.jpg
Credits:
John A. Moody/USGS
Copyright Terms:
COMET Standard Terms of Use
Description:
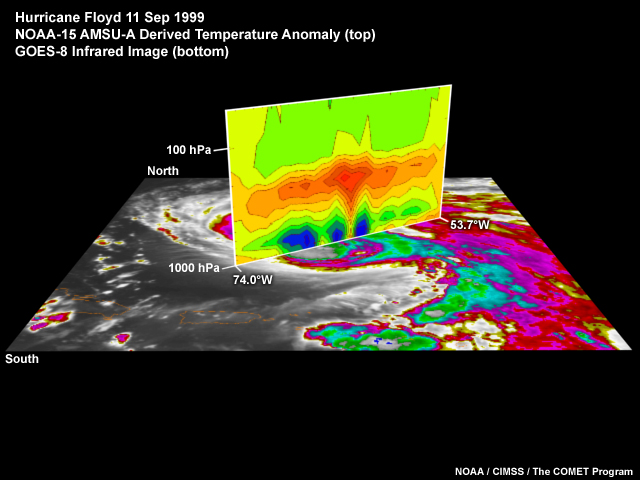
3D illustration of geostationary and polar-orbiting satellite synergy that combines a GOES infrared image with a NOAA AMSU-A derived temperature anomaly cross section for hurricane Floyd on September 11, 1999.
File Name:
floyd_geo_leo_synergy.jpg
Credits:
NOAA / CIMSS / The COMET Program
Copyright Terms:
COMET Standard Terms of Use
Description:
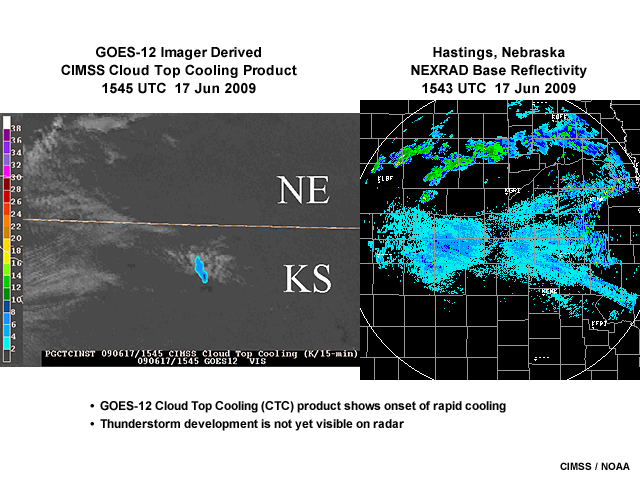
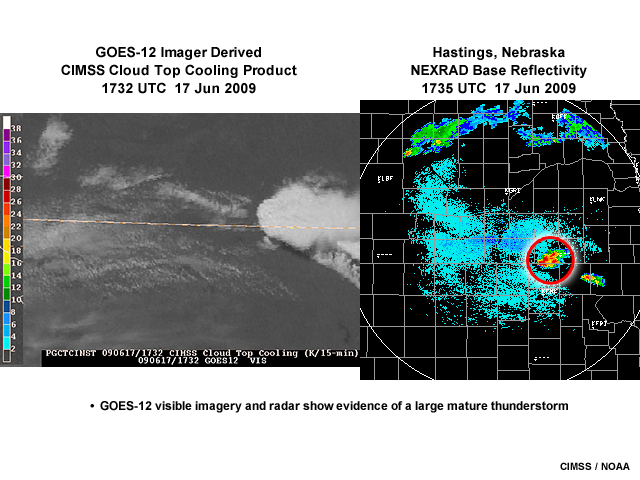
The first in a series of three 2-panel images showing the CIMSS GOES satellite-based cloud top cooling (CTC) product vs. NEXRAD radar reflectivities for thunderstorms forming along the Kansas-Nebraska border from 1545 to 1732 UTC on June 17, 2009.
File Name:
g12_ctc_17jun09_01.jpg
Credits:
CIMSS / NOAA
Copyright Terms:
COMET Standard Terms of Use
Description:
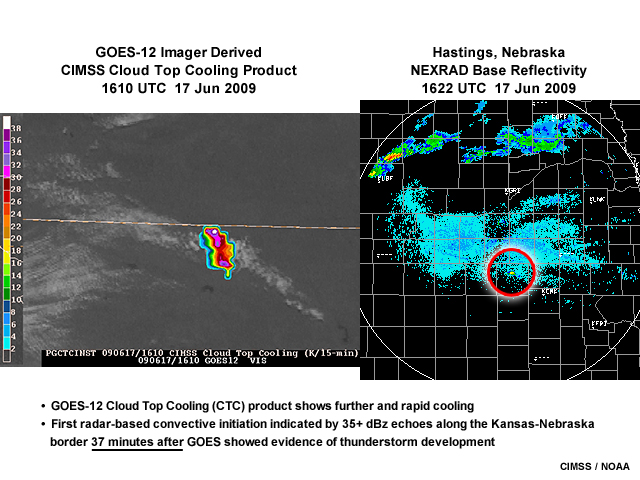
The second in a series of three 2-panel images showing the CIMSS GOES satellite-based cloud top cooling (CTC) product vs. NEXRAD radar reflectivities for thunderstorms forming along the Kansas-Nebraska border from 1545 to 1732 UTC on June 17, 2009.
File Name:
g12_ctc_17jun09_02.jpg
Credits:
CIMSS / NOAA
Copyright Terms:
COMET Standard Terms of Use
Description:
The third in a series of three 2-panel images showing the CIMSS GOES satellite-based cloud top cooling (CTC) product vs. NEXRAD radar reflectivities for thunderstorms forming along the Kansas-Nebraska border from 1545 to 1732 UTC on June 17, 2009.
File Name:
g12_ctc_17jun09_03.jpg
Credits:
CIMSS / NOAA
Copyright Terms:
COMET Standard Terms of Use
Description:
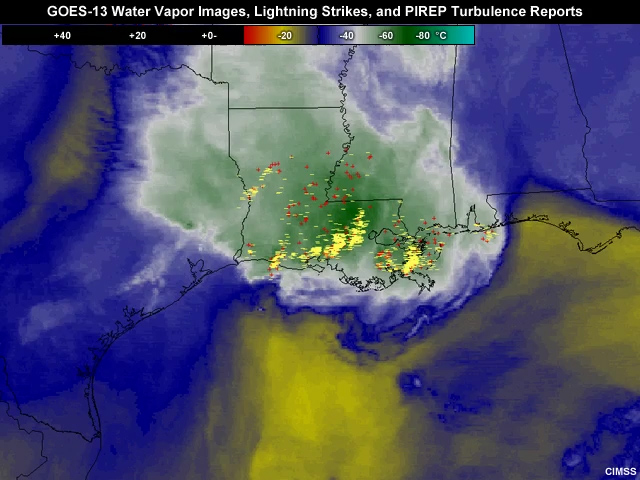
GOES-13 Water Vapor Images, Lightning Strikes, and PIREP Turbulence Reports
File Name:
g13_wv_ltg_04apr12.mp4
Credits:
CIMSS
Copyright Terms:
COMET Standard Terms of Use
Description:
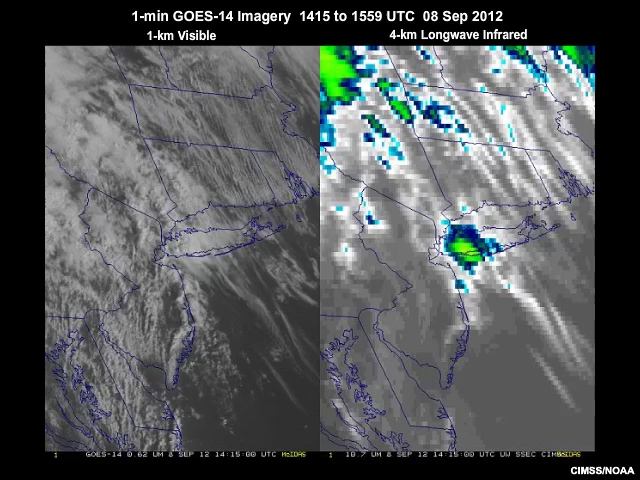
Animation of 1-minute GOES-14 visible and longwave infrared channel imagery during the New York City tornado event from 14:15 to 15:59 UTC on September 8, 2012.
File Name:
g14_1min_vis_ir4_08sep12_ani.mp4
Credits:
CIMSS/NOAA
Copyright Terms:
COMET Standard Terms of Use
Description:
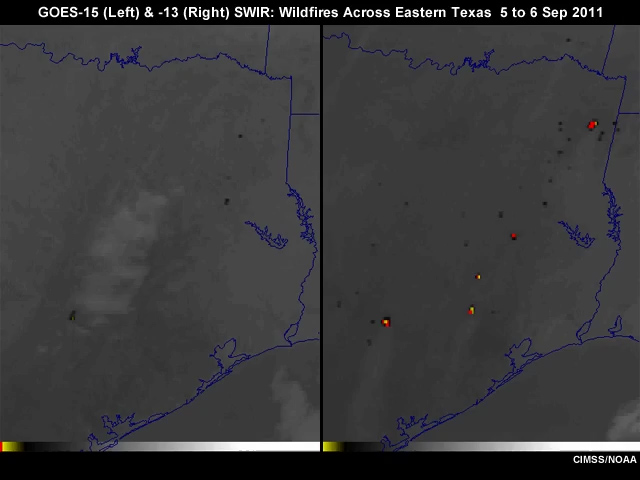
Animation of the 3.9 micrometer shortwave IR channel on GOES-15 and GOES-13 showing wildfires across eastern Texas from 5 to 6 September, 2011.
File Name:
g15_g13_swir_tx_fires_5-6_sep2011_ani.mp4
Credits:
CIMSS/NOAA
Copyright Terms:
COMET Standard Terms of Use
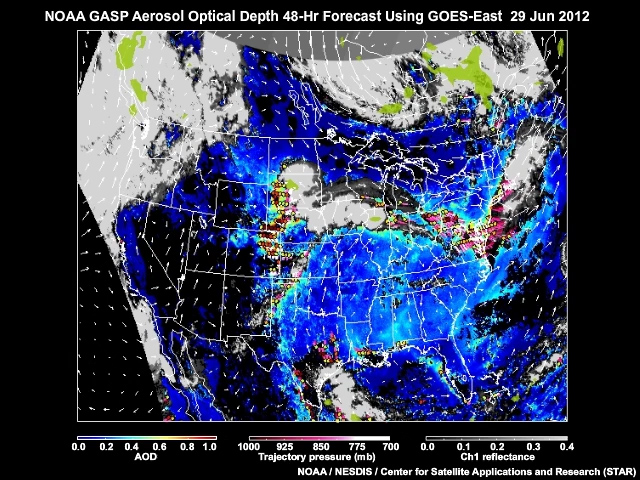
Description:
A 48-hour forecast of aerosol optical depth and trajectories based on blending satellite and ground-based measurements, meteorological observations, and computer modelling produced on June 29, 2012.
File Name:
gasp_geast_traj_fcst_29jun12_ani.mp4
Credits:
NOAA / NESDIS / Center for Satellite Applications and Research (STAR)
Copyright Terms:
COMET Standard Terms of Use
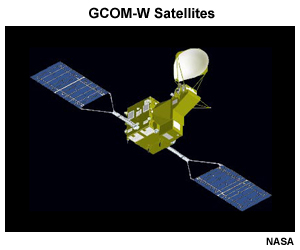
Description:
Illustration of a GCOM-W satellite. Three are planned for the series, each with a slightly different instrument configuration.
File Name:
gcom_w1_satellite.jpg
Credits:
NASA
Copyright Terms:
COMET Standard Terms of Use
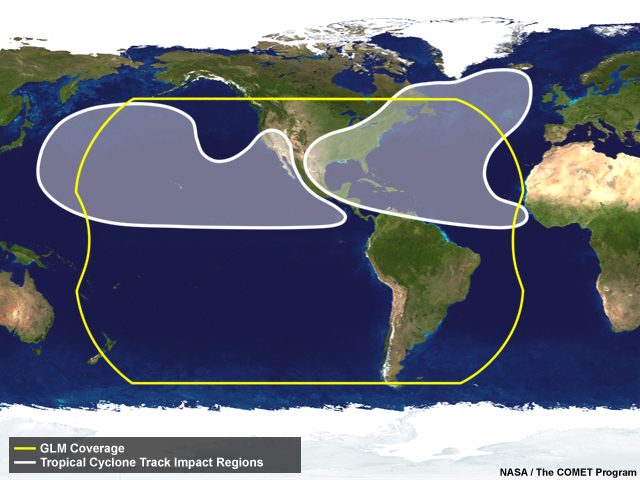
Description:
GOES view of Geostationary Lightning Mapper (GLM) coverage and hurricane impact areas.
File Name:
GLM_coverage_hurricane_impact.jpg
Credits:
NASA/The COMET Program
Copyright Terms:
COMET Standard Terms of Use
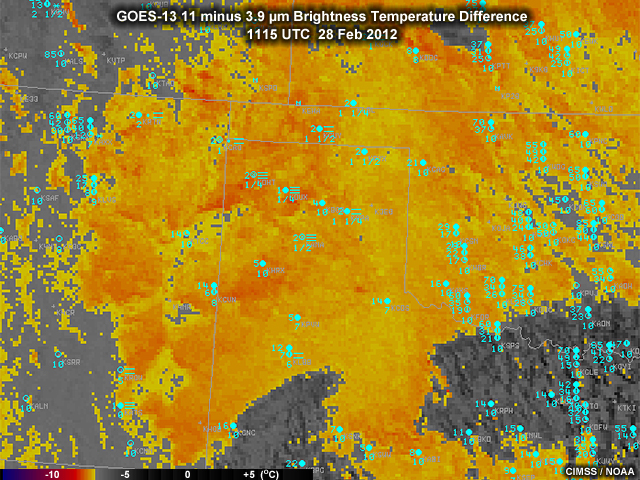
Description:
GOES-13 11 minus 3.9 micrometer brightness temperature difference image from 1115 UTC 28 February, 2012.
File Name:
goes_13_btd_28feb12.jpg
Credits:
CIMSS / NOAA
Copyright Terms:
COMET Standard Terms of Use
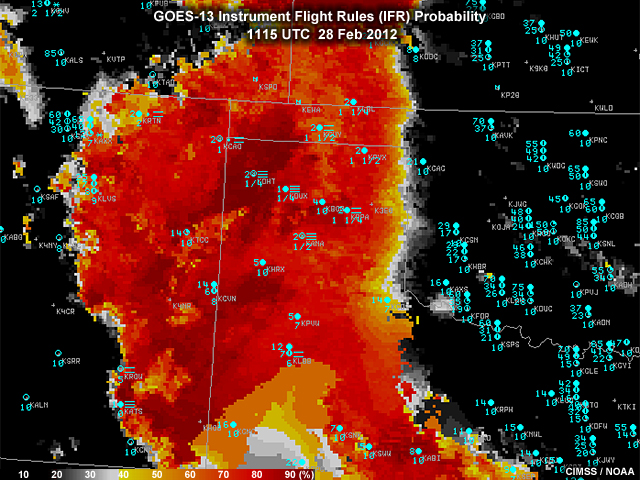
Description:
GOES-13 based product showing derived instrument flight rules probability information for 1115 UTC 28 February, 2012.
File Name:
goes_13_ifr_prob_28feb12.jpg
Credits:
CIMSS / NOAA
Copyright Terms:
COMET Standard Terms of Use
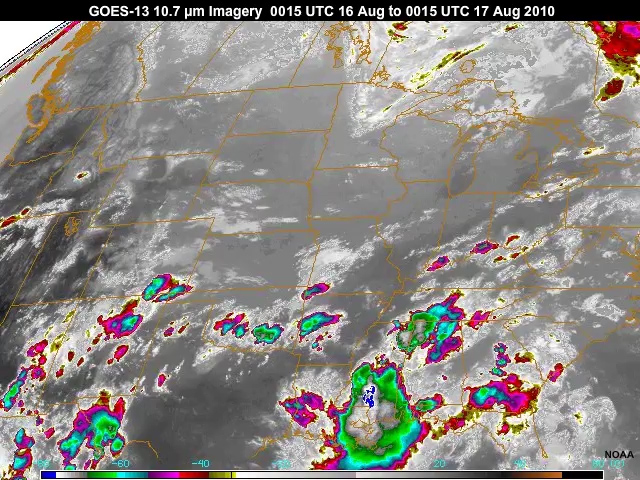
Description:
24 hour animation of GOES-13 10.7 �m imagery from 0015 UTC 16 Aug 2010 to 0015 UTC 17 Aug 2010.
File Name:
goes_24hr_ir.mp4
Credits:
NOAA
Copyright Terms:
COMET Standard Terms of Use
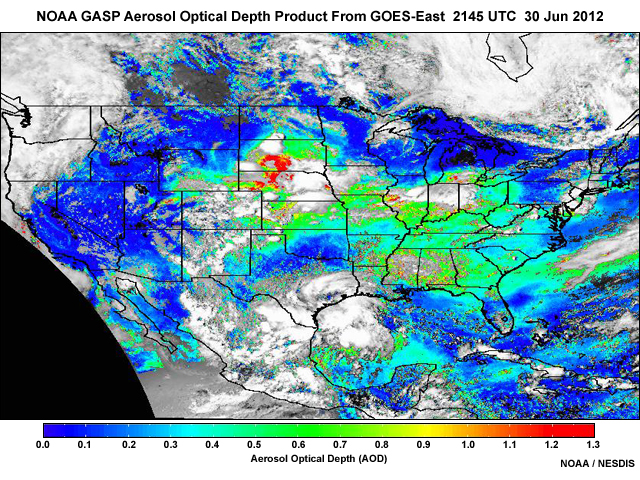
Description:
NOAA GASP aerosol optical depth product from GOES-East at 2145 UTC on June 30, 2012.
File Name:
goes_aod_30jun12.jpg
Credits:
NOAA / NESDIS
Copyright Terms:
COMET Standard Terms of Use
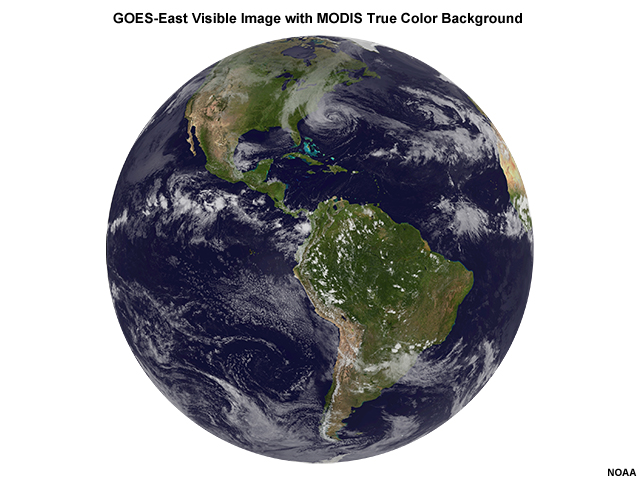
Description:
A GOES-East full disk visible image superimposed on a MODIS true-color background.
File Name:
goes_fd_sim_truecolor.jpg
Credits:
NOAA
Copyright Terms:
COMET Standard Terms of Use
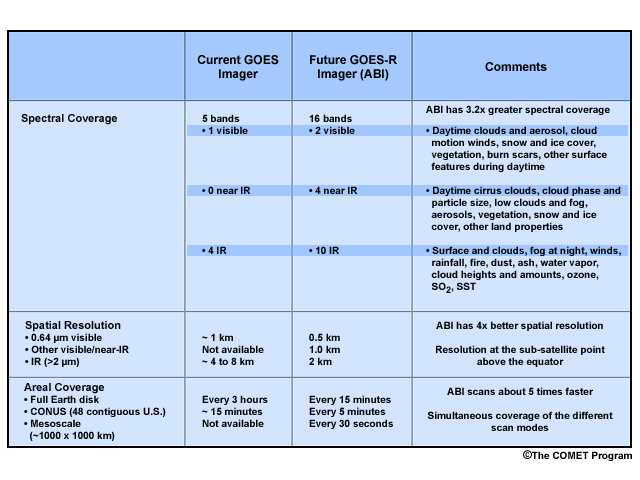
Description:
Table comparing characteristics of current GOES imager vs. the future GOES-R ABI (Advanced Baseline Imager) imager.
File Name:
goes_imager_table.jpg
Credits:
�The COMET Program
Copyright Terms:
COMET Standard Terms of Use
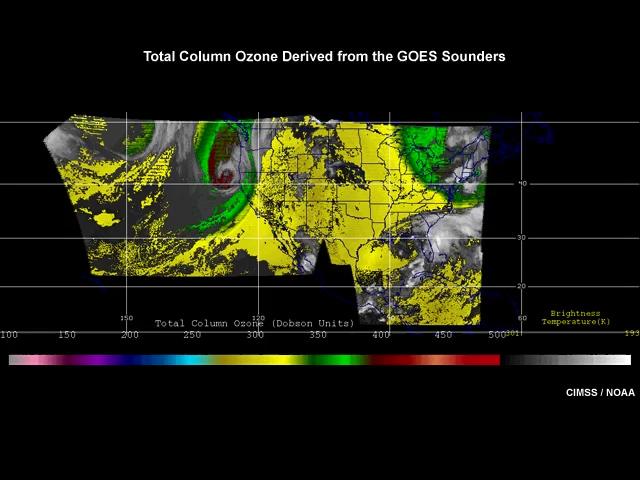
Description:
Animation of total column ozone derived from the GOES sounders.
File Name:
goes_ozone.mp4
Credits:
CIMSS / NOAA
Copyright Terms:
COMET Standard Terms of Use
Description:
Two GOES-13 3.9 micrometer images used to show pixel noise in current GOES imagery; one image is from 21 Jan 2011 showing cold ground and the other shows cold thunderstorm cloud tops on 12 May 2010.
File Name:
goes_pixel_noise.jpg
Credits:
NOAA
Copyright Terms:
COMET Standard Terms of Use
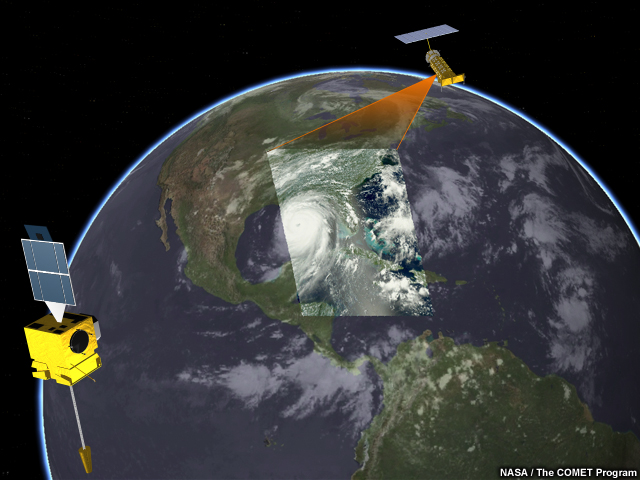
Description:
Synergy of Geo and Leo satellites observing Earth.
File Name:
goes_poes_synergy.jpg
Credits:
NASA / The COMET Program
Copyright Terms:
COMET Standard Terms of Use
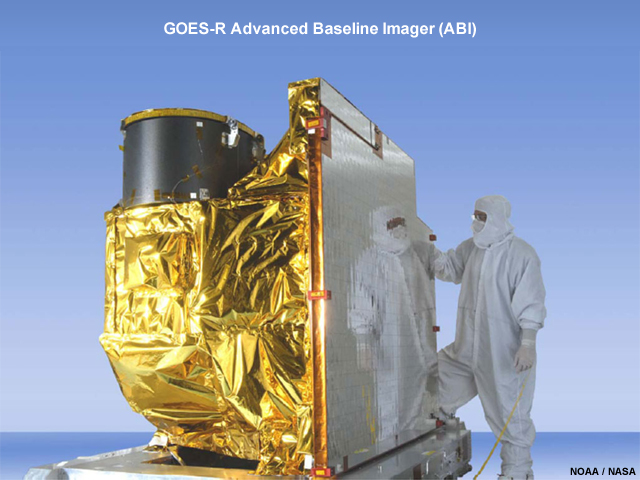
Description:
Photo of the GOES-R ABI instrument
File Name:
goes_r_abi_instrument.jpg
Credits:
NOAA/NASA
Copyright Terms:
COMET Standard Terms of Use
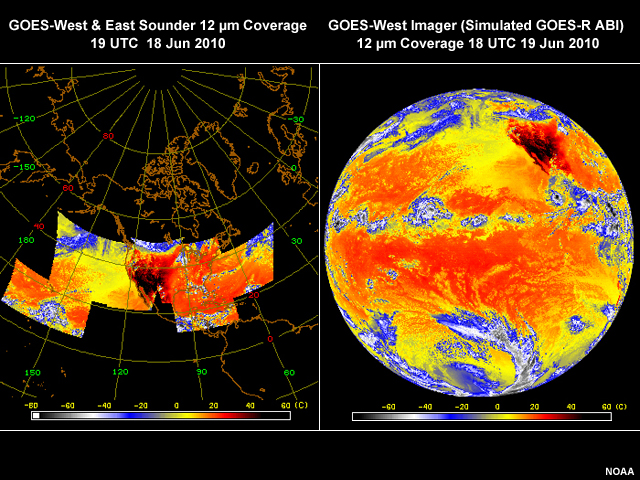
Description:
2 images, one showing GOES-West & East Sounder 12 �m Coverage from 19 UTC 18 Jun 2010, the other GOES-West Imager (Simulated GOES-R ABI) 12 �m Coverage from 18 UTC 19 Jun 2010
File Name:
goes_sndr_vs_abi_coverage.jpg
Credits:
NOAA
Copyright Terms:
COMET Standard Terms of Use
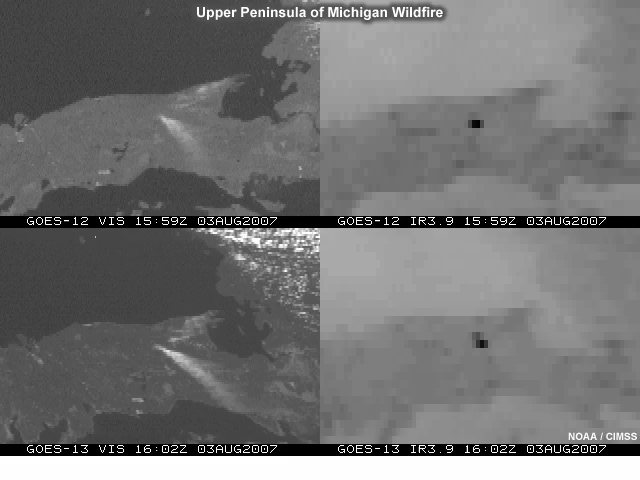
Description:
GOES-12 vs GOES-13 visible and shortwave infrared imagery comparison showing improved pixel geolocation for GOES-13 viewing a wildfire in the upper peninsula region of Michigan on August 3, 2007.
File Name:
goes_up_mi_fire.mp4
Credits:
NOAA / CIMSS
Copyright Terms:
COMET Standard Terms of Use
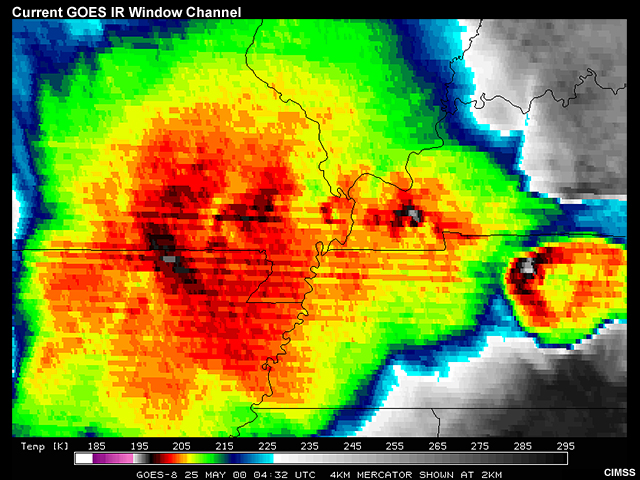
Description:
A GOES-8 infrared window channel image at 4km spatial resolution taken over a thunderstorm complex in the Midwest U.S. on May 25, 2000.
File Name:
GOES-8_GOES-R_Comparison_IR_01.jpg
Credits:
CIMSS
Copyright Terms:
COMET Standard Terms of Use
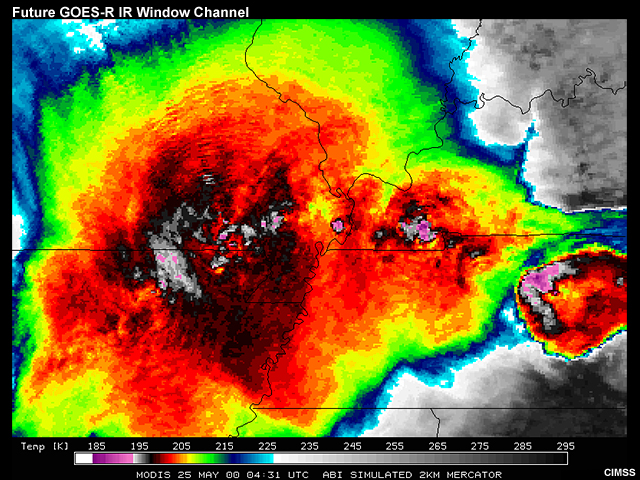
Description:
A Simulated GOES-R ABI infrared window channel image showing improved 2km spatial resolution (compared to current GOES 8-15) taken over a thunderstorm complex in the Midwest U.S. on May 25, 2000.
File Name:
GOES-8_GOES-R_Comparison_IR_02.jpg
Credits:
CIMSS
Copyright Terms:
COMET Standard Terms of Use
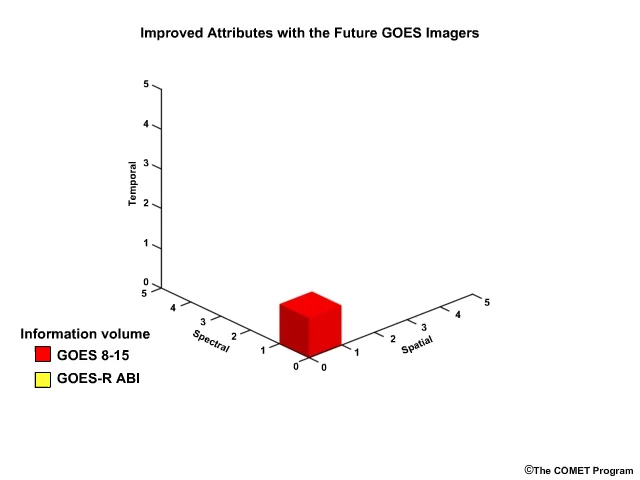
Description:
Three dimensional representation of the increase in data information from the GOES I-P satellites to the future GOES-R ABI imagers.
File Name:
goesr_abi_info_volume.mp4
Credits:
�The COMET Program
Copyright Terms:
COMET Standard Terms of Use
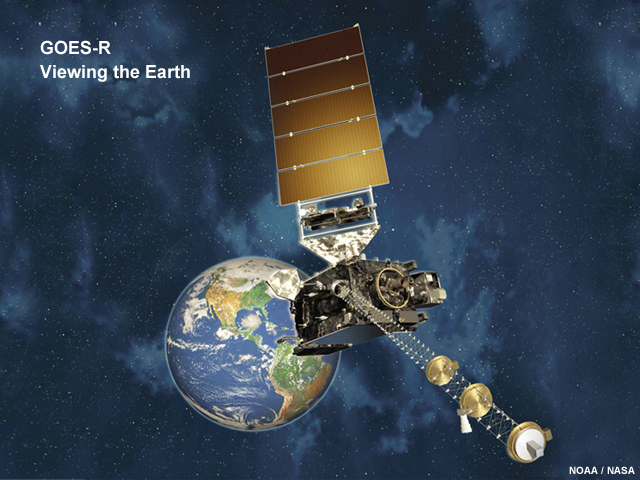
Description:
Artistic rendering of the GOES-R satellite viewing the Earth
File Name:
goesr_earth_perspective.jpg
Credits:
NOAA / NASA
Copyright Terms:
COMET Standard Terms of Use
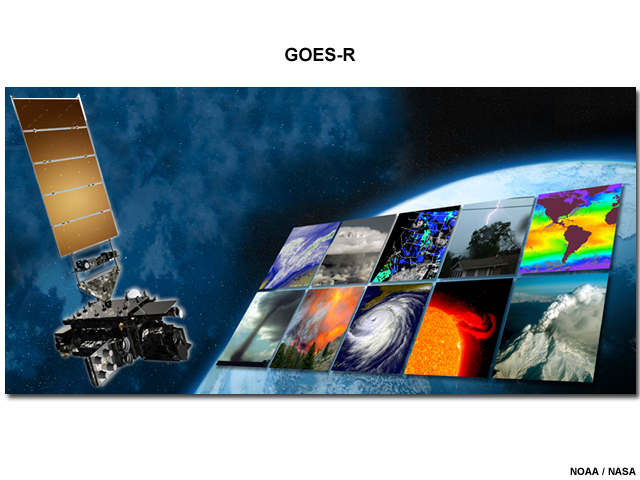
Description:
Artist rendering of the GOES-R satellite flying above Earth with images overlaid of features and phenomena that it will be used to monitor.
File Name:
goesr_viewing_phenomena.jpg
Credits:
NOAA / NASA
Copyright Terms:
COMET Standard Terms of Use
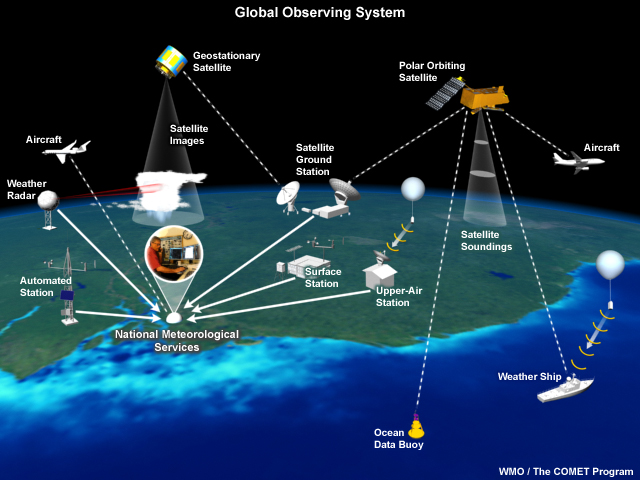
Description:
Conceptual diagram showing the components of the WMO (World Meteorological Organization) supported Global Observing System (GOS).
File Name:
gos_wmo_abi.jpg
Credits:
WMO / The COMET Program
Copyright Terms:
COMET Standard Terms of Use
Description:
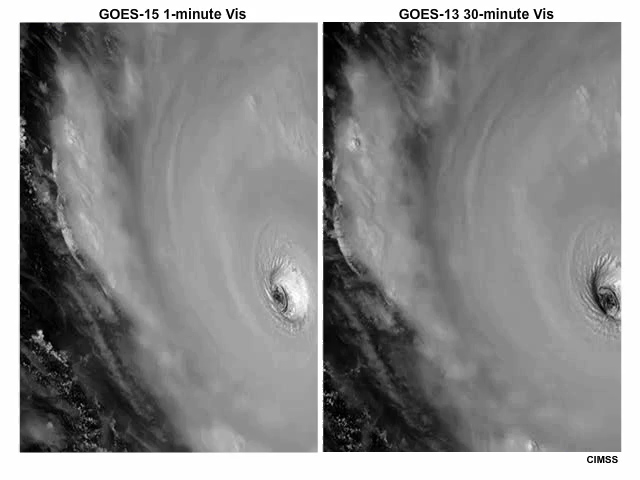
GOES-15 1-minute vs. GOES-13 30-minute visible imagery showing hurricane IGOR near maximum intensity from 1815 to 1945 UTC on September 13, 2010.
File Name:
igor_goes_1vs30min_ani.mp4
Credits:
CIMSS
Copyright Terms:
COMET Standard Terms of Use
Description:
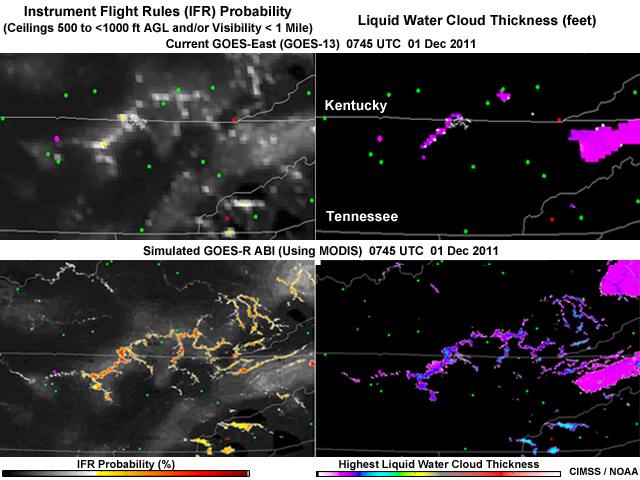
Four images from 0745 01 Dec 2011 comparing instrument flight rules probability and liquid water cloud thickness for current GOES-13 vs. simulated GOES-R ABI using MODIS imagery.
File Name:
instru_flight_rules_lwc_goes_vs_abi.jpg
Credits:
CIMSS / NOAA
Copyright Terms:
COMET Standard Terms of Use
Description:
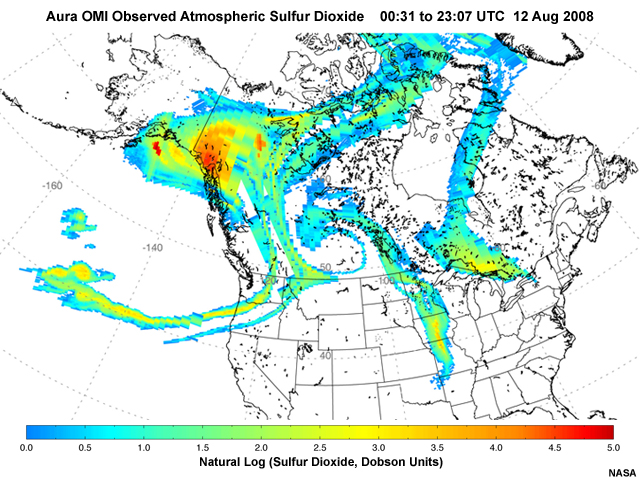
An impressively large SO2 plume from Kasatochi volcano in the Aleutians masking most of Canada and parts of the United States as viewed from the NASA Ozone Monitoring Instrument.
File Name:
Kasatochi_Aura_SO2_Plume.jpg
Credits:
NASA
Copyright Terms:
COMET Standard Terms of Use
Description:
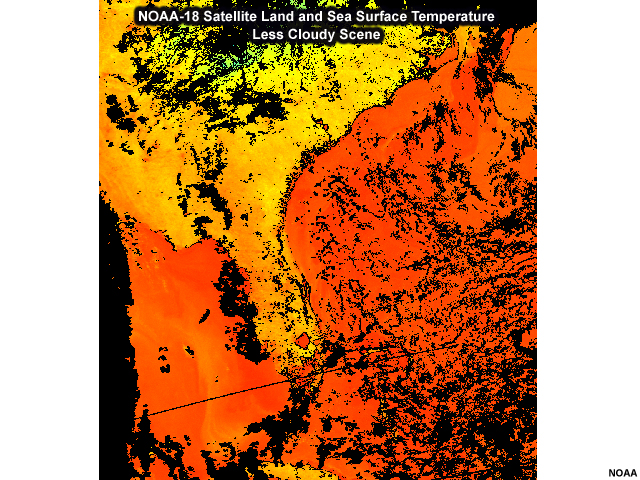
Southeast U.S. view of sea surface temperatures from NOAA-18 AVHRR. The scene is only partially contaminated with cloud cover, leaving a large portion of the image showing sea surface temperatures.
File Name:
less_cloudy_SST_scene_NOAA18.jpg
Credits:
NOAA
Copyright Terms:
COMET Standard Terms of Use
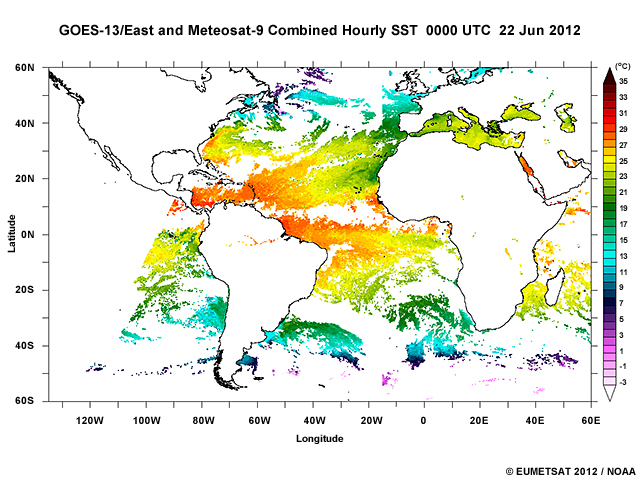
Description:
Meteosat-9 and GOES-13 (GOES-East) combined hourly sea surface temperature image highlighting Atlantic Ocean coverage at 00:00 UTC on June 22, 2012.
File Name:
m9_goes13_sst_22jun12.jpg
Credits:
� EUMETSAT 2012 / NOAA
Copyright Terms:
COMET Standard Terms of Use
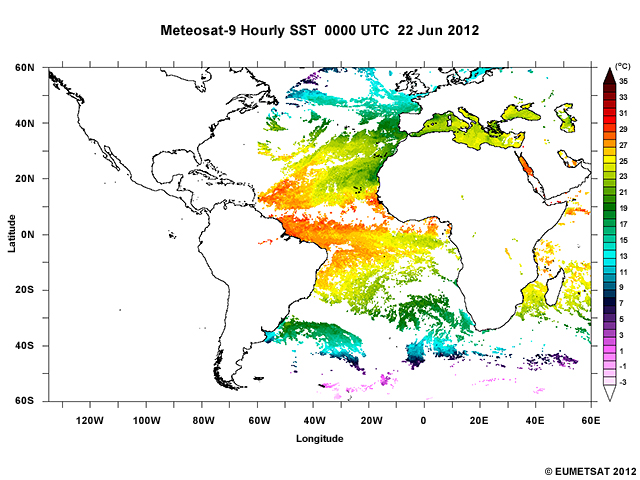
Description:
Meteosat-9 hourly sea surface temperature image highlighting Atlantic Ocean coverage at 00:00 UTC on June 22, 2012.
File Name:
m9_sst_22jun12.jpg
Credits:
� EUMETSAT 2012
Copyright Terms:
COMET Standard Terms of Use
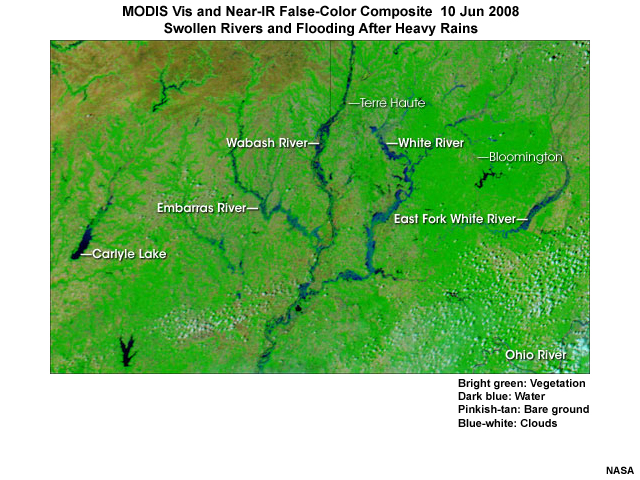
Description:
MODIS visible and infrared false-color composite image highlighting swollen rivers in the Illinois and Indiana region of the U.S. Midwest on 10 Jun 2008 following heavy rains during the 100-year flooding event of June 2008.
File Name:
midwest_flooding_jun08.jpg
Credits:
NASA
Copyright Terms:
COMET Standard Terms of Use
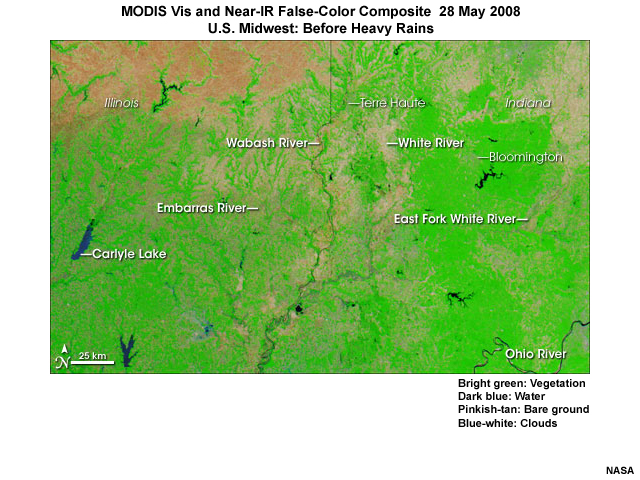
Description:
MODIS visible and infrared false-color composite image highlighting rivers in the Illinois and Indiana region of the U.S. Midwest on 28 May 2008 before the 100-year flooding event of June 2008.
File Name:
midwest_flooding_may08.jpg
Credits:
NASA
Copyright Terms:
COMET Standard Terms of Use
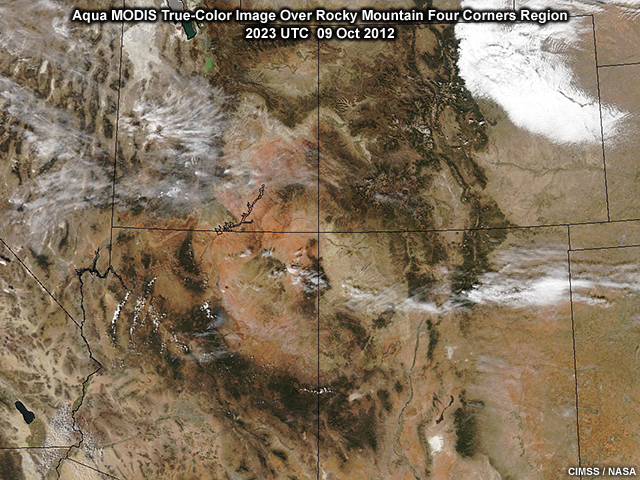
Description:
A MODIS true-color composite image taken by NASA's Aqua satellite highlighting land features in the Four Corners region of the U.S. Rocky Mountain west at 2023 UTC on 9 October, 2012.
File Name:
modis_mtnwest_zoom_09oct12.jpg
Credits:
CIMSS / NASA
Copyright Terms:
COMET Standard Terms of Use
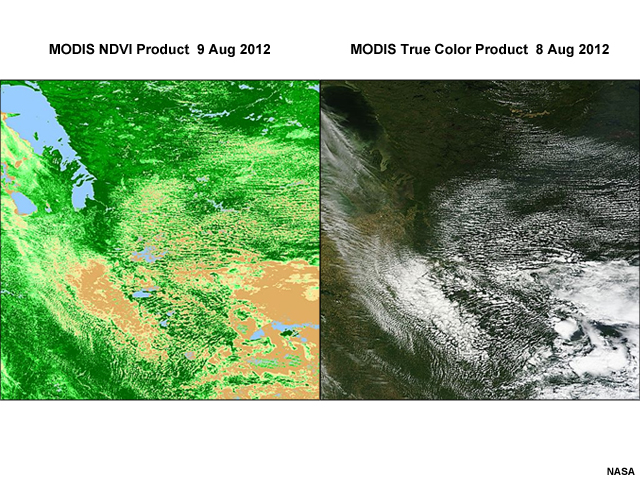
Description:
MODIS NDVI and True Color products for 8 Aug 2012
File Name:
modis_ndvi_and_vis.jpg
Credits:
NASA
Copyright Terms:
COMET Standard Terms of Use
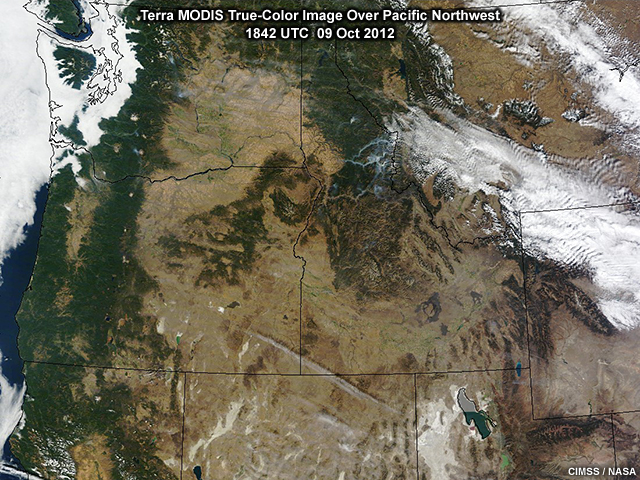
Description:
A MODIS true-color composite image taken by NASA's Terra satellite highlighting land features in the Pacific Northwest region of the U.S. at 1842 UTC on 9 October, 2012.
File Name:
modis_pacnw_zoom_09oct12.jpg
Credits:
CIMSS / NASA
Copyright Terms:
COMET Standard Terms of Use
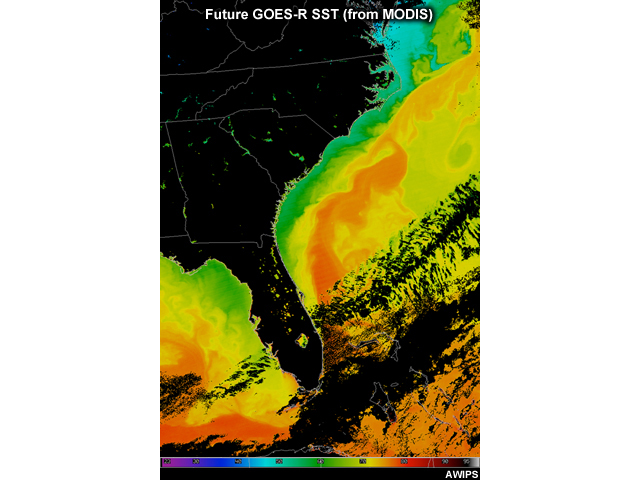
Description:
MODIS sea surface temperature imagery over the East Coast of the United States from February 10, 2008. The Gulf stream is extremely detailed showing gyres and swirls.
File Name:
MODIS_SST_10Feb2008.jpg
Credits:
AWIPS
Copyright Terms:
COMET Standard Terms of Use
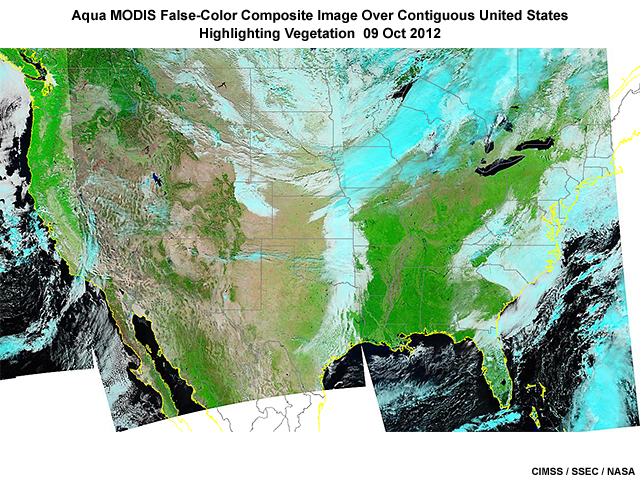
Description:
A MODIS false-color composite image taken by NASA's Aqua satellite highlighting vegetation features across the contiguous United States during early afternoon local time on 9 October, 2012.
File Name:
modis_us_fc_composite_09oct12.jpg
Credits:
CIMSS / SSEC / NASA
Copyright Terms:
COMET Standard Terms of Use
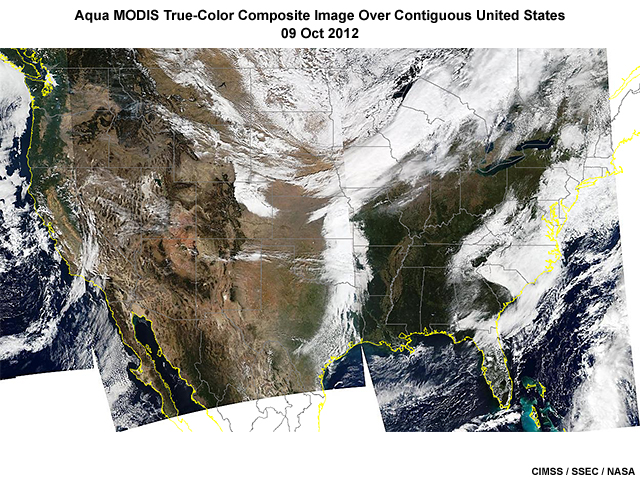
Description:
A MODIS true-color composite image taken by NASA's Aqua satellite highlighting land features across the contiguous United States during early afternoon local time on 9 October, 2012.
File Name:
modis_us_tc_composite_09oct12.jpg
Credits:
CIMSS / SSEC / NASA
Copyright Terms:
COMET Standard Terms of Use
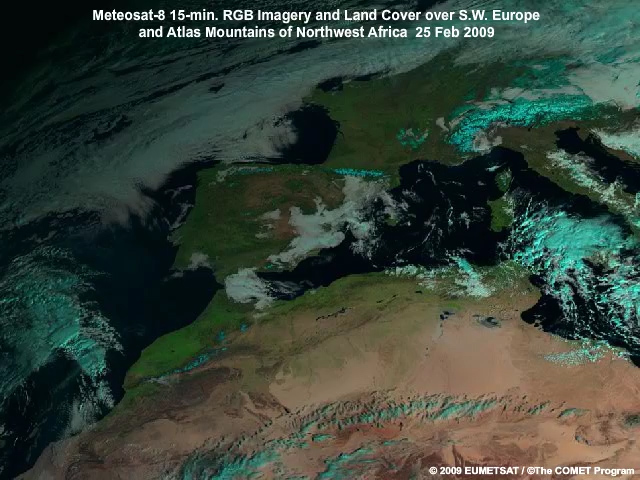
Description:
Meteosat-8 natural color RGB composite imagery showing Spain and the Atlas Mountain Range of northwest Africa as the sourthern side of the mountain range turns green due to growing vegetation from recent rainfall on 10 UTC 25 Feb 2009.
File Name:
msg_rgb_landcover_25feb09_ani.mp4
Credits:
� 2009 EUMETSAT / �The COMET Program
Copyright Terms:
COMET Standard Terms of Use
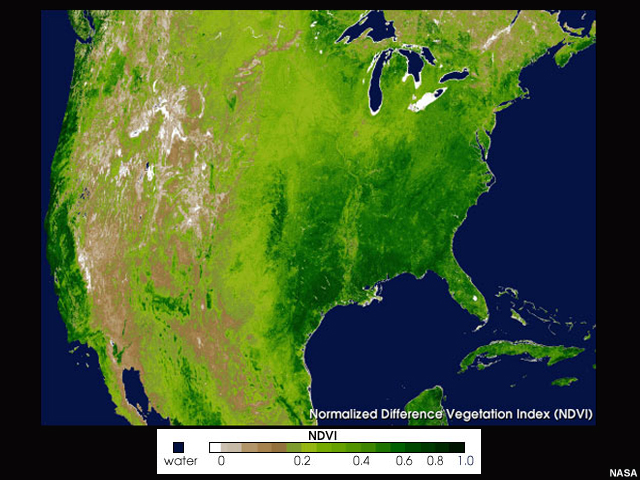
Description:
Example Normalized Difference Vegetation Index (NDVI) over the United States.
File Name:
NDVI_US_MODIS.jpg
Credits:
NASA
Copyright Terms:
COMET Standard Terms of Use
Description:
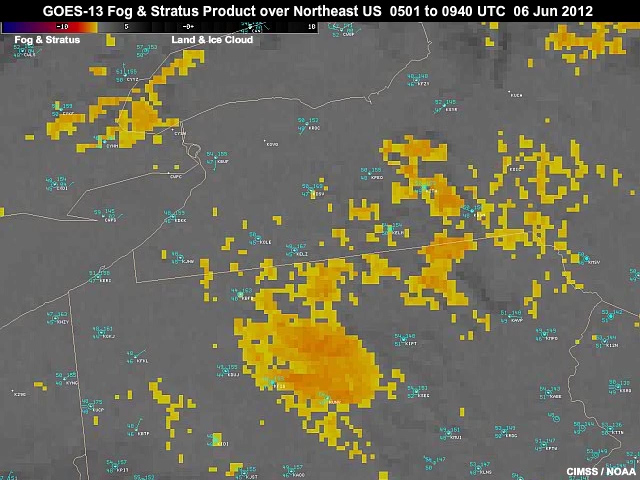
Animation of GOES-13 shortwave-longwave channel difference product (also known as the low cloud or fog product) highlighting fog development in valley regions of the northeastern United States from 05:01 to 0940 UTC on 06 June, 2012.
File Name:
ne_valley_fog_06jun12.mp4
Credits:
CIMSS / NOAA
Copyright Terms:
COMET Standard Terms of Use
Description:
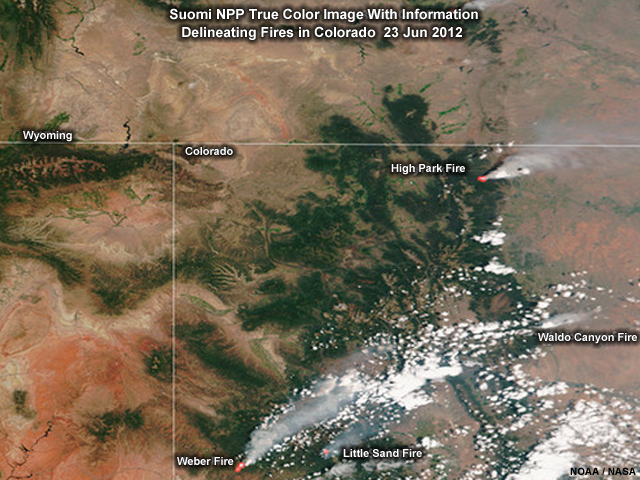
Suomi NPP true color image with information delineating fires in Colorado on 23 June 2012
File Name:
npp_co_fires_23jun2012.jpg
Credits:
NOAA/NASA
Copyright Terms:
COMET Standard Terms of Use
Description:
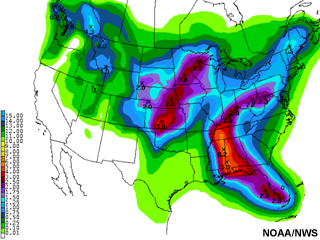
Quantitative Precipitation Forecast image.
File Name:
qpf.jpg
Credits:
NOAA/NWS
Copyright Terms:
COMET Standard Terms of Use
Description:
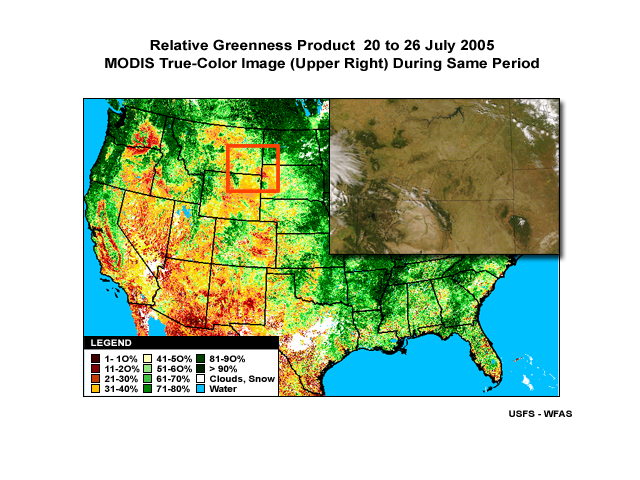
Relative Greenness Product (compared against average conditions) for 20 to 26 July 2005 with true-color MODIS image overlay.
File Name:
rel_green_Jul20_to_Jul26_2005_inset.jpg
Credits:
USFS - WFAS
Copyright Terms:
COMET Standard Terms of Use
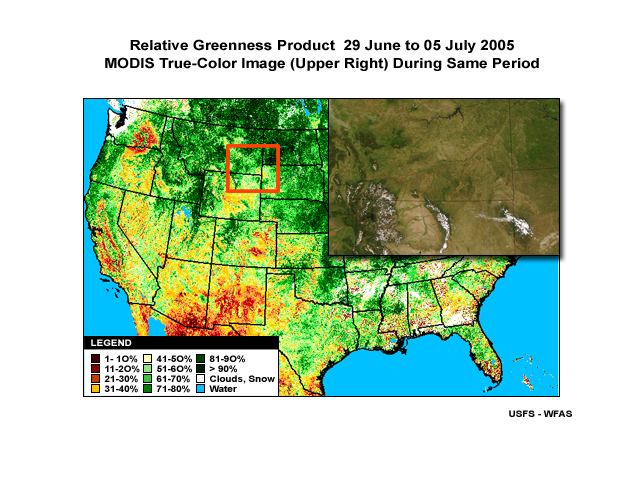
Description:
Relative Greeness Product (compared against average conditions) for 29 June to 5 July 2005 with true-color MODIS image overlay.
File Name:
rel_green_Jun29_to_Jul05_2005_inset.jpg
Credits:
USFS - WFAS
Copyright Terms:
COMET Standard Terms of Use
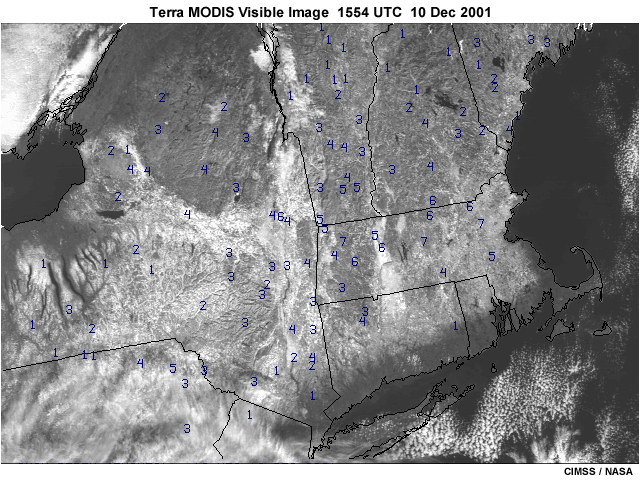
Description:
A MODIS visible image showing a variety of snow covered surfaces, fog, and bare ground, and open water surfaces.
File Name:
rgb_snow_and_fog_01.jpg
Credits:
CIMSS / NASA
Copyright Terms:
COMET Standard Terms of Use
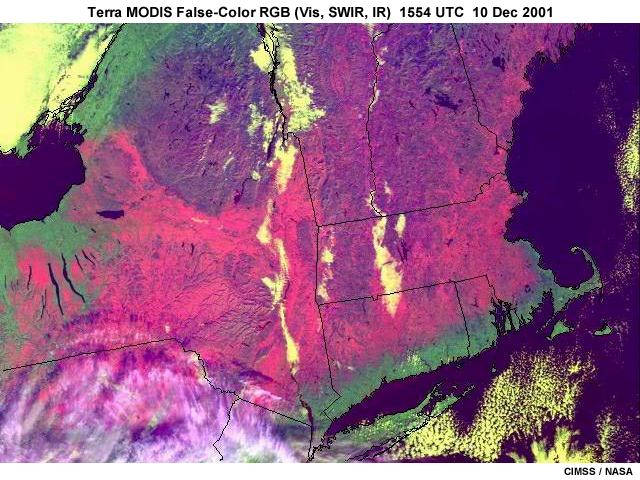
Description:
A MODIS false-color RGB image (Vis, SWIR, IR) showing snow cover (magenta), snow cover in forest (purple), fog (yellow), bare ground (green), and open water surfaces.
File Name:
rgb_snow_and_fog_02.jpg
Credits:
CIMSS / NASA
Copyright Terms:
COMET Standard Terms of Use
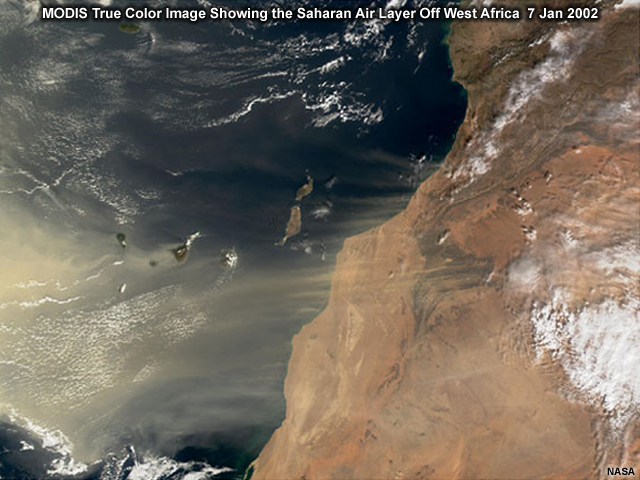
Description:
MODIS true color image showing the Saharan air layer off West Africa on 7 Jan 2002
File Name:
sal_modis.jpg
Credits:
NASA
Copyright Terms:
COMET Standard Terms of Use
Description:
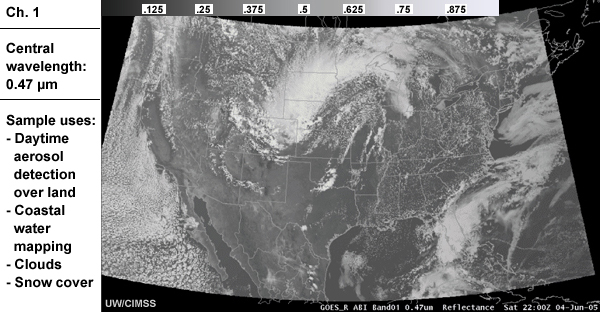
Simulated image of ABI Ch 1 with information about its wavelength and sample uses
File Name:
sim_ABI_01.jpg
Credits:
UW/CIMSS
Copyright Terms:
COMET Standard Terms of Use
Description:
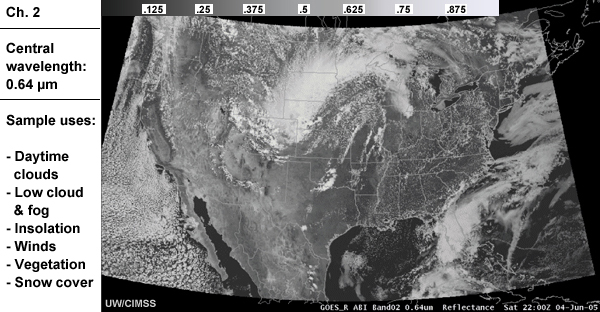
Simulated image of ABI Ch 2 with information about its wavelength and sample uses
File Name:
sim_ABI_02.jpg
Credits:
UW/CIMSS
Copyright Terms:
COMET Standard Terms of Use
Description:
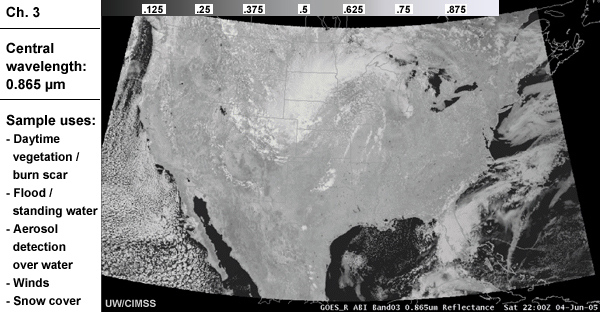
Simulated image of ABI Ch 3 with information about its wavelength and sample uses
File Name:
sim_ABI_03.jpg
Credits:
UW/CIMSS
Copyright Terms:
COMET Standard Terms of Use
Description:
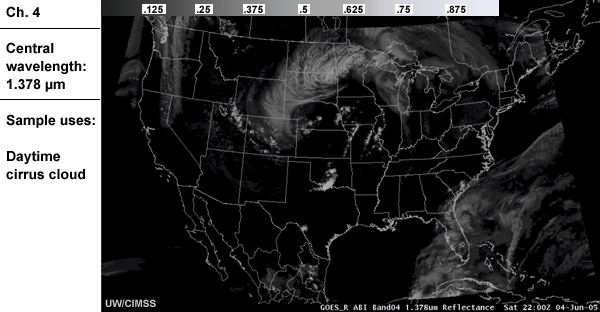
Simulated image of ABI Ch 4 with information about its wavelength and sample uses
File Name:
sim_ABI_04.jpg
Credits:
UW/CIMSS
Copyright Terms:
COMET Standard Terms of Use
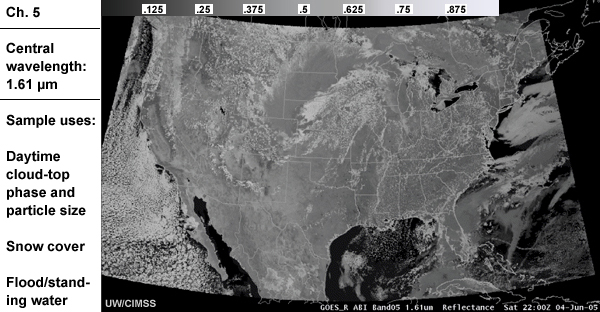
Description:
Simulated image of ABI Ch 5 with information about its wavelength and sample uses
File Name:
sim_ABI_05.jpg
Credits:
UW/CIMSS
Copyright Terms:
COMET Standard Terms of Use
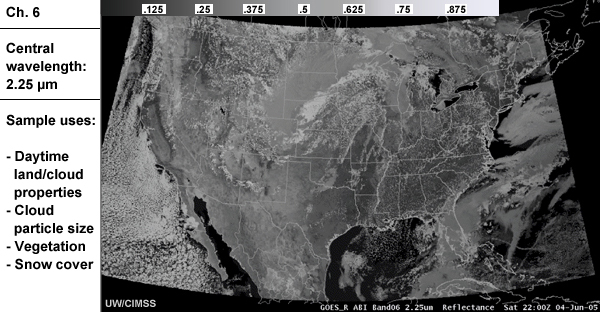
Description:
Simulated image of ABI Ch 6 with information about its wavelength and sample uses
File Name:
sim_ABI_06.jpg
Credits:
UW/CIMSS
Copyright Terms:
COMET Standard Terms of Use
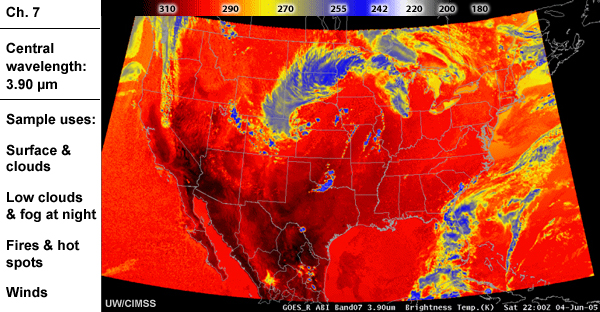
Description:
Simulated image of ABI Ch 7 with information about its wavelength and sample uses
File Name:
sim_ABI_07.jpg
Credits:
UW/CIMSS
Copyright Terms:
COMET Standard Terms of Use
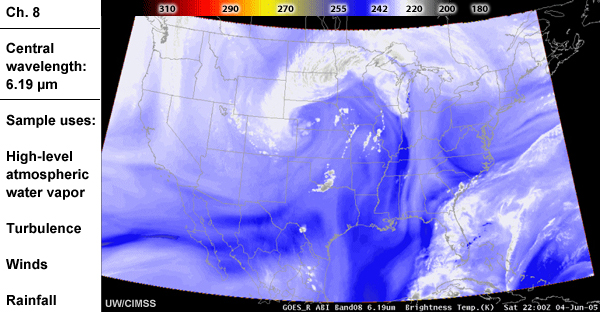
Description:
Simulated image of ABI Ch 8 with information about its wavelength and sample uses
File Name:
sim_ABI_08.jpg
Credits:
UW/CIMSS
Copyright Terms:
COMET Standard Terms of Use
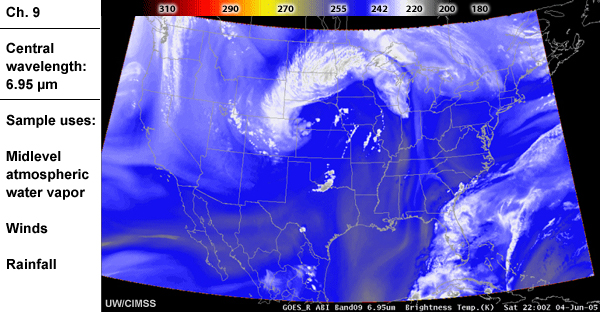
Description:
Simulated image of ABI Ch 9 with information about its wavelength and sample uses
File Name:
sim_ABI_09.jpg
Credits:
UW/CIMSS
Copyright Terms:
COMET Standard Terms of Use
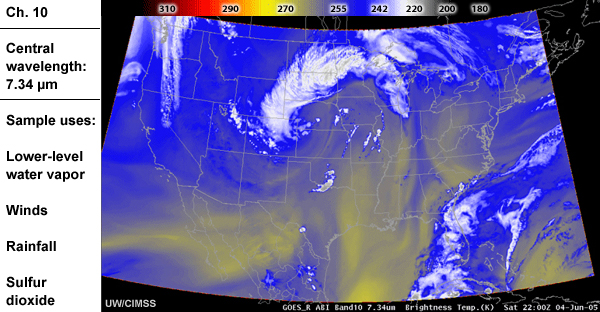
Description:
Simulated image of ABI Ch 10 with information about its wavelength and sample uses
File Name:
sim_ABI_10.jpg
Credits:
UW/CIMSS
Copyright Terms:
COMET Standard Terms of Use
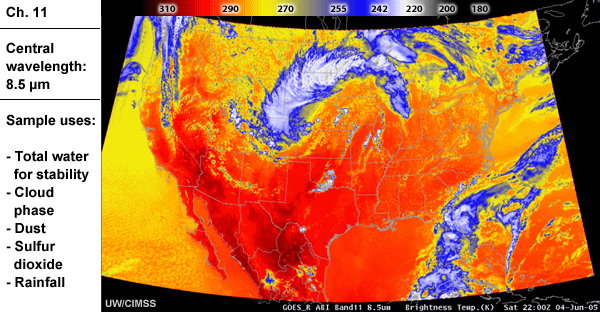
Description:
Simulated image of ABI Ch 11 with information about its wavelength and sample uses
File Name:
sim_ABI_11.jpg
Credits:
UW/CIMSS
Copyright Terms:
COMET Standard Terms of Use
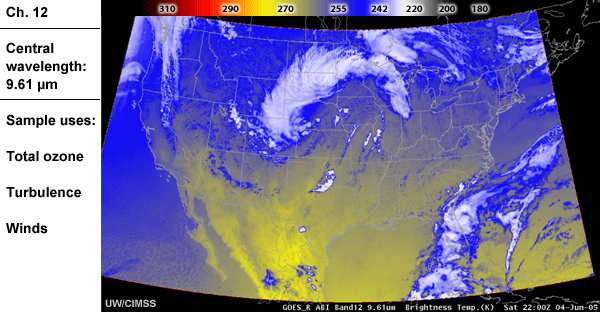
Description:
Simulated image of ABI Ch 12 with information about its wavelength and sample uses
File Name:
sim_ABI_12.jpg
Credits:
UW/CIMSS
Copyright Terms:
COMET Standard Terms of Use
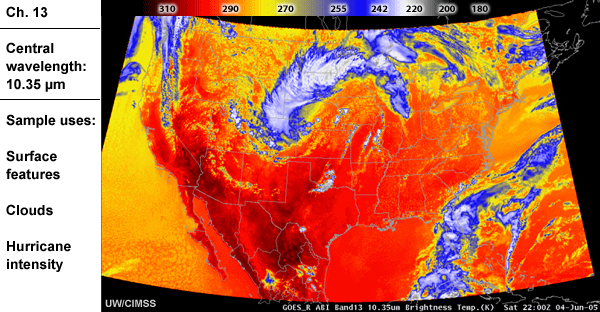
Description:
Simulated image of ABI Ch 13 with information about its wavelength and sample uses
File Name:
sim_ABI_13.jpg
Credits:
UW/CIMSS
Copyright Terms:
COMET Standard Terms of Use
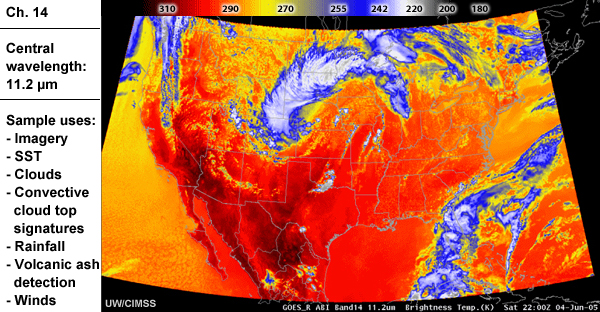
Description:
Simulated image of ABI Ch 14 with information about its wavelength and sample uses
File Name:
sim_ABI_14.jpg
Credits:
UW/CIMSS
Copyright Terms:
COMET Standard Terms of Use
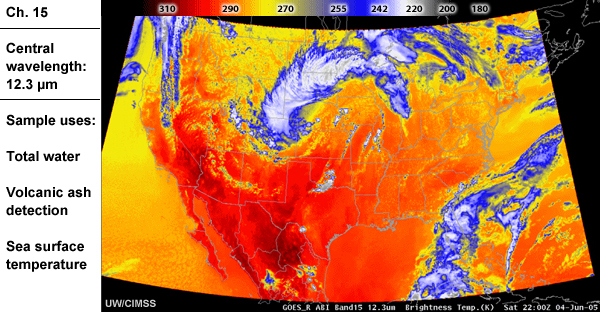
Description:
Simulated image of ABI Ch 15 with information about its wavelength and sample uses
File Name:
sim_ABI_15.jpg
Credits:
UW/CIMSS
Copyright Terms:
COMET Standard Terms of Use
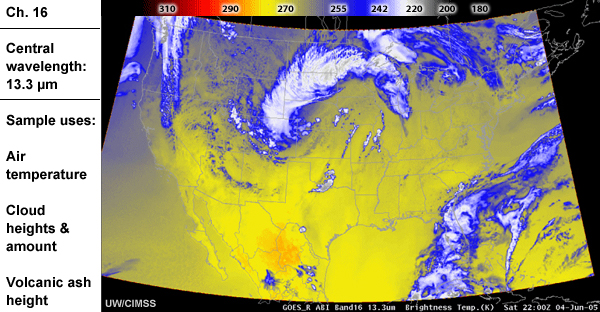
Description:
Simulated image of ABI Ch 16 with information about its wavelength and sample uses
File Name:
sim_ABI_16.jpg
Credits:
UW/CIMSS
Copyright Terms:
COMET Standard Terms of Use
Description:
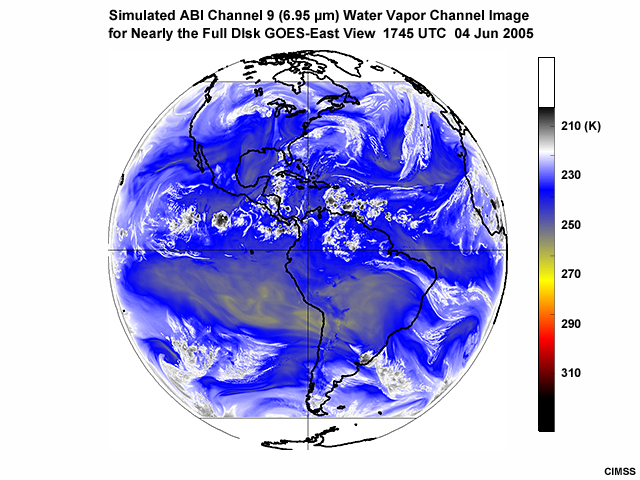
Simulated GOES-R ABI water vapor infrared 6.95 micrometer (channel 9) image for the full Earth disk derived from the WRF numerical weather prediction model at 1745 UTC on June 4, 2005.
File Name:
sim_ABI_fulldisk_WV_ch9.jpg
Credits:
CIMSS
Copyright Terms:
COMET Standard Terms of Use
Description:
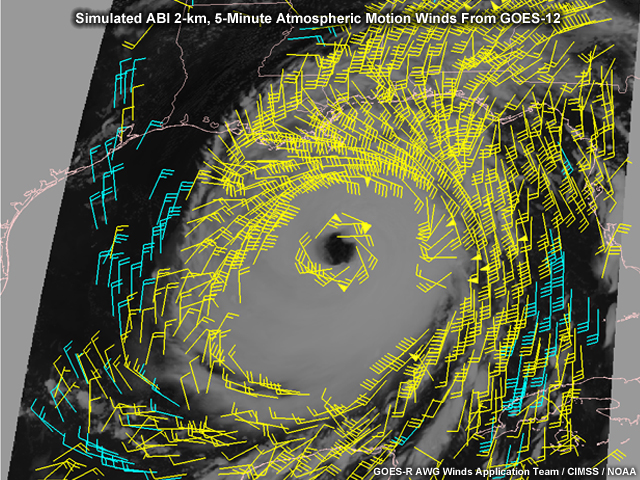
Simulated ABI 2-km 5-minute atmospheric motion winds from GOES-12
File Name:
sim_abi_goes_at_motion_winds_abi.jpg
Credits:
GOES-R AWG Winds Application Team/CIMSS/NOAA
Copyright Terms:
COMET Standard Terms of Use
Description:
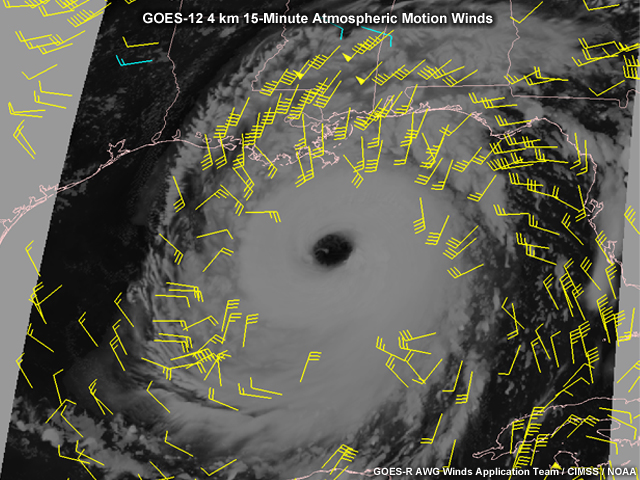
GOES-12 4 km 15-minute atmospheric motion winds
File Name:
sim_abi_goes_at_motion_winds_goes.jpg
Credits:
GOES-R AWG Winds Application Team/CIMSS/NOAA
Copyright Terms:
COMET Standard Terms of Use
Description:
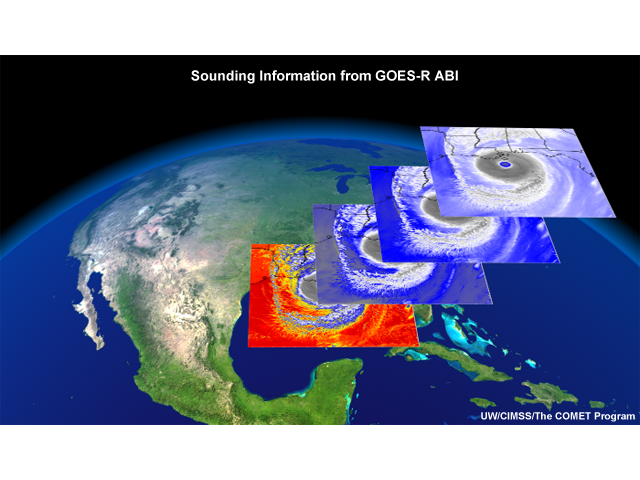
Simulated GOES-R Advanced Baseline Imager (ABI) imagery of hurricane Katrina as it is making landfall in southeast Louisiana. Four images are shown stacked on top of each other (as viewed from a 45� angle to the earths surface. �Each one of these images represents at which level the ABI would be seeing these data. �From bottom to top, the surface image is made with the shortwave infrared image, then the next three images are different water vapor images at different altitudes. �These are the only channels that will be used to make soundings in the future with the ABI. �The rest of the data will be interpolated from NWP output.
File Name:
sim_ABI_layers_sounding_katrina.jpg
Credits:
UW/CIMSS/The COMET Program
Copyright Terms:
COMET Standard Terms of Use
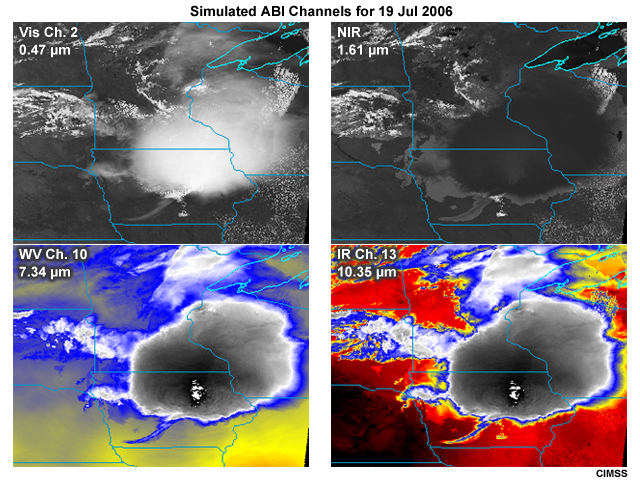
Description:
Simulated Advanced Baseline Imager (ABI) 0.64 micrometer (ch. 2) visible channel, 1.61 micrometer (ch. 5) shortwave infrared, 7.34 micrometer (ch. 10) water vapor, and 10.35 micrometer (ch. 13) longwave infrared channel images showing a large thunderstorm over northern Iowa on the afternoon of July 19, 2006.
File Name:
sim_abi_tstorm_19jul06.jpg
Credits:
CIMSS
Copyright Terms:
COMET Standard Terms of Use
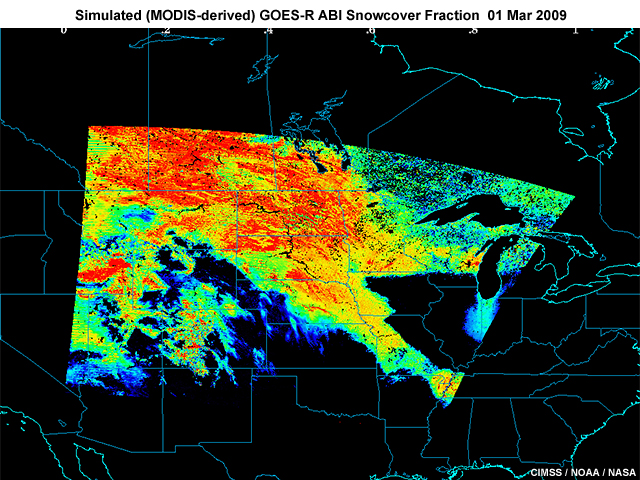
Description:
A simulated GOES-R ABI Snowcover Fraction product derived from MODIS data for March 1, 2009.
File Name:
sim_goesr_abi_snowcover_fraction.jpg
Credits:
CIMSS / NOAA / NASA
Copyright Terms:
COMET Standard Terms of Use
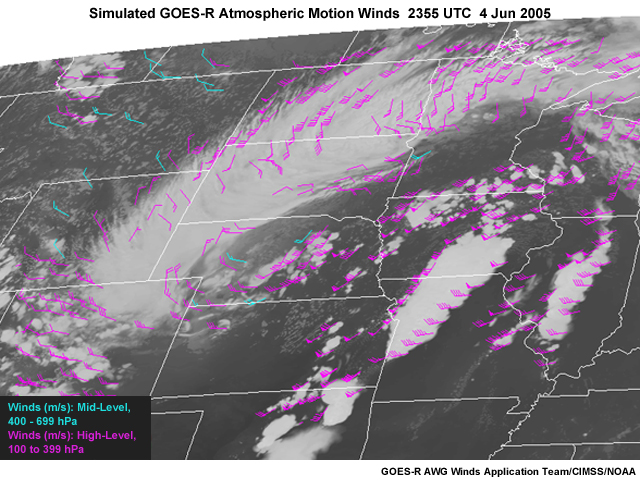
Description:
First of three simulated GOES-R atmospheric motion wind vectors over the mid-west from 2355 4 June 2005 to 0005 5 June 2005.
File Name:
sim_goesr_atmos_winds_1.jpg
Credits:
GOES-R AWG Winds Application Team/CIMSS/NOAA
Copyright Terms:
COMET Standard Terms of Use
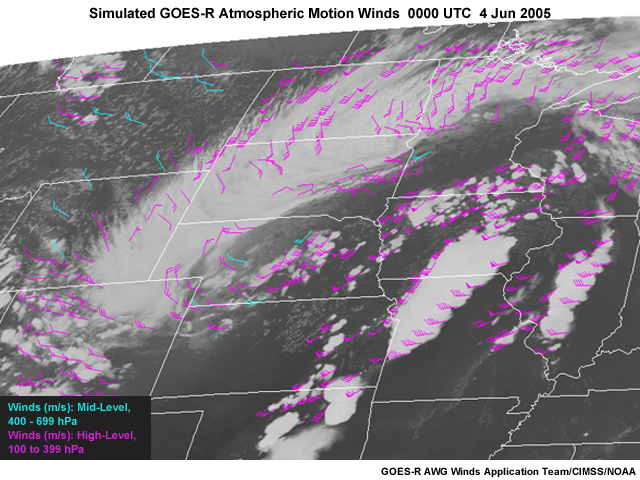
Description:
Second of three simulated GOES-R atmospheric motion wind vectors over the mid-west from 2355 4 June 2005 to 0005 5 June 2005.
File Name:
sim_goesr_atmos_winds_2.jpg
Credits:
GOES-R AWG Winds Application Team/CIMSS/NOAA
Copyright Terms:
COMET Standard Terms of Use

Description:
Third of three simulated GOES-R atmospheric motion wind vectors over the mid-west from 2355 4 June 2005 to 0005 5 June 2005.
File Name:
sim_goesr_atmos_winds_3.jpg
Credits:
GOES-R AWG Winds Application Team/CIMSS/NOAA
Copyright Terms:
COMET Standard Terms of Use
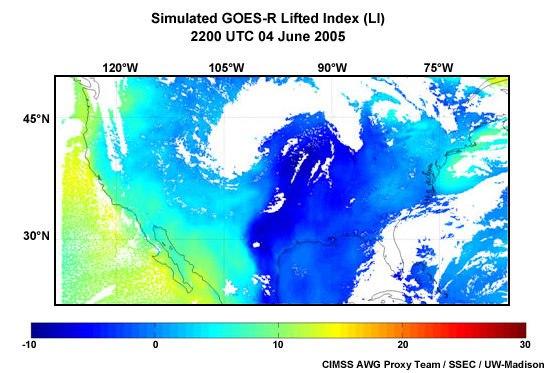
Description:
A simulated GOES-R ABI derived LI (Lifted Index) stability index product for 2200 UTC 04 June 2005.
File Name:
sim_goesr_stab_prod_2200utc_4jun2005_01.jpg
Credits:
CIMSS AWG Proxy Team / SSEC / UW-Madison
Copyright Terms:
COMET Standard Terms of Use
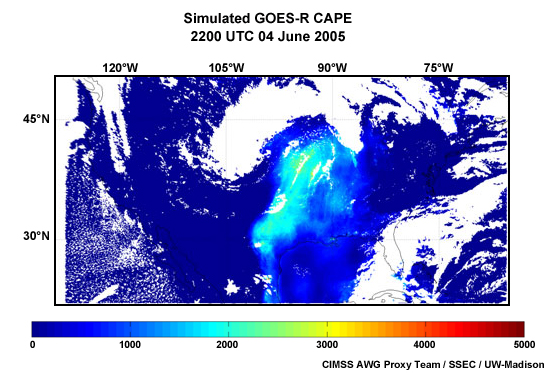
Description:
A simulated GOES-R ABI derived CAPE (Convective Available Potential Energy) stability index product for 2200 UTC 04 June 2005.
File Name:
sim_goesr_stab_prod_2200utc_4jun2005_02.jpg
Credits:
CIMSS AWG Proxy Team / SSEC / UW-Madison
Copyright Terms:
COMET Standard Terms of Use
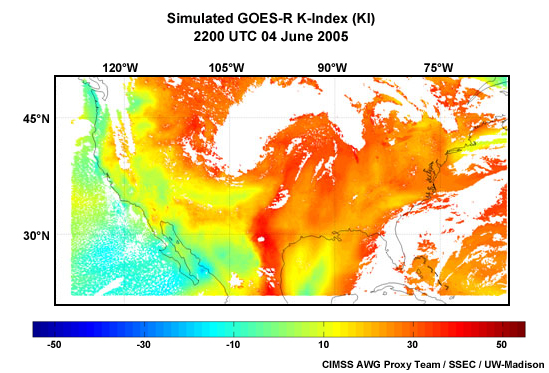
Description:
A simulated GOES-R ABI derived KI (K-Index) stability index product for 2200 UTC 04 June 2005.
File Name:
sim_goesr_stab_prod_2200utc_4jun2005_03.jpg
Credits:
CIMSS AWG Proxy Team / SSEC / UW-Madison
Copyright Terms:
COMET Standard Terms of Use
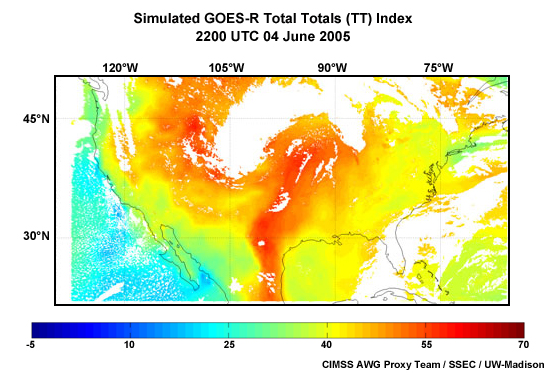
Description:
A simulated GOES-R ABI derived TT (Total Totals) stability index product for 2200 UTC 04 June 2005.
File Name:
sim_goesr_stab_prod_2200utc_4jun2005_04.jpg
Credits:
CIMSS AWG Proxy Team / SSEC / UW-Madison
Copyright Terms:
COMET Standard Terms of Use
Description:
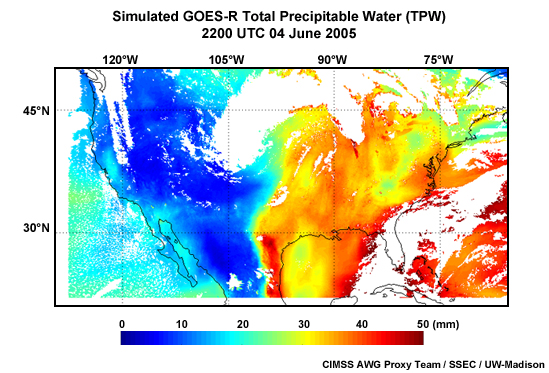
Simulated GOES-R ABI derived TPW (Total Precipitable Water) product for 2200 UTC on June 4, 2005.
File Name:
sim_goesr_tpw_prod_2200utc_4jun2005.jpg
Credits:
CIMSS AWG Proxy Team / SSEC / UW-Madison
Copyright Terms:
COMET Standard Terms of Use
Description:
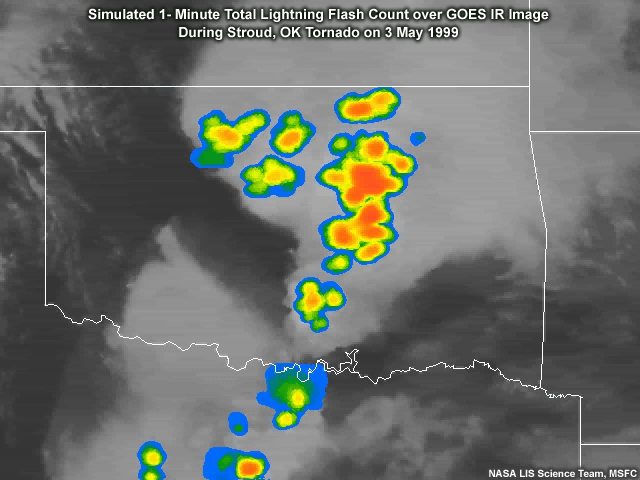
Simulated Geostationary Lightning Mapper data overlaid on an infrared satellite image of the thunderstorm that produced the Stroud, OK tornado.
File Name:
Simulated_GLM_Stroud_Tornado.jpg
Credits:
NASA LIS Science Team, MSFC
Copyright Terms:
COMET Standard Terms of Use
Description:
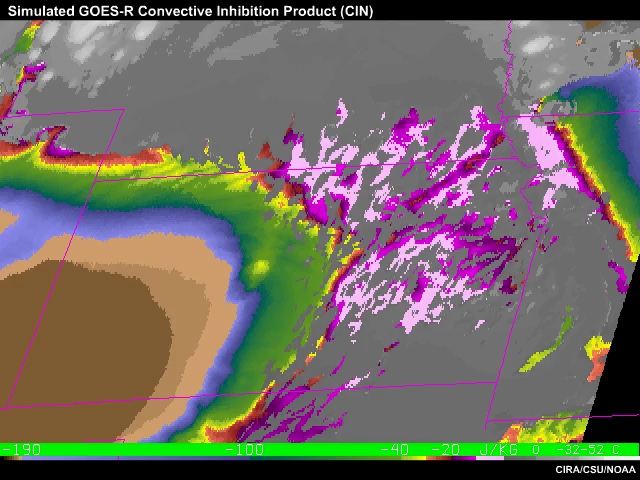
Animation of simulated GOES-R Convective Inhibition (CIN) for a thunderstorm event on May 25, 2000 over Kansas.
File Name:
Simulated_GOESR_CIN.mp4
Credits:
CIRA/CSU/NOAA
Copyright Terms:
COMET Standard Terms of Use
Description:
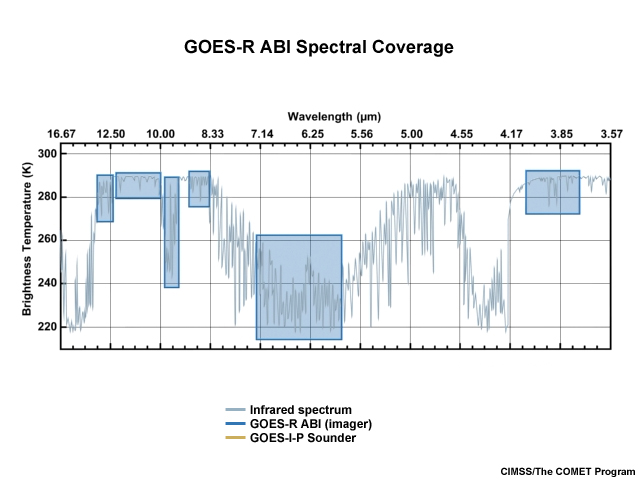
Graph showing simulated GOES-R ABI spectral coverage
File Name:
spectral_coverage_abi.jpg
Credits:
CIMSS/The COMET Program
Copyright Terms:
COMET Standard Terms of Use
Description:
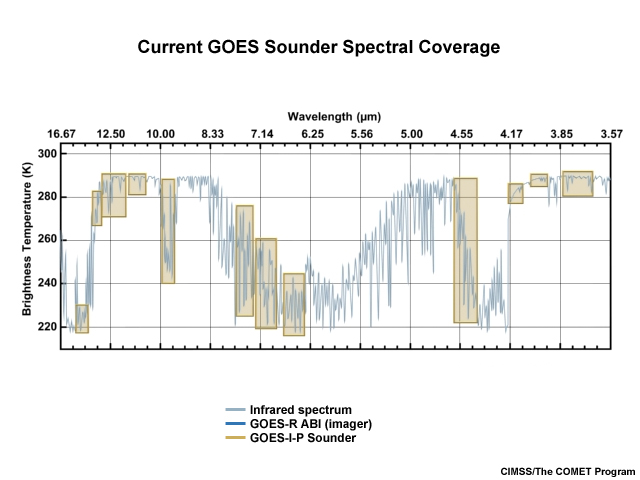
Graph showing current GOES sounder spectral coverage
File Name:
spectral_coverage_goes.jpg
Credits:
CIMSS/The COMET Program
Copyright Terms:
COMET Standard Terms of Use
Description:
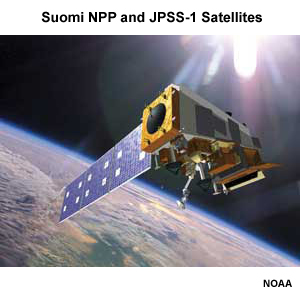
Illustration of the Suomi NPP and JPSS-1 satellites.
File Name:
suomi_npp_and_jpss_satellites.jpg
Credits:
NOAA
Copyright Terms:
COMET Standard Terms of Use
Description:
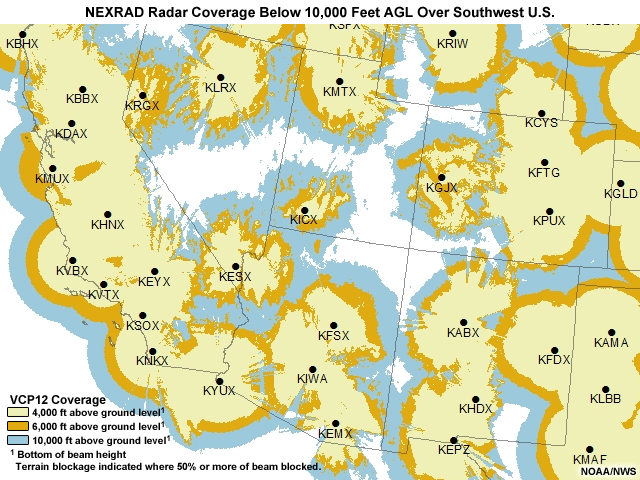
NEXRAD WSR-88D radar coverage over the southwestern United States as of 2011.
File Name:
swus_nexrad_coverage2011.jpg
Credits:
NOAA/NWS
Copyright Terms:
COMET Standard Terms of Use
Description:
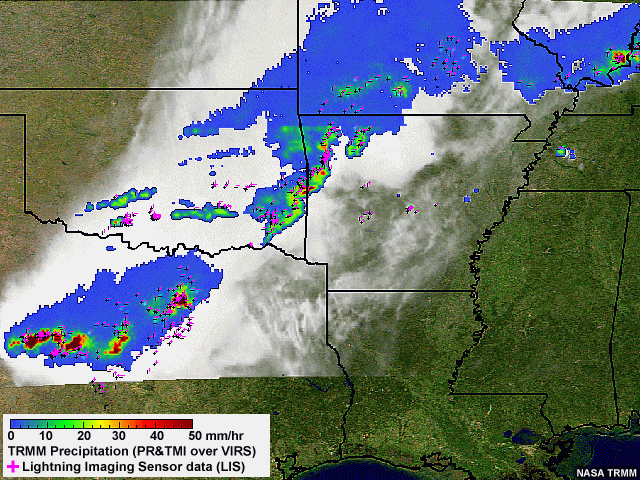
TRMM infrared observations of a storm complex on May 14, 2005 showing satellite-derived reflectivity and lightning strikes.
File Name:
TRMM_LIS_14_May_2005.jpg
Credits:
NASA TRMM
Copyright Terms:
COMET Standard Terms of Use
Description:
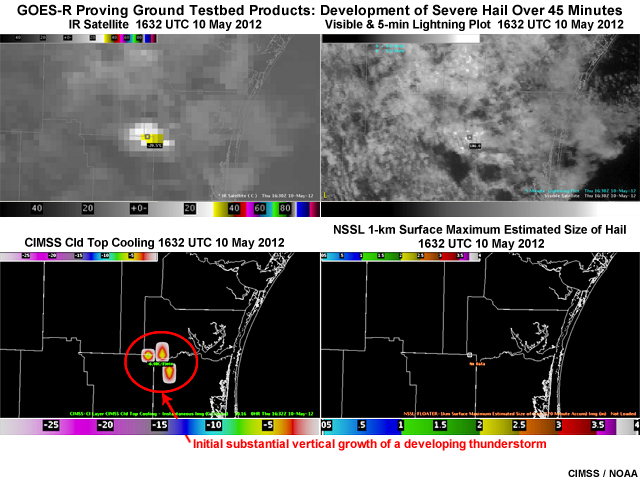
First in a series of four 4-panel images showing the buildup of hail over a 45 minute period. Products shown include a GOES infrared image, a visible image and 5-minute lightning plot, the CIMSS cloud top cooling product, and NSSL 1-km surface maximum estimated hail size product at 1632 UTC on May 10, 2012.
File Name:
uwctc_may10_series_1.jpg
Credits:
CIMSS / NOAA
Copyright Terms:
COMET Standard Terms of Use
Description:
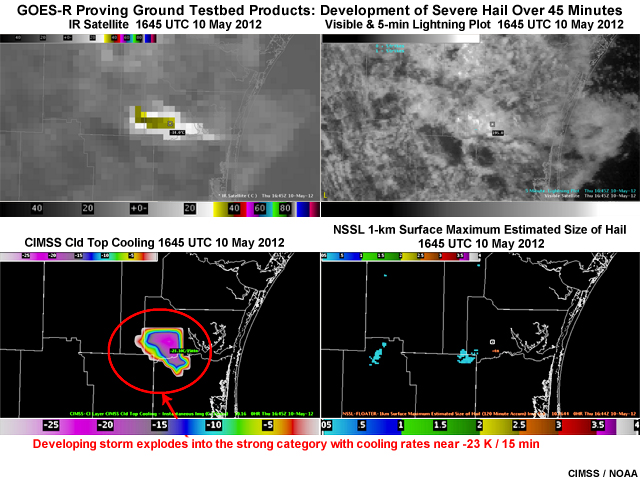
First in a series of four 4-panel images showing the buildup of hail over a 45 minute period. Products shown include a GOES infrared image, a visible image and 5-minute lightning plot, the CIMSS cloud top cooling product, and NSSL 1-km surface maximum estimated hail size product at 1645 UTC on May 10, 2012.
File Name:
uwctc_may10_series_2.jpg
Credits:
CIMSS / NOAA
Copyright Terms:
COMET Standard Terms of Use
Description:
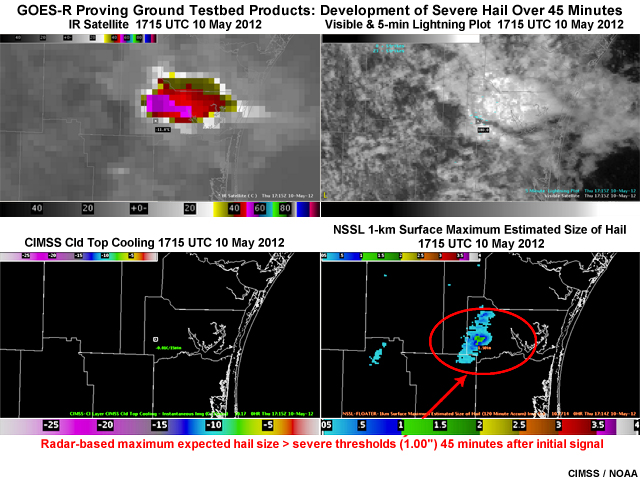
First in a series of four 4-panel images showing the buildup of hail over a 45 minute period. Products shown include a GOES infrared image, a visible image and 5-minute lightning plot, the CIMSS cloud top cooling product, and NSSL 1-km surface maximum estimated hail size product at 1715 UTC on May 10, 2012.
File Name:
uwctc_may10_series_3.jpg
Credits:
CIMSS / NOAA
Copyright Terms:
COMET Standard Terms of Use
Description:
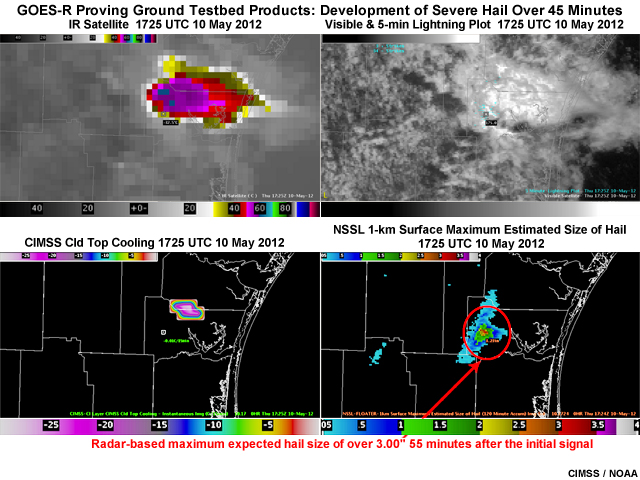
First in a series of four 4-panel images showing the buildup of hail over a 45 minute period. Products shown include a GOES infrared image, a visible image and 5-minute lightning plot, the CIMSS cloud top cooling product, and NSSL 1-km surface maximum estimated hail size product at 1725 UTC on May 10, 2012.
File Name:
uwctc_may10_series_4.jpg
Credits:
CIMSS / NOAA
Copyright Terms:
COMET Standard Terms of Use
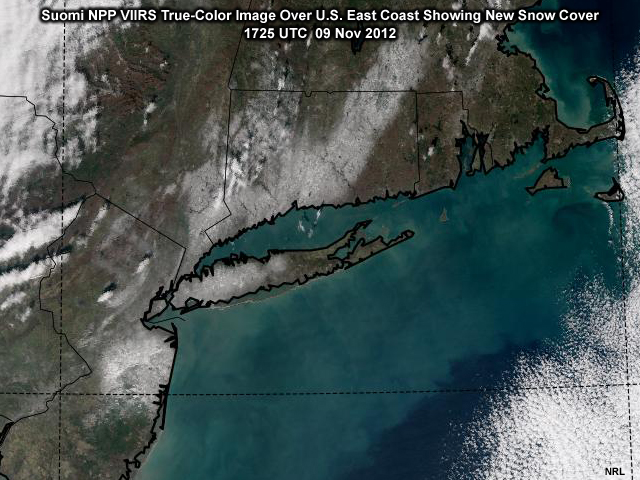
Description:
A VIIRS true-color composite image taken by the Suomi NPP polar-orbiting satellite highlighting snow cover following a 'noreaster' storm affecting the U.S. East Coast taken at 1725 UTC on 9 November, 2012.
File Name:
viirs_rgb_ecoast_09nov12.jpg
Credits:
NRL
Copyright Terms:
COMET Standard Terms of Use
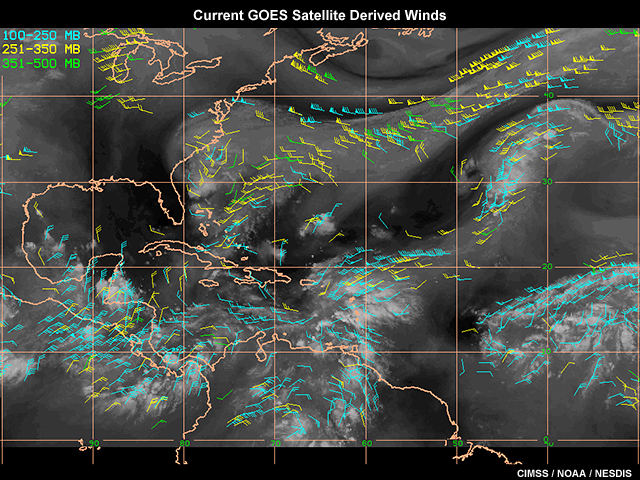
Description:
GOES satellite derived water vapor winds showing current wind data density with GOES 13 to 15 satellites.
File Name:
wv_sat_derived_winds_1.jpg
Credits:
CIMSS/NOAA/NESDIS
Copyright Terms:
COMET Standard Terms of Use

Description:
GOES satellite derived water vapor winds showing higher wind data density with GOES-R satellites compared to current GOES 13-15 satellites.
File Name:
wv_sat_derived_winds_2.jpg
Credits:
CIMSS/NOAA/NESDIS
Copyright Terms:
COMET Standard Terms of Use