Introduction
- EXPLORE THE ABI SPECTRUM lets you interactively investigate the Advanced Baseline Imager (ABI) channels and the phenomena that they will be able to monitor.
- APPLICATIONS explores the improvements that the ABI will bring to forecasting, numerical modeling, and climate and environmental monitoring.
- RESOURCES provides links to the module quiz, survey, and other sections of the module along with references, summary tables and additional Internet resources about the GOES-R ABI instrument.
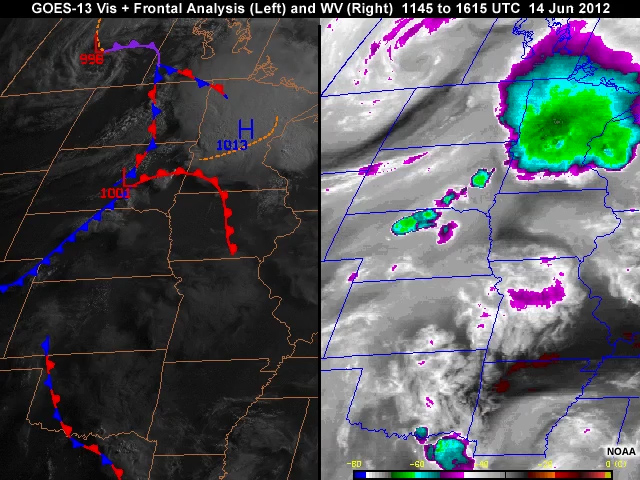
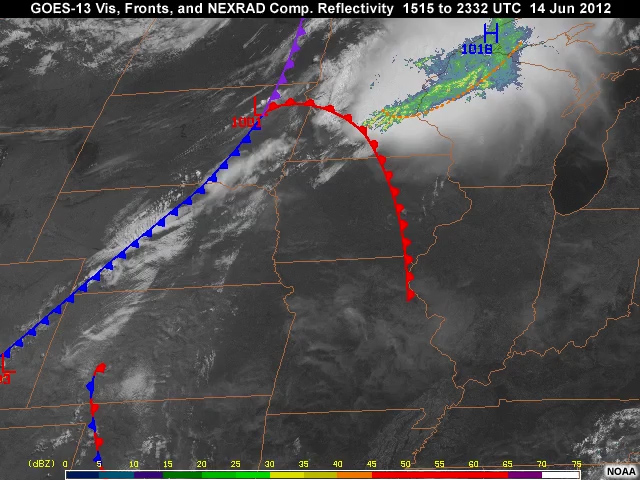
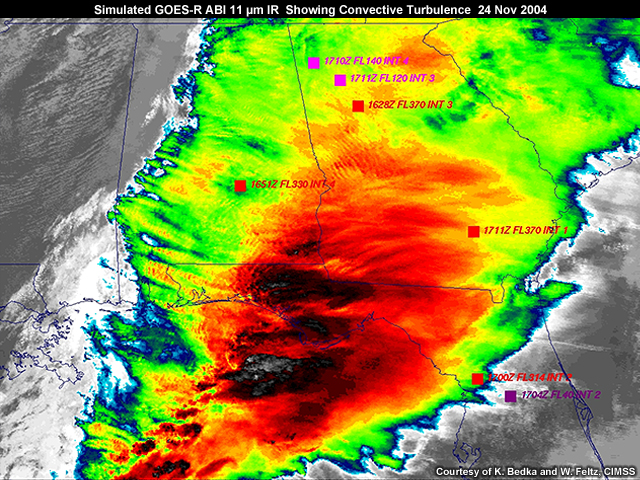
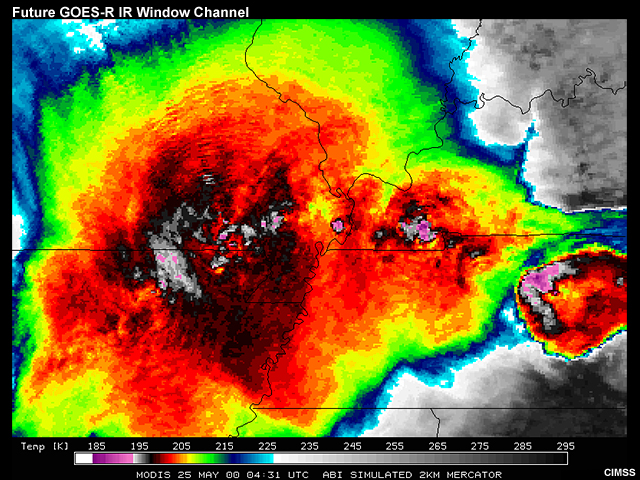
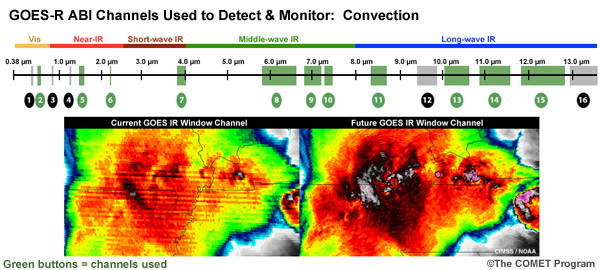
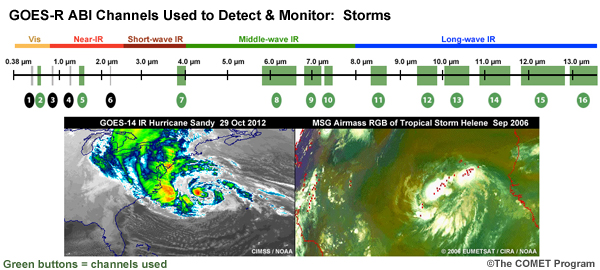
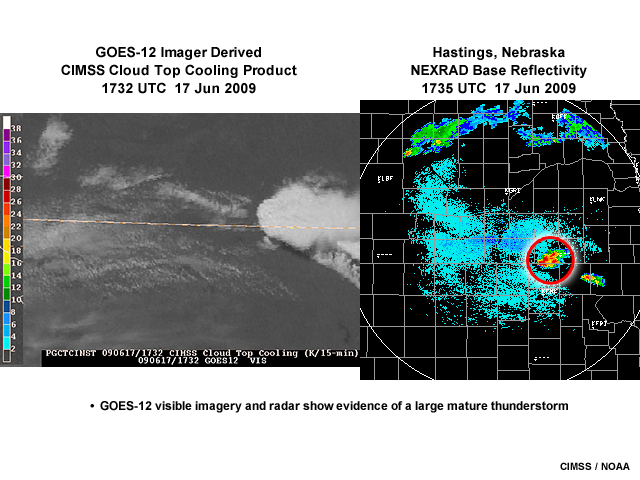
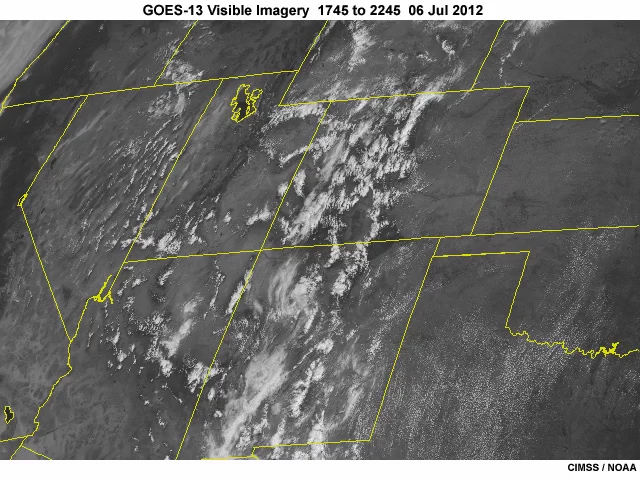
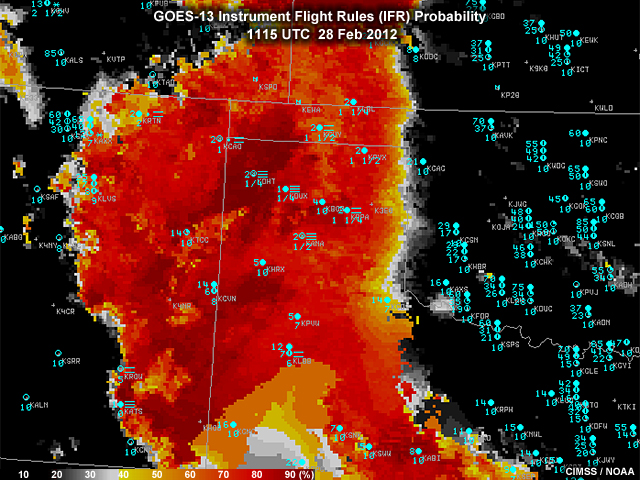
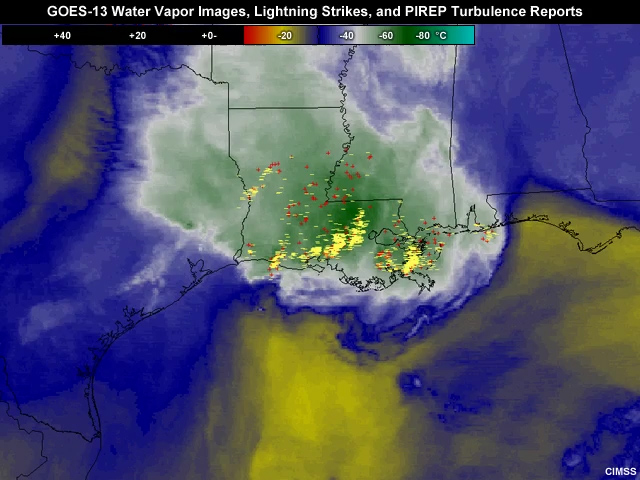
A strong surge of moist unstable air is being transported into the region ahead of an approaching cold front and upper-level shortwave. These features are expected to help trigger a round of potentially severe convection during the mid-afternoon to late evening hours. Outflow boundaries from nighttime and early morning thunderstorms are also likely to help focus some of the initial development of afternoon convection.
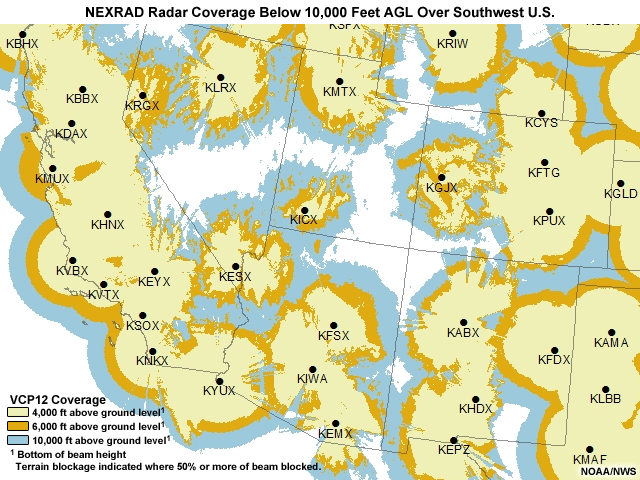
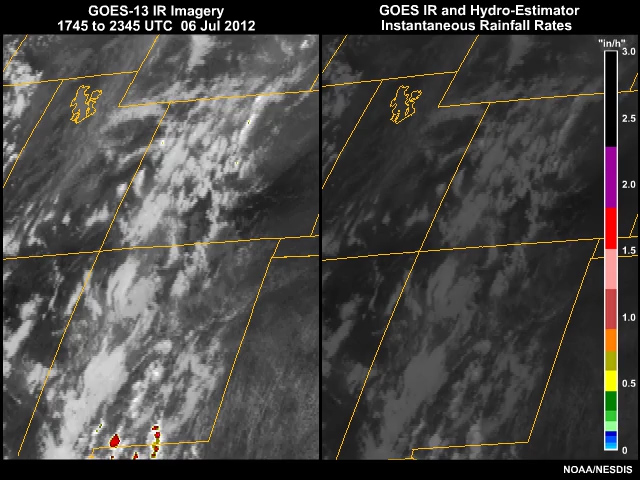
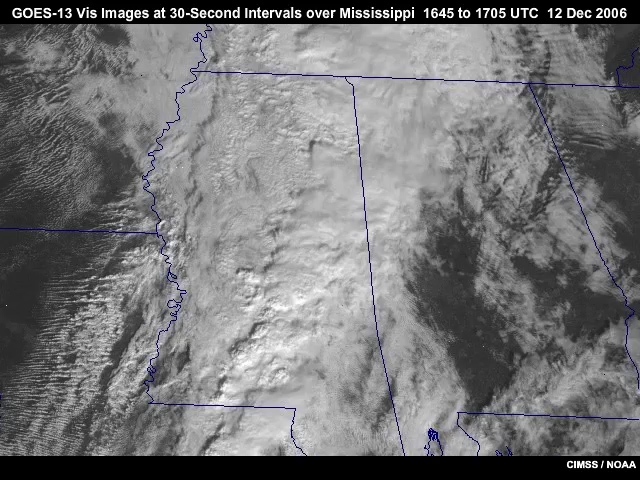
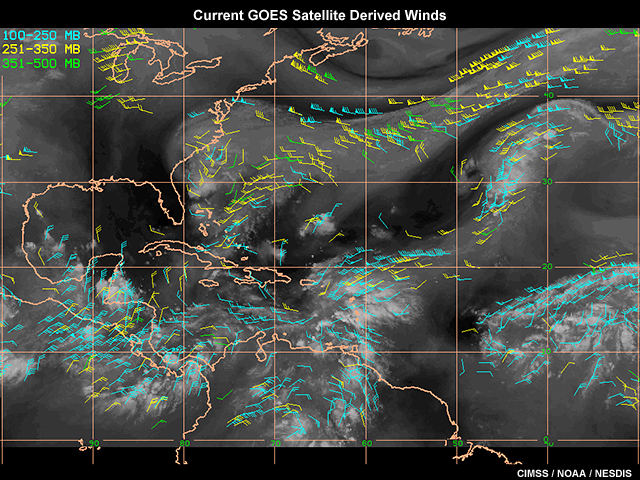
You are monitoring GOES imagery for towering cumulus and sounder derived products for trends in atmospheric stability. This can provide extra lead time before strong radar echoes show up. Current 15-minute and occasional 30-minute GOES imagery makes it difficult to capture individual cells that can form and intensify rapidly. Tracking the cells is also complicated by the imaging intervals. They're either too long or not concurrent with the 5-minute radar updates.
The GOES-R Advanced Baseline Imager (or ABI) will offer significant improvements to imaging resolution, refresh rates, and spectral coverage that will greatly facilitate the monitoring of the pre–convective and storm environments. Image products will capture storm evolution from the earliest stages of convective cloud formation to dissipation in detail that’s never been seen before. In addition, the ABI’s enhanced capabilities will allow imaging data and derived parameters to be combined with radar, lightning, and other data sets in new ways that leverage the strengths of each observing system and give forecasters the tools needed for improved analyses, nowcasts, and short-term forecasts.
This scenario highlights some of the improvements that the GOES-R ABI instrument will bring to weather forecasting. The rest of the module takes a closer look at the ABI’s capabilities and improvements. It shows how they will impact other forecast situations, numerical weather prediction (NWP), and climate and environmental monitoring.
The first GOES–R satellite is expected to launch in late 2015. It will begin nearly a decade of service to improve the quality and timeliness of weather and other environmental observations in the Western Hemisphere.
A cornerstone of the mission is the 16-channel ABI instrument.
The ABI will improve on the current GOES imager with:
- Increased spectral coverage
- Four times higher spatial resolution
- Five times faster imaging
- Improved image pixel geolocation and instrument performance
Let’s review these one by one.
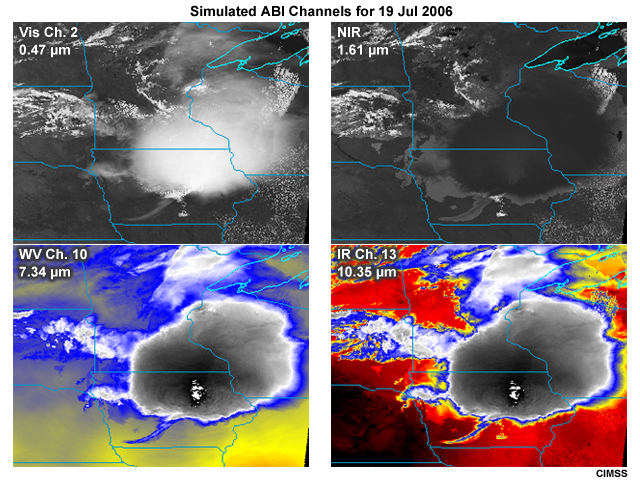
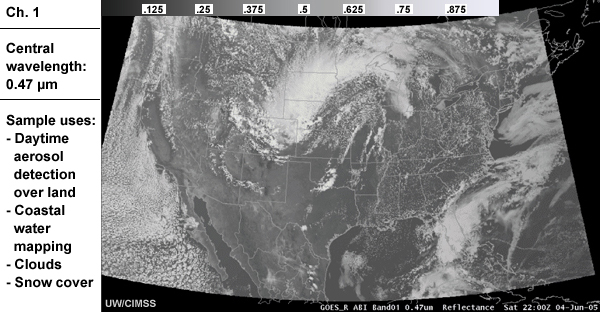
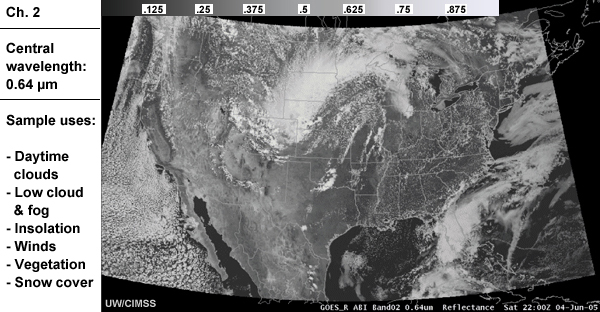
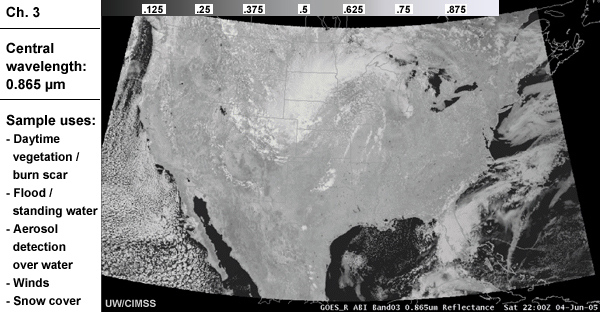
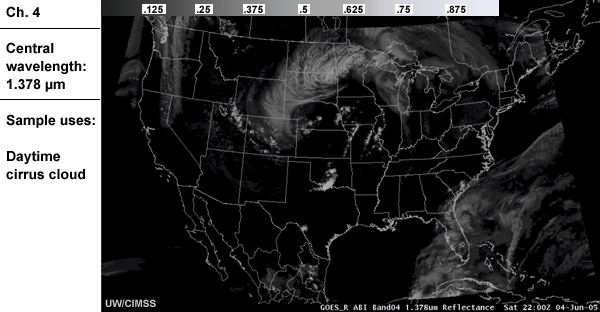
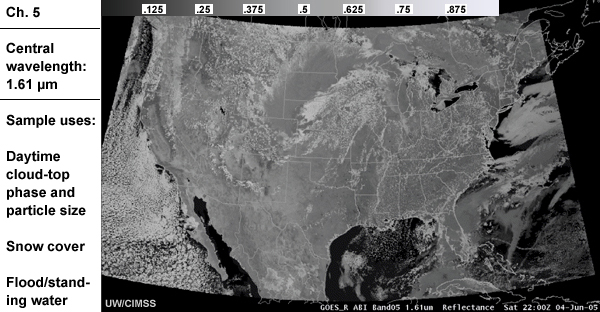
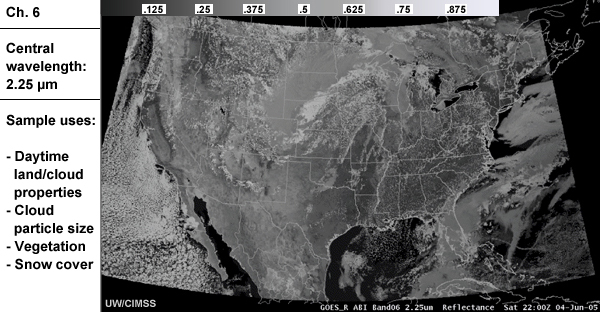
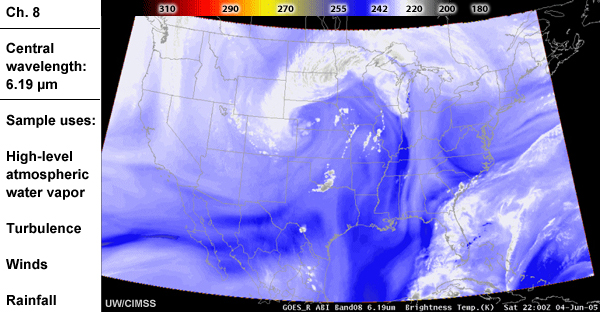
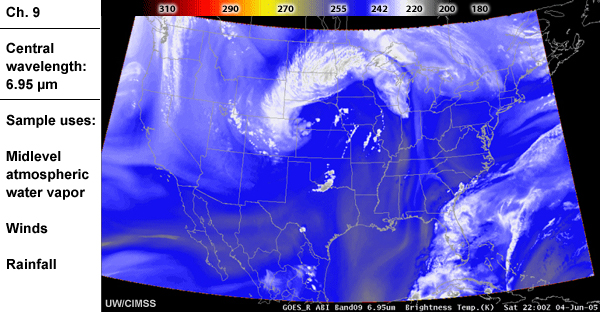
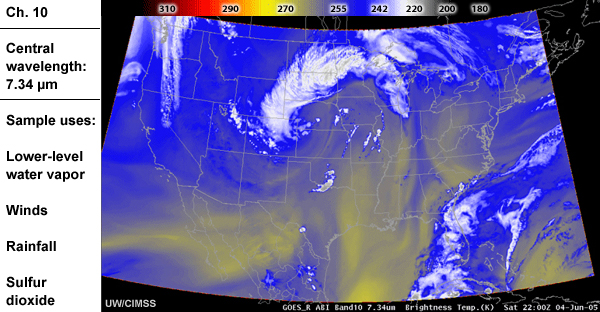
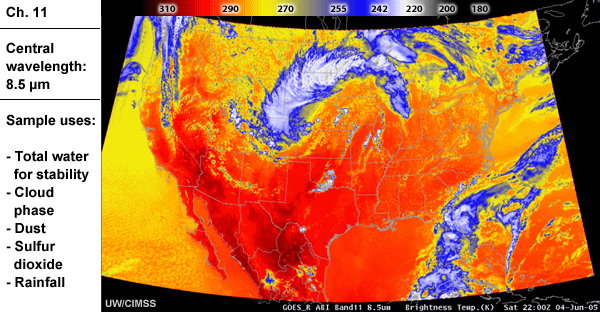
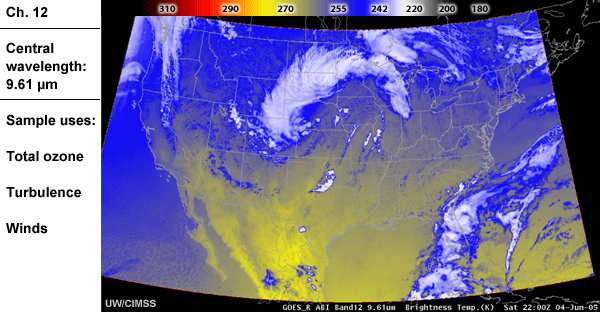
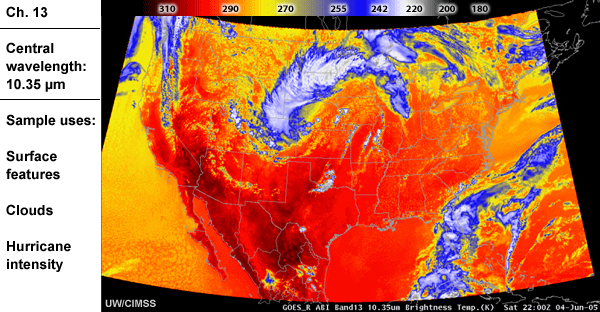
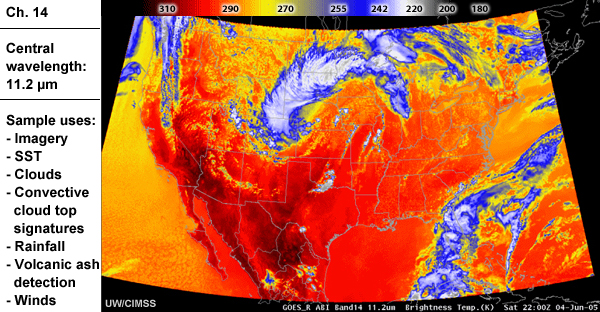
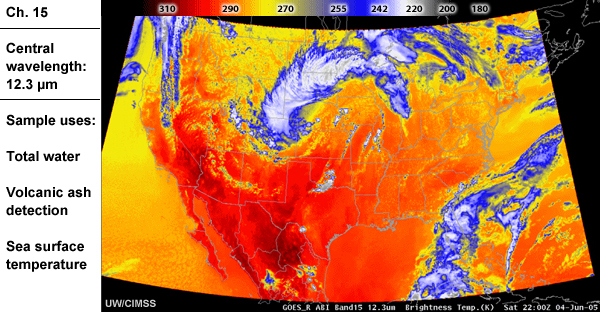
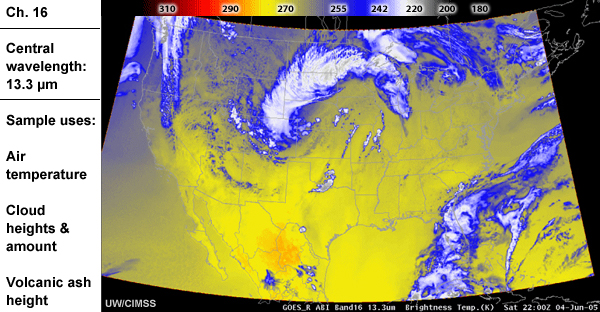
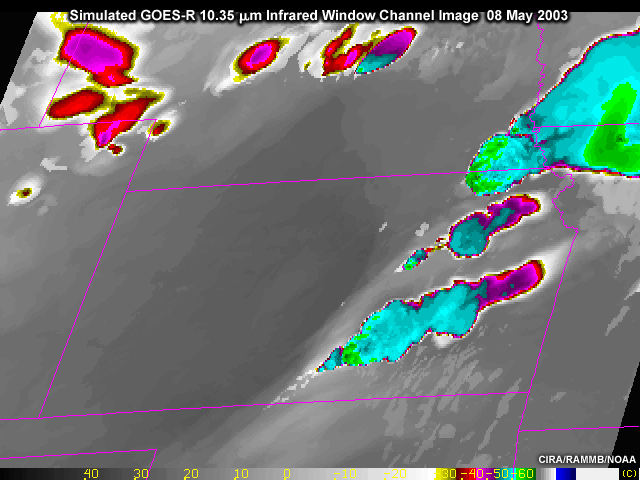
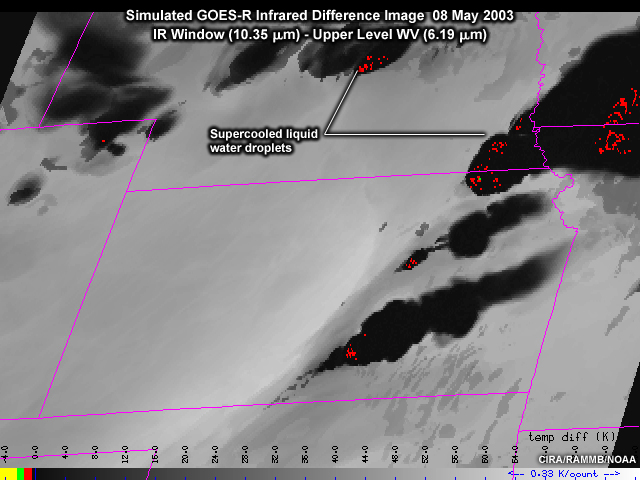
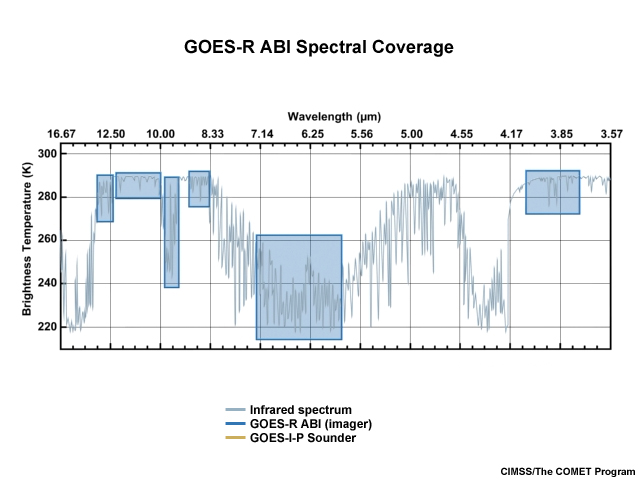
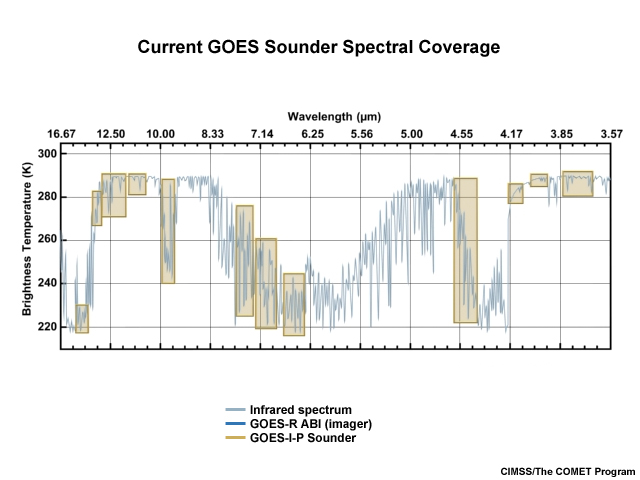
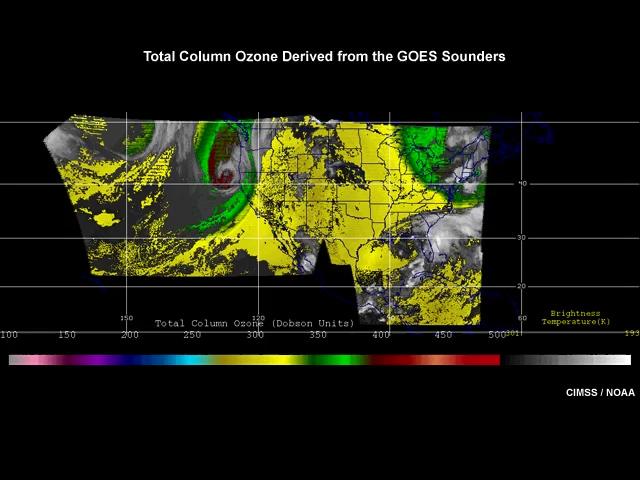
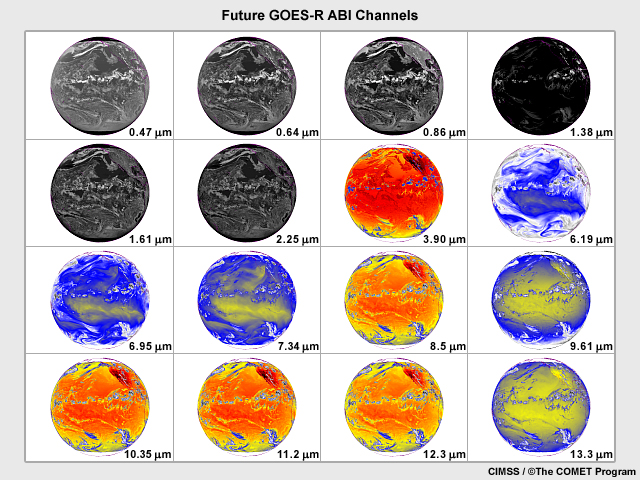
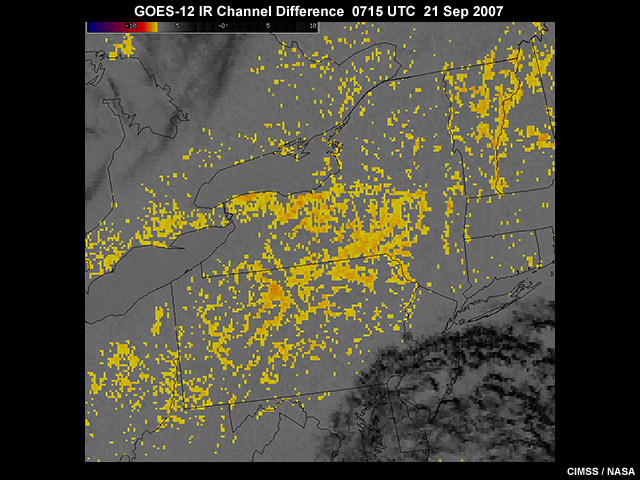
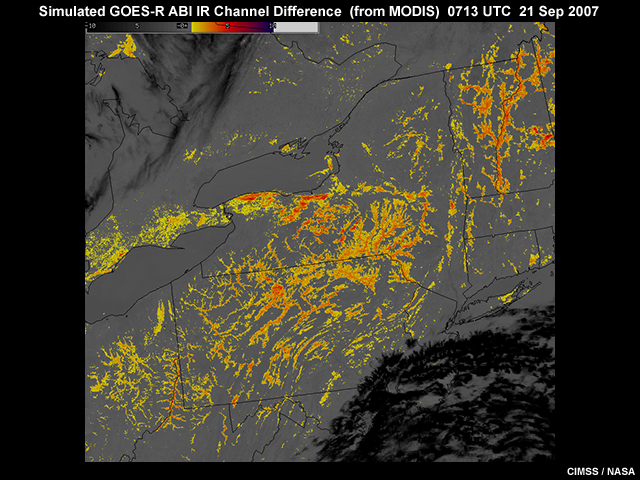
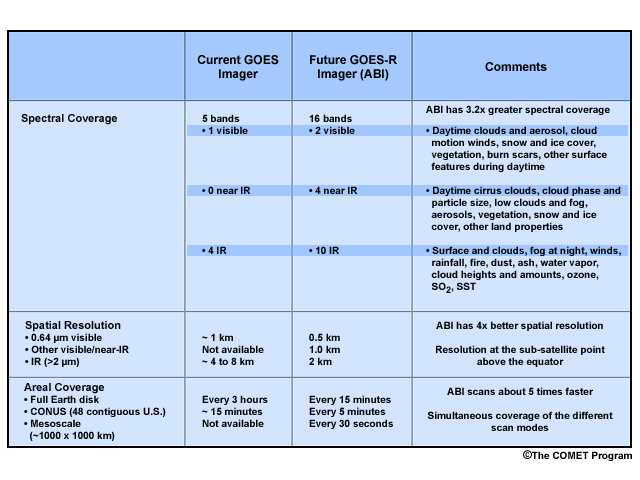
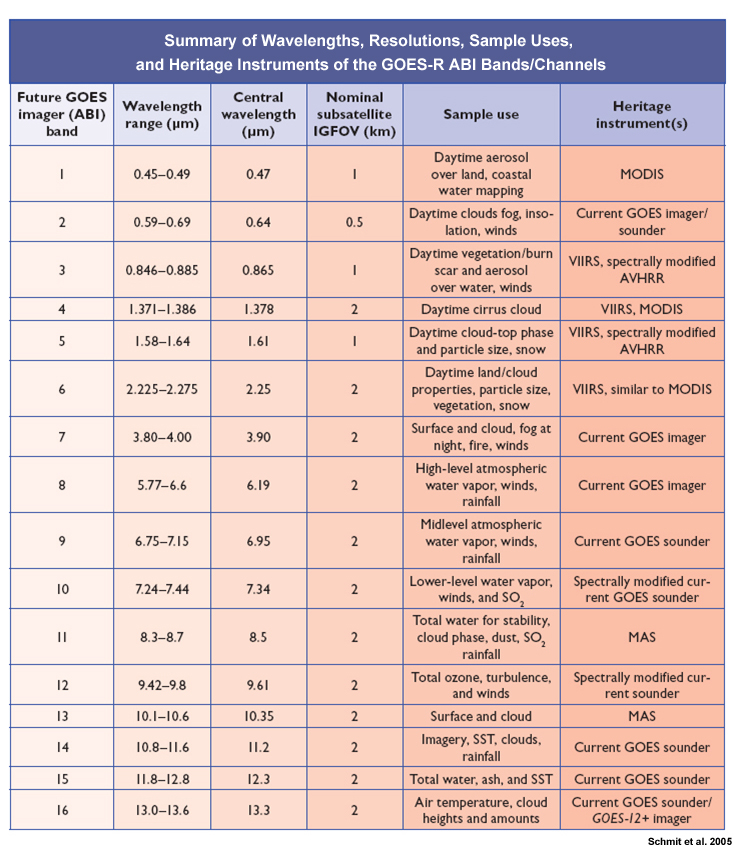
The ABI has an expanded suite of 16 spectral channels in the visible, near-infrared, and infrared regions. A new channel in the shorter wavelength portion of the visible spectrum (also known as the "blue region") will improve aerosol detection. In the near-infrared, four new channels will offer dramatic improvements for characterizing land and cloud properties and detecting aerosols over water. And in the middle and longwave portions of the infrared, six additional channels will improve depictions of tropospheric water vapor, dust, ash, sulfur dioxide, ozone, clouds, rainfall, and surface temperature.
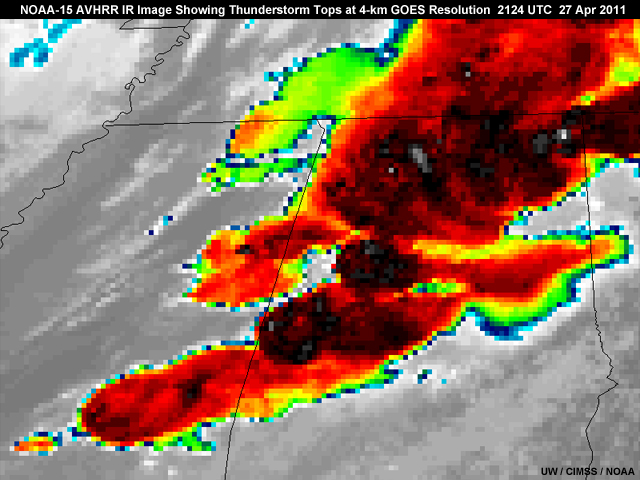
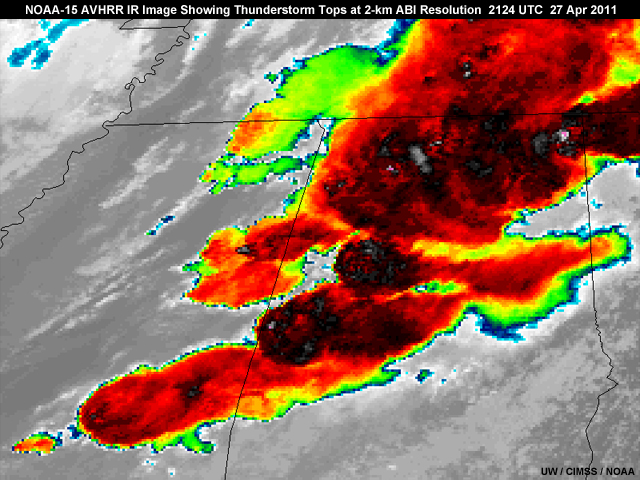
Most ABI channels will have four times higher spatial resolution than the current GOES channels. This is due to two times better resolution in the north–south and west–east directions. Resolution for the current visible channel will improve from 1 to 0.5 km, and the resolution for the new shortwave visible channel (the so-called "blue" channel) will be 1 km.
Two of the new near-infrared channels will be sampled at 1 km, with resolution for the remaining near-infrared and infrared channels improving from 4 to 2 km.
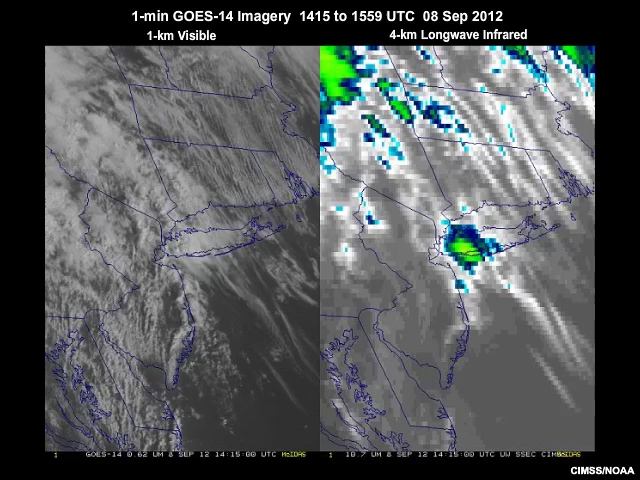
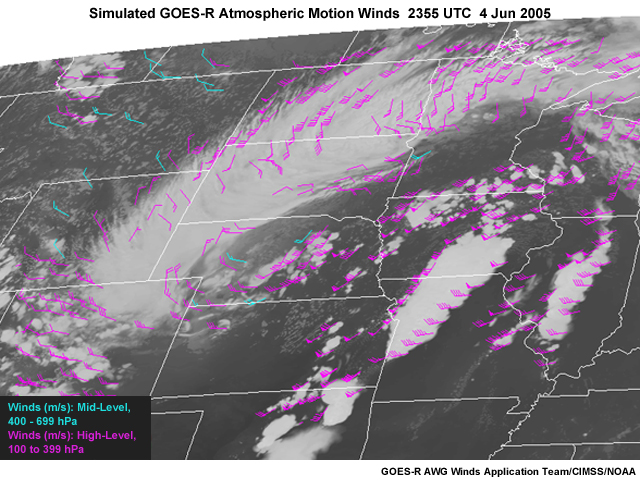
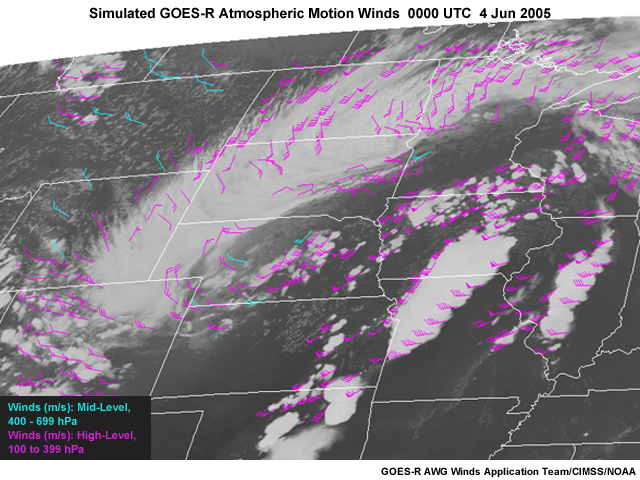
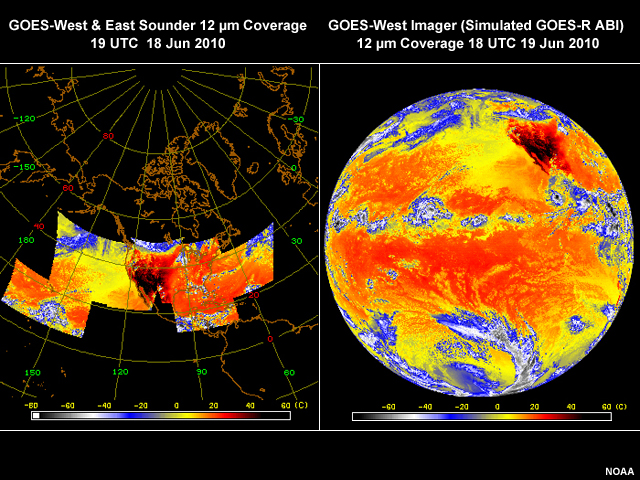
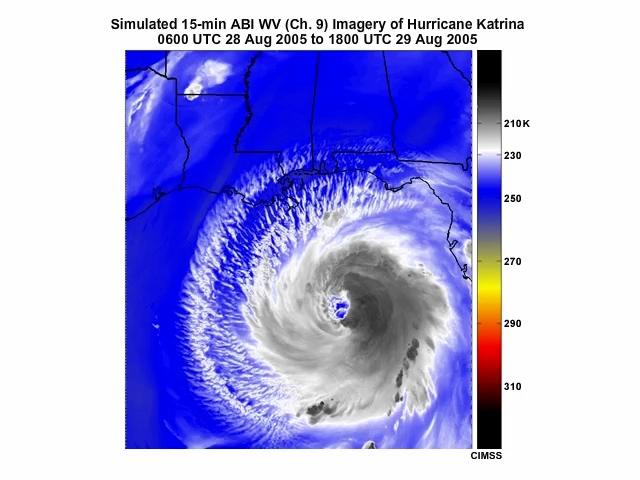
ABI imagery and derived products will be produced for most of the Western Hemisphere every 15 minutes compared to the current three-hour interval. Over the contiguous United States, the viewing interval will shrink from the current 15 or 30 minutes to every 5 minutes. And a smaller scale movable area will provide imagery and a subset of products every 30 seconds, or two areas every minute, during severe weather and to monitor other environmental phenomena.
As this ABI simulation shows, all three coverage intervals will update and provide products concurrently and continually. The ABI’s new scanning technology will eliminate scheduling conflicts and tradeoffs necessary for the current GOES.
Landmarks and other features on the ground often move in animations of current GOES imagery. This is especially noticeable when viewing high-resolution visible imagery. Some of the shifting can be as much as 4 km during the daytime and 6 km at night.
With a more advanced spacecraft and onboard image navigation and pixel registration system, the GOES-R ABI will reduce the amount of image-to-image movement of surface features to 2 km during daytime and 3 km at night.
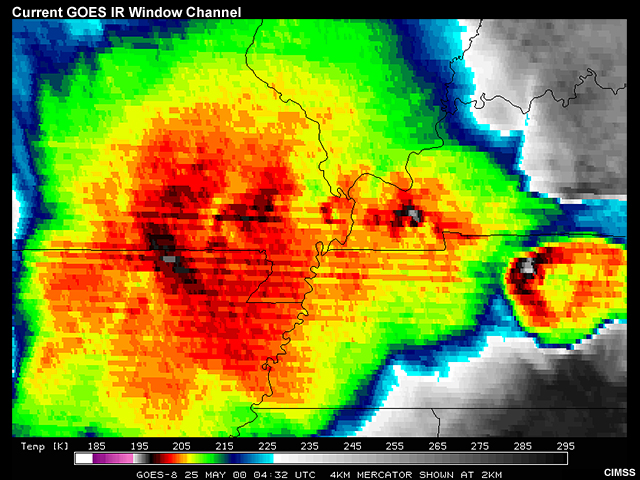
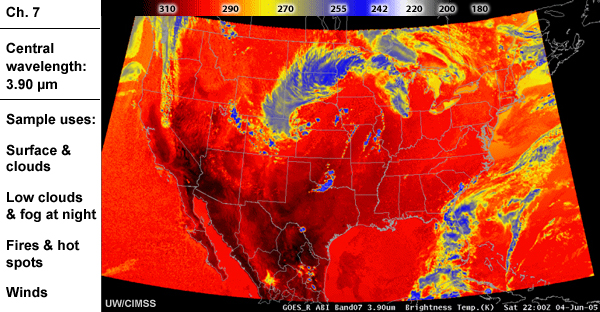
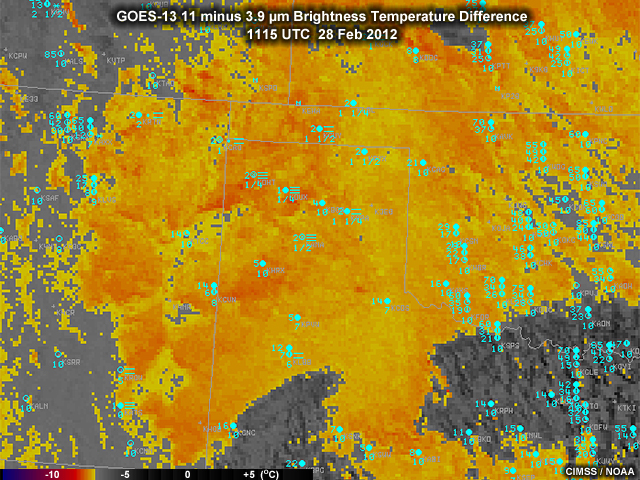
Pixel noise will also be reduced in the ABI imagery and products. With the current GOES, pixel noise becomes apparent when relatively little energy hits a detector. The effect is most common in the 3.9 micrometer channel, where relatively little energy is available at cold temperatures, and in the visible near sunrise and sunset. Noisy pixels are especially noticeable for very cold wintertime scenes during nighttime and for thick cirrus cloud cover such as the cold anvil cirrus cloud found atop thunderstorms.
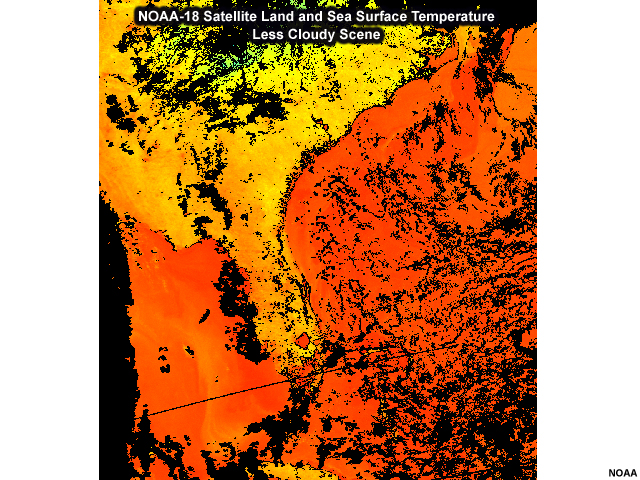
ABI imagery will have less noise and pixel values will be better calibrated. This will improve the visual appearance of imagery and allow for more accurate derived products. These include cloud top particle size and liquid water content, vegetation health, fire properties, surface temperature, and aerosol properties related to pollution, dust, and smoke. Improved clear-sky brightness temperatures will provide better support for analysis and nowcasting, numerical weather prediction, and climate applications.
Collectively, these improvements will result in more accurate measurements for observing detailed structures and subtle features, especially on the regional and meso-scales.
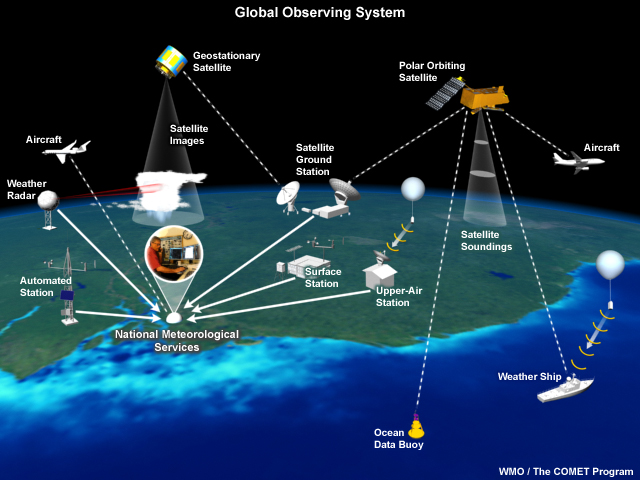
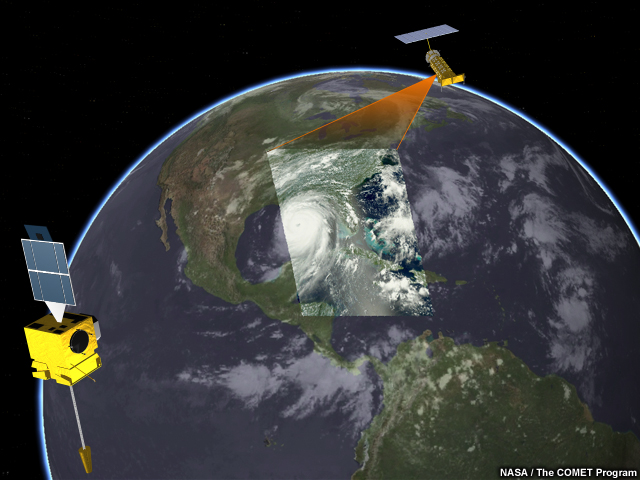
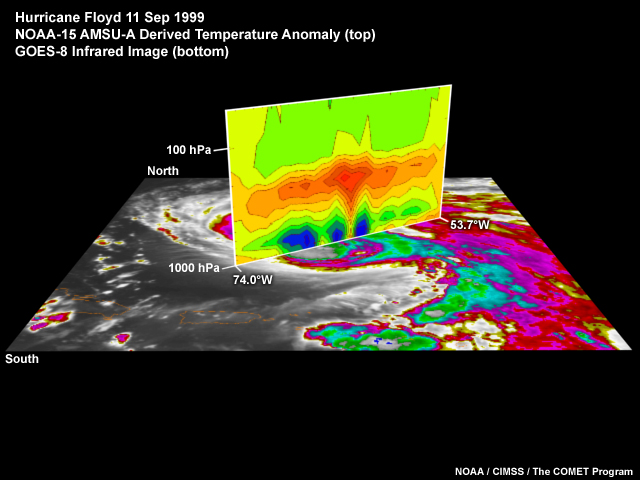
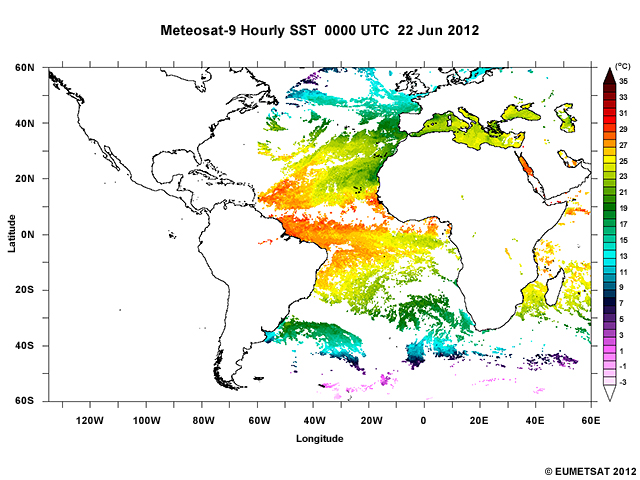
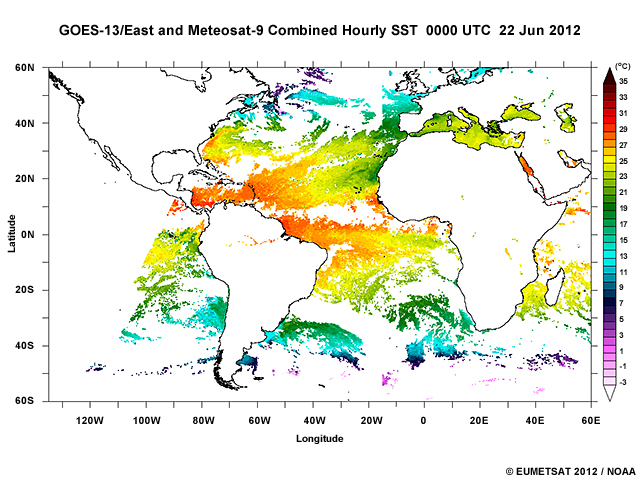
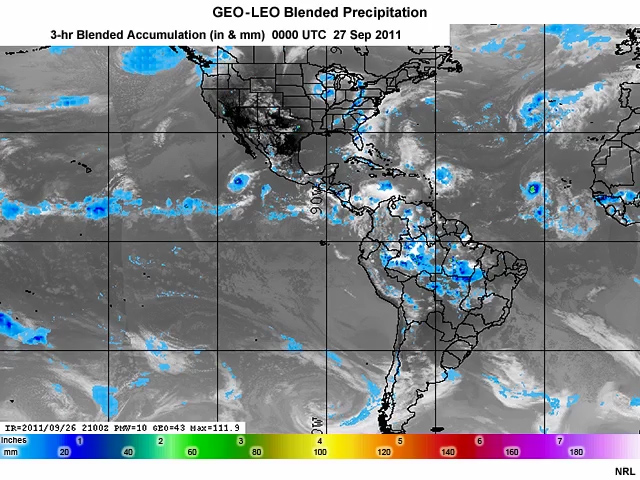
Improved measurements will also make it easier to fuse ABI data with observations from other satellites and other observing platforms and systems.
Polar-orbiting environmental satellites, for example, are better equipped for vertical atmospheric profiling, monitoring atmospheric constituents, measuring precipitation, and observing Earth’s Polar Regions.
Missions that include Suomi NPP, Metop, DMSP, GCOM, and the future JPSS polar orbiters provide observations vital for the success of meteorology, numerical weather prediction, and climate monitoring.
By leveraging the capabilities of GOES and polar-orbiting satellites, tomorrow’s integrated satellite system will improve and expand observations to more effectively support weather analyses, forecasts, advisories and warnings, climate monitoring, and related activities for meteorological and other environmental services across much of the Western Hemisphere.
As a result of these improvements and an increased synergy between various observing systems, the ABI will produce 50 times more information than earlier GOES imagers.
A strong surge of moist unstable air is being transported into the region ahead of an approaching cold front and upper-level shortwave. These features are expected to help trigger a round of potentially severe convection during the mid-afternoon to late evening hours. Outflow boundaries from nighttime and early morning thunderstorms are also likely to help focus some of the initial development of afternoon convection.
You are monitoring GOES imagery for towering cumulus and sounder derived products for trends in atmospheric stability. This can provide extra lead time before strong radar echoes show up. Current 15-minute and occasional 30-minute GOES imagery makes it difficult to capture individual cells that can form and intensify rapidly. Tracking the cells is also complicated by the imaging intervals. They're either too long or not concurrent with the 5-minute radar updates.
The first GOES–R satellite is expected to launch in late 2015. It will begin nearly a decade of service to improve the quality and timeliness of weather and other environmental observations in the Western Hemisphere.
The GOES-R Advanced Baseline Imager (or ABI) will offer significant improvements to imaging resolution, refresh rates, and spectral coverage that will greatly facilitate the monitoring of the pre–convective and storm environments. Image products will capture storm evolution from the earliest stages of convective cloud formation to dissipation in detail that’s never been seen before. In addition, the ABI’s enhanced capabilities will allow imaging data and derived parameters to be combined with radar, lightning, and other data sets in new ways that leverage the strengths of each observing system and give forecasters the tools needed for improved analyses, nowcasts, and short-term forecasts.
This scenario highlights some of the improvements that the GOES-R ABI instrument will bring to weather forecasting. The rest of the module takes a closer look at the ABI’s capabilities and improvements. It shows how they will impact other forecast situations, numerical weather prediction (NWP), and climate and environmental monitoring.
The first GOES–R satellite is expected to launch in late 2015. It will begin nearly a decade of service to improve the quality and timeliness of weather and other environmental observations in the Western Hemisphere.
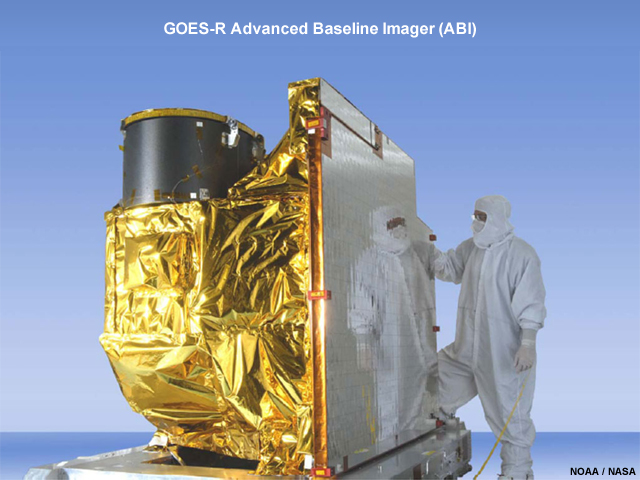
A cornerstone of the mission is the 16-channel ABI instrument.
The ABI will improve on the current GOES imager with:
- Increased spectral coverage
- Four times higher spatial resolution
- Five times faster imaging
- Improved image pixel geolocation and instrument performance
Let’s review these one by one.
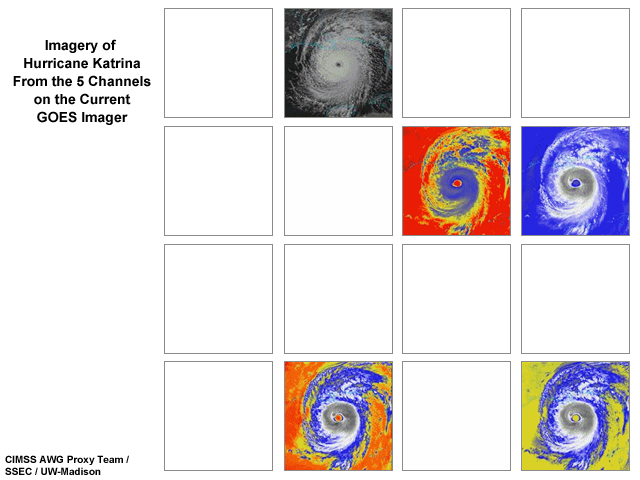
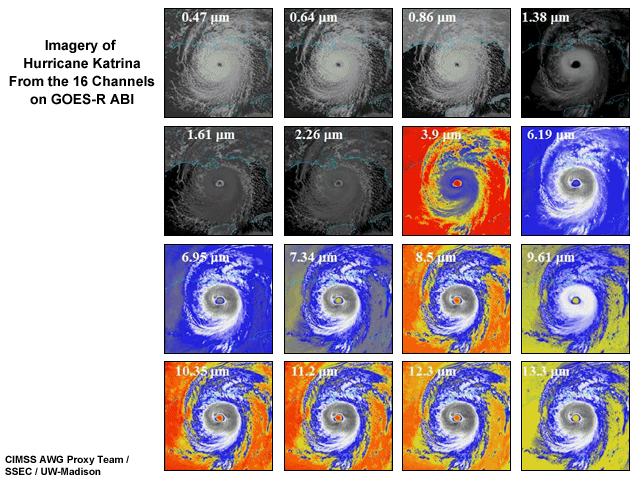
The ABI has an expanded suite of 16 spectral channels in the visible, near-infrared, and infrared regions. A new channel in the shorter wavelength portion of the visible spectrum (also known as the "blue region") will improve aerosol detection. In the near-infrared, four new channels will offer dramatic improvements for characterizing land and cloud properties and detecting aerosols over water. And in the middle and longwave portions of the infrared, six additional channels will improve depictions of tropospheric water vapor, dust, ash, sulfur dioxide, ozone, clouds, rainfall, and surface temperature.
Most ABI channels will have four times higher spatial resolution than the current GOES channels. This is due to two times better resolution in the north–south and west–east directions. Resolution for the current visible channel will improve from 1 to 0.5 km, and the resolution for the new shortwave visible channel (the so-called "blue" channel) will be 1 km.
Two of the new near-infrared channels will be sampled at 1 km, with resolution for the remaining near-infrared and infrared channels improving from 4 to 2 km.
ABI imagery and derived products will be produced for most of the Western Hemisphere every 15 minutes compared to the current three-hour interval. Over the contiguous United States, the viewing interval will shrink from the current 15 or 30 minutes to every 5 minutes. And a smaller scale movable area will provide imagery and a subset of products every 30 seconds, or two areas every minute, during severe weather and to monitor other environmental phenomena.
As this ABI simulation shows, all three coverage intervals will update and provide products concurrently and continually. The ABI’s new scanning technology will eliminate scheduling conflicts and tradeoffs necessary for the current GOES.
Landmarks and other features on the ground often move in animations of current GOES imagery. This is especially noticeable when viewing high-resolution visible imagery. Some of the shifting can be as much as 4 km during the daytime and 6 km at night.
With a more advanced spacecraft and onboard image navigation and pixel registration system, the GOES-R ABI will reduce the amount of image-to-image movement of surface features to 2 km during daytime and 3 km at night.
Pixel noise will also be reduced in the ABI imagery and products. With the current GOES, pixel noise becomes apparent when relatively little energy hits a detector. The effect is most common in the 3.9 micrometer channel, where relatively little energy is available at cold temperatures, and in the visible near sunrise and sunset. Noisy pixels are especially noticeable for very cold wintertime scenes during nighttime and for thick cirrus cloud cover such as the cold anvil cirrus cloud found atop thunderstorms.
ABI imagery will have less noise and pixel values will be better calibrated. This will improve the visual appearance of imagery and allow for more accurate derived products. These include cloud top particle size and liquid water content, vegetation health, fire properties, surface temperature, and aerosol properties related to pollution, dust, and smoke. Improved clear-sky brightness temperatures will provide better support for analysis and nowcasting, numerical weather prediction, and climate applications.
Collectively, these improvements will result in more accurate measurements for observing detailed structures and subtle features, especially on the regional and meso-scales.
Improved measurements will also make it easier to fuse ABI data with observations from other satellites and other observing platforms and systems.
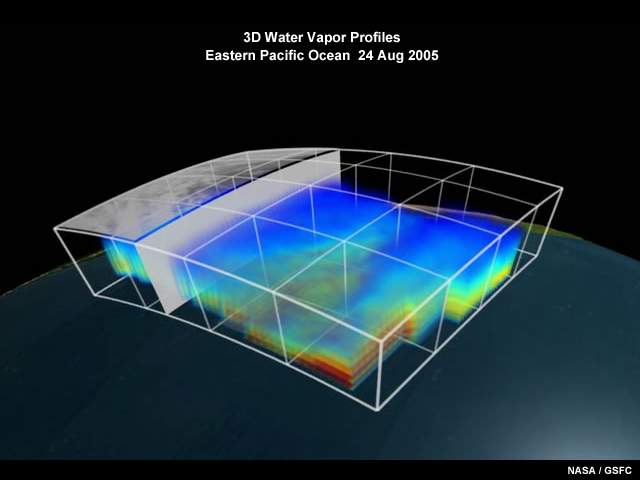
Polar-orbiting environmental satellites, for example, are better equipped for vertical atmospheric profiling, monitoring atmospheric constituents, measuring precipitation, and observing Earth’s Polar Regions.
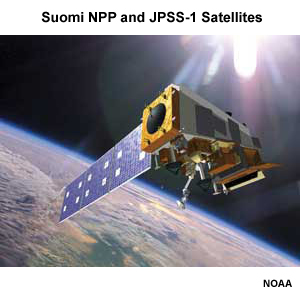
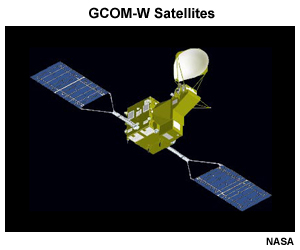
Missions that include Suomi NPP, Metop, DMSP, GCOM, and the future JPSS polar orbiters provide observations vital for the success of meteorology, numerical weather prediction, and climate monitoring.
By leveraging the capabilities of GOES and polar-orbiting satellites, tomorrow’s integrated satellite system will improve and expand observations to more effectively support weather analyses, forecasts, advisories and warnings, climate monitoring, and related activities for meteorological and other environmental services across much of the Western Hemisphere.
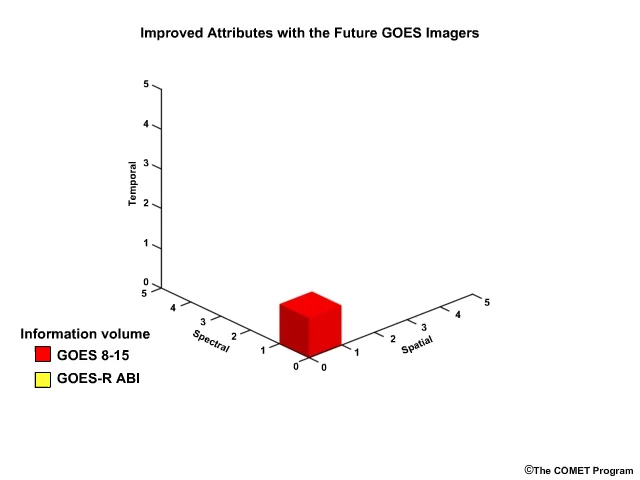
As a result of these improvements and an increased synergy between various observing systems, the ABI will produce 50 times more information than earlier GOES imagers.
Applications
Click each application to learn about the improvements that GOES-R ABI will bring.
Applications »
Nowcasting Convection
A cold front and developing dryline are moving into a moist and conditionally unstable airmass across your region. Strong and potentially severe convective storms are expected to form during the afternoon. From GOES visible imagery, you can already see towering cumulus clouds forming ahead of the dryline and portions of the cold front. You would like to determine which of the immature cells have a greater chance of becoming deep convection and producing severe weather. Figuring this out as early as possible will let you increase your lead time should it become necessary to issue a warning.
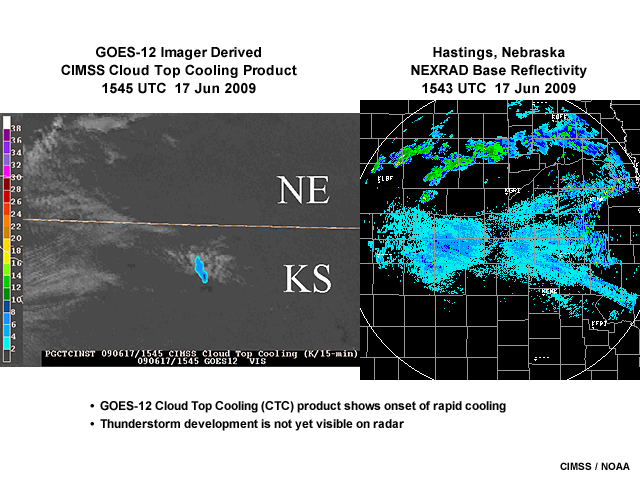
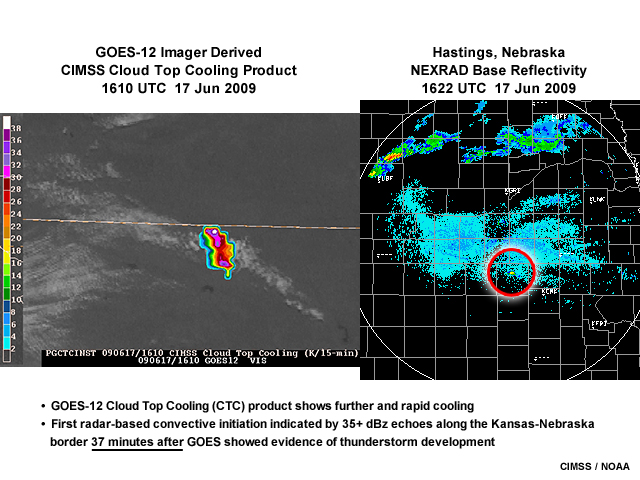
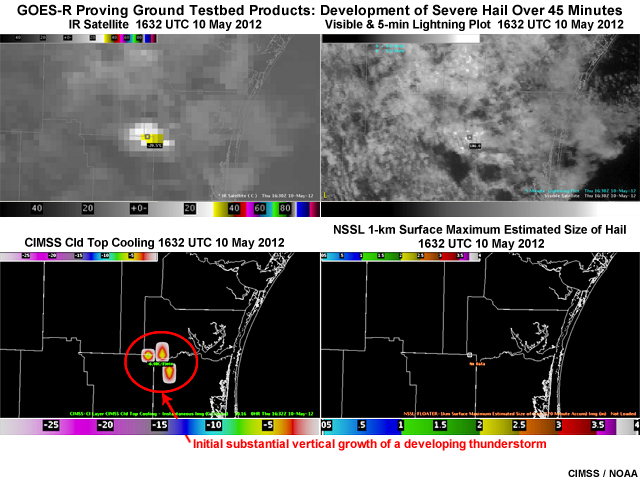
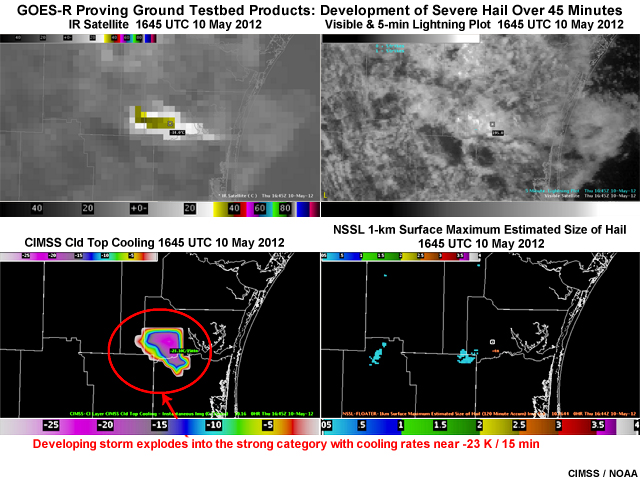
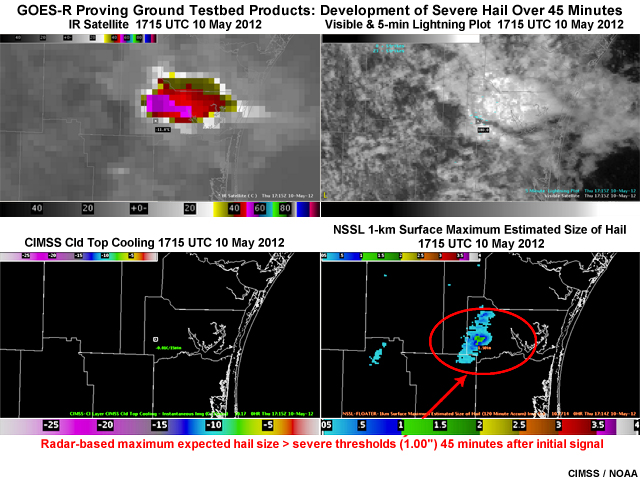
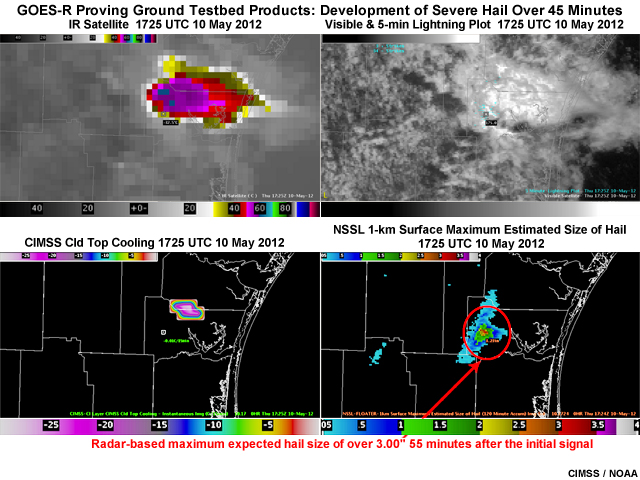
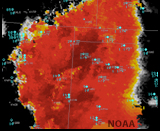
Even with the limited number of current GOES spectral channels, efforts to leverage them for identification and early diagnosis of rapidly deepening convection have met with some success. Strong infrared-based cloud top cooling rates, for example, are an early indicator of cells with a greater potential for producing severe weather.
Despite these efforts, additional spectral coverage and a higher refresh rate are needed to adequately capture and monitor cloud properties and the cloud environment, since they're closely linked to storm development and evolve on very short time scales.
The ABI’s 16 channels and frequent imaging will show changes in cloud top phase and particle size that can be used to assess storm growth and severity potential, even before a convective storm reaches its peak intensity.
Also, special thirty second to one-minute imaging intervals will be available for selectable 'regions of interest' and will allow monitoring of very rapid changes throughout a storm’s life cycle.
Greater 2-km spatial resolution will provide a clearer picture of storm top signatures such as the "warm wake" or "enhanced V", and over–shooting tops known to be associated with severe storms.

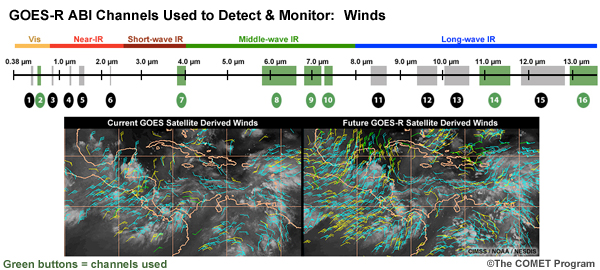
Rapid imaging and improved pixel geolocation will increase the number and accuracy of high–resolution mesoscale atmospheric motion vectors that allow monitoring of storm–scale upper–level divergence and low–level convergence, which are important for storm maintenance.
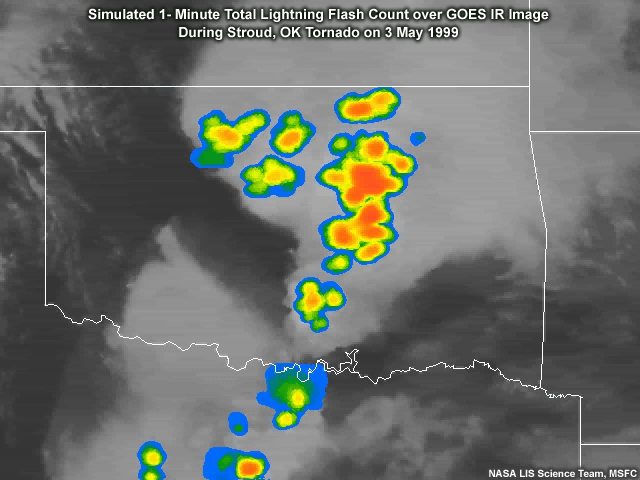
The combination of continuous lightning flash rate and trend measurements from the Geostationary Lightning Mapper (or GLM) and cloud top measurements from the ABI will help forecasters determine related trends in thunderstorm intensification and decay. This is expected to improve the warning lead time for tornadoes.
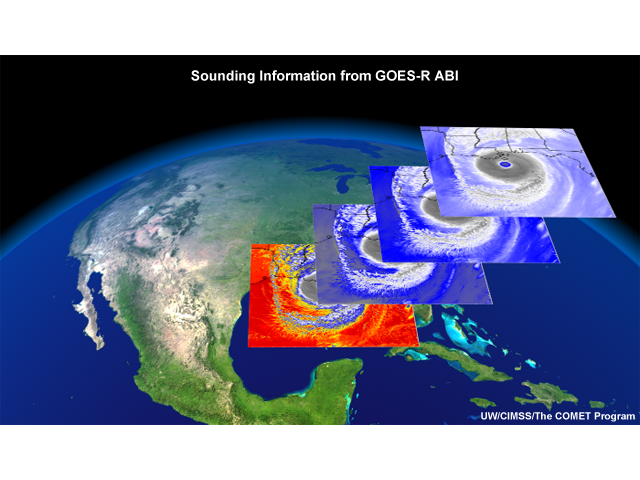
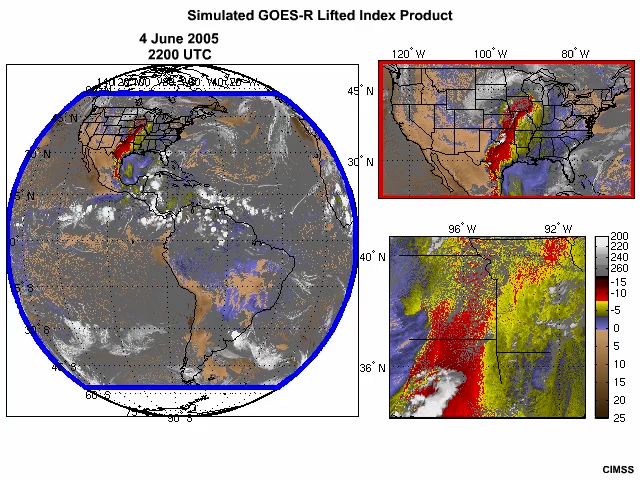
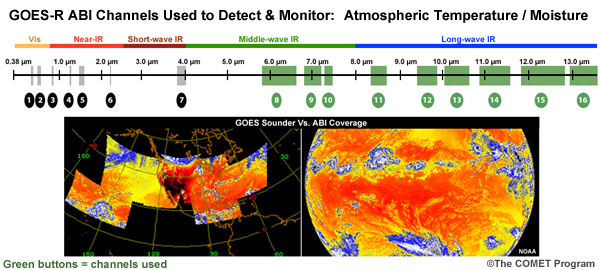
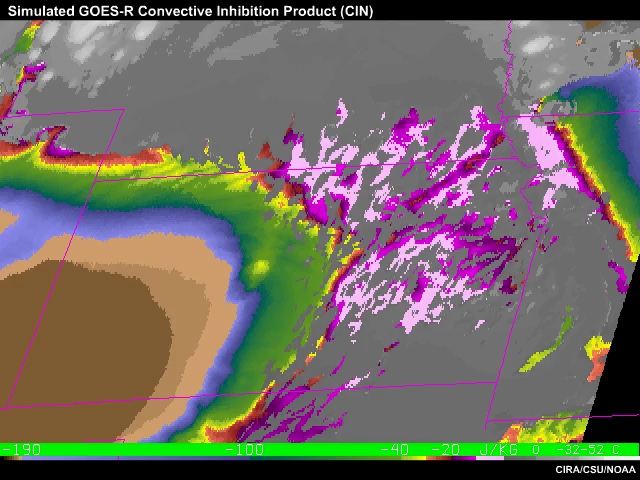
The GOES-R satellites will not have a dedicated sounder. However, despite its design as an imager, the ABI will continue to provide information on atmospheric moisture, temperature, and stability.
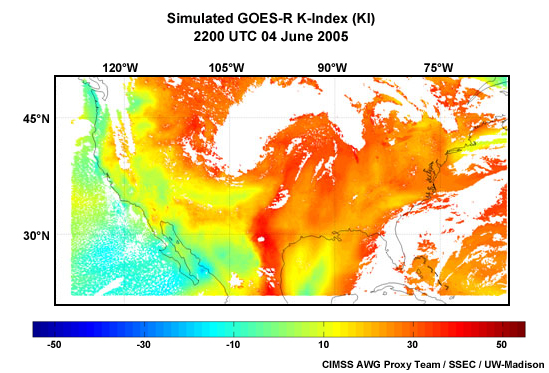
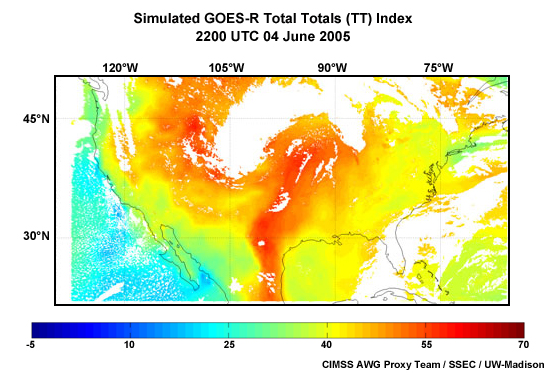
Stability indices in the form of image products will help forecasters anticipate the development of convection and severe storms in very short-range forecast situations.
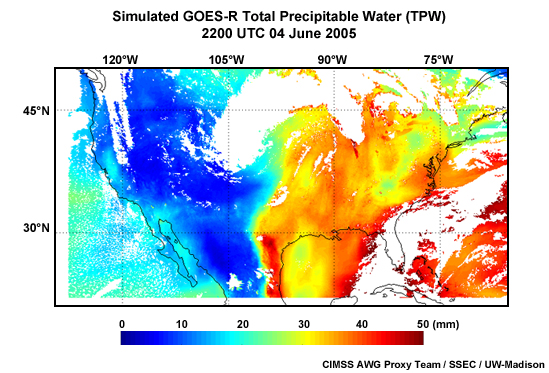
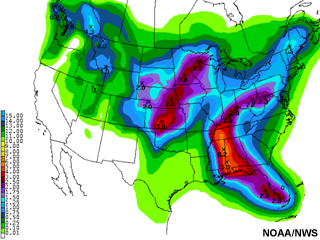
Moisture products, such as total precipitable water, will aid in assessing the risk for heavy rainfall.
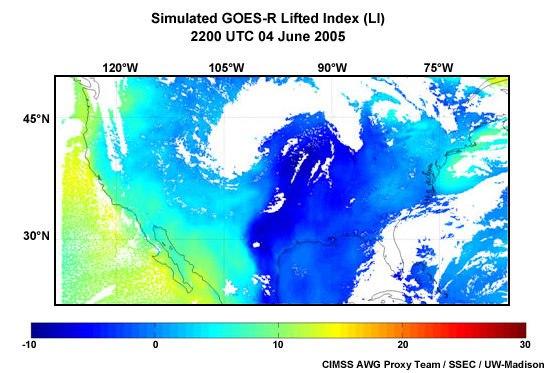
Although the ABI has an expanded suite of spectral channels, it has fewer channels that can be used for profiling atmospheric temperature and moisture when compared to the current GOES sounder.
The result is poorer vertical resolution, which will reduce the accuracy of the ABI’s sounding profiles and derived products.
However, the ABI's more frequent imaging and expanded areal coverage should mitigate some of the reduction in vertical resolution. In addition, ABI observations will be combined with forecasts from numerical weather prediction models to produce sounding products of nearly equivalent quality compared to those derived from the sounders on board GOES-8 to -15.
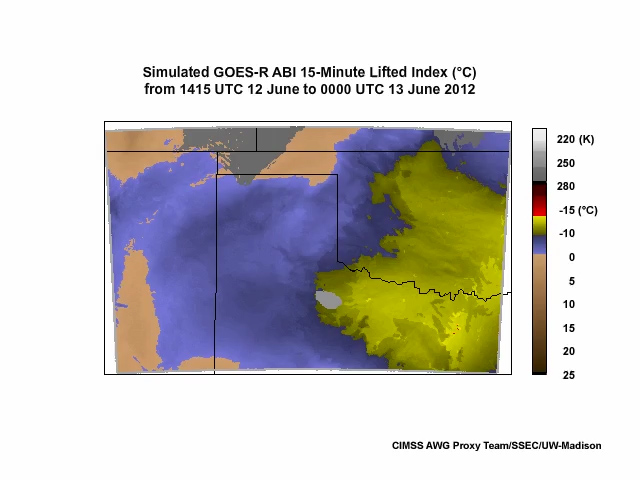
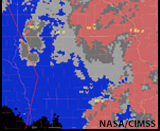
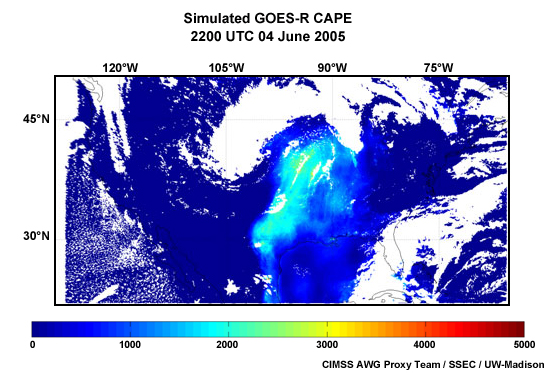
More frequent stability products, such as this simulated GOES-R lifted index, will help forecasters monitor rapid changes in the pre- and near-storm environment over time, improving situational awareness for potential watch and warning scenarios.
In summary, the enhanced capabilities of the GOES-R ABI will help provide an end-to-end, satellite-based thunderstorm nowcasting system. It will offer continuous information on pre-convective stability, convective initiation, storm maintenance, and cloud dissipation that will help forecasters improve lead time and forecast accuracy.
Applications »
Forecasting Flood Potential
Thunderstorms have developed in your area, and you need to forecast the potential for flooding...
...in mountainous terrain with limited radar coverage.
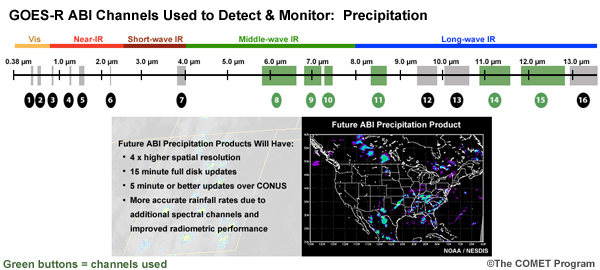
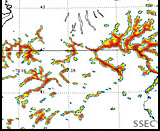
Current GOES infrared imagery and derived precipitation estimates may alert you that rainfall has probably started. But the imagery’s relatively poor time resolution and granular spatial resolution in the infrared are insufficient for capturing the finer details of various important storm structures. These include the locations of convective updrafts and overshooting tops, cloud top temperature patterns, cloud top microphysics, and trends associated with potentially intense rainfall rates. All of this information would be useful to more accurately assess the coverage and likely magnitude of potentially heavy rainfall. Without more detailed and comprehensive observations, it’s more difficult to anticipate when and where the potential for flooding may be greatest.
With enhanced spectral and spatial resolution, the ABI will better characterize cloud–top microphysical properties, such as hydrometeor phase and size distribution, that are important for diagnosing precipitation processes. This will improve the prediction of storm evolution and improve your ability to determine when flash flooding may be imminent.
The combination of ABI observations with lightning data from the Geostationary Lightning Mapper (or GLM) will provide new insights into precipitation formation processes that will lead to further improvements in precipitation estimates.
When flooding is anticipated, the ABI’s ability to scan focused areas at 30-second intervals will allow for better observation of rapidly changing storm conditions, improved monitoring of rainfall trends, and the issuance of more timely and accurate flash flood warnings and advisories to help emergency managers make better informed decisions.
Applications »
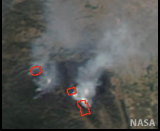
Monitoring Wildfires
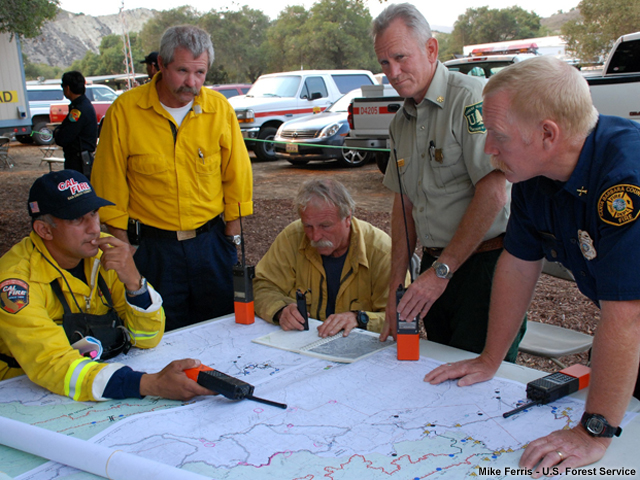
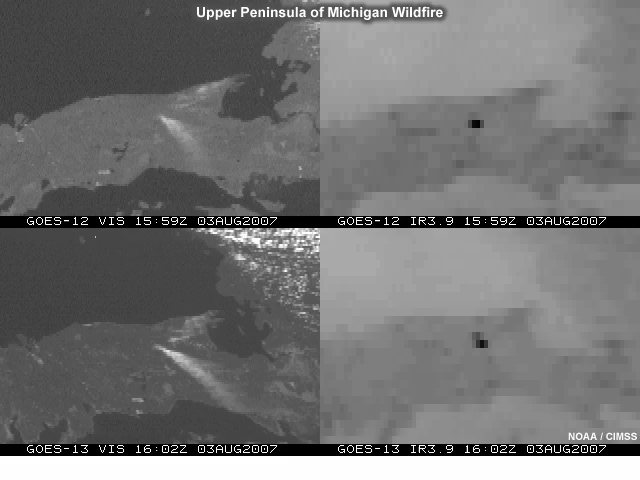
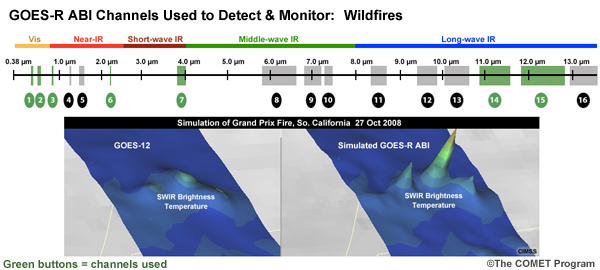
Assume that you are an incident meteorologist (or IMET) in a remote location supporting firefighting activities for a rapidly growing wildfire.
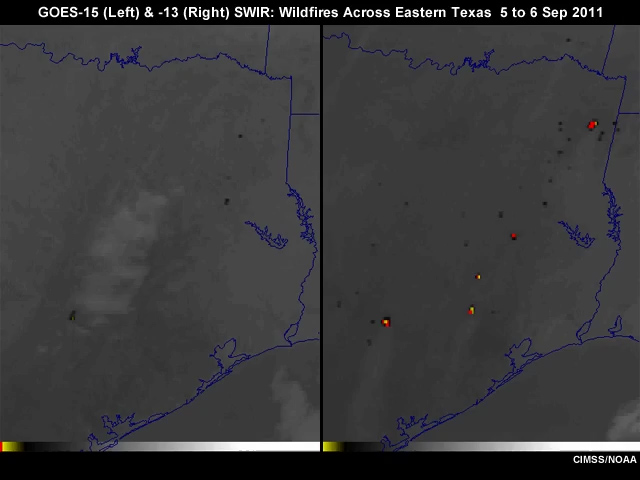
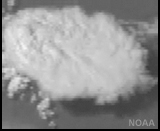
You have access to 15 or 30-minute GOES shortwave infrared imagery to help monitor hot spots. But the relatively poor pixel resolution, limited radiometric sensitivity, and occasional movement (or jittering) of the imagery don't let you accurately identify all of the hot spots and their coverage, or characterize their temperature very well. Note that the current GOES imager offers 15-minute imagery except once every 3 hours during full Earth disk imaging, which takes almost 30 minutes to complete.
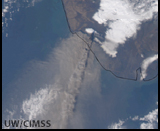
The ABI’s improved sensitivity to hotter temperatures, greater spatial resolution, and more accurate pixel geolocation will improve the detection and characterization of fires and hot spots, and help you estimate their size and temperature. Imaging at 5-minute and up to 30-second intervals will let you monitor rapidly changing wildfire conditions. Additional channels in the visible and near-infrared will also provide improved detection and monitoring of smoke and potentially harmful concentrations of airborne particulates.
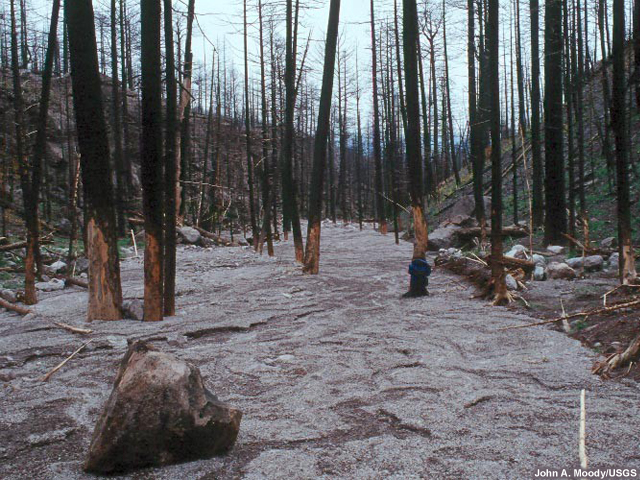
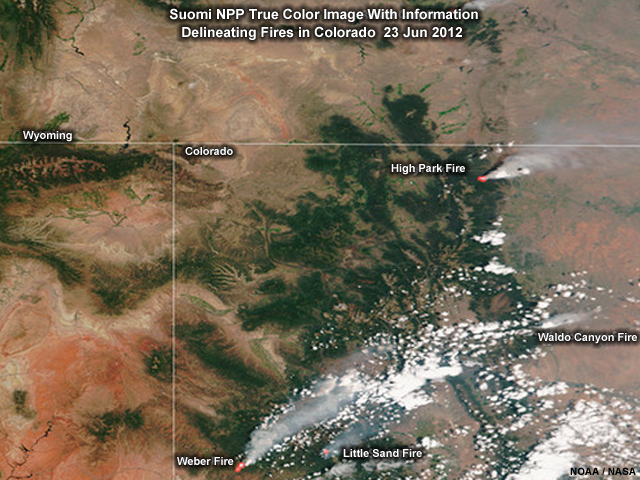
Land cover products made from ABI data will help monitor burn scars. This will let forecasters identify areas prone to flash flooding and debris flows when heavy rainfall threatens.
The ABI’s increased spatial resolution and spectral coverage will also provide more detailed and frequent views of vegetation conditions and trends that are useful for assessing the wildland fire threat.
Applications »
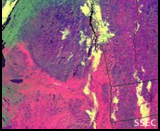
Land Cover
Weather satellites are providing an increasing amount of detailed information to help forecasters, planners, and decision makers gauge Earth’s surface conditions and monitor ecosystems affected by extreme weather, climate variability, and human activity.
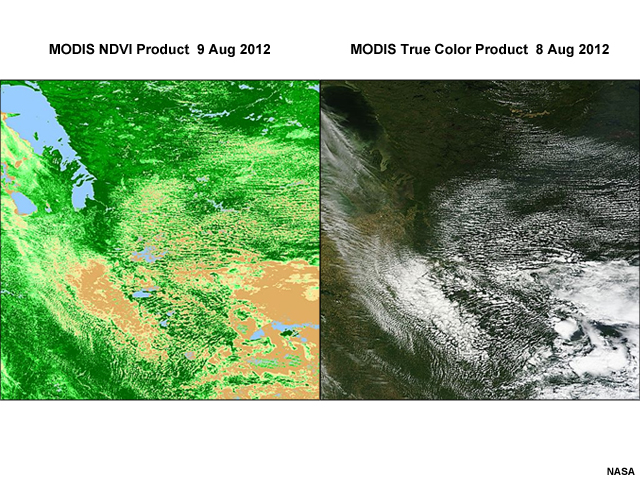
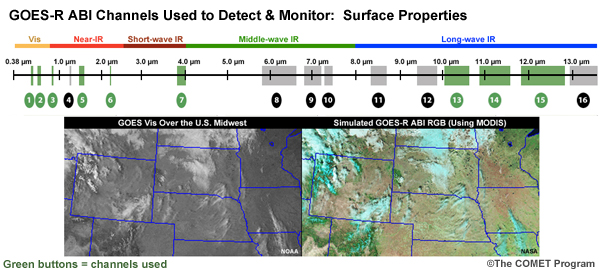
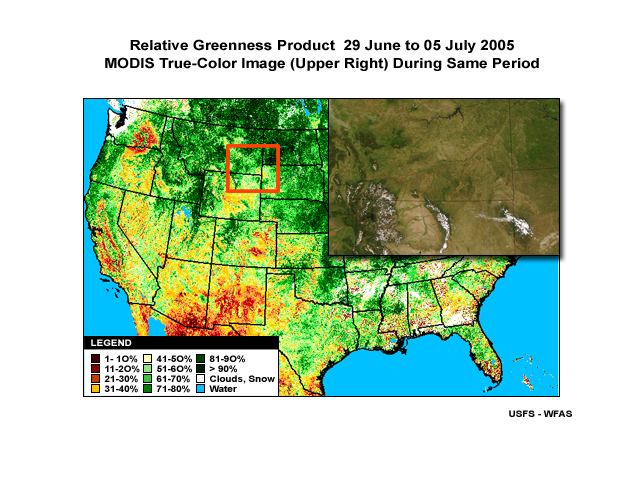
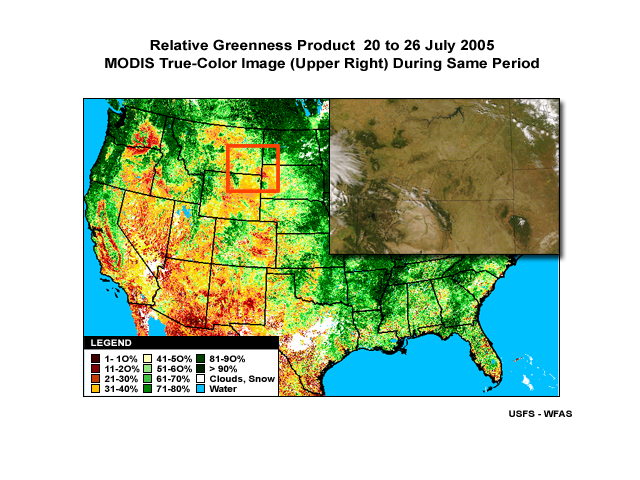
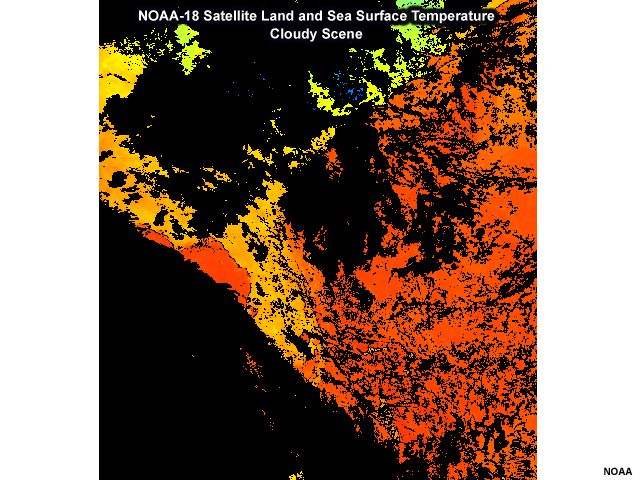
Daily land cover products are available from polar-orbiting satellites, but cloud cover can obscure much of the ground over a given region. Geostationary imagery can provide some clear views of the surface due to more frequent imaging. But current GOES satellites don't have the additional spectral channels needed to assess, for example, vegetation "greenness" or the extent of flooding.
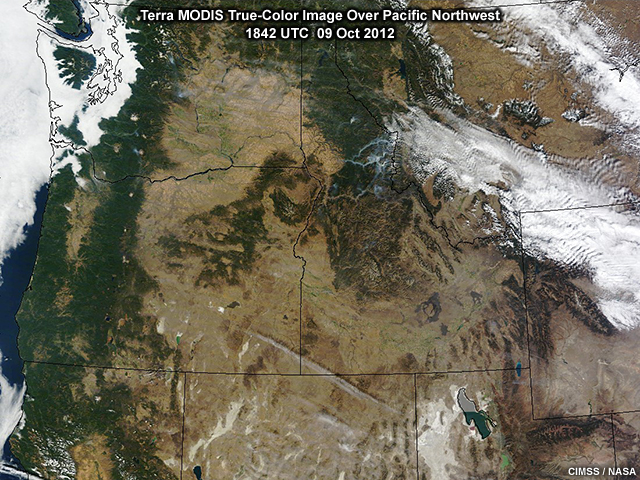
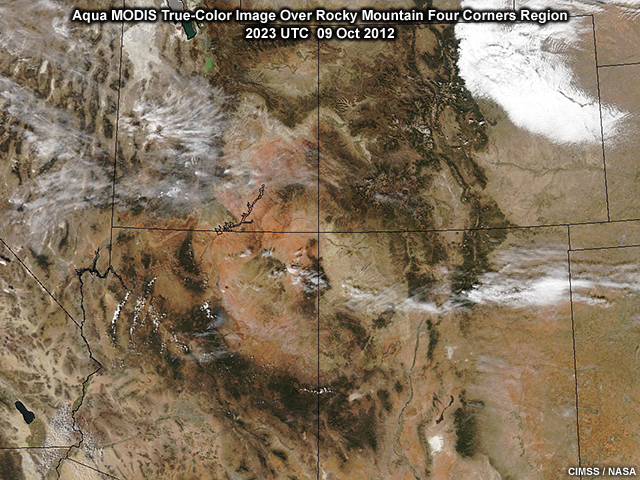
The ABI will give geostationary satellites the capacity to observe land cover with resolution closer to that of polar-orbiting satellite imagers like MODIS on NASA satellites and VIIRS on the Suomi NPP satellite.
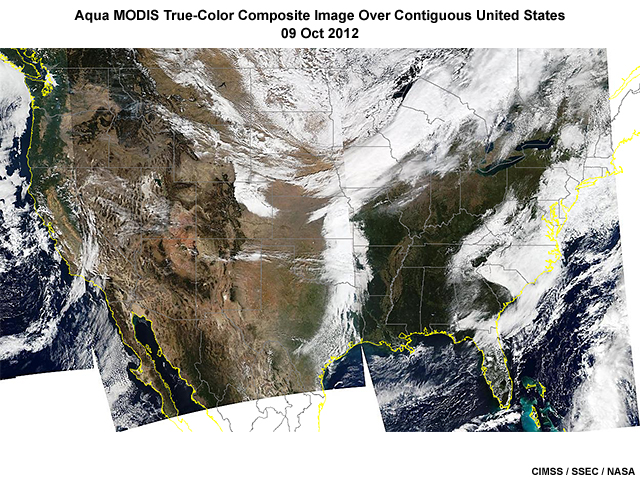
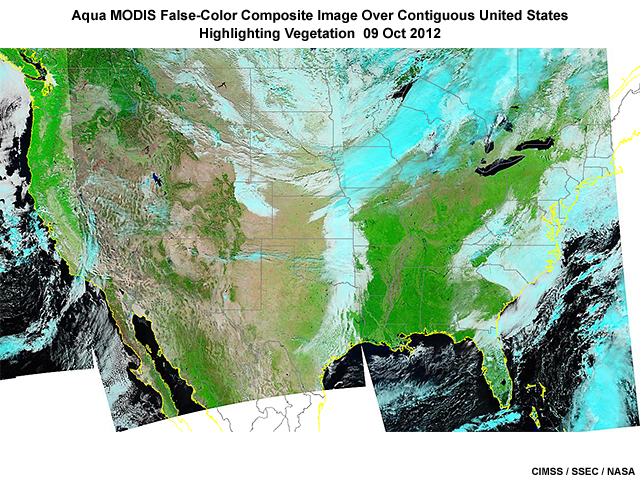
The ABI’s increased spatial resolution and expanded spectral coverage will allow for more detailed views of surface conditions than have ever been provided by a GOES satellite.
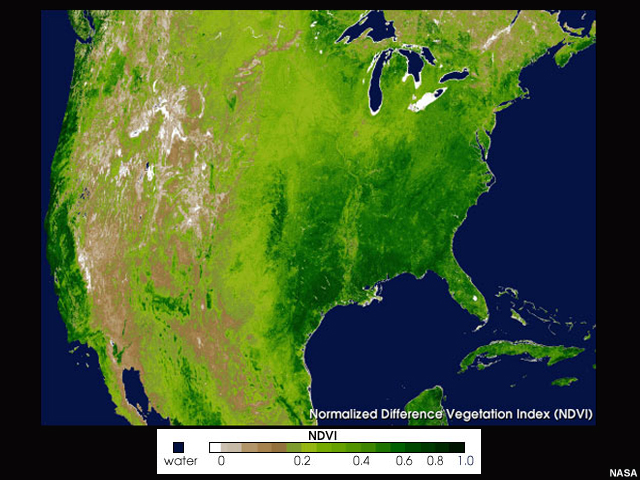
With more imaging channels and calibrated measurements, forecasters and land managers will be better able to discriminate surface features and assess vegetation condition and growth, which are important for agriculture and wildland fire concerns.
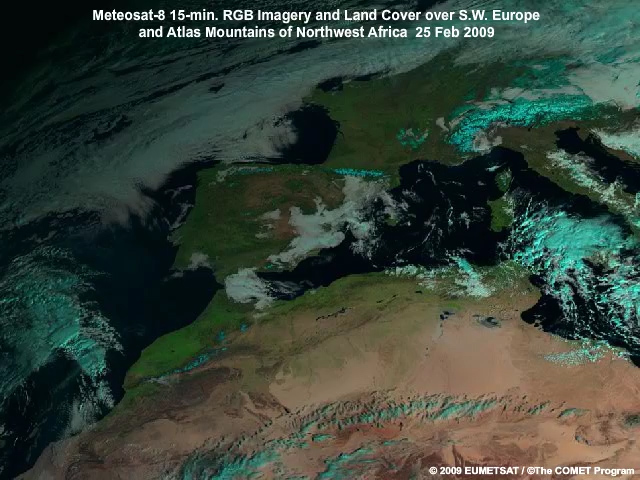
The ABI’s more frequent refresh rate will increase the likelihood of viewing surface features in cloud–free conditions.
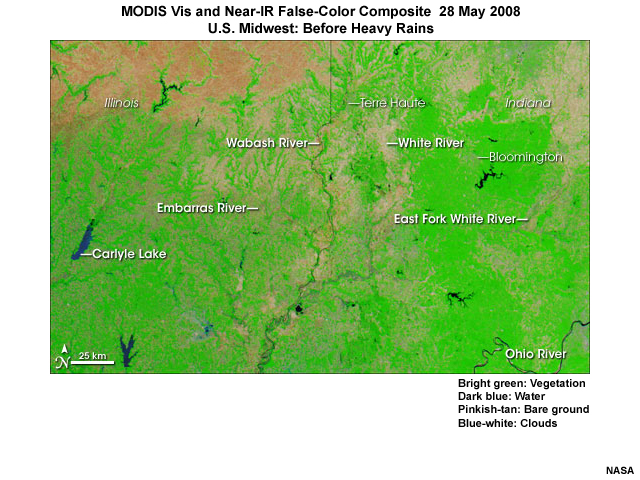
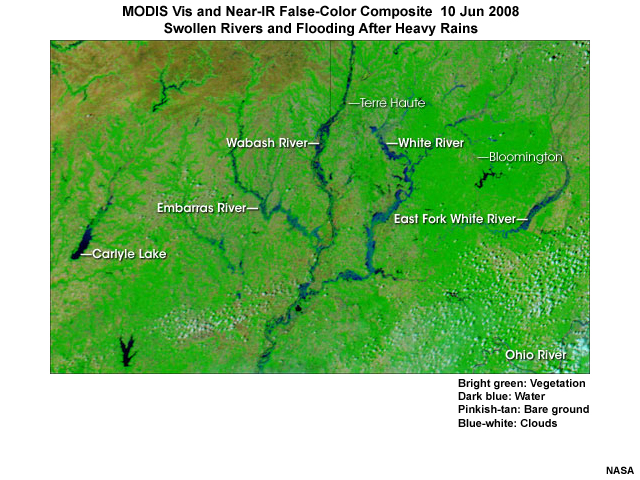
ABI products will highlight flood conditions and standing water, helping forecasters, hydrologists, and NWP models predict the impacts on local weather and water conditions and affected communities.
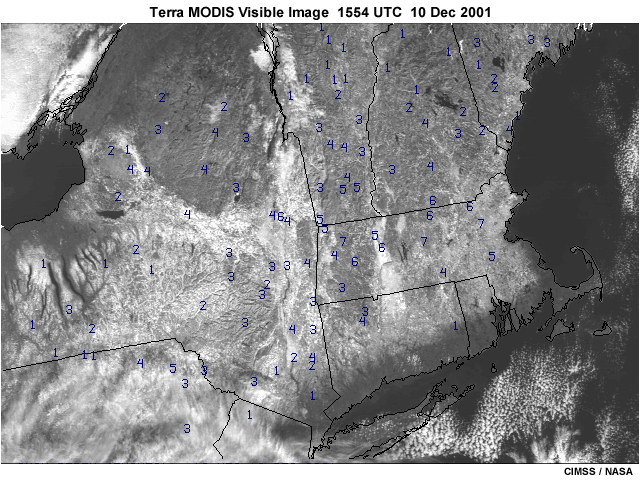
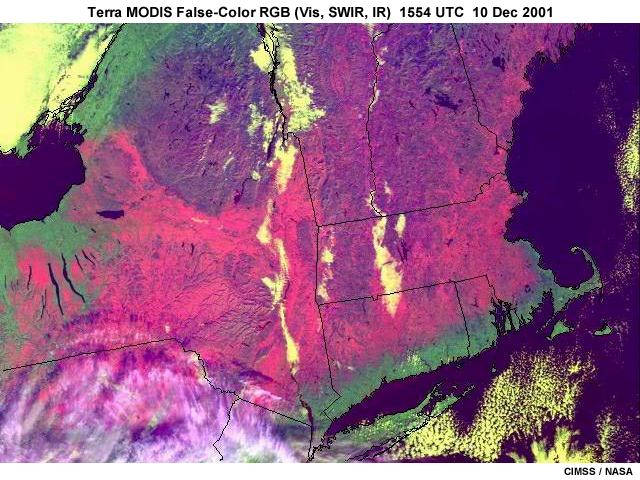
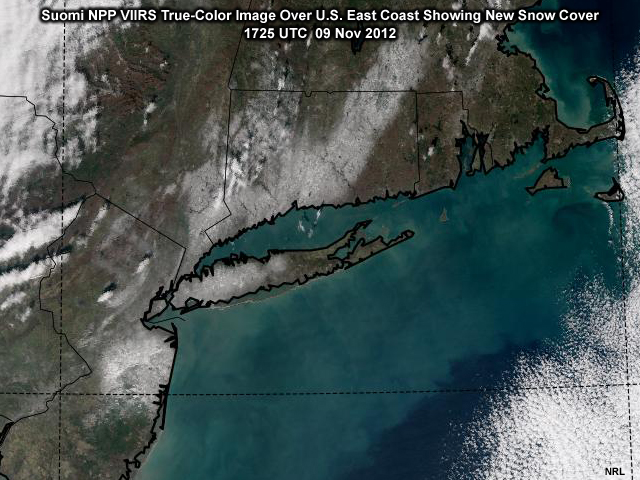
Finally, the ABI’s additional visible and infrared channels and derived products will make it easier to identify snow and ice covered regions following winter storms.
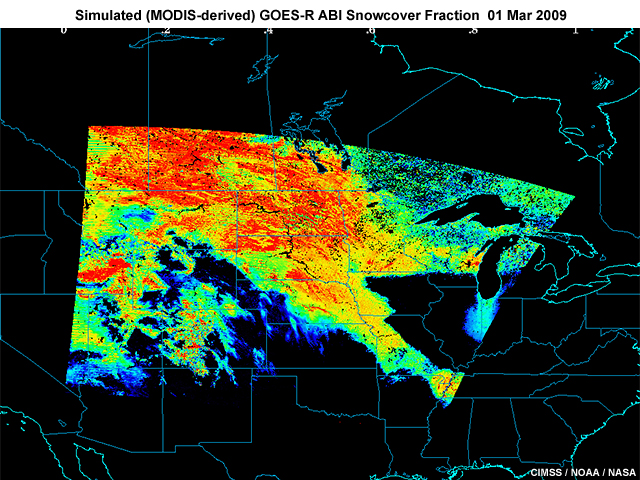
Quantitative products for observed snow and ice will also be possible.
Applications »
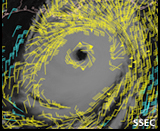
Hurricane Monitoring and Forecasts
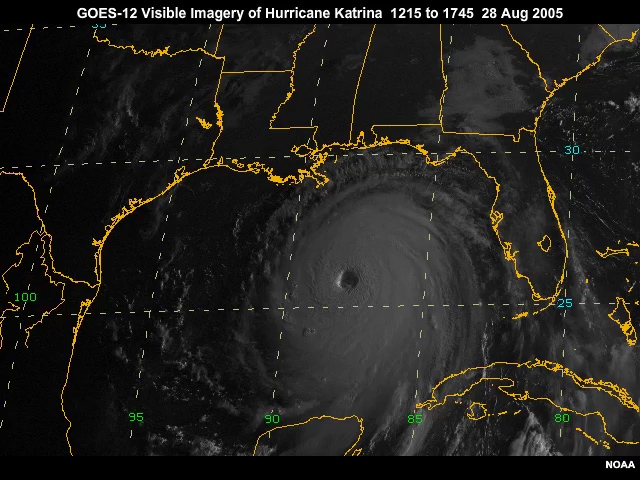
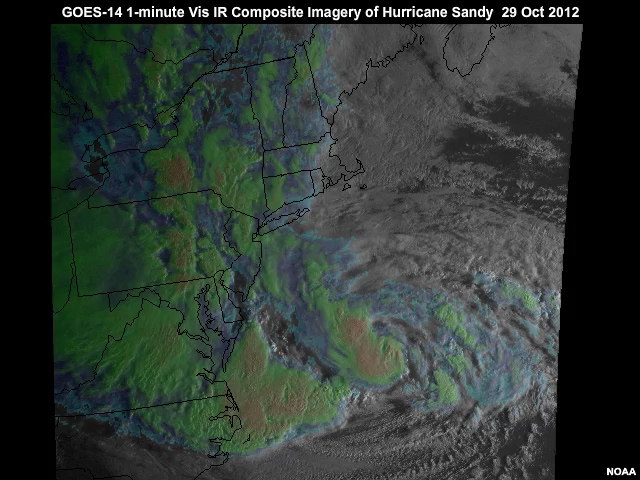
You work at a hurricane forecast center and are keeping a close eye on a tropical cyclone as it approaches a populated coastal area. You are monitoring the storm for any sudden intensification or unanticipated change in its projected path.
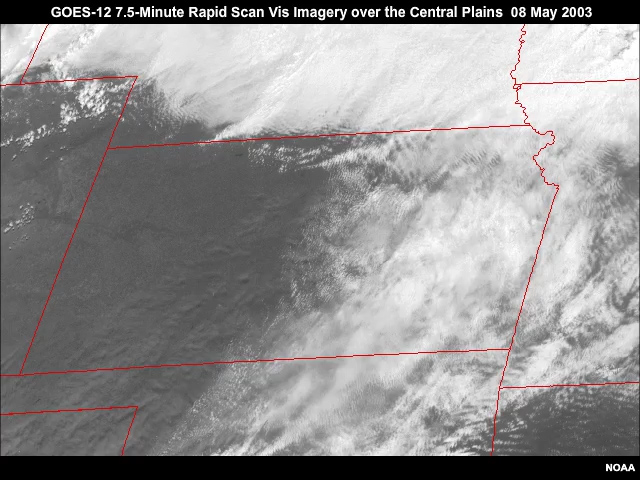
With the storm still beyond the range of land-based radar, current GOES 15-minute imagery helps you monitor the storm’s evolving structure and movement. Occasional periods of 7.5-minute rapid scan imagery provide some additional information on more rapidly changing features. But schedule interruptions cause up to 30-minute gaps during the 3-hourly scans of the full Earth disk.
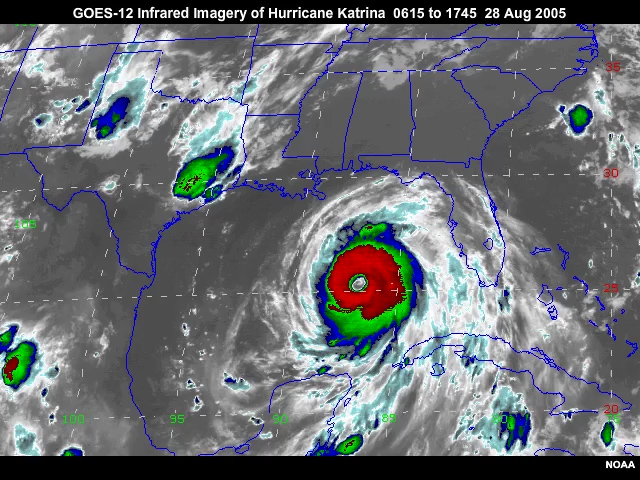
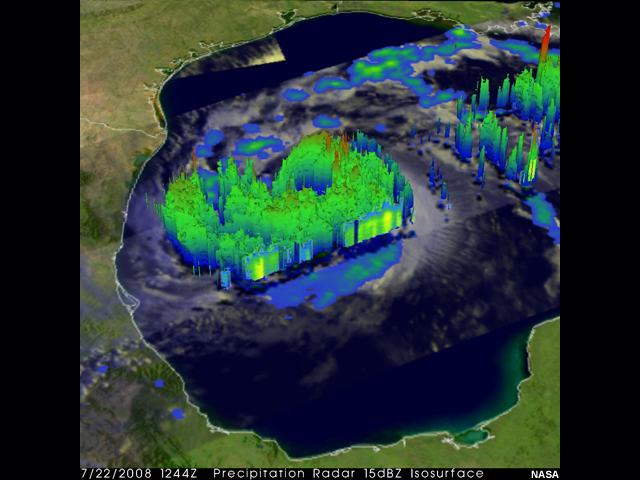
The 4-km infrared resolution also tends to miss finer-scale structures within the storm’s rainbands and eyewall region.
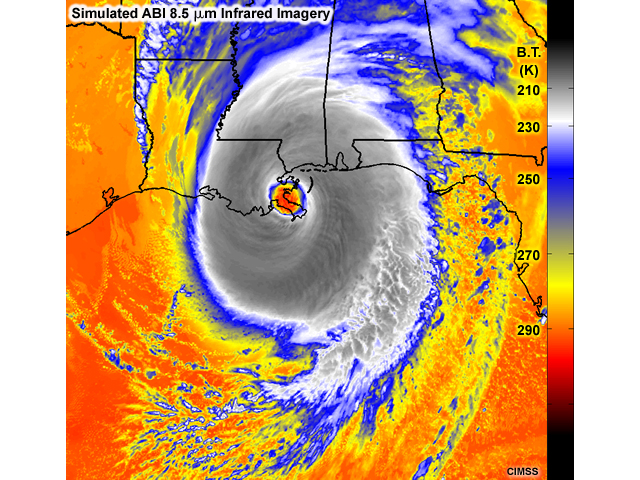
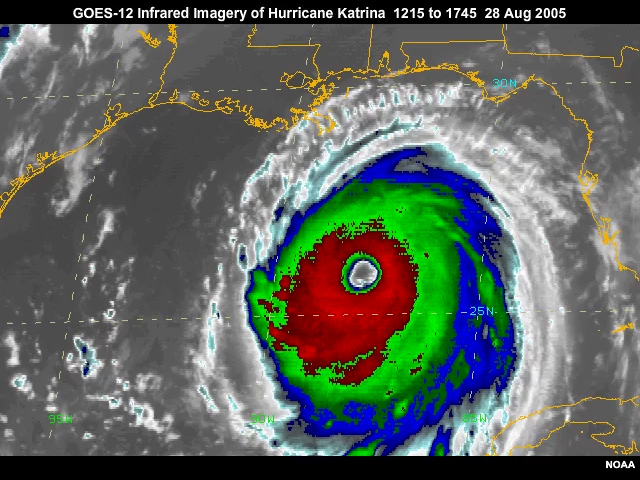
The ABI’s reduced noise and improved calibration will result in more accurate infrared channel brightness temperature measurements of the deep convective cloud tops circulating around a developing storm. These measurements are critical inputs for the widely used Dvorak Technique that’s used to estimate tropical cyclone intensity in terms of wind speed and mean sea level pressure.
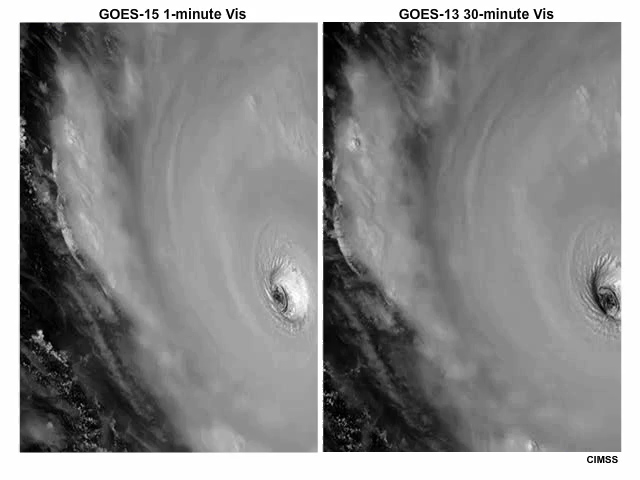
More frequent 30-second to 1-minute imaging over extended periods will improve the observation of rapid changes in hurricane structure that are correlated with storm intensity and track.
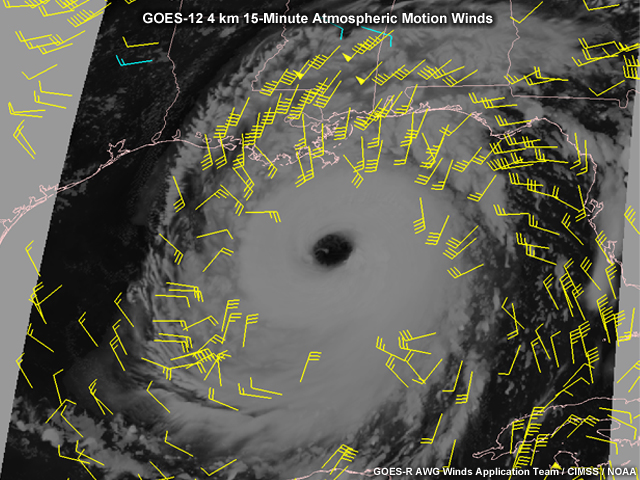
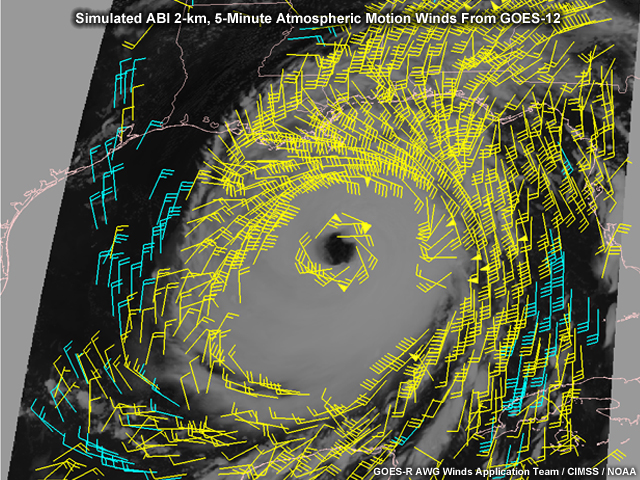
Mesoscale depictions of the 3-dimensional wind field will be significantly enhanced as a result of the ABI’s three water vapor channels, increased spatial resolution, and more rapid refresh rate.
The combination of the ABI’s engineering improvements, greater spectral coverage, and increased spatial and temporal resolutions will provide an expanded suite of imagery and derived products that:
- Enhance our ability to determine storm centers and motions
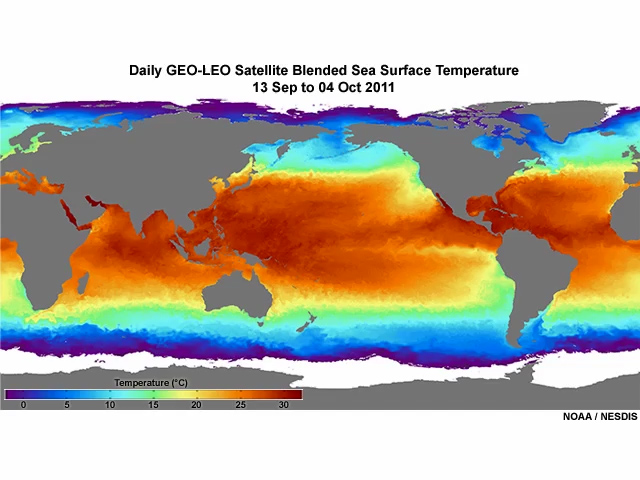
- Provide more accurate measurements of sea surface temperatures, allowing for better evaluation of the energy available for tropical cyclone development
- Improve wind, cloud, and rainfall analyses that feed into numerical forecast models for improved forecasts of hurricane intensity and track, and
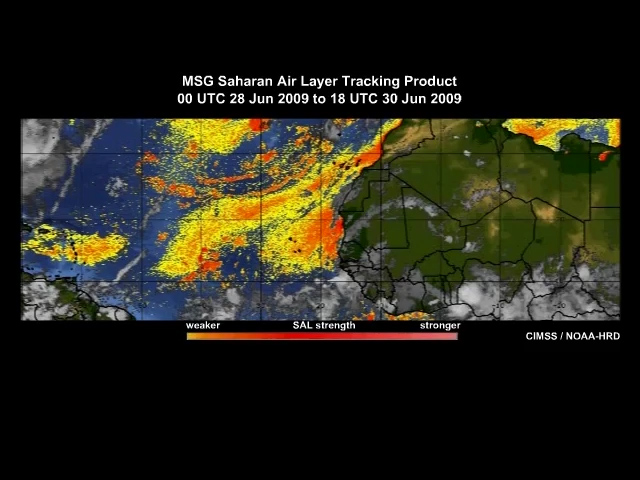
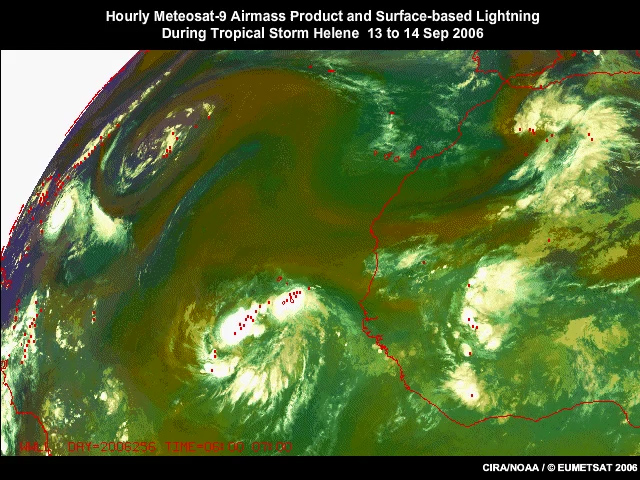
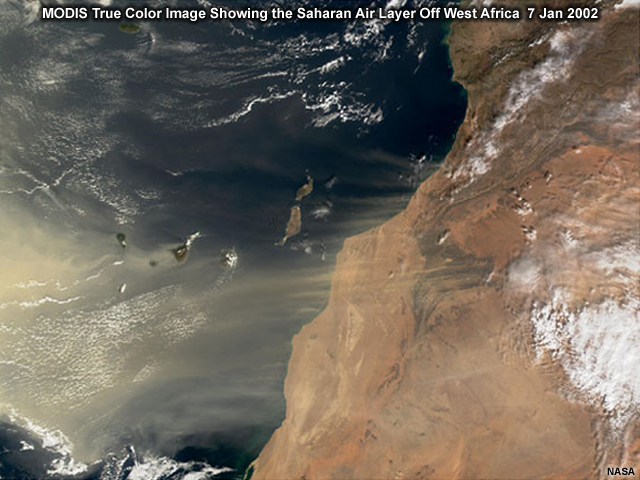
- Supply superior detection of water vapor and dust so that dry air intrusions that impede hurricane development will be better identified
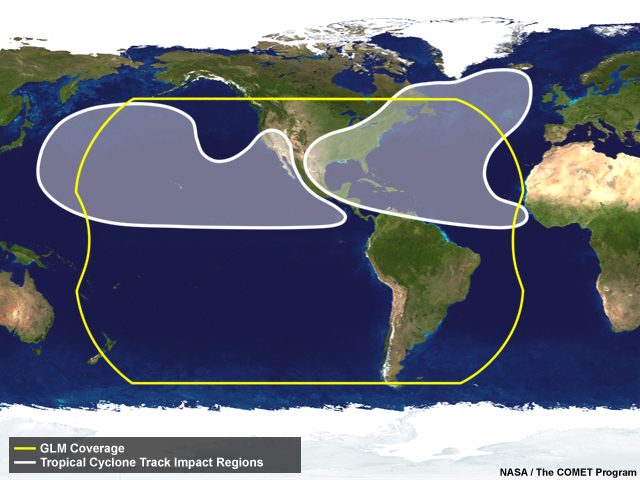
In addition to the ABI’s capabilities, the GLM’s continuous full Earth disk observation of lightning activity will offer important insights into tropical cyclone physics and dynamics.
When added to forecast models, these combined observations will help improve tropical cyclone intensity forecasts.
Applications »
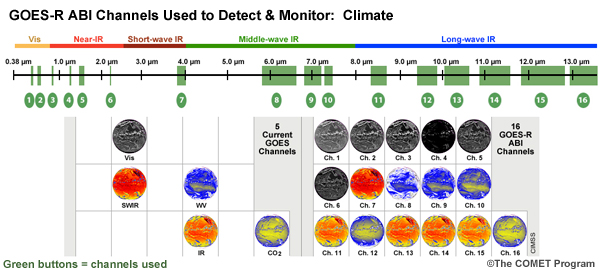
Climate
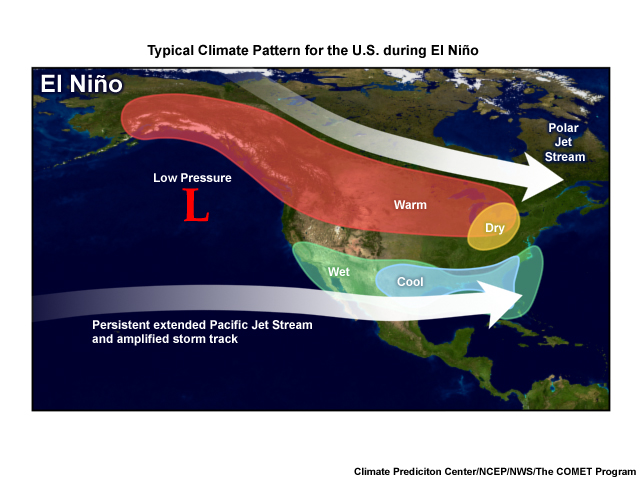
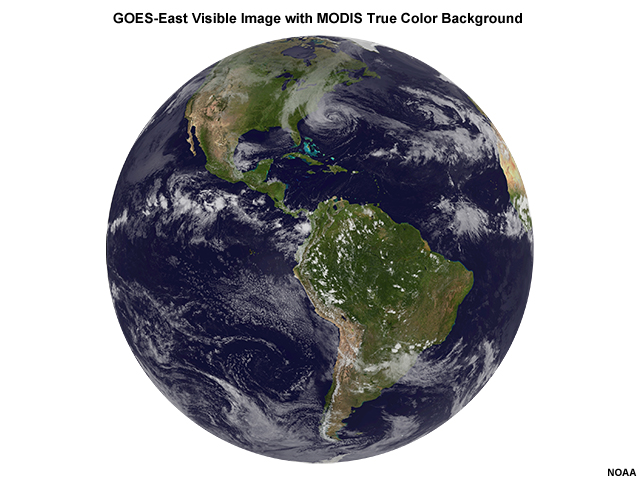
Geostationary satellites can resolve diurnal and seasonal climate cycles that polar orbiters are unable to monitor. This helps climate scientists better monitor events such as tropical cyclones, El Niño and La Niña cycles, and monsoons.
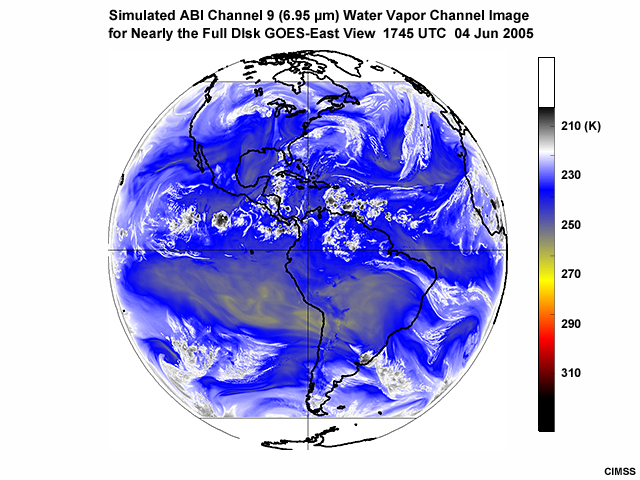
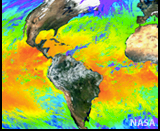
But GOES observations lack the spectral coverage and accuracy needed for a more detailed and longer-term survey of key climate variables. The ABI instrument will help address this. It will provide a more accurate and complete view of water vapor, precipitation...
...surface temperatures, radiation, smoke, trace gases...
...dust and other aerosols, and other key climate parameters that need to be monitored on a continuous basis.
The ABI’s more frequent refresh rate will provide more opportunities to obtain visible and infrared observations...
...that are not degraded by cloud cover.
Applications »
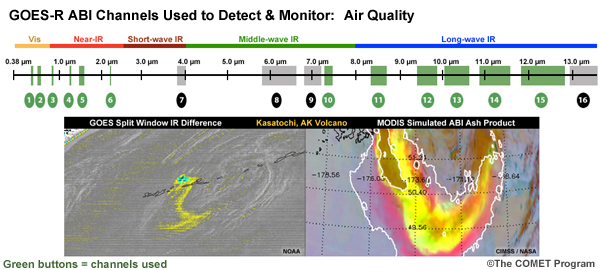
Air Quality
The relatively few channels on the current GOES limits its ability to estimate the distribution and concentration of pollutants and other potentially hazardous trace gases.
The ABI’s expanded spectral coverage and scan rate will improve the detection and monitoring of human-induced and natural hazards across the Western Hemisphere.
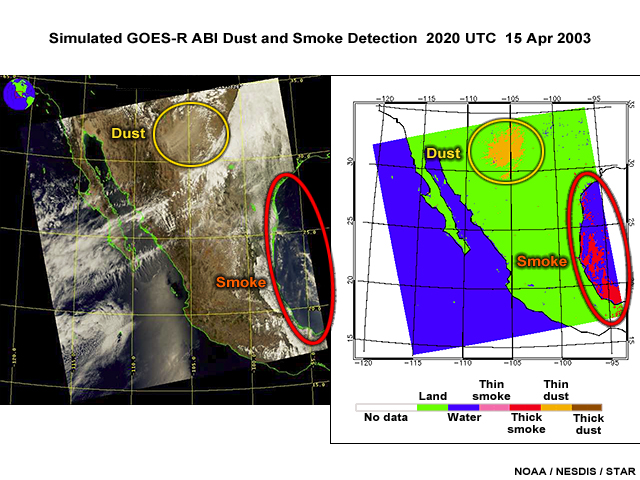
These include dust, smoke...
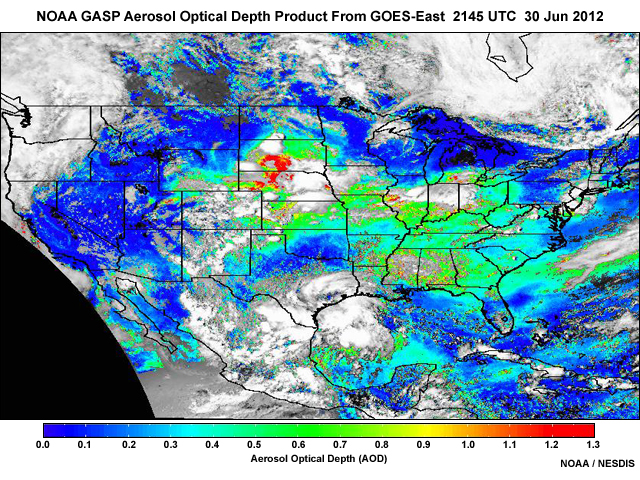
...and aerosols that lead to smog formation and degrade visibility as well as ozone, volcanic ash...
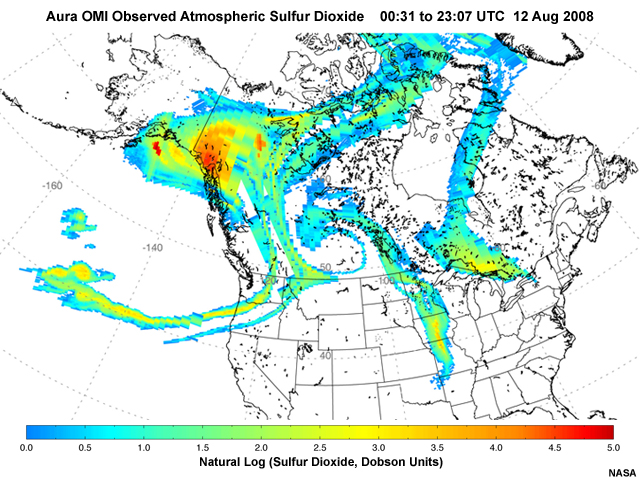
...and sulfur dioxide that impact air quality.
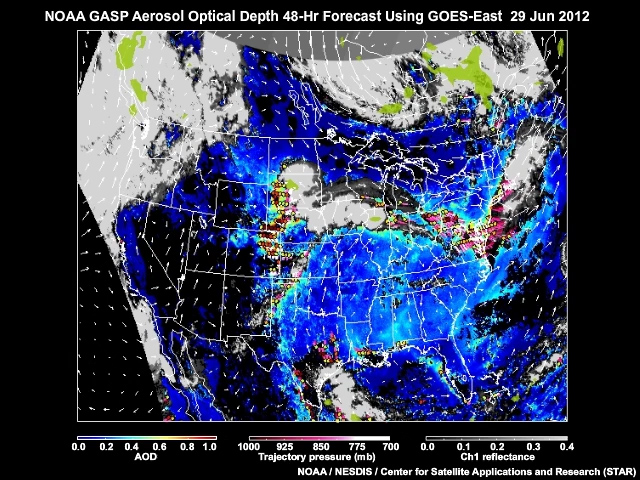
When observations from the ABI and GLM are coupled with numerical dispersion models, forecasters and other decision makers will have near real-time data to help assess air quality risks to the public, environment, aviation, and other commercial interests.
Applications »
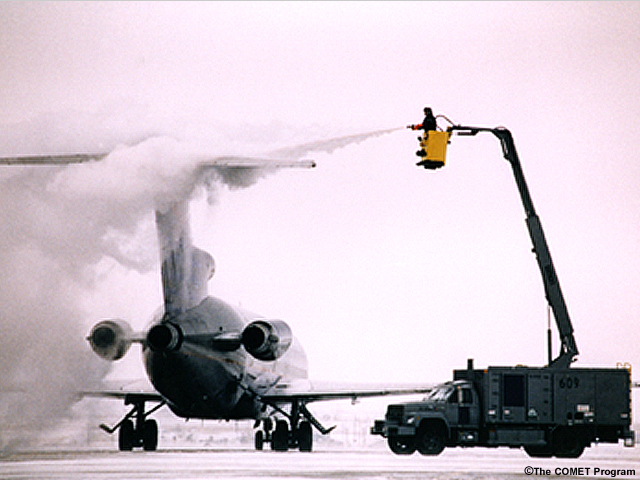
Aviation: Cloud Icing
You are an aviation weather forecaster concerned about the potential icing risk posed by a thick stratus cloud deck over a relatively small airport with sparse pilot observations.
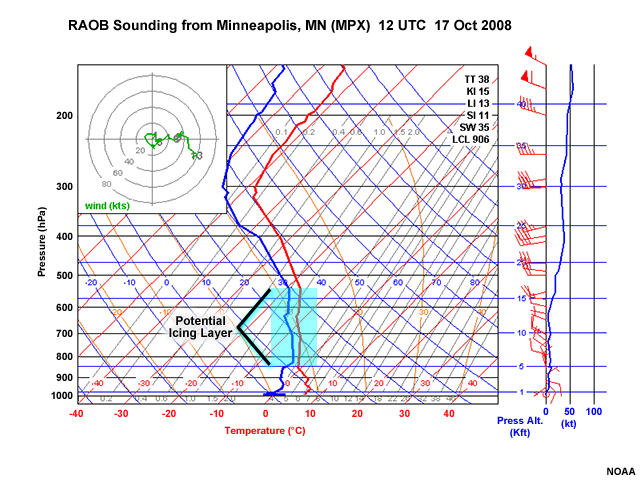
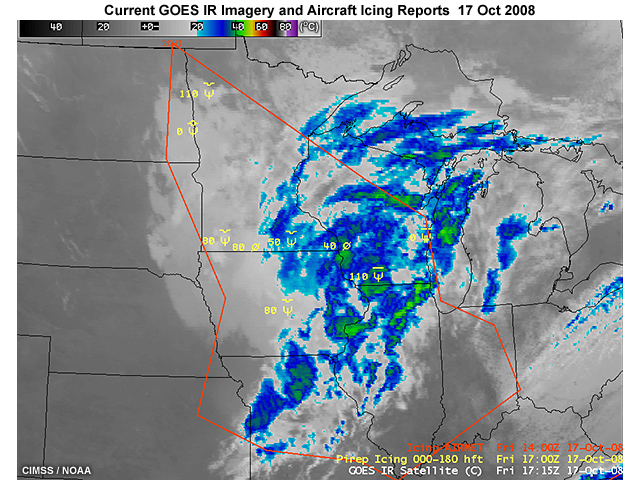
A nearby radiosonde observation, pilot reports...
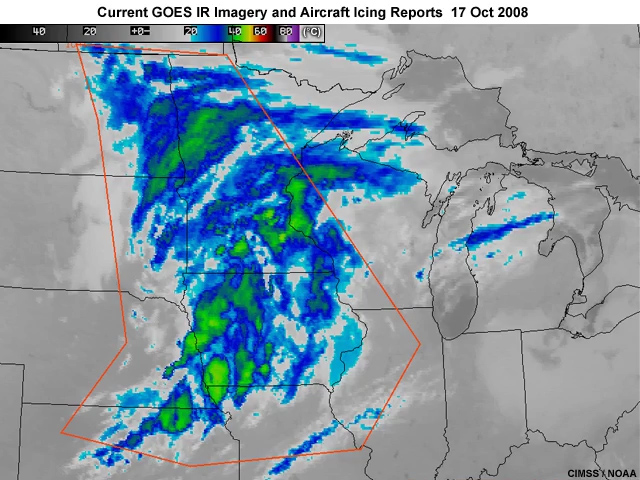
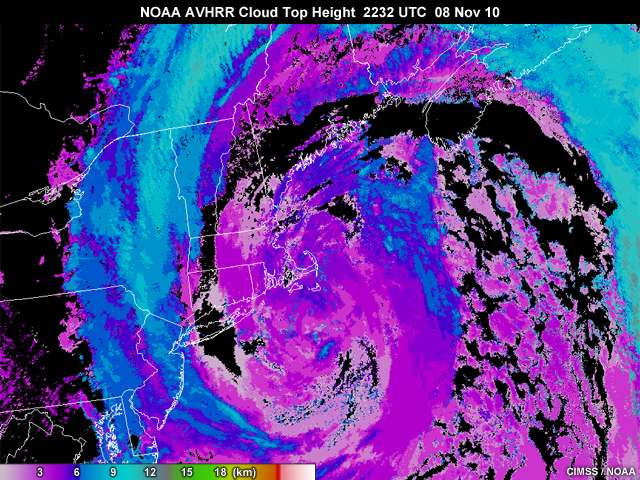
and GOES infrared cloud top temperatures suggest that the potential for icing exists. But you need more detailed information about the content of the cloud cover. Is the cloud top composed mainly of supercooled liquid or is it a mixture of liquid and ice, or primarily ice?
To be useful for icing detection, satellite observations should be sensitive to the spatial and temporal variation of many cloud–top properties, such as temperature...
...phase, droplet size, and liquid water and ice content.
Current GOES satellites lack the ability to adequately define these conditions, limiting the accuracy and detail of their icing potential products.
The ABI will reveal detailed information about cloud development and structure, letting forecasters better monitor cloud evolution, ...
diagnose cloud type, and identify different cloud layers.
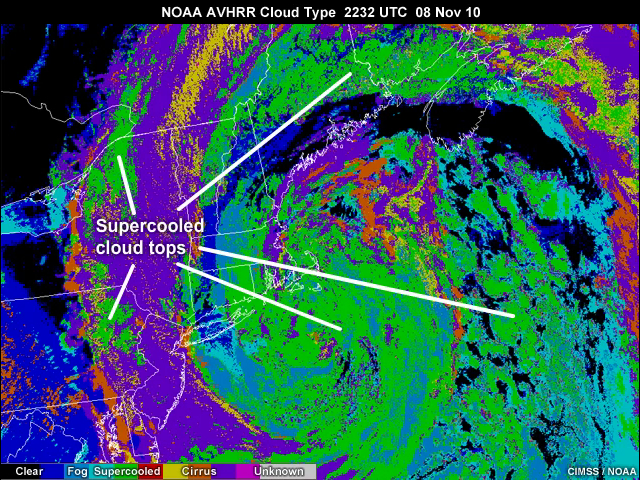
"Wet" clouds pose the greatest icing threat to aircraft, and the ABI’s increased spectral coverage will improve products that distinguish between clouds that are "dry" and "wet".
The ABI’s capabilities will help pilots locate when and where icing may occur. They will also reduce delays and improve weather briefings, flight planning, air traffic routing, hazard advisories, and aircraft safety.
Applications »
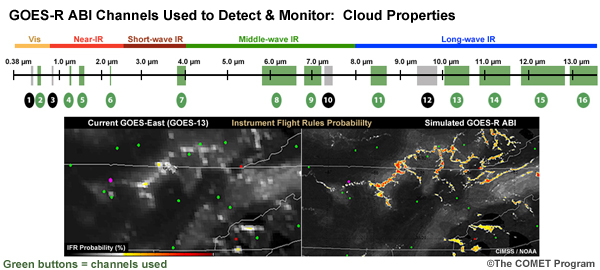
Nowcasting Fog and Low Visibility
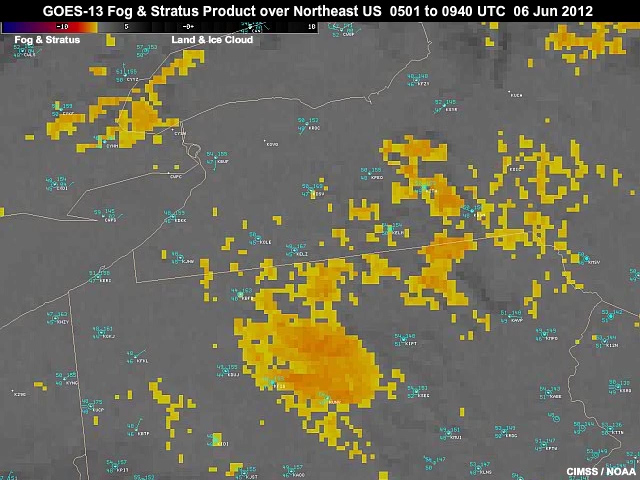
You are keeping an eye on the potential for fog, low ceilings, and limited visibility conditions forming during the overnight hours. Current GOES imagery can give you a heads up about the initial formation and movement of low-level cloud cover. But its relatively coarse infrared resolution, limited number of spectral channels, and 15-minute updates mean that the details are either poorly sampled or often missed altogether.
With its improved spatial resolution and increased 5-minute refresh rate, the GOES-R ABI will be a much better tool for monitoring fog and low clouds as they form, tracking their movement, and for monitoring their dissipation.
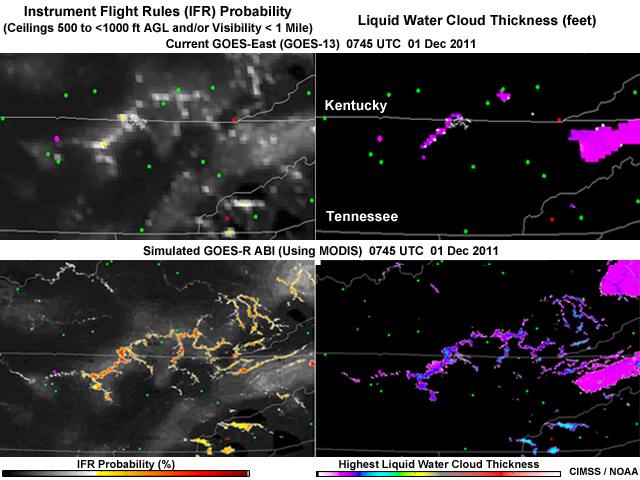
Additional infrared channels will give aviation forecasters improved measurements of cloud top height and estimates of ceilings, visibility, and cloud thickness.
Algorithms being developed for enhanced GOES-R ABI cloud products are being tested on proxy data sets (including current GOES data) through proving ground and testbed activities.
Although the algorithms are designed for future GOES-R capabilities, they are showing significant promise for improving the cloud products used by forecasters today.
Applications »
Coastal and Marine
GOES satellites are useful for tracking storms, forecasting precipitation, and monitoring sea surface temperatures. But they're unable to accurately detect fine variations that are important for improving local forecasts.
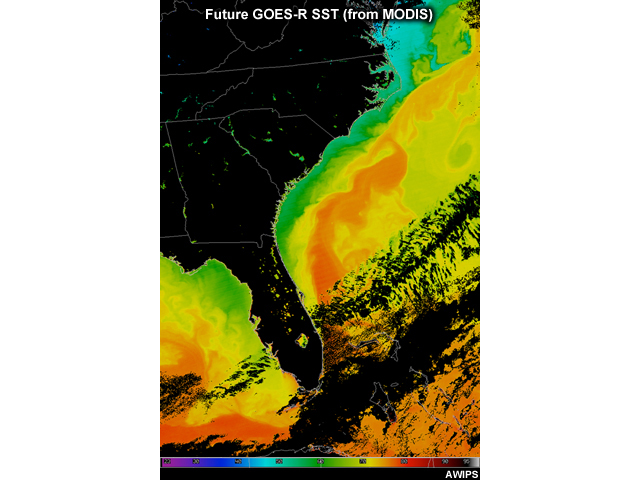
The ABI’s infrared channels will provide more detailed and accurate information on sea surface temperatures, which will improve forecasts of tropical storm intensity, sea breeze circulations, coastal convection, and changes in weather patterns associated with climate oscillations such as the El Niño and La Niña cycle.
The combination of new spectral channels and microwave capabilities on polar-orbiting satellites will improve precipitable water and rainfall estimates for weather systems over the vast oceanic regions.

The ABI’s 5–minute refresh rate will enable the derivation of enhanced environmental winds for input to numerical forecast models. This should lead to improvements in mid–latitude and tropical cyclone intensity and track forecasts.
Finally, GOES-R ABI and GLM observations will offer new observing capabilities to improve forecasts for a variety of phenomena including tropical and mid-latitude storms, thunderstorms, coastal fog, low clouds, air quality, high winds, ocean turbidity, and changing climate conditions.
Resources
Internet Resources
- Official GOES-R Program Site, http://www.goes-r.gov/
- GOES-R Training Overview, http://www.goes-r.gov/users/training.html
- GOES-R ABI Instrument Page, http://www.goes-r.gov/spacesegment/abi.html
- GOES-R ABI Product List, http://www.goes-r.gov/products/baseline.html#ABI
- GOES-R: Benefits of Next-Generation Environmental Monitoring, http://www.meted.ucar.edu/training_module.php?id=509
- GOES-R Program: Outreach Materials, http://www.goes-r.gov/education/outreach.html
(Updated regularly, the site links to resources illustrating the GOES-R mission, products, and services including fact sheets, bookmarks, posters, brochure, and calendars.) - GOES-R Proving Ground Page, http://www.goes-r.gov/users/proving-ground.html
- GOES and POES Conferences and Meetings, http://www.goes-r.gov/users/conf-mtgs.html
- GOES-R ABI Interactive Weighting Functions, http://cimss.ssec.wisc.edu/goes/wf/ABI/
- SSEC/CIMSS GOES-R Bibliography, http://library.ssec.wisc.edu/research_Resources/bibliographies/goesr
- UW CIMSS GOES-R Activities and Resources, http://cimss.ssec.wisc.edu/goes_r/
- UW CIMSS Satellite blog and GOES-R, http://cimss.ssec.wisc.edu/goes/blog/archives/category/goes-r
- VISIT: SHyMet for Forecasters: GOES-R 101 Training Session, http://rammb.cira.colostate.edu/training/shymet/forecaster_goesr101.asp
Tables
References
- Goodman, S.J., J.J. Gurka, M. DeMaria, T.J. Schmit, A. Mostek, G. Jedlovec, C. Stewart, W. Feltz, J. Gerth, R. Brummer, S. Miller, B. Reed, and R.R. Reynolds, 2012: The GOES-R Proving Ground: Accelerating user readiness for the next-generation geostationary environmental satellite system. Bull. Amer. Meteor. Soc., 93, 1029-1040.
- Schmit, T.J., M.M. Gunshor, W.P. Menzel, J.J. Gurka, J. Li, and S. Bachmeier, 2005: Introducing the next-generation advanced baseline imager on GOES-R. Bull. Amer. Meteor. Soc., 86, 1079-1096.
- Schmit, T.J., J. Li, J.J. Gurka, M.D. Goldberg, K.J. Schrab, J. Li, and W.F. Feltz, 2008: The GOES-R Advanced Baseline Imager and the continuation of current sounder products. J. Appl. Meteor. and Climatol., 47, 2696-2711.
- Schmit, T.J., 2012. The ABI on GOES-R. Natl. Wea. Assoc. Newsletter, p.4.
- Additional GOES-R and GOES Related Scientific Publications (available on the GOES-R Program Site):
http://www.goes-r.gov/resources/Scipubs/index.html
Contributors
COMET Sponsors
The COMET® Program is sponsored by NOAA National Weather Service (NWS), with additional funding by:
- Bureau of Meteorology of Australia
- Bureau of Reclamation (United States Department of the Interior)
- European Organisation for the Exploitation of Meteorological Satellites (EUMETSAT)
- Meteorological Service of Canada (MSC)
- NOAA National Environmental Satellite, Data and Information Service (NESDIS)
- Naval Meteorology and Oceanography Command (NMOC)
Project Contributors
Senior Project Manager
- Wendy Schreiber-Abshire — UCAR/COMET
Project Lead/Meteorologist
- Patrick Dills — UCAR/COMET
Instructional Design
- Marianne Weingroff — UCAR/COMET
Principal Science Advisors
- James J. Gurka — NOAA/NESDIS GOES-R Program Office
- Timothy J. Schmit — NOAA/NESDIS Center for Satellite Applications and Research (STAR)
Additional Science Contributors
- Scott Bachmeier — SSEC/CIMSS University of Wisconsin, Madison
Graphics/Interface Design
- Steve Deyo — UCAR/COMET
- Marianne Weingroff — UCAR/COMET
Multimedia Authoring
- Dan Riter — UCAR/COMET
Audio/Video Editing/Production
- Dan Riter — UCAR/COMET
Audio Narration
- Matthew Kelsch — UCAR/COMET
Data Provided By
- CIMSS — University of Wisconsin, Madison
- CIRA — Colorado State University
- EUMETSAT
- NASA-GSFC
- NOAA
- NOAA-NESDIS
- NOAA-NWS
COMET Staff, Winter 2013
Director
- Dr. Timothy Spangler
Deputy Director
- Dr. Greg Byrd
Administration
- Elizabeth Lessard, Administration and Business Manager
- Lorrie Alberta
- Michelle Harrison
- Hildy Kane
Hardware/Software Support and Programming
- Tim Alberta, Group Manager
- Bob Bubon
- Ken Kim
- Mark Mulholland
- Chris Webber - Student Assistant
- Malte Winkler
Instructional Designers
- Dr. Alan Bol
- Lon Goldstein
- Bryan Guarente
- Dr. Vickie Johnson
- Tsvetomir Ross-Lazarov
- Marianne Weingroff
Media Production Group
- Bruce Muller, Group Manager
- Steve Deyo
- Dan Riter
- Carl Whitehurst
Meteorologists/Scientists
- Wendy Schreiber-Abshire, Senior Project Manager
- Dr. William Bua
- Patrick Dills
- Matthew Kelsch
- Dolores Kiessling
- Dr. Arlene Laing
- Dave Linder
- Dr. Elizabeth Mulvihill Page
- Amy Stevermer
Spanish Translations
- David Russi
NOAA/National Weather Service - Forecast Decision Training Branch
- Anthony Mostek, Branch Chief
- Dr. Richard Koehler, Hydrology Training Lead
- Brian Motta, IFPS Training
- Dr. Robert Rozumalski, SOO Science and Training Resource (SOO/STRC) Coordinator
- Ross Van Til, Meteorologist
- Shannon White, AWIPS Training
Meteorological Service of Canada Visiting Meteorologists
- Brad Snyder