Satellite Products » Severe Convection RGB
Description
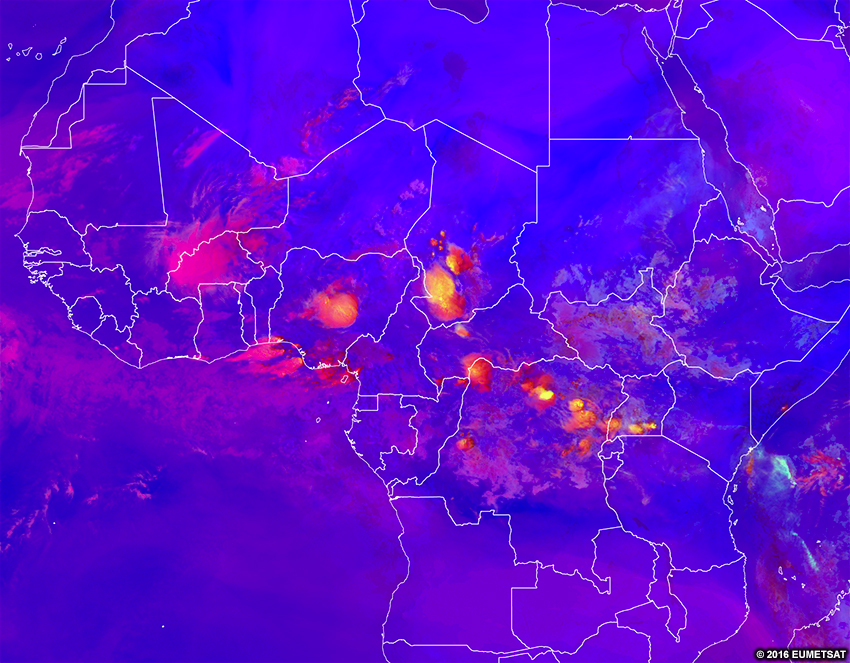
The severe convection RGB shows areas of active thunderstorms with strong updrafts in colours ranging from red (less intense convection) to yellow (most intense convection). The rest of the product is blue or purple to make the strongest storms stand out.
This product is made with a combination of visible, infrared and water vapour channels and channel differences. Because of this, the product can be used only during the day.
Effective Use
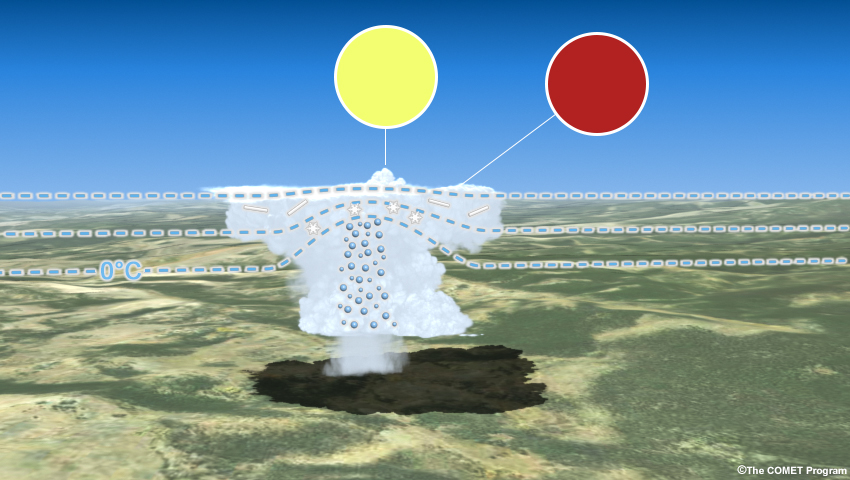
Tall, thick clouds initially appear red. Over time, as the updraft generates and pushes more ice crystals upward, the tops will appear more yellow. Later on, the yellow areas may grow horizontally as small ice crystals fill out the anvil of the storm. Dissipating yellow colours indicate that the updraft is weakening.
The effective use of the severe convection RGB requires that you understand some of the methodology for how the colours would change with an evolving cloud structure. Below you will find a step-wise animation of the growth of thunderstorms and the changes that would occur from the satellite RGB’s perspective.
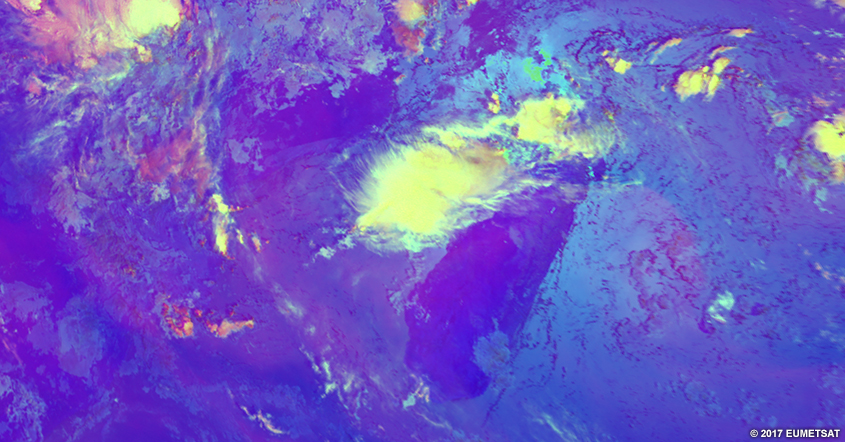
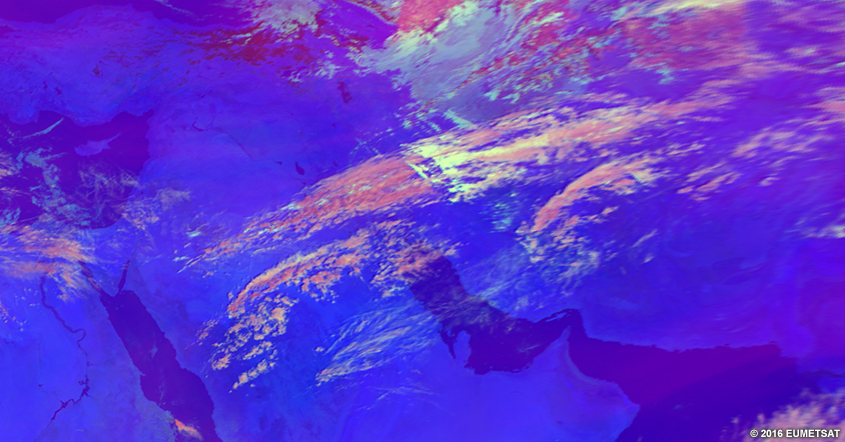
It is important to note that yellow features can also be mountain lee wave clouds, as shown in the loop below, or non-severe high-based thunderstorms, as well as polluted, thick ice clouds.
To determine if yellow features are indeed severe thunderstorms, consult other satellite imagery, and look for the following:
- pulsing or textured character on IR or visible imagery to confirm severe convection
- uniformly-coloured, smooth cloud tops to confirm mountain lee wave clouds
Note that polluted, thick, ice clouds are especially hard to determine since the aerosols producing the pollution may not be seen on satellite imagery.
Here is the real-time imagery from the MSG severe convection RGB. Explore the imagery by double-clicking (pinching on mobile devices) to zoom and dragging the image to move view. Below the real-time image, you will find a list of questions to ask yourself for exploration and self-evaluation purposes.
* Live data only available for interactive lesson.
Using the real-time imagery, answer the following questions.
- Are features visible at this time of day on the RGB?
- Would these features be visible at other times of day?
- What features really stand out to your eyes in this RGB?
- What range of colours are clouds?
- Do those colours represent cloud-top heights?
- Do those colours represent cloud thickness?
- Do those colours represent temperatures?
- Do those colours represent some other process?
- What range of colours are surface features?
- Do those colours represent the temperature of the object?
- Do those colours represent the albedo of the object?
- Do those colours represent some other process?
- If you are located within the satellite viewing area of MSG, look outside for clouds and surface features. See if those features show up on the imagery by zooming in to your location. What colours do you expect those features to be in this imagery? What colours are those features in the imagery?