Introduction
Satellite imagery is a powerful tool for quickly assessing the current weather situation over large areas at any time of day. You can diagnose synoptic-scale weather patterns, track the growth of individual convective storms, differentiate high clouds from low ones or ice clouds from liquid ones, and distinguish between low clouds, snow, dust, land and water surfaces.
In this lesson, you will learn how to identify features using three basic satellite channels and common RGB products. Specifically, you’ll differentiate cloud types, their relative heights, and cloud thickness. Identifiable surface features include dust, snow, land, ocean, and vegetation type.
These features are present in the images below. Click through the tabs, noticing how certain products provide better views of some features than others. By the end of the lesson, you’ll know which products to use to identify each feature.
Visible

Infrared

Water Vapour
Dust
Severe Convection
Night Microphysics
Natural Colour
Introduction » About the Lesson
This lesson uses EUMETSAT’s Meteosat Second Generation (MSG) imagery. The satellite interpretation techniques presented are general enough to also be applied elsewhere.
Herein you will learn about the three most common satellite channels: visible, long-wave infrared (IR), and water vapour. You will also learn about RGBs, which combine Red-Green-Blue data from multiple channels to better highlight features like dust, low clouds/fog, and severe convection.
The lesson begins by describing single channel and RGB products and showing you how to interpret them in a practice section. Next, you will learn how clouds and surface features appear in satellite products and the information that can be gleaned from them, such as relative cloud heights and thickness. The final section contains more practice satellite interpretation exercises.
By the end of the lesson, you should be able to:
- Describe what visible, infrared, and water vapour channels measure
- Identify the relative heights of clouds and their thicknesses in visible, infrared, and water vapour imagery and selected RGBs
- Identify dust in visible and infrared imagery and in the dust RGB
- Differentiate land and water surface features in visible and infrared imagery and selected RGBs
- Identify whether a given image is from the water vapour, infrared or visible channel
- Briefly describe what RGBs are and their usefulness in highlighting specific features
- Identify features in selected RGBs
- Briefly describe what derived products are and how they can be useful
Satellite Products
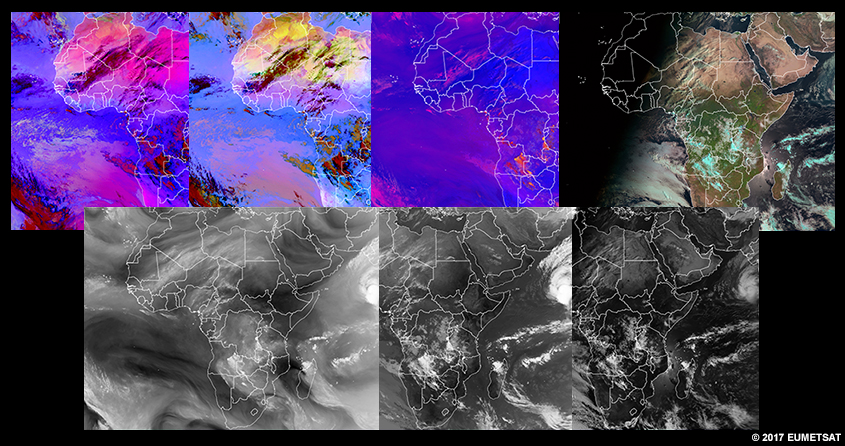
This section discusses visible, infrared, and water vapour imagery, as well as four RGB products: dust, severe convection, night microphysics, and natural colour. The information for each channel or product is presented in two tabs: Description and Effective Use. After each set of tabs, you will find explorable, real-time product imagery with a set of questions to evaluate what you can see. Be sure to click each tab before proceeding to the next product.
While the lesson discusses RGBs and how to interpret them, it does not provide details on how each RGB product is made. For more information, see COMET’s Multispectral Satellite Applications: RGB Products Explained lesson.
Satellite Products » Visible Channel
Description
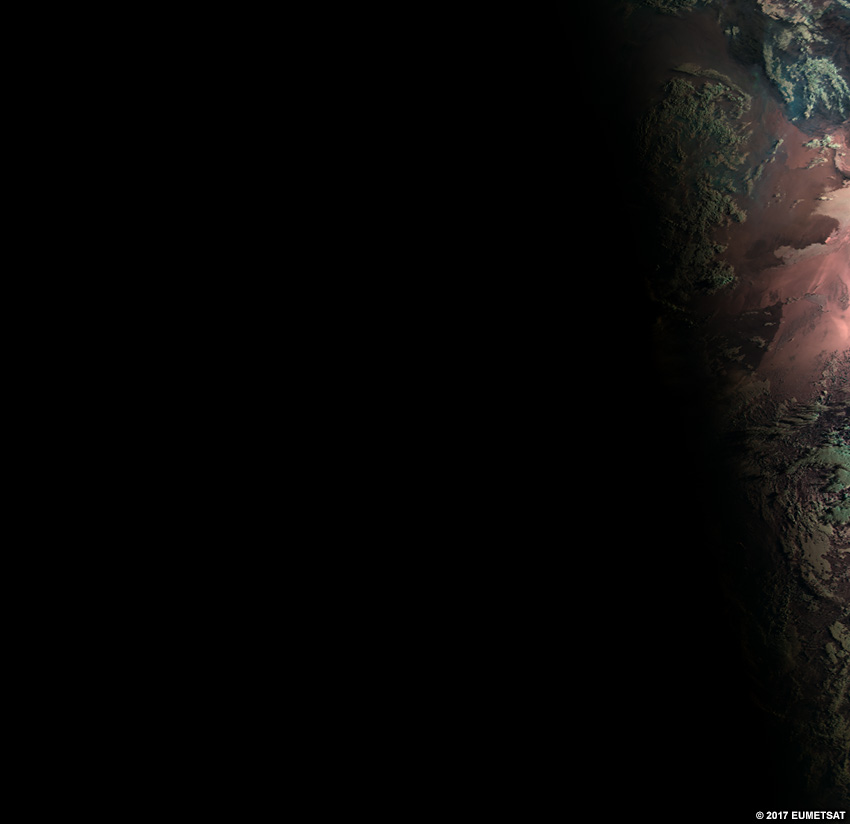
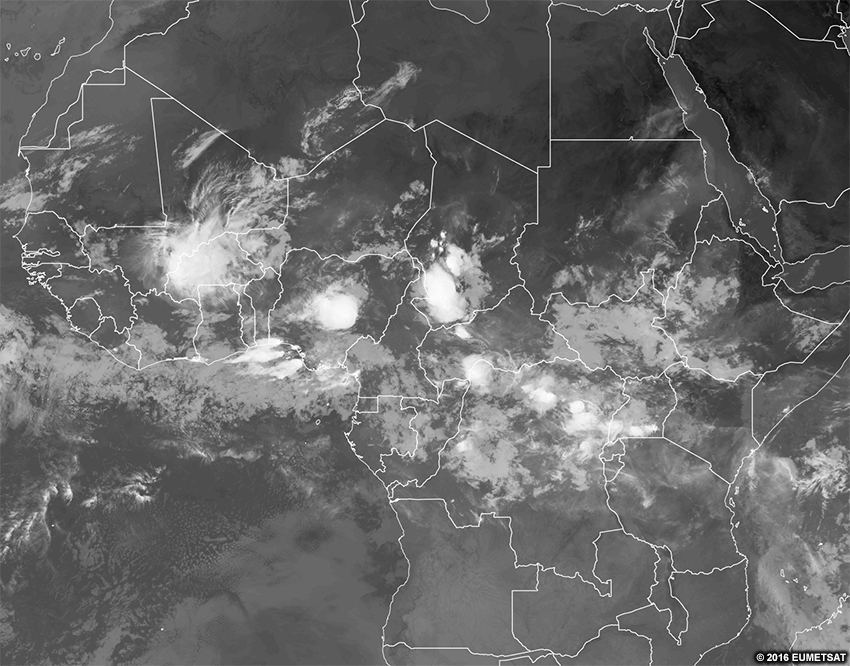
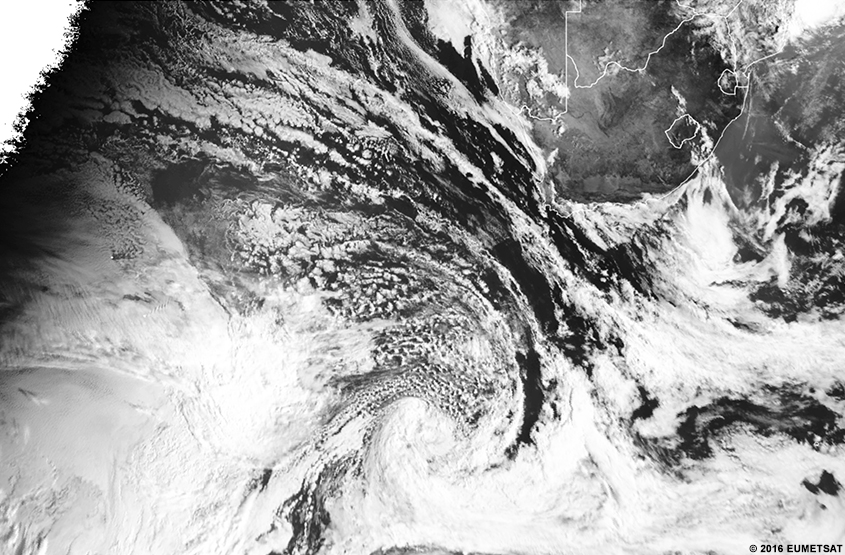
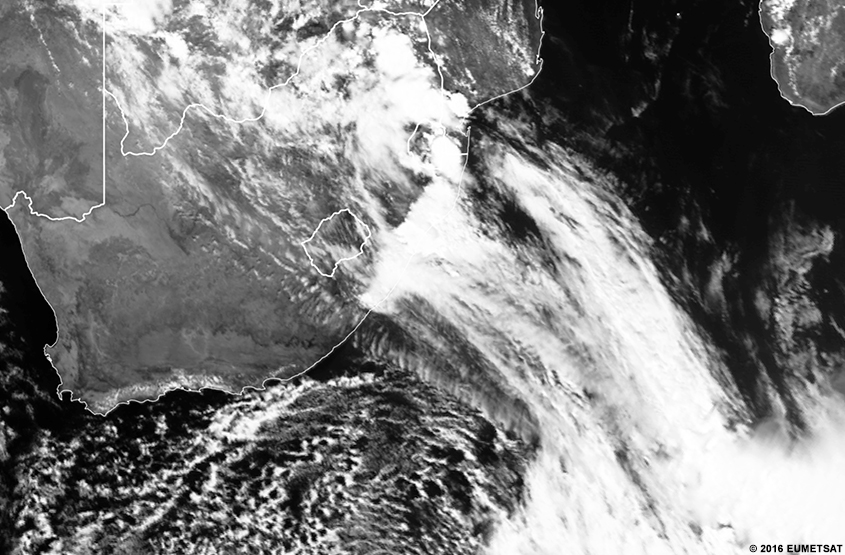
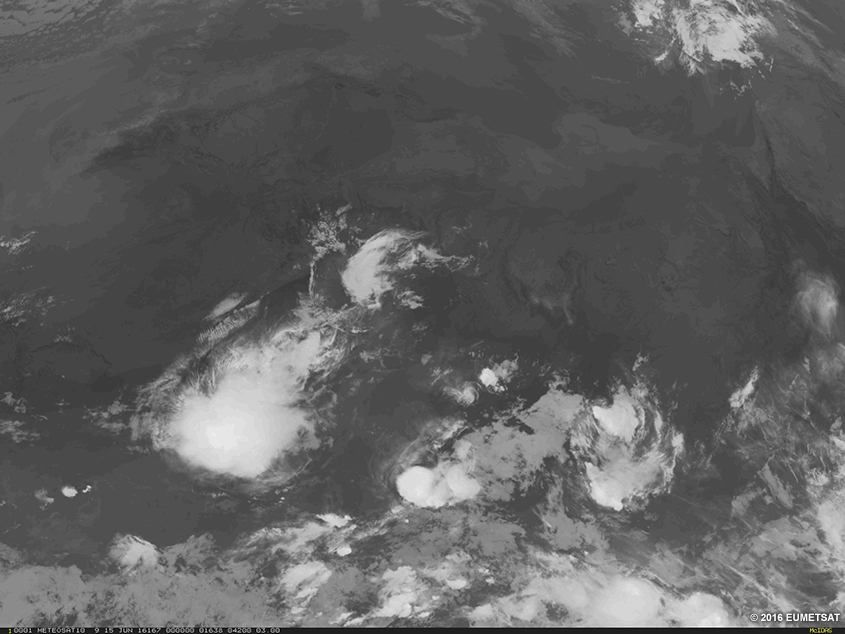
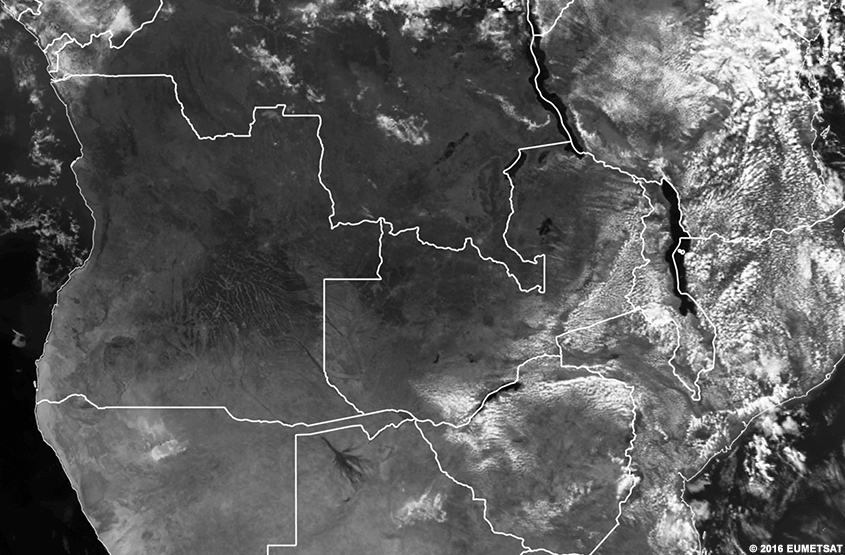
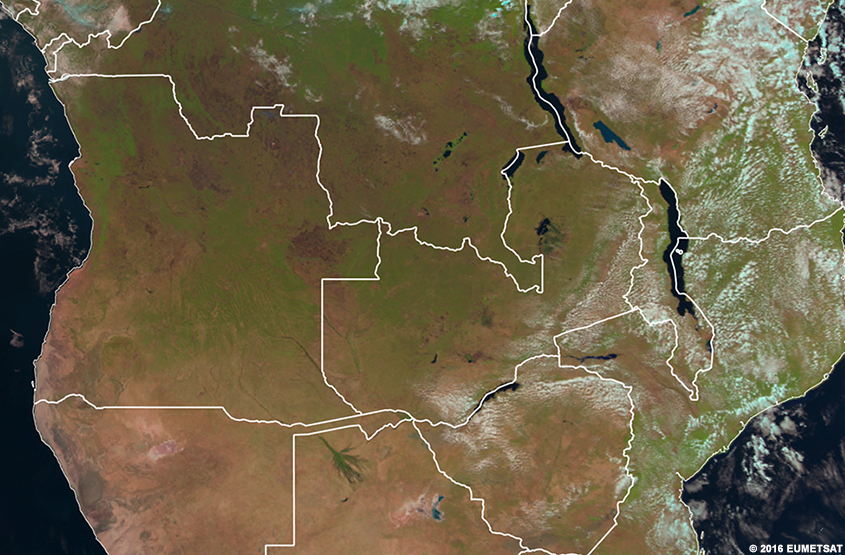
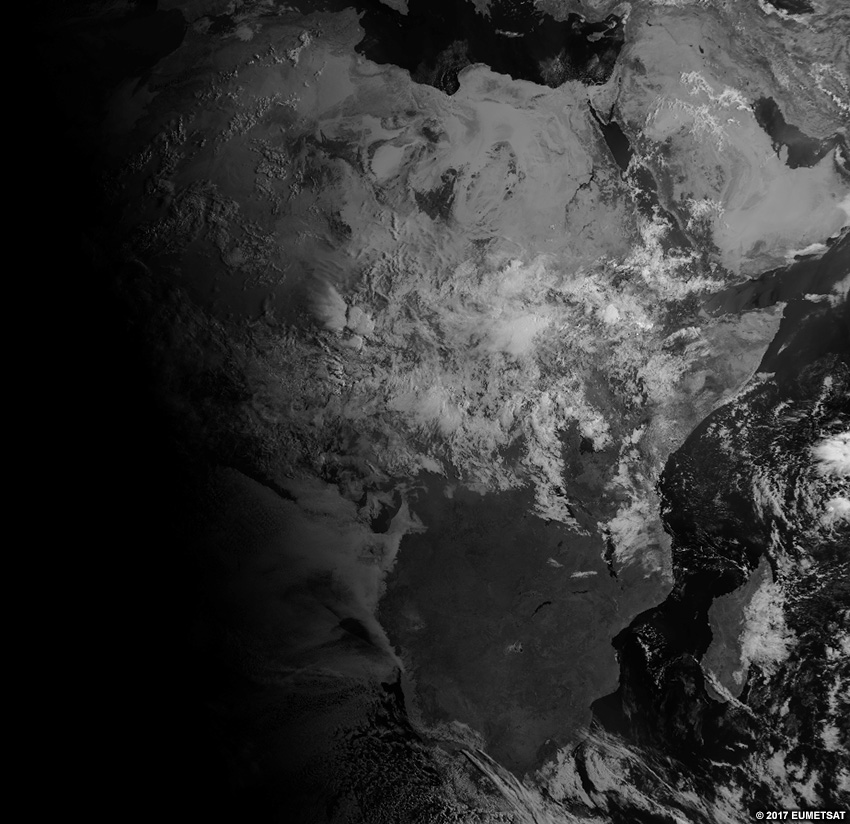
The visible channel works like a black and white photograph of Earth. Objects that look dark to our eyes appear dark in visible imagery and vice versa.
All land surfaces, including deserts, water bodies, vegetation, and bare ground, can be seen in visible imagery during daylight hours.
All cloud types are visible in daytime. The brightness of the clouds can change over the course of the day. At mid-day, clouds appear bright white. At sunrise and sunset, when the sun angle is low, they appear somewhat darker. At night, no light is reflected and thus the image is black.
Effective Use
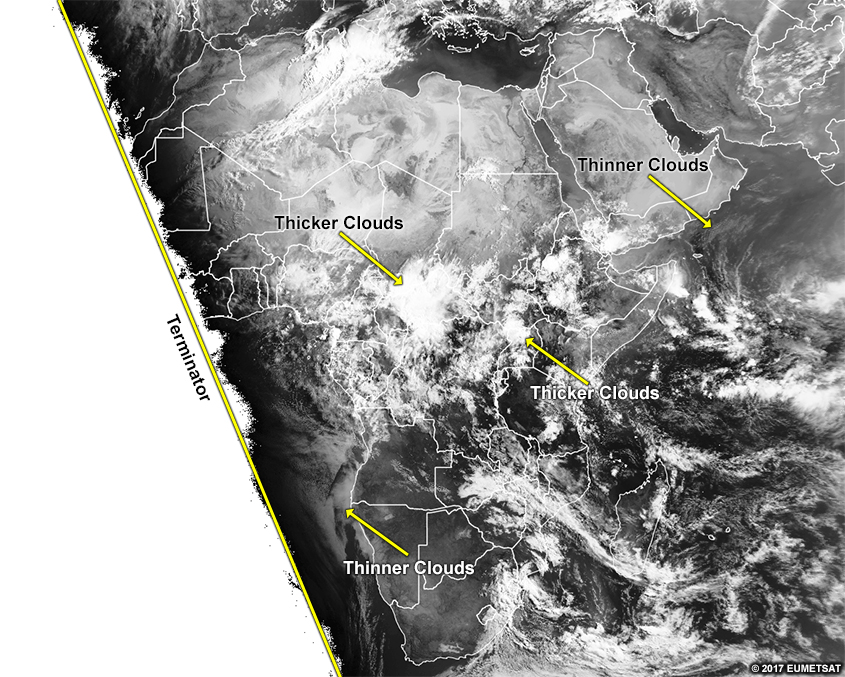
Visible imagery is very useful for identifying cloud types and seeing the structure within clouds during daytime. The differences in grey shades indicate differences in cloud thickness, land cover, or ocean surface. Where the imagery cuts off is where the sun is not shining on the imagery. The line between where the sun is up and the sun is down is called the terminator. The slope of the terminator should indicate the season. The hemisphere with more light along a latitude line is in summer.
Here is the real-time imagery from the MSG visible channel. Explore the imagery by double-clicking (pinching on mobile devices) to zoom and dragging the image to move view. Below the real-time image, you will find a list of questions to ask yourself for exploration and self-evaluation purposes.
* Live data only available for interactive lesson.
Using the real-time imagery, answer the following questions.
- Are features visible at this time of day on the imagery?
- Would these features be visible at other times of day?
- What range of colours are the clouds?
- Do those colours represent what your eye sees?
- Do those colours represent the temperature of the object?
- Do those colours represent some other process?
- What range of colours are surface features?
- Do those colours represent what your eye sees?
- Do those colours represent the temperature of the object?
- Do those colours represent some other process?
- If you are located within the satellite viewing area of MSG, look outside for clouds and surface features. See if those features show up on the imagery by zooming in to your location. What colours do you expect those features to be in this imagery? What colours are those features in the imagery?
Satellite Products » Infrared Channel
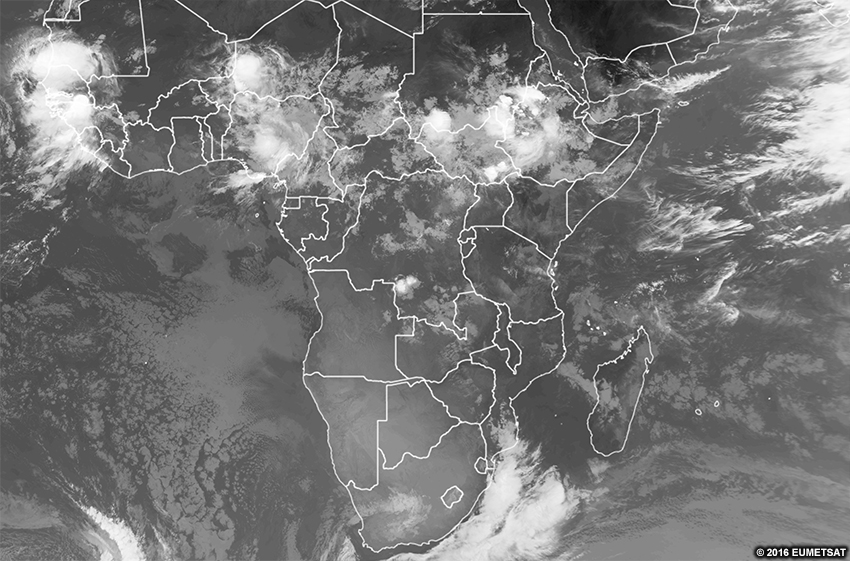
Description
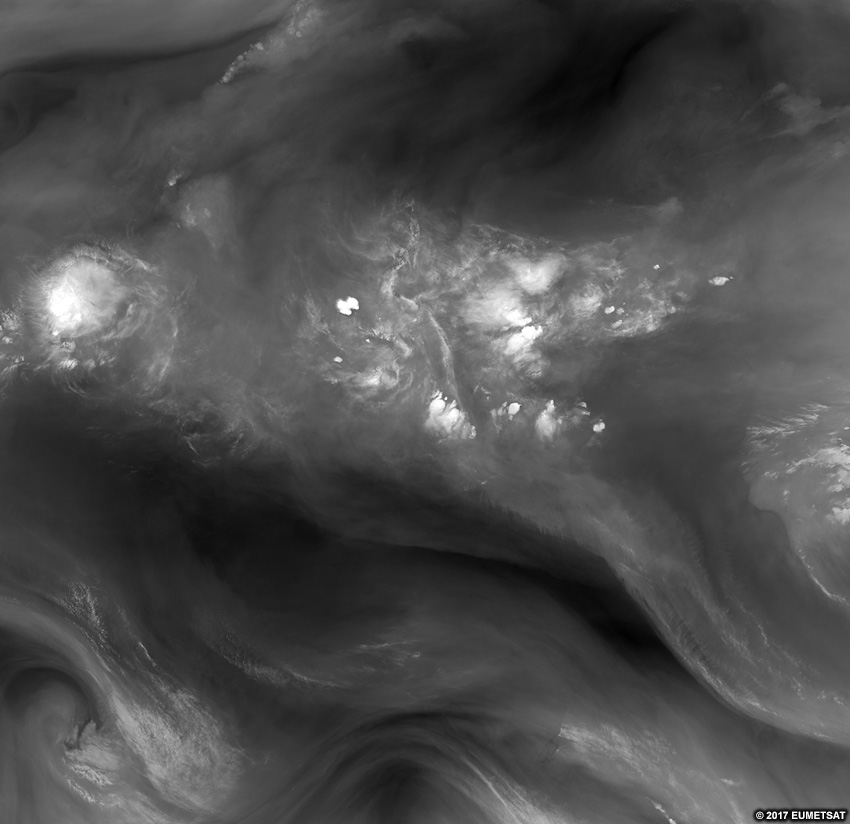
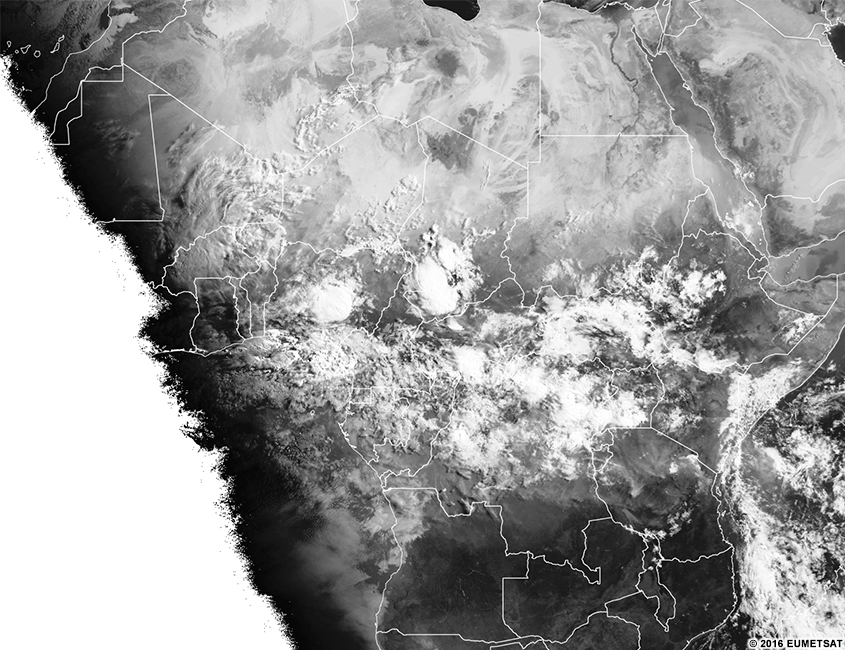
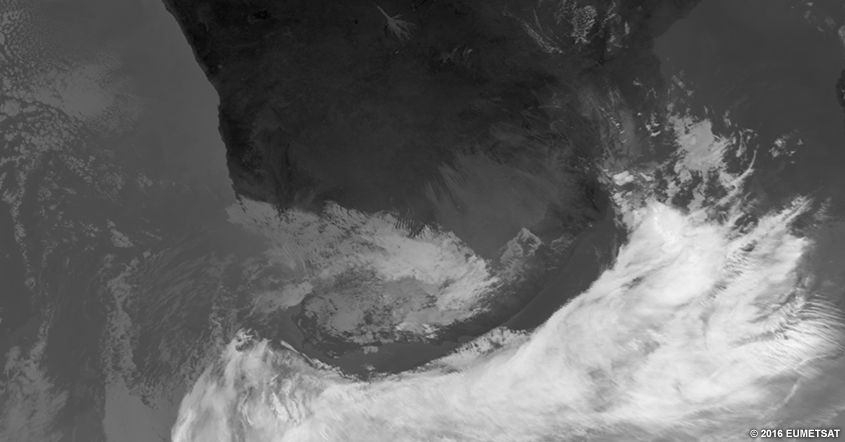
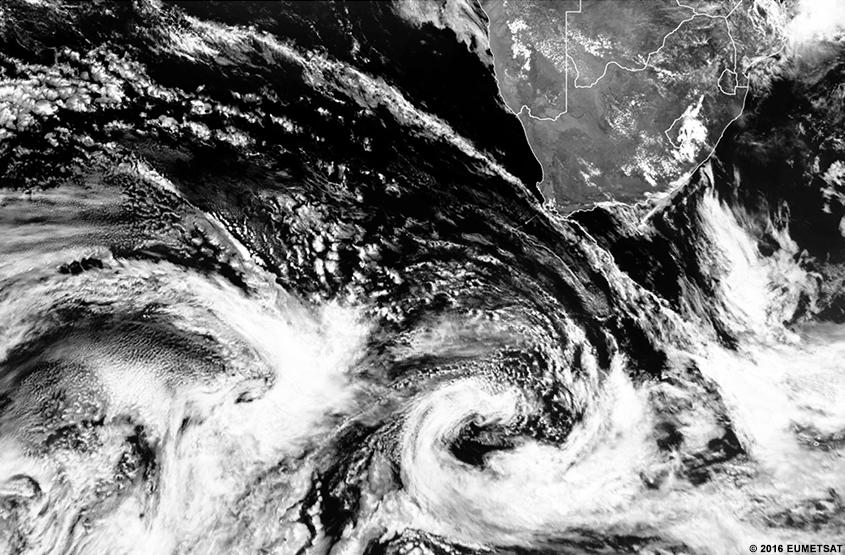
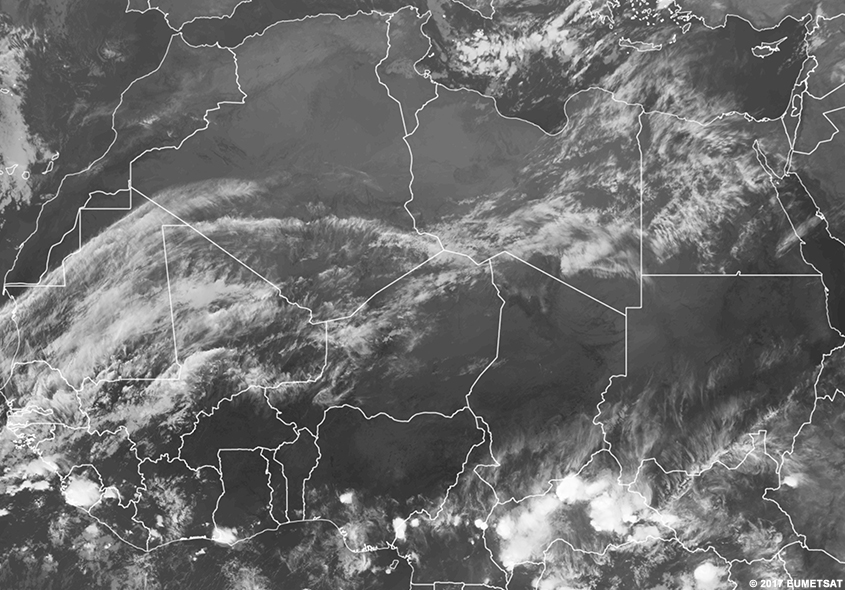
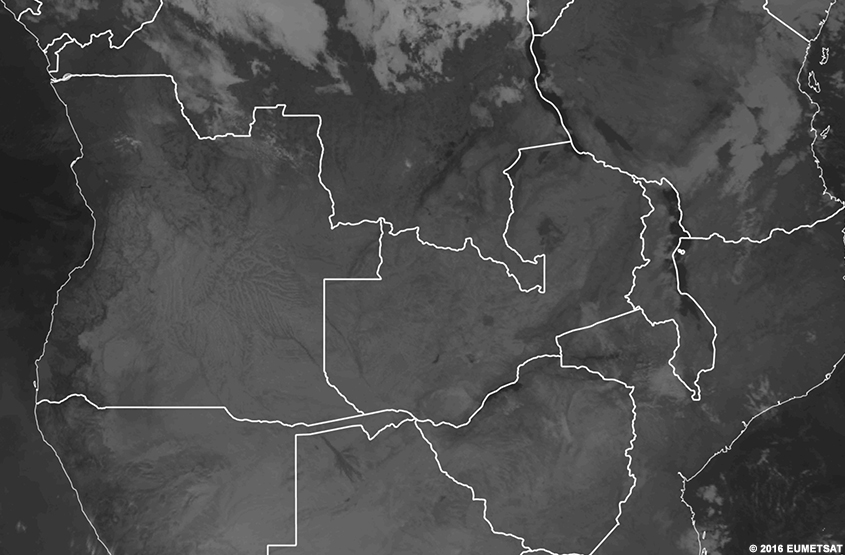
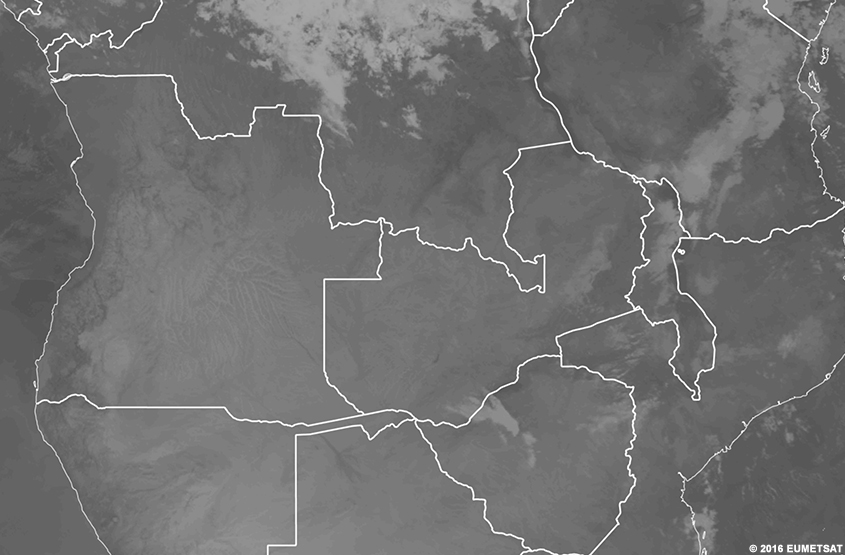
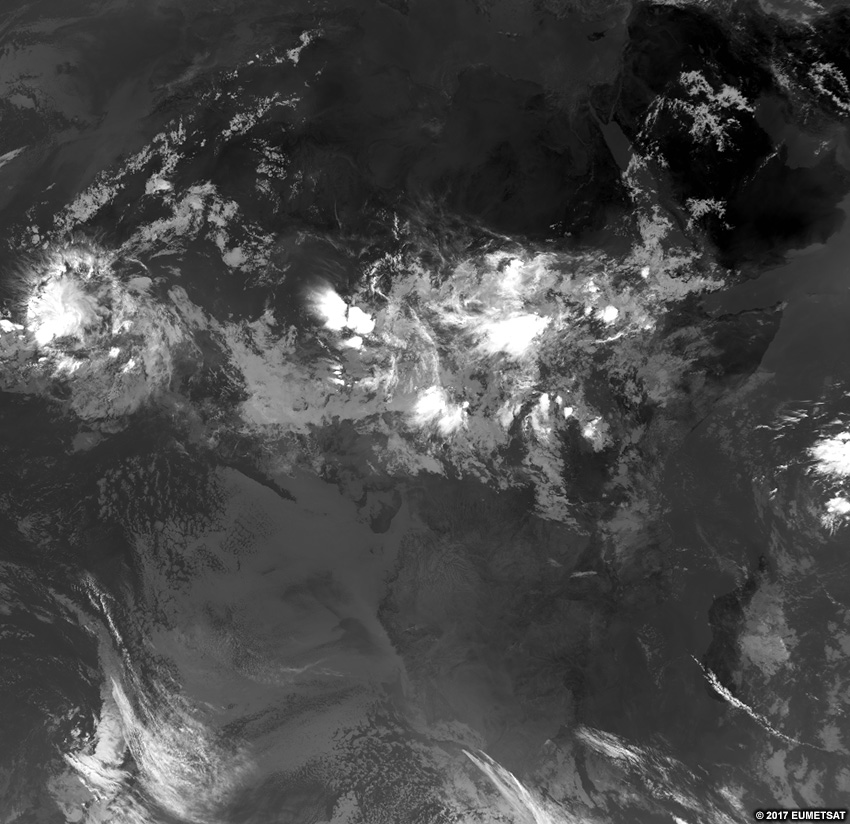
The long-wave infrared (IR) channel behaves like a camera that sees the temperature of objects in grey shades. Warmer objects appear dark gray while colder objects display as light gray through white.
Land surface temperatures change rapidly in response to diurnal heating - especially after sunrise. Temperature-dependent IR imagery helps us differentiate land surfaces from ocean surfaces, whose temperature changes very slowly, and from clouds, which typically do not respond to diurnal changes during their lifetimes. An exception is cumuliform clouds, whose cloud-top temperature can change rapidly throughout the day due to diurnally-forced convective processes.
Effective Use
Brightness temperatures in IR imagery make it relatively easy to differentiate land, ocean, and clouds. In daytime, land surfaces are usually warmer, and thus darker. These areas contrast with the cooler and lighter ocean surfaces and clouds. When land surfaces cool down at night, it can become difficult to differentiate them from oceans and clouds.
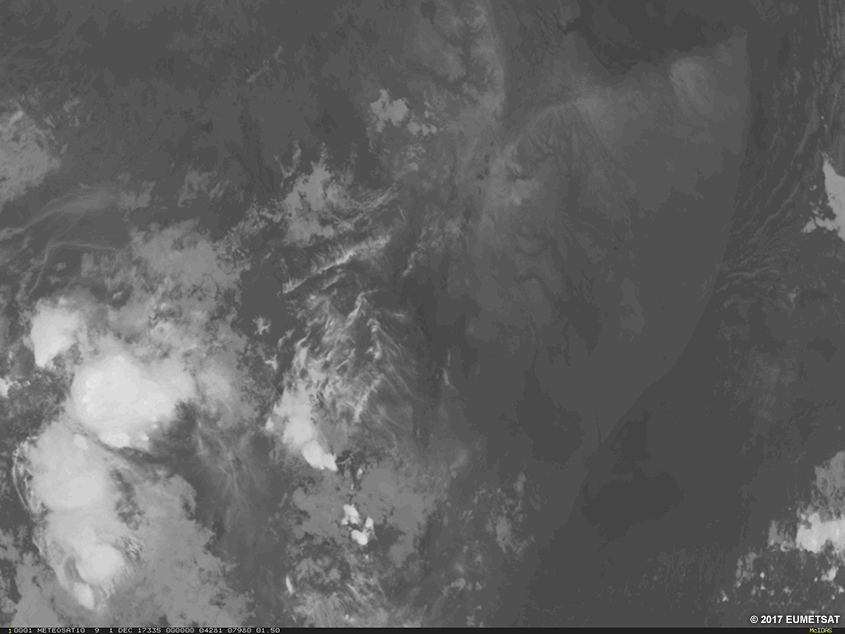
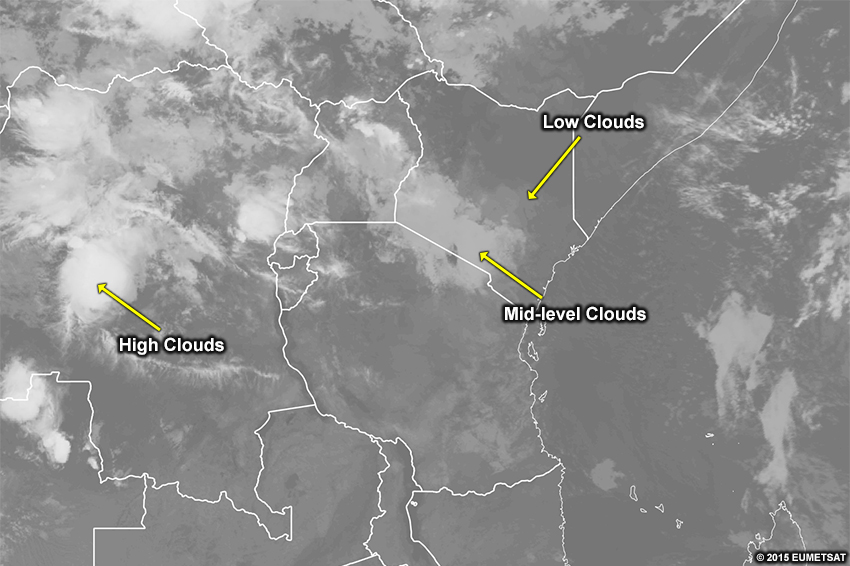
The temperature of the cloud tops can indicate their height since the atmospheric temperature typically decreases strongly with height through the troposphere. Colder (lighter coloured) cloud-top temperatures indicate higher clouds while warmer (darker coloured) cloud-top temperatures indicate lower cloud tops.
The most challenging features to identify in IR imagery are low clouds over land that is cold or snow-covered. Therefore, it’s best to combine IR imagery with other imagery, such as the visible channel, the night microphysics RGB, or the natural colour RGB.
Here is the real-time imagery from the MSG long-wave infrared channel. Explore the imagery by double-clicking (pinching on mobile devices) to zoom and dragging the image to move view. Below the real-time image, you will find a list of questions to ask yourself for exploration and self-evaluation purposes.
* Live data only available for interactive lesson.
Using the real-time imagery, answer the following questions.
- Are features visible at this time of day on the imagery?
- Would these features be visible at other times of day?
- What range of colours are clouds?
- Do those colours represent what your eye sees?
- Do those colours represent the temperature of the object?
- Do those colours represent some other process?
- What range of colours are surface features?
- Do those colours represent what your eye sees?
- Do those colours represent the temperature of the object?
- Do those colours represent some other process?
- If you are located within the satellite viewing area of MSG, look outside for clouds and surface features. See if those features show up on the imagery by zooming in to your location. What colours do you expect those features to be in this imagery? What colours are those features in the imagery?
Satellite Products » Water Vapour Channel
Description
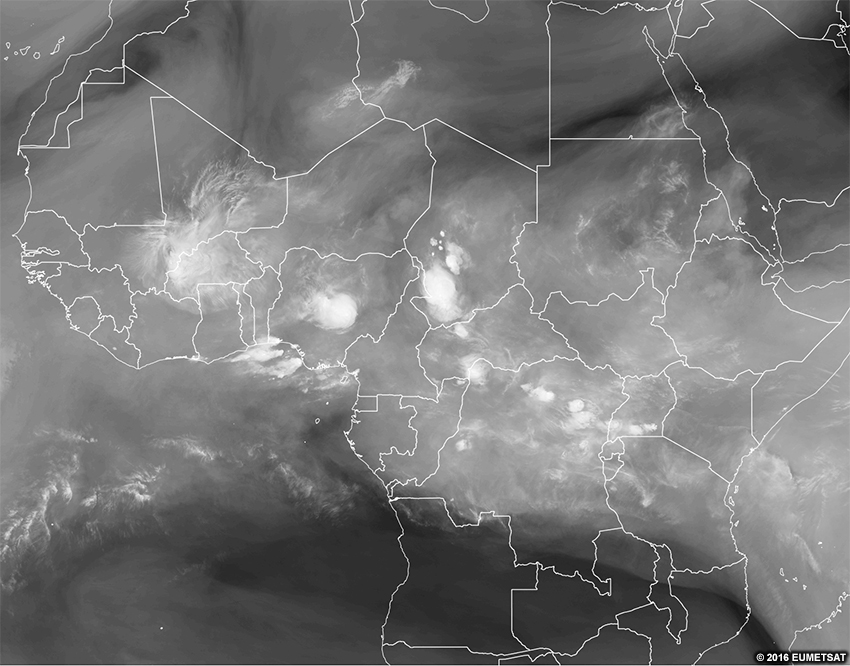
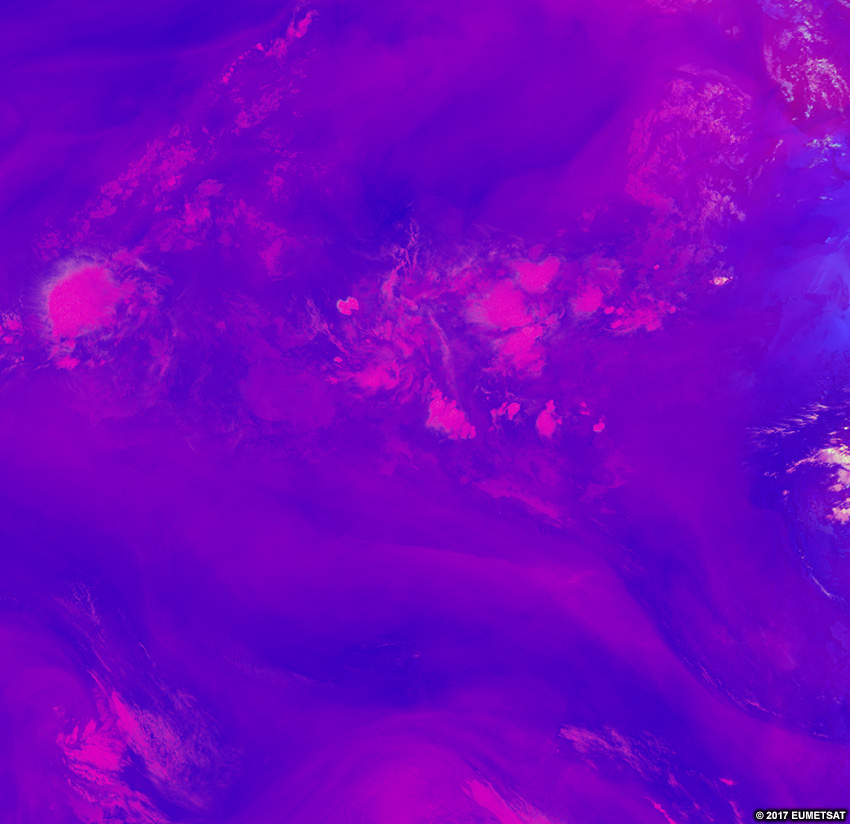
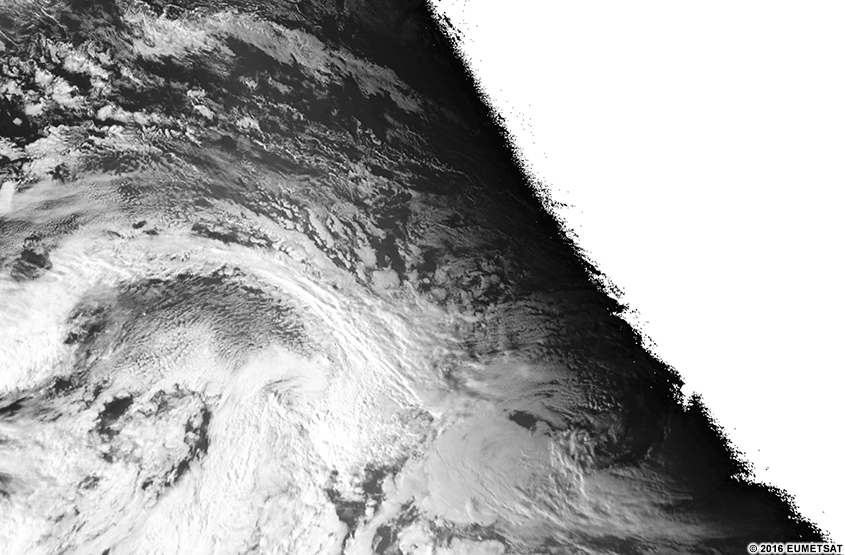
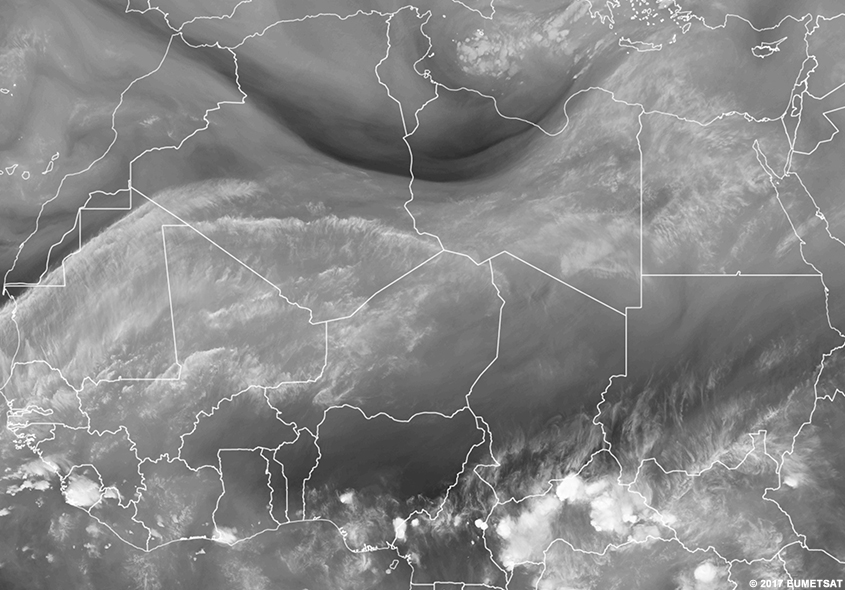
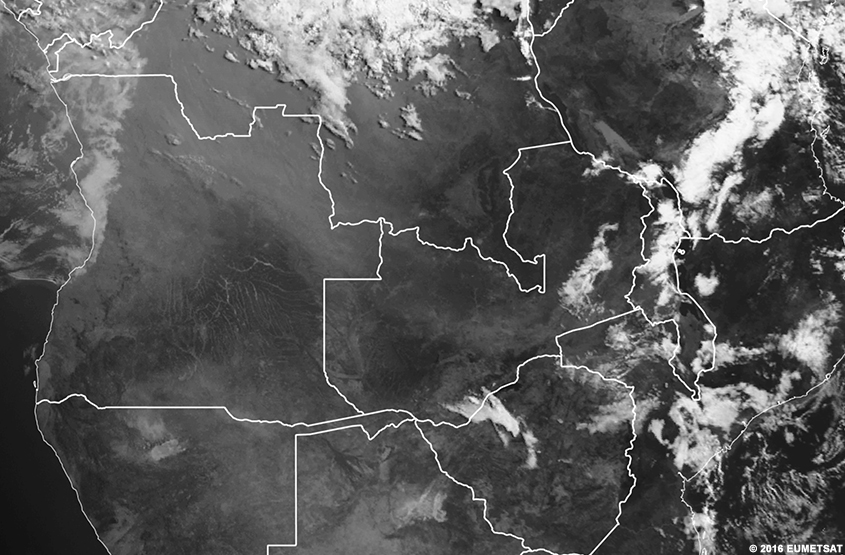
The water vapour (WV) channel measures radiation from a set amount of water vapour in the upper-levels of the troposphere in grey shades. Each pixel shows the same cumulative amount of water vapour detected from the top of the atmosphere downward. The colouration comes from the temperature at which the channel reaches that threshold amount of water vapour radiation as seen in the animation below.
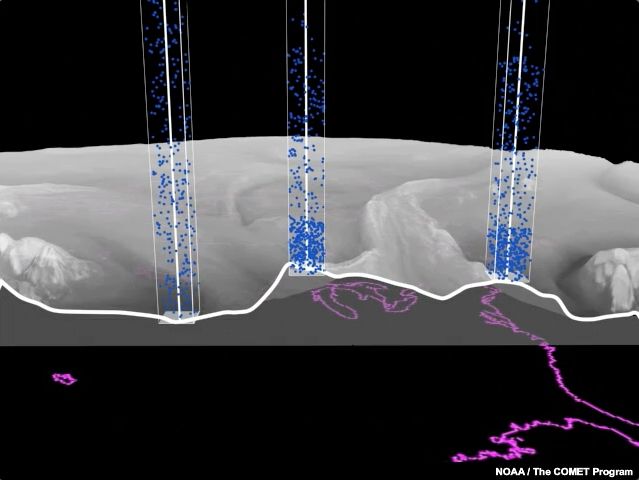
In this animation, the column on the left is longest, with the molecules loosely distributed over a deeper area. The molecules in the other columns are more densely packed and the bases of those columns are higher. The sensor measures the brightness temperature of the water vapour at the bottom of the columns.
Effective Use
The water vapour channel essentially displays the height and distribution of water vapour features. It is particularly well-suited for showing the three-dimensionality of the atmosphere and the continuous layer of water vapour in the mid- and high-latitudes.
The WV channel is less useful for forecasting in the tropics since surface features and small variations drive more of the weather processes. However, WV channel can be good for monitoring developing thunderstorms, mesoscale downdrafts, and upper-level dynamics in the tropics.
WV channels cannot sense land or ocean surfaces since there’s too much water vapour between the sensor and the ground, causing the sensor to always detect a value before reaching the surface.
Here is the real-time imagery from the MSG water vapour channel. Explore the imagery by double-clicking (pinching on mobile devices) to zoom and dragging the image to move view. Below the real-time image, you will find a list of questions to ask yourself for exploration and self-evaluation purposes.
* Live data only available for interactive lesson.
Using the real-time imagery, answer the following questions.
- Are features visible at this time of day on the imagery?
- Would these features be visible at other times of day?
- What range of colours are clouds?
- Do those colours represent what your eye sees?
- Do those colours represent the temperature of the object?
- Do those colours represent some other process?
- What range of colours are surface features?
- Do those colours represent what your eye sees?
- Do those colours represent the temperature of the object?
- Do those colours represent some other process?
- If you are located within the satellite viewing area of MSG, look outside for clouds and surface features. See if those features show up on the imagery by zooming in to your location. What colours do you expect those features to be in this imagery? What colours are those features in the imagery?
Satellite Products » Natural Colour RGB
Description
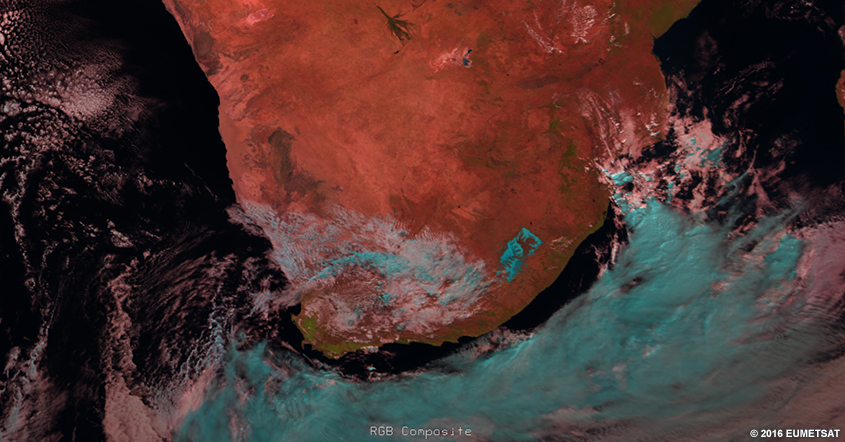
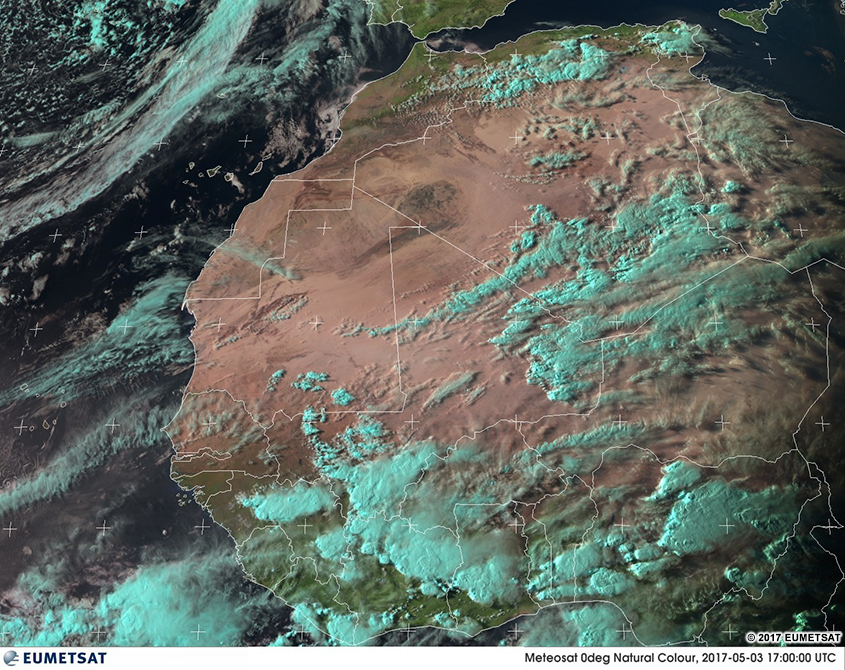
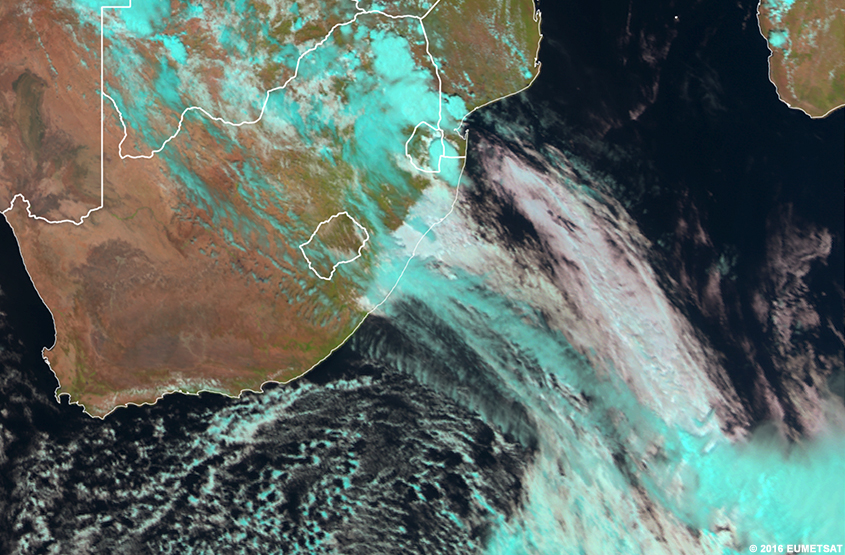
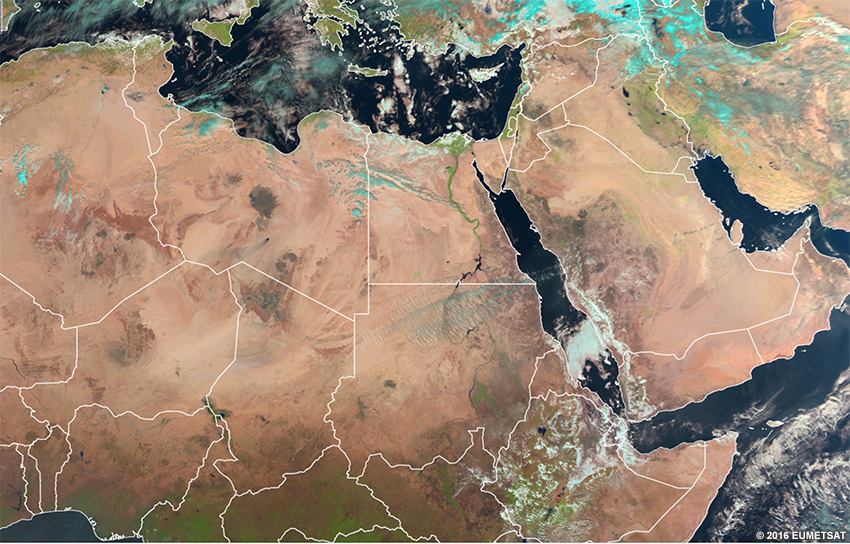
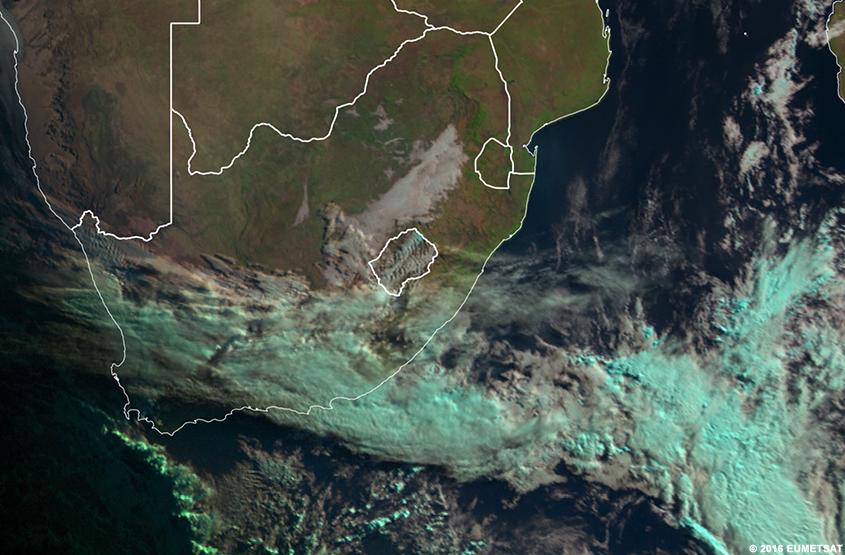
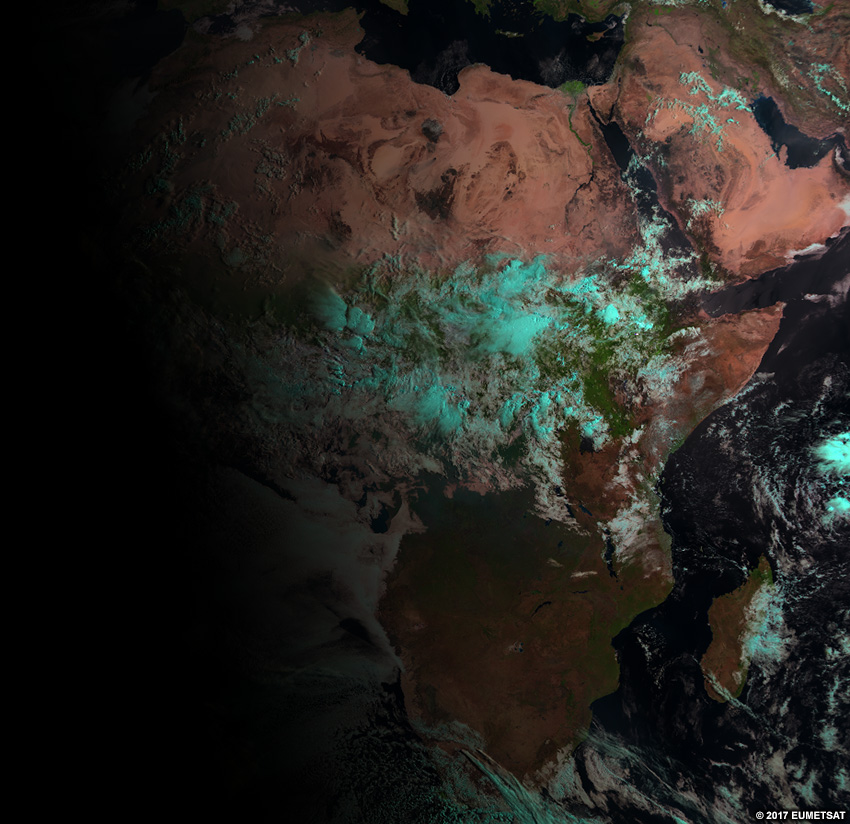
Recall that visible imagery shows what our eyes see in grey shades. The natural colour RGB does this too, with the addition of colour, and most features look realistic.
This product combines three channels (two visible and one near-infrared) to make a colorized version of the visible imagery. Surface ice/snow and ice clouds all show up in the imagery as differing shades of cyan (light blue). Since the RGB is partly made from visible channels, it is not useful at night.
Effective Use
Most surface features look realistic in this product:
- grasslands and forests are typically green
- water appears black
- desert is tan to reddish brown
- clouds are white-pink
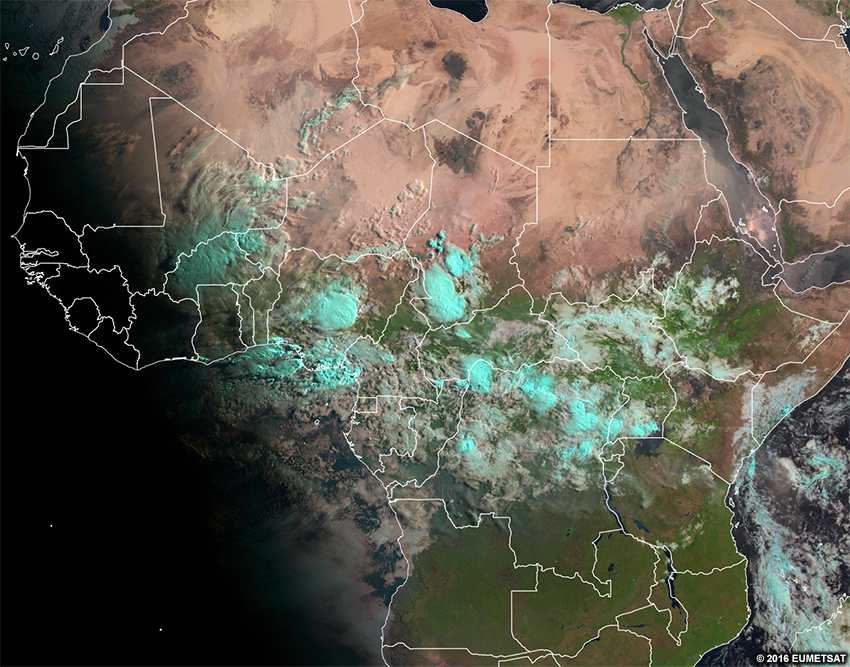
Surface ice/snow and ice clouds appear in shades of cyan (light blue) helping to differentiate them from water clouds. The example below has a mixture of ice and water clouds.
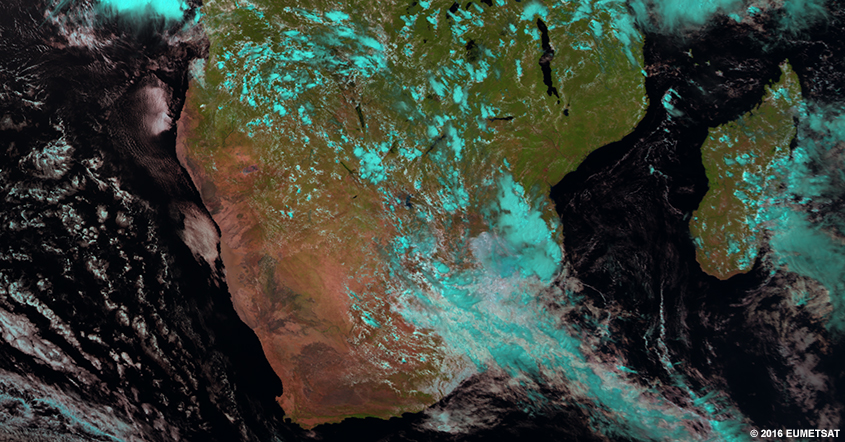
The biggest limitation to this RGB is that ice clouds and surface ice/snow have the same colour (cyan), making them difficult to distinguish from each other. We can see this below over Lesotho. Another important limitation is that water clouds with large droplets (such as marine stratocumulus) can also appear light blue on this imagery.
To differentiate them, animate the images and look for cloud growth or motion. This may be challenging if snow is melting at a rate similar to cloud growth or decay. For a more definitive answer, check other products such as IR imagery.
Here is the real-time imagery from the MSG natural colour RGB. Explore the imagery by double-clicking (pinching on mobile devices) to zoom and dragging the image to move view. Below the real-time image, you will find a list of questions to ask yourself for exploration and self-evaluation purposes.
* Live data only available for interactive lesson.
Using the real-time imagery, answer the following questions.
- Are features visible at this time of day on the RGB?
- Would these features be visible at other times of day?
- What features really stand out to your eyes in this RGB?
- What range of colours are clouds?
- Do those colours represent cloud-top heights?
- Do those colours represent cloud thickness?
- Do those colours represent temperatures?
- Do those colours represent some other process?
- What range of colours are surface features?
- Do those colours represent the temperature of the object?
- Do those colours represent the albedo of the object?
- Do those colours represent some other process?
- If you are located within the satellite viewing area of MSG, look outside for clouds and surface features. See if those features show up on the imagery by zooming in to your location. What colours do you expect those features to be in this imagery? What colours are those features in the imagery?
Satellite Products » Dust RGB
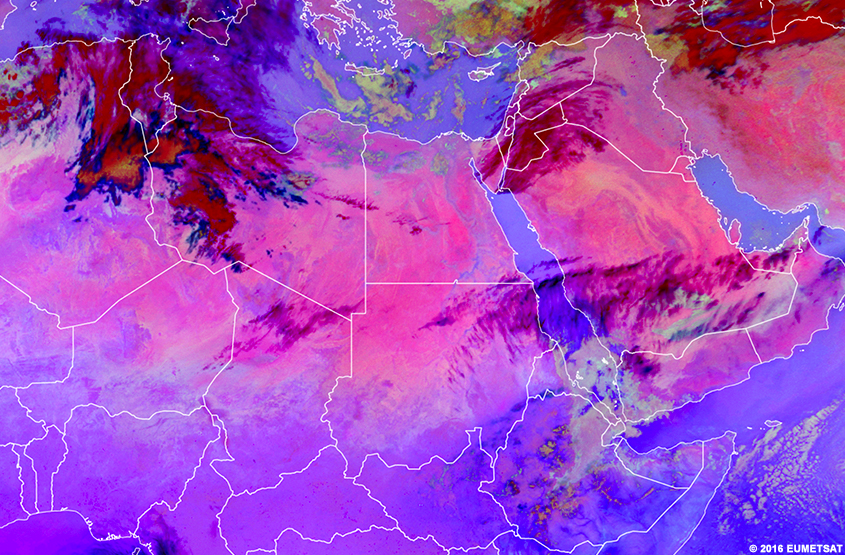
Description
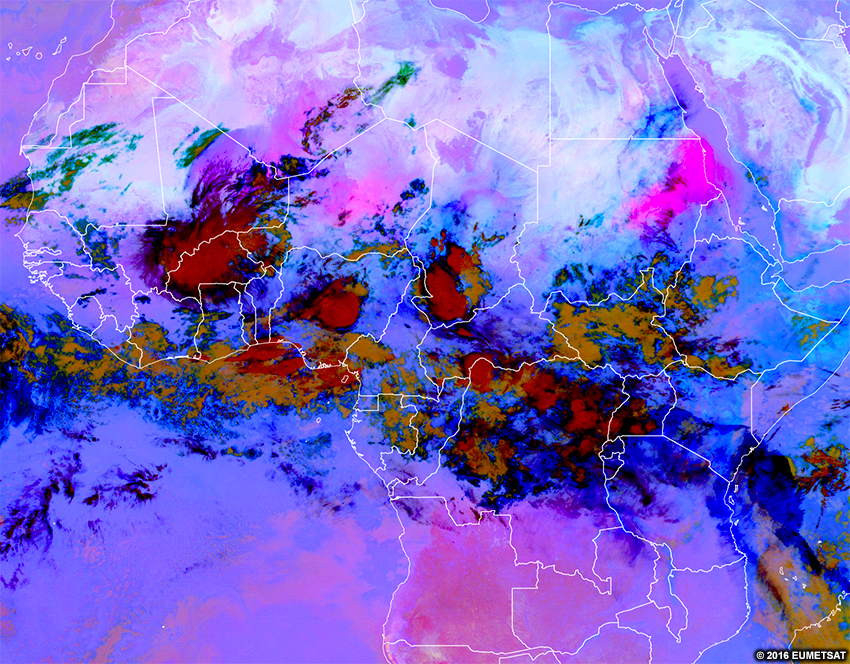
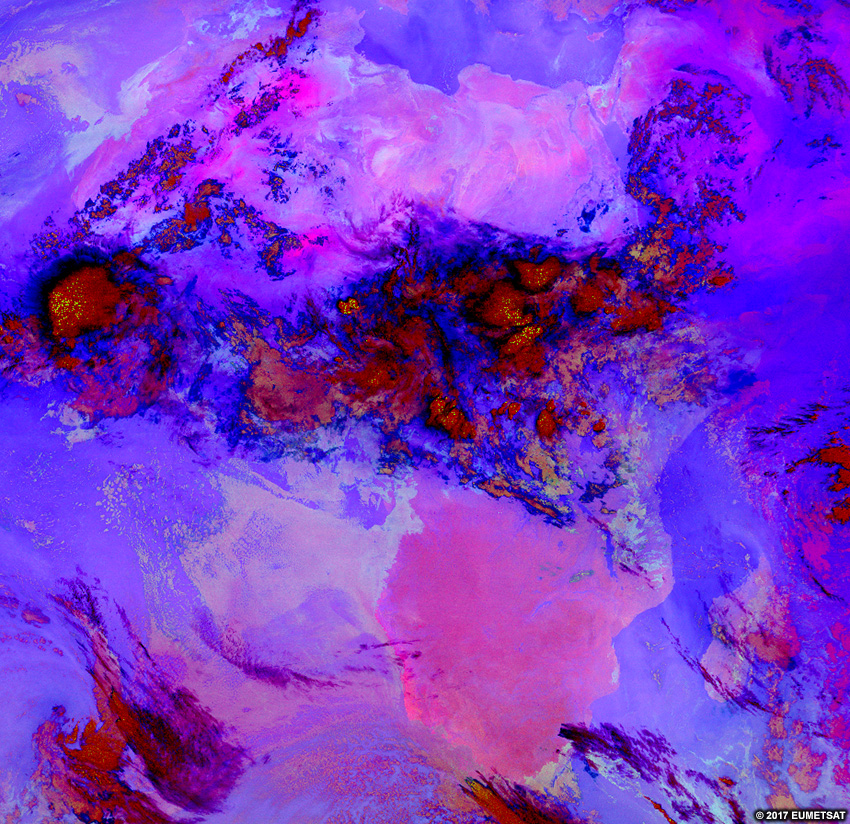
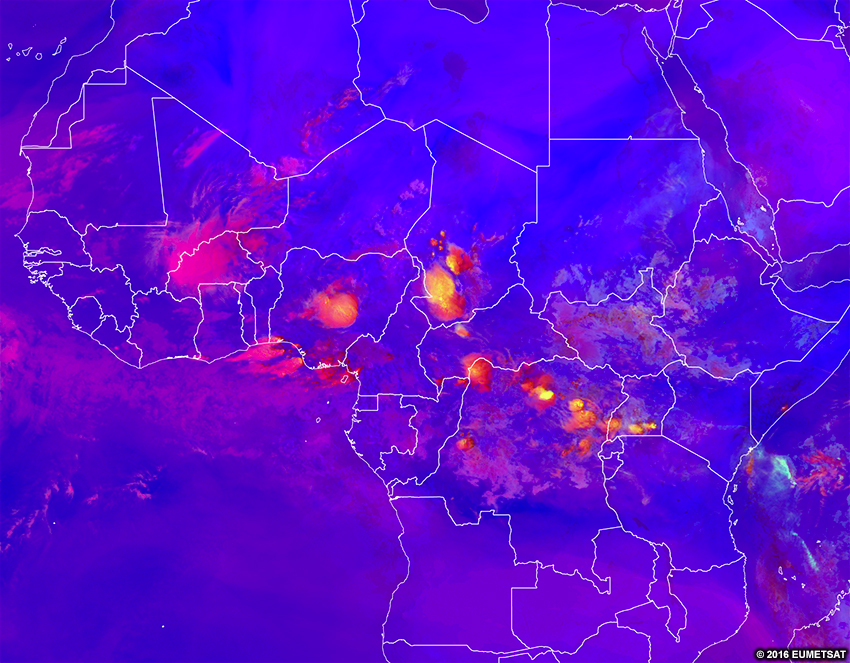
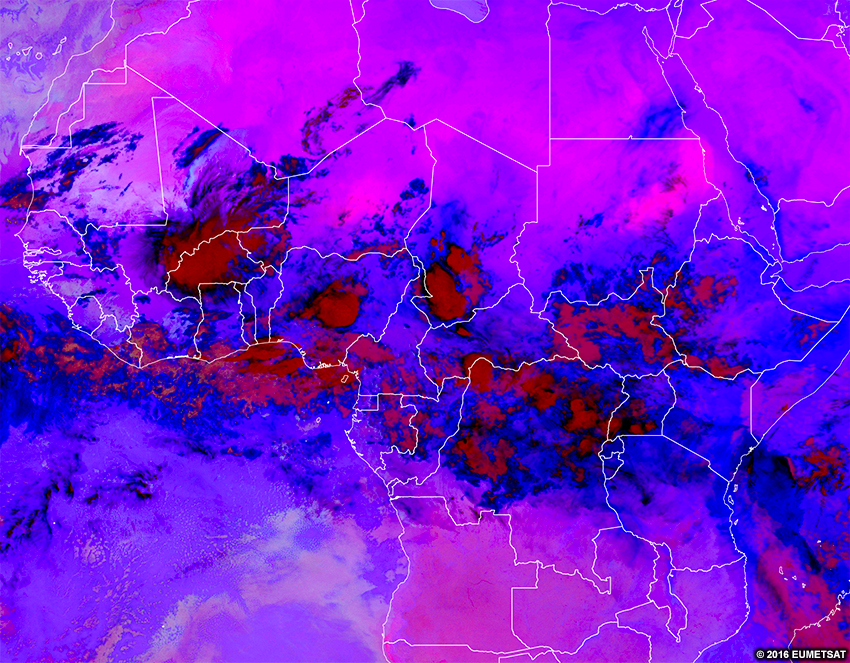
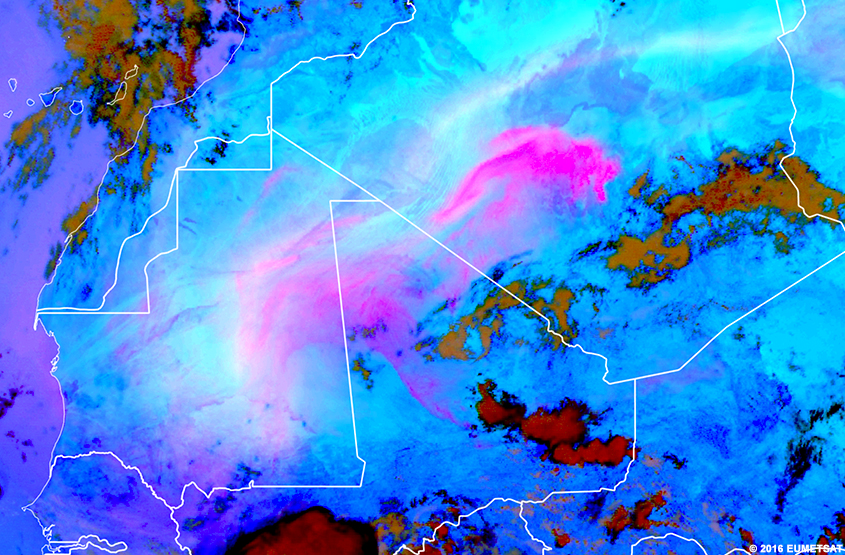
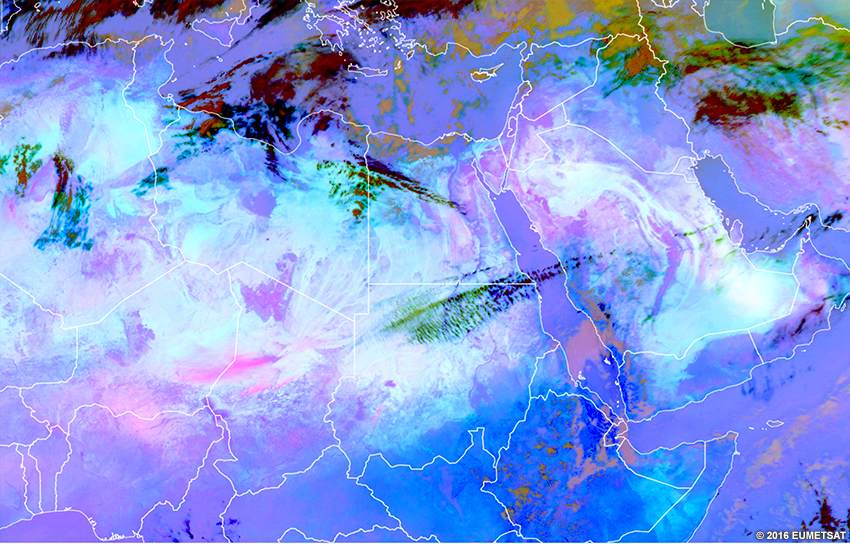
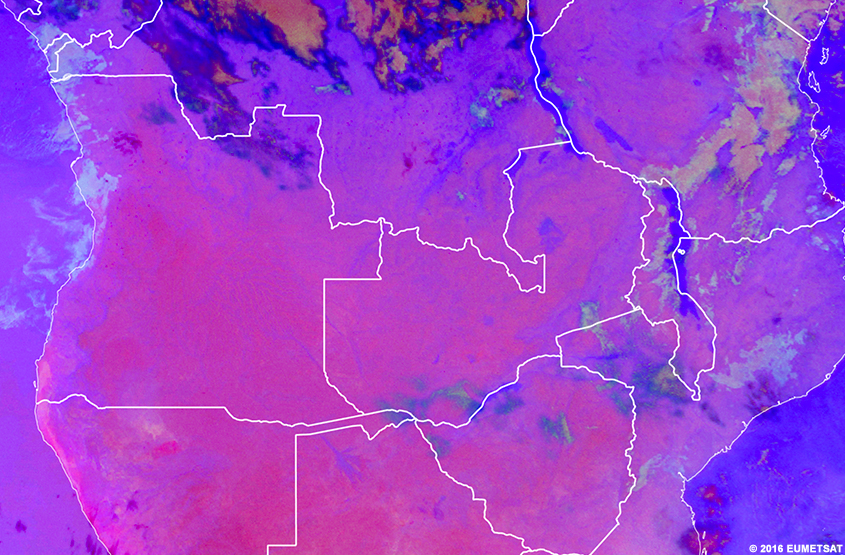
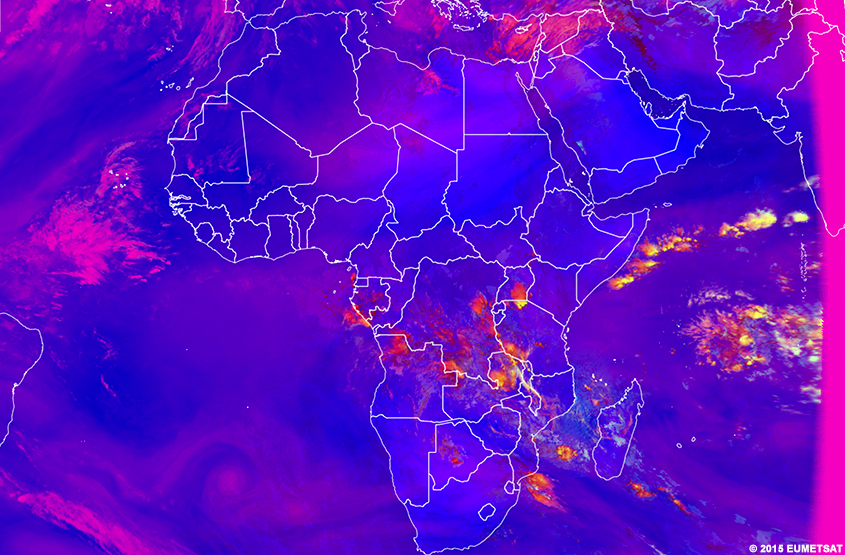
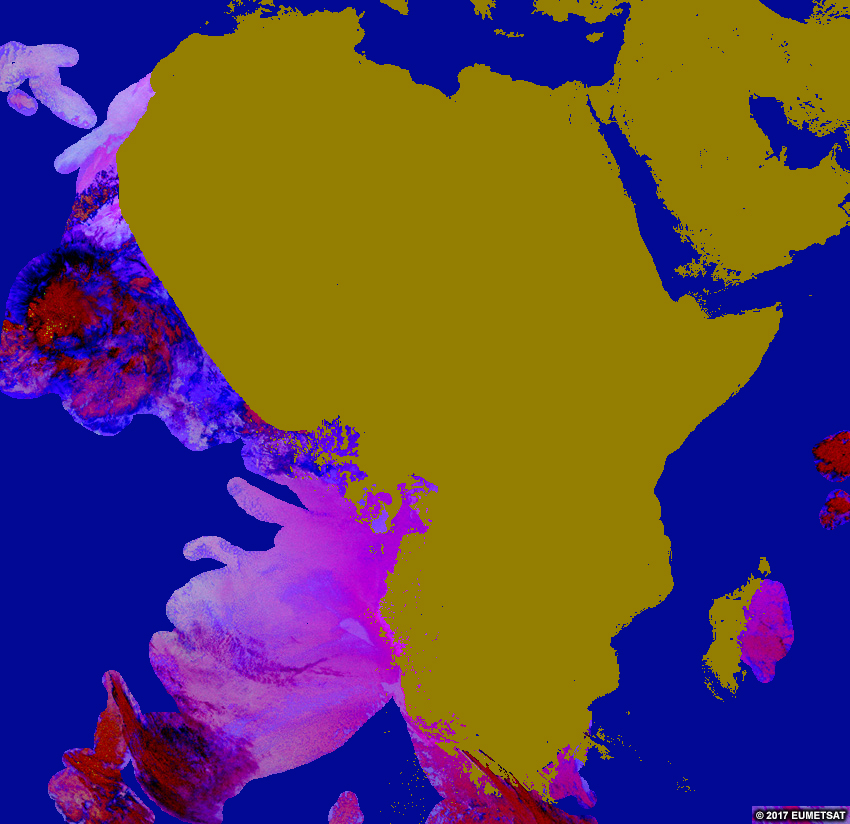
The dust RGB combines information from several infrared channels and channel differences in order to highlight dust. Dust is difficult to identify in other imagery with certainty, but it stands out clearly in shades of bright pink in this RGB.
Effective Use
Since the dust RGB is made from infrared channels, it is useful both during the day and at night. There are some minor time-of-day dependencies to consider:
- During daytime, bright pink areas are always dust. You cannot determine the height of the dust cloud-top during the day.
- During daytime, very thick dust can appear dark magenta.
- At night, dust ranges in colour from pink to purple or purple-blue. The pinker the dust area, the higher its cloud-top is. Likewise, the bluer the area, the lower the dust cloud top.
|
Color |
Physical Meaning at Night |
|
High-level Dust |
|
|
Mid-level Dust |
|
|
Low-level Dust |
Overall, the imagery has a bluer hue during the day, since the blue colours are controlled by only the long-wave infrared channel. Thus, as temperatures increase at the start of the day, the blue tones will become stronger.
Here is the real-time imagery from the MSG dust RGB. Explore the imagery by double-clicking (pinching on mobile devices) to zoom and dragging the image to move view. Below the real-time image, you will find a list of questions to ask yourself for exploration and self-evaluation purposes.
* Live data only available for interactive lesson.
Using the real-time imagery, answer the following questions.
- Are features visible at this time of day on the RGB?
- Would these features be visible at other times of day?
- What features really stand out to your eyes in this RGB?
- What range of colours are clouds?
- Do those colours represent cloud-top heights?
- Do those colours represent cloud thickness?
- Do those colours represent temperatures?
- Do those colours represent some other process?
- What range of colours are surface features?
- Do those colours represent the temperature of the object?
- Do those colours represent the albedo of the object?
- Do those colours represent some other process?
- If you are located within the satellite viewing area of MSG, look outside for clouds and surface features. See if those features show up on the imagery by zooming in to your location. What colours do you expect those features to be in this imagery? What colours are those features in the imagery?
Satellite Products » Severe Convection RGB
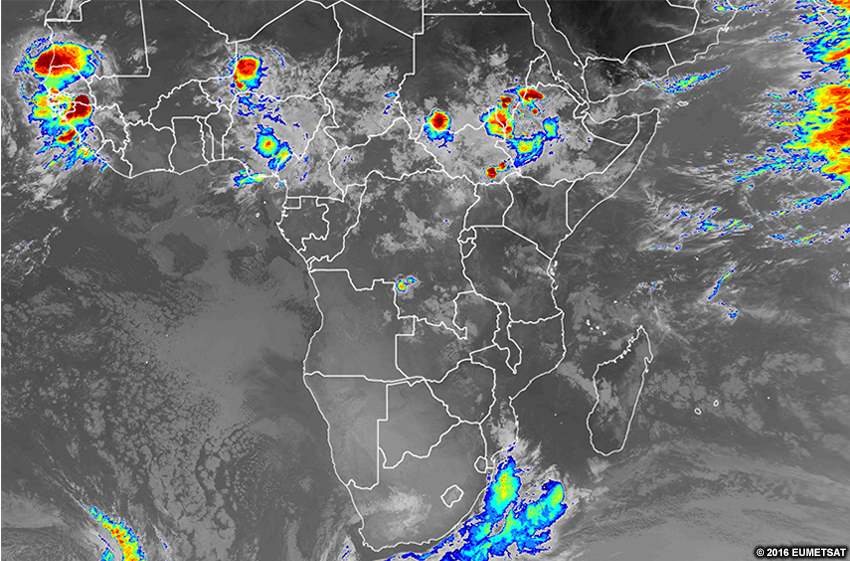
Description
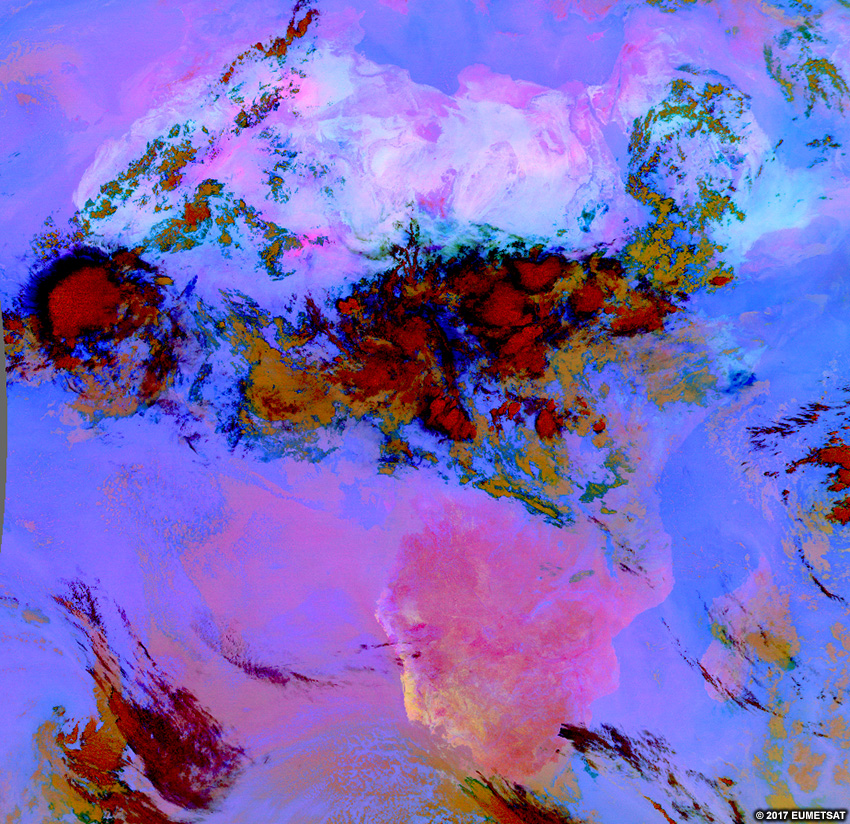
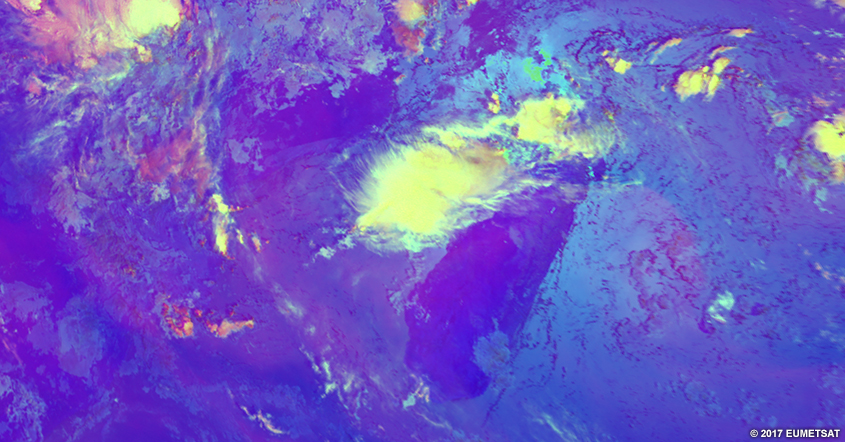
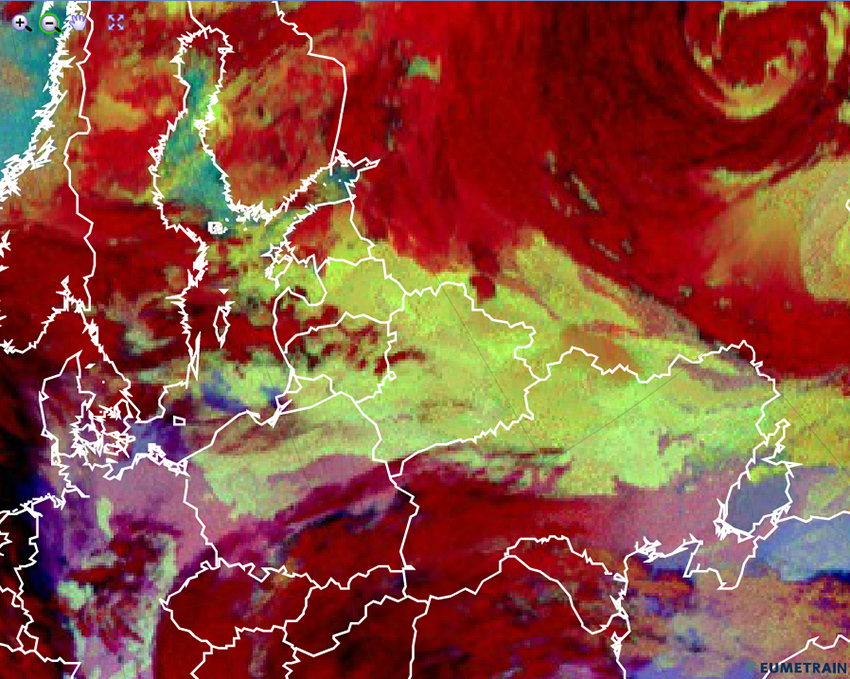
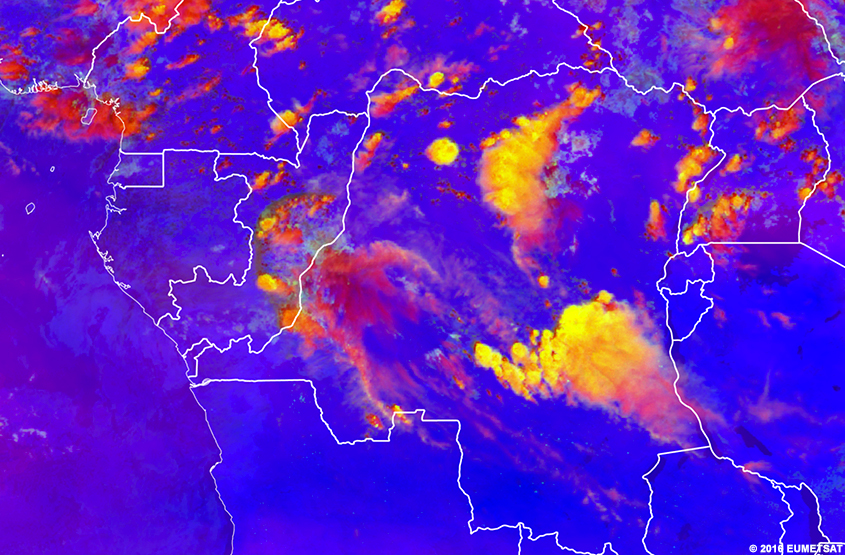
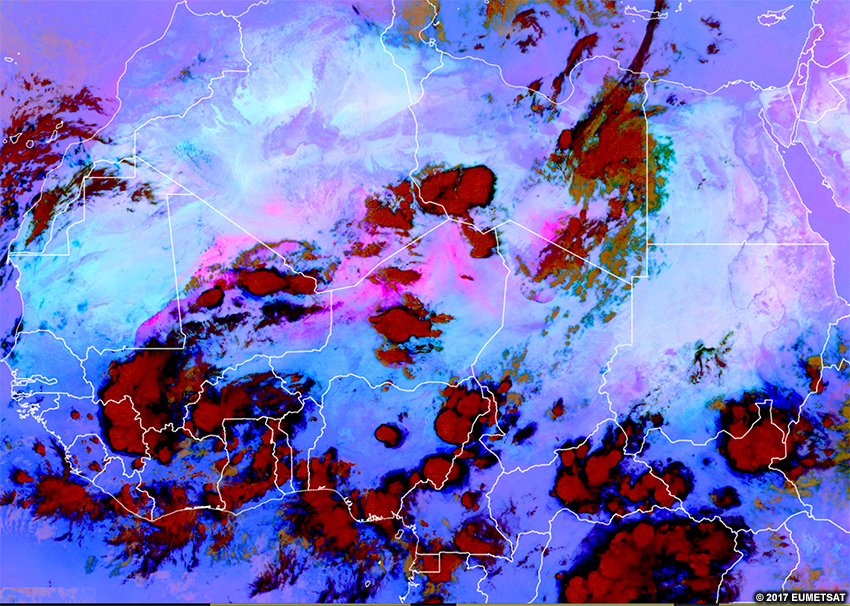
The severe convection RGB shows areas of active thunderstorms with strong updrafts in colours ranging from red (less intense convection) to yellow (most intense convection). The rest of the product is blue or purple to make the strongest storms stand out.
This product is made with a combination of visible, infrared and water vapour channels and channel differences. Because of this, the product can be used only during the day.
Effective Use
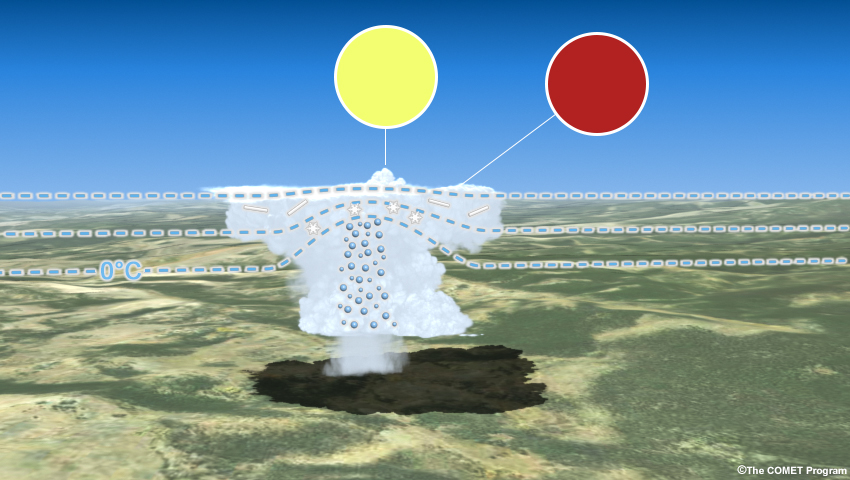
Tall, thick clouds initially appear red. Over time, as the updraft generates and pushes more ice crystals upward, the tops will appear more yellow. Later on, the yellow areas may grow horizontally as small ice crystals fill out the anvil of the storm. Dissipating yellow colours indicate that the updraft is weakening.
The effective use of the severe convection RGB requires that you understand some of the methodology for how the colours would change with an evolving cloud structure. Below you will find a step-wise animation of the growth of thunderstorms and the changes that would occur from the satellite RGB’s perspective.
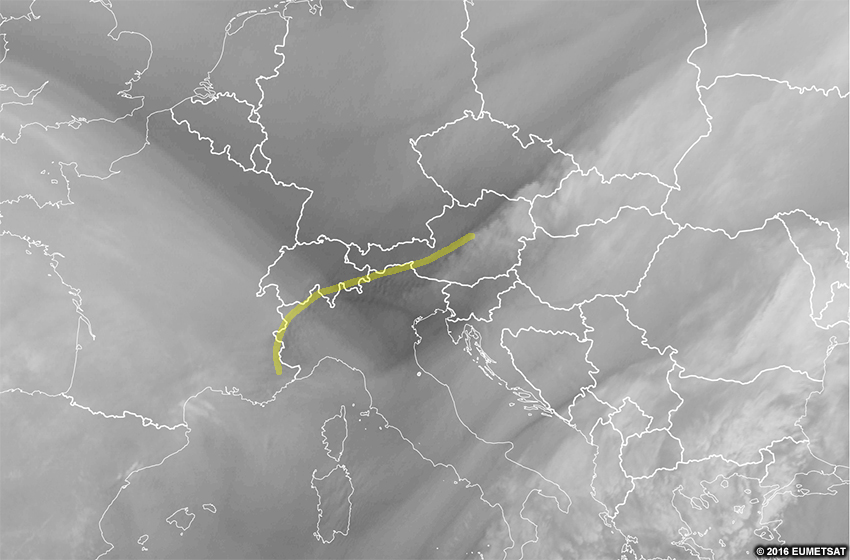
It is important to note that yellow features can also be mountain lee wave clouds, as shown in the loop below, or non-severe high-based thunderstorms, as well as polluted, thick ice clouds.
To determine if yellow features are indeed severe thunderstorms, consult other satellite imagery, and look for the following:
- pulsing or textured character on IR or visible imagery to confirm severe convection
- uniformly-coloured, smooth cloud tops to confirm mountain lee wave clouds
Note that polluted, thick, ice clouds are especially hard to determine since the aerosols producing the pollution may not be seen on satellite imagery.
Here is the real-time imagery from the MSG severe convection RGB. Explore the imagery by double-clicking (pinching on mobile devices) to zoom and dragging the image to move view. Below the real-time image, you will find a list of questions to ask yourself for exploration and self-evaluation purposes.
* Live data only available for interactive lesson.
Using the real-time imagery, answer the following questions.
- Are features visible at this time of day on the RGB?
- Would these features be visible at other times of day?
- What features really stand out to your eyes in this RGB?
- What range of colours are clouds?
- Do those colours represent cloud-top heights?
- Do those colours represent cloud thickness?
- Do those colours represent temperatures?
- Do those colours represent some other process?
- What range of colours are surface features?
- Do those colours represent the temperature of the object?
- Do those colours represent the albedo of the object?
- Do those colours represent some other process?
- If you are located within the satellite viewing area of MSG, look outside for clouds and surface features. See if those features show up on the imagery by zooming in to your location. What colours do you expect those features to be in this imagery? What colours are those features in the imagery?
Satellite Products » Night Microphysics RGB
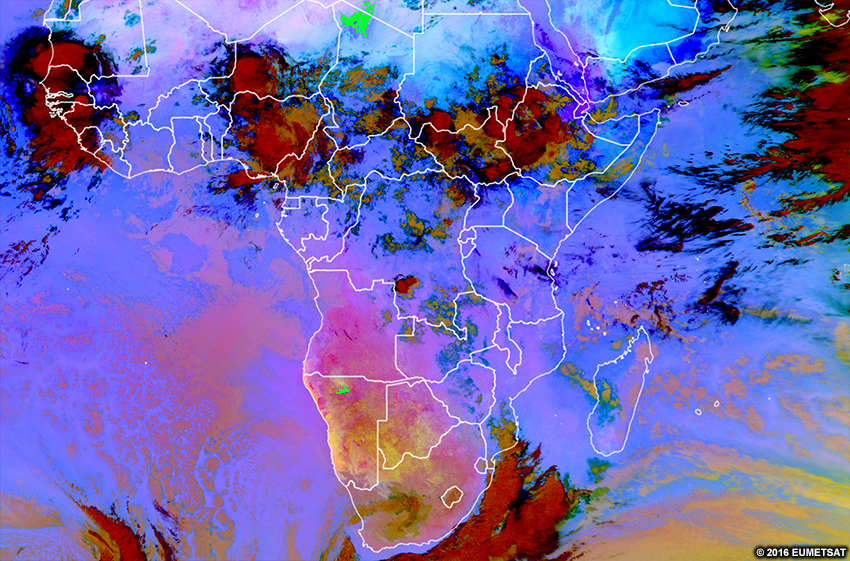
Description
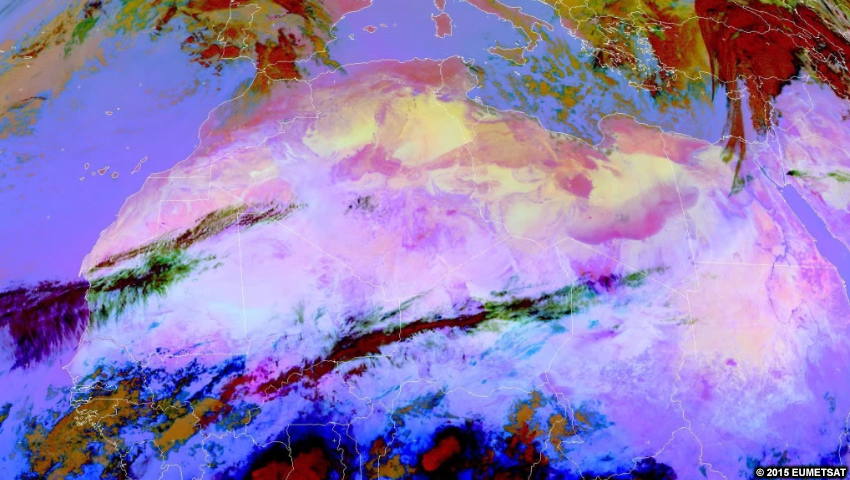
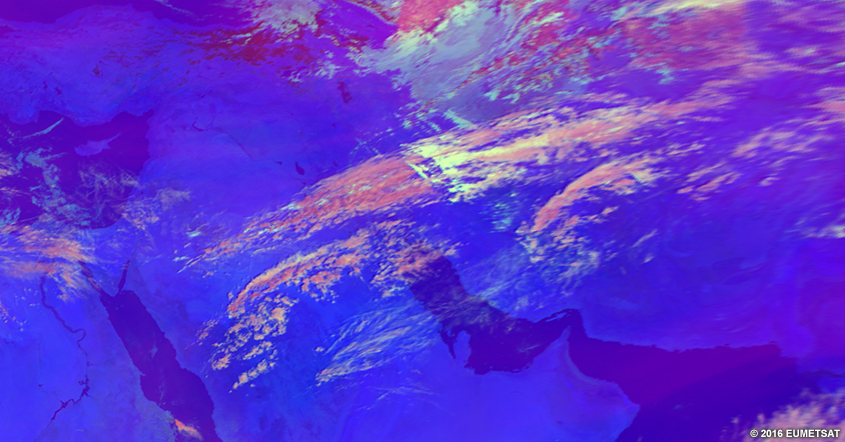
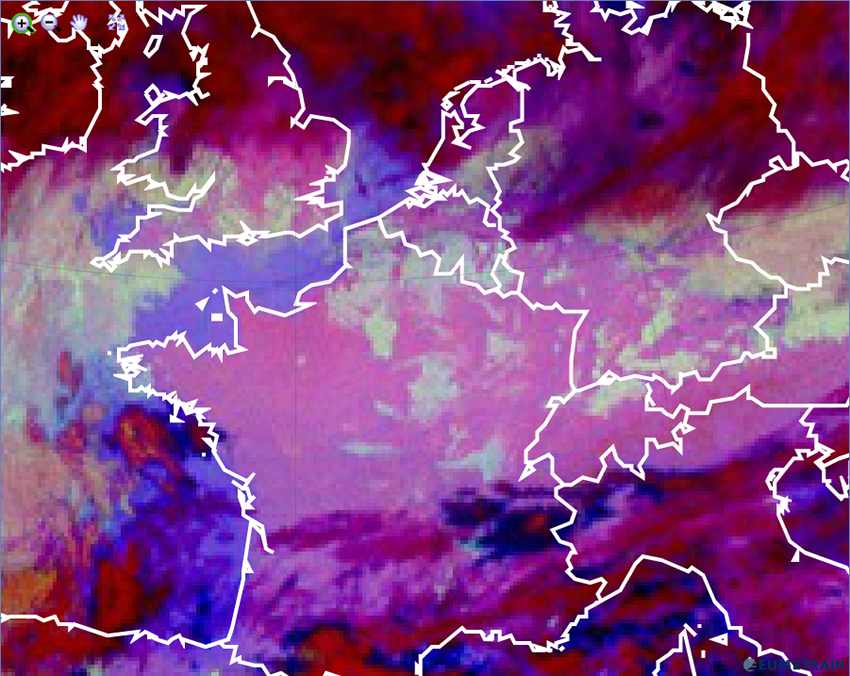
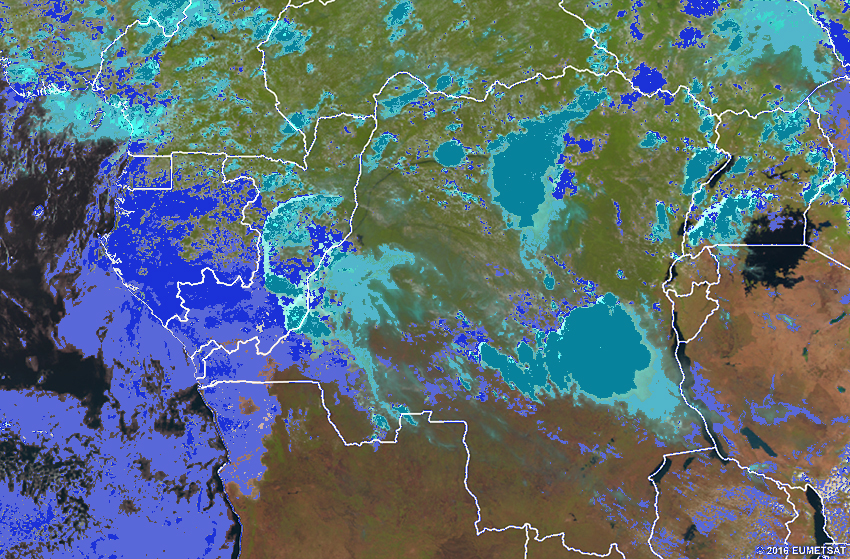
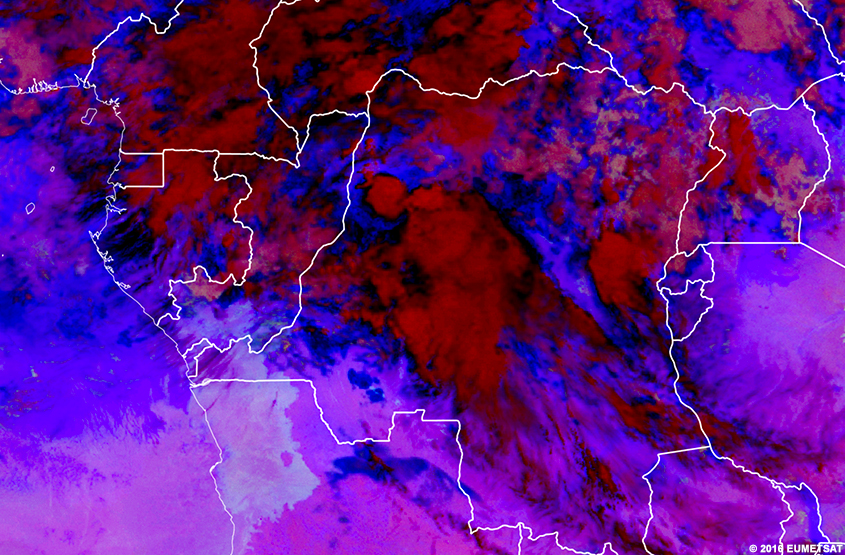
This RGB lets you identify nighttime low-level clouds and fog, and differentiate them from snow cover. You can also determine cloud heights. The colour of some features depends on latitude and season.
This RGB is made from three different IR channels and channel differences. It thus can be used any time of day, but the night microphysics RGB is tuned for nighttime.
Effective Use
Both the season and weather regime play a role in dictating the colour of some features in this RGB. Because this RGB is all IR channels, the colours are controlled heavily by the cloud-top temperature and cloud-top temperature difference between channels. This can have a strong dependence by season, viewing angle or overall temperature profile. Generally, low clouds/fog appear:
- green in the mid- and high-latitude cold seasons and during cold weather regimes
- light blue in the mid- and low-latitude warm season and during warm weather regimes
Examples of each follow.
Cold Season/Regime
Warm Season/Regime
High cirrus clouds are purple to black; thick ice clouds are dark red; and mid-level clouds are pink to brownish.
In the tropics, low-level stratiform clouds are light blue. Mid-level clouds are pinkish to brownish, and high-level cirrus are black to dark blue.
If you want to verify whether clouds are present before sunset, look at the natural colour RGB or visible imagery. This is particularly important during seasonal changes when low clouds and fog change from being green to light blue or light blue to green, as this can cause confusion when weather regimes differ on a daily basis.
Move the slider to see how the natural colour RGB (first image) can help identify low fog/clouds before sunset.
In the loop below, the sun is setting and some areas are starting to show up as low clouds/fog. This example highlights the importance of knowing the timing of your imagery.

Here is the real-time imagery from the MSG night microphysics RGB. Explore the imagery by double-clicking (pinching on mobile devices) to zoom and dragging the image to move view. Below the real-time image, you will find a list of questions to ask yourself for exploration and self-evaluation purposes.
* Live data only available for interactive lesson.
Using the real-time imagery, answer the following questions.
- Are features visible at this time of day on the RGB?
- Would these features be visible at other times of day?
- What features really stand out to your eyes in this RGB?
- What range of colours are clouds?
- Do those colours represent cloud-top heights?
- Do those colours represent cloud thickness?
- Do those colours represent temperatures?
- Do those colours represent some other process?
- What range of colours are surface features?
- Do those colours represent the temperature of the object?
- Do those colours represent the albedo of the object?
- Do those colours represent some other process?
- If you are located within the satellite viewing area of MSG, look outside for clouds and surface features. See if those features show up on the imagery by zooming in to your location. What colours do you expect those features to be in this imagery? What colours are those features in the imagery?
Satellite Product Comparisons
Next, you’ll learn to use satellite imagery and products to analyse cloud heights and thicknesses, and compare land and ocean features. But first, let’s make sure that you know which products to use for different situations. Note: From here on out, we’ll refer to images and products simply as “products.”
Here, you will view all products for a different case and answer a series of questions. You can select pairs of products to view and compare - notice which features you can and cannot see on each product. Then, scroll below the product area and answer the questions. Use the “Arrow” buttons to move between questions. After you have finished all of the questions, use the “Next” button to proceed to the next section.
Instructions: Select a product for each set of radio buttons. The first product will display, with a slider over it. Move the slider to see the second image. To change one or both images, select a different product for each radio button.

Question 1 of 8
Why does the visible image (natural colour RGB) only show data on the right side of the image?
The correct answer is c.
The visible sensor only senses within the visible portion of the spectrum. At night, it does not receive enough radiation return to produce a useful image.
Question 2 of 8
Which of the following RGBs use the visible channel and thus are not available at night? Compare the visible image with the RGBs to figure this out.
The correct answers are b, d.
Since the severe convection and natural colour RGBs are partly made from the visible channel, they are not useful at night.
Question 3 of 8
Which other products let you identify the low clouds/fog on and south of the coasts of Côte d’Ivoire, Ghana, Togo, and Benin? (If you’re unfamiliar with this area, consult a map.) Use the night microphysics RGB to find the area, then compare it to the other products.
The correct answers are b, d.
While the night microphysics RGB is the ideal product to use, if you were without it, you would want to use channels that have helped make up the night microphysics product: infrared imagery or products made predominantly from these channels.
Question 4 of 8
Select the severe convection RGB and find the most active convection. Then compare the RGB to the visible, infrared, and water vapour images. Which channel does the best job of highlighting the most active convection?
The correct answer is c.
Water vapour imagery sees the mid- to upper-troposphere. Typically, the upper levels of the troposphere are relatively dry, so any convection breaking into this layer contains much higher amounts of water vapor and will contrast dramatically with the other features. This makes WV imagery useful for identifying the cold cloud-tops associated with severe convection. In fact, the WV channel (and differences of it) is so useful for detecting severe convection that it’s used in the severe convection RGB.
IR imagery can be just as useful for identifying severe convection when it’s enhanced to highlight the colder cloud tops.
Overall, it’s best to use the severe convection RGB for this type of analysis. But if you need a backup or it’s nighttime, use WV or enhanced IR imagery.
Question 5 of 8
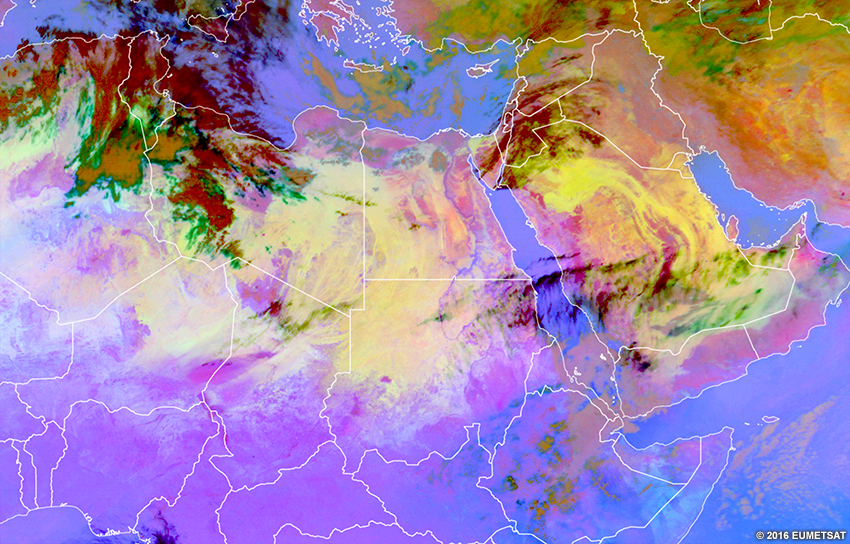
View the dust RGB. Pink tones indicate dust in north-central Niger, northern Chad, Eritrea/Djibouti/Yemen/the Red Sea, and northern Namibia. But two of these areas are not actually dust. Which products can help you verify this? (Compare these products to the dust RGB to figure this out.)
The correct answers are a, f.
If you compare the visible and natural colour products with the dust RGB, you’ll see that the “dust” area in northern Namibia is actually a dry lake bed, and the area in northern Chad is the Tibesti Mountains. These have been highlighted on the image below in bright green.
Both areas show up in dust RGB imagery because of the transition from nocturnal cooling to diurnal heating. As the day goes on, it becomes clearer that they are not dust.
Question 6 of 8
During the day, which features can only be identified with the natural colour RGB? (View this RGB and compare it with the other products to figure this out.)
The correct answers are b, c, e.
Only the natural colour RGB can clearly show grasslands/forests, flooded areas, and ice clouds. You can see this by comparing Lake Victoria, the grasslands/forests north of it, and any of the cyan-coloured clouds on the natural colour RGB with the other imagery.
Question 7 of 8
Using visible imagery over Ethiopia, the cloud mass there is uniform in color and it is difficult to pick out details of the cloud tops and relative cloud heights. This is caused by the sun angle. Now view the products listed below, and identify those that can be used to differentiate the heights of these clouds over Ethiopia.
The correct answers are a, b, c, d, e, and f.
These six products are made from infrared channels (including water vapour, which is in the infrared range) or channel differences (partly or in whole), which provide information about cloud top temperature and thus, cloud height. Even though the night microphysics RGB is calibrated for night-time use, it is still capable of seeing cloud height differences during the daytime hours, just not as easily at low-levels like it can at night.
Question 8 of 8
Which of these four products lets you see the relative cloud levels most distinctly?
The correct answer is a.
In general, the IR channel does a better job of differentiating cloud-top heights, and this is especially useful when low-level clouds are present.
The severe convection RGB can be useful for differentiating cloud-top heights with rapidly changing brightness temperatures, but the severe convection RGB cannot see low-level clouds well.
If the image in question were taken overnight, the infrared and dust RGB would be the only useful products from the list. The night microphysics RGB (not listed above) would be the most useful for comparisons if this image was taken overnight.
Be sure that you have answered all of the questions before proceeding to the next section where we will talk more specifically about how to differentiate cloud heights and thicknesses, dust, and land cover vs. water features.
Feature Identification
In this section, we will look at how atmospheric and surface features appear in the products. Each product displays the features slightly differently, and some cannot show all features clearly or even at all. To effectively analyse the weather using satellite imagery, you will learn to identify the differences found in these products and how to effectively use them for a basic weather analysis. To practice this task, you will answer the questions in the sub-sections below and then complete a follow-up section where all feature identification concepts are incorporated together in an analysis.
Feature Identification » Identifying Atmospheric Features
You will learn to distinguish clouds in two ways:
- By height: high, mid-level, and low
- By thickness: thick or thin
Feature Identification » Identifying Atmospheric Features » Cloud Heights
The easiest way to determine a cloud’s height is to use the visible channel to determine its type based on its texture, shape, and shadows. The cloud type then tells you its height.
|
Type of cloud |
Height |
|---|---|
|
Cirrus, cirrostratus, and cirrocumulus |
High clouds at 6000-13000 m (~20000-43000 ft) |
|
Altocumulus and altostratus |
Mid-level clouds at 2000-6000 m (~6500-20000ft) |
|
Stratocumulus and stratus |
Low-level clouds at 0-2000 m (0- ~6500ft) |
This works for most clouds, but not for those with large vertical extent. Cumuliform clouds can be found from 0-13000 m, depending on their stage of development.
Other factors can complicate cloud identification in visible imagery. For example, as the images below show, sun angle can make the same clouds look dramatically different at different times of day. Knowing where the sun is with relation to the clouds is the only way to combat this effect.
Visible Morning
Visible Mid-day
Visible Evening
There’s another, more quantitative, way to identify cloud heights—using the brightness temperature of clouds in infrared images and RGBs made from those channels. Since IR channels are involved, the technique works during both day and night.
Assuming that tropospheric temperatures decrease with increasing height from the surface, lighter-colored clouds are colder and higher, while darker-colored clouds are warmer and lower. This rule works for both infrared and water vapour imagery. It’s more difficult to define the exact cloud height in RGBs, but we will practice using multiple products together to get an idea if clouds are high or low.

Let’s practice identifying cloud height by using single channel imagery and RGBs and comparing the different products.
Question
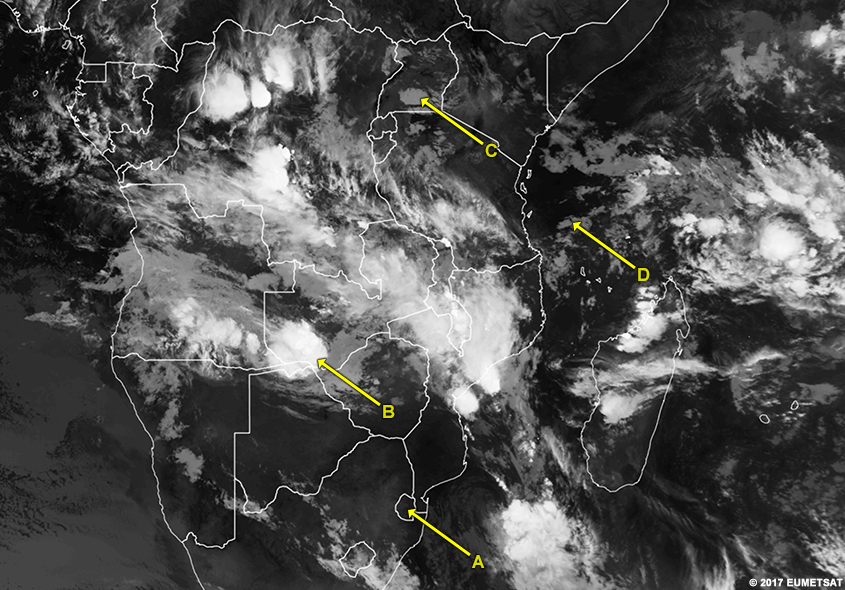

Use the slider to compare the clouds at each location in the four products. Then identify the height of the clouds at each location.
The warm brightness temperatures in the IR and the greenish coloration in the night microphysics RGB tell us that Location A has very low, water clouds. The WV channel and dust RGB cannot detect them since they are too low.
We know that Location B has high clouds since they are bright white in the IR and WV imagery, and red in the night microphysics and dust RGBs.
The clouds at Location C are mid-grey in the IR image and therefore mid-level. They are brownish to yellowish in the night microphysics and dust RGBs but too low to be seen by the WV channel.
The clouds at Location D are mid-grey in the IR imagery, brown in the dust RGB, and pink in the night microphysics RGB. They cannot be seen in the WV image. These clues tell us that the clouds are slightly higher at Location D than Location C but likely still in the middle of the troposphere.
The hardest clouds to differentiate are overlapping clouds - especially where low clouds and/or fog occurs near snow cover. Snow and low clouds often have similar brightness temperatures, especially overnight.
Another difficulty occurs when the upper cloud is very thin. If the upper cloud is more translucent than those below it, the cloud mass brightness temperatures will average out to be warmer and thus at a lower altitude.
Feature Identification » Identifying Atmospheric Features » Cloud Thickness
Visible imagery and the natural colour RGB are the most useful products for determining cloud thickness. The brightness of the clouds generally indicates their thickness. Thicker clouds tend to appear whiter since they reflect more incoming visible light. Very thin clouds can appear translucent in visible imagery and cyan in the natural colour RGB, depending on the time of day.
Visible
Natural Colour RGB
Here’s how to determine the thickness of different cloud types in visible and natural colour products.
|
Type |
Thickness |
Appearance |
|
Cumulonimbus |
Thick |
Bright white in VIS, cyan in natural colour |
|
Cumulus |
Variably thick |
Light grey to white in VIS, lighter cyan in natural colour |
|
Stratus |
Variably thin |
Nearly translucent through mid-grey in VIS, and light cyan to white in natural colour |
|
Cirrus |
Thin |
Translucent in VIS and light cyan in natural colour |
Now it’s your turn to identify cloud thickness.
Question
Question 1 of 2
Drag each label to a cloud of that thickness in the visible image.
The whiter the cloud the thicker it is in the visible imagery. The thickest clouds are likely in the Democratic Republic of Congo. The greyer the cloud, the thinner it is in the visible imagery. The cirrus clouds in southern DR Congo are quite thin, as well as the stratus clouds off the coast of Angola.
Question
Question 2 of 2
Drag each label to a cloud of that thickness in the natural colour RGB.
You can differentiate between thick and thin ice clouds as well as thick and thin water clouds.
The more saturated the cyan, the thicker the ice cloud is in the natural colour RGB. The thickest ice clouds are likely in the Democratic Republic of Congo, while the cirrus clouds in southern DR Congo are quite thin. The greyer and/or whiter-pink the water cloud, the thinner it is in the natural colour RGB. The stratus clouds off the coast of Angola are quite thin.
Use the image below to differentiate the thicknesses of both water (two darker blue tones) and ice (two lighter blue tones) clouds. Within each particle type, there are two tones, one darker and one lighter. The darker tone is for thicker clouds.
This image was made objectively to help you identify the different cloud thicknesses and particle types. This is not an operational product, it is for instruction purposes only.
It’s significantly more difficult, if not impossible, to identify the thickness of all clouds in the other products. For instance, low clouds cannot be seen in the severe convection RGB, so their thickness cannot be determined.
Infrared
In infrared imagery, the thickness of the cloud is best determined by the cloud type, not by the colour of the imagery. Remember colour determines the cloud-top height or temperature in this imagery. In the southeast portion of this image (Central African Republic and Democratic Republic of Congo), you can see thicker convective clouds. In the central portion are cirrus clouds, with thicker clouds in the western portions (Mauritania, Senegal, and Mali). Low-level stratus clouds show up in the northwest portion of the image over the Atlantic Ocean as well as very faintly in the north central portion in Tunisia.
Water Vapour
Similar to the infrared imagery, the thickness of the clouds cannot be determined by the colour of the clouds in the water vapour imagery. It is dependent on the cloud type. Be especially careful with the water vapour imagery as it is hard to determine where the cloud edges are since this is a consistent 1mm of water vapour surface. It is also important to note that low-level clouds are not visible in this imagery.
Severe Convection RGB
In the severe convection RGB, a central area of yellow within a cloud surrounded by red is very thick. Thin cirrus clouds can be light yellow through red and into pink. The less yellow the cloud, the thinner it is.
Dust RGB
In the dust RGB, dust clouds are magenta. The more transparent the magenta shade, the thinner the dust cloud.
Night Microphysics RGB
You can determine the thickness of stratus and convective clouds in the night microphysics RGB. The greener or lighter blue-grey the stratus clouds, the thicker they are. In the image below, the low clouds over Angola are thicker to the east, and thinner to the west where the purple is showing through the blue-grey.
Convective clouds are red. The more saturated the red, the thicker they are.
Cirrus clouds are thin and appear black in this product. But it's hard to determine their exact thickness due to the lack of texture in the black colouration.
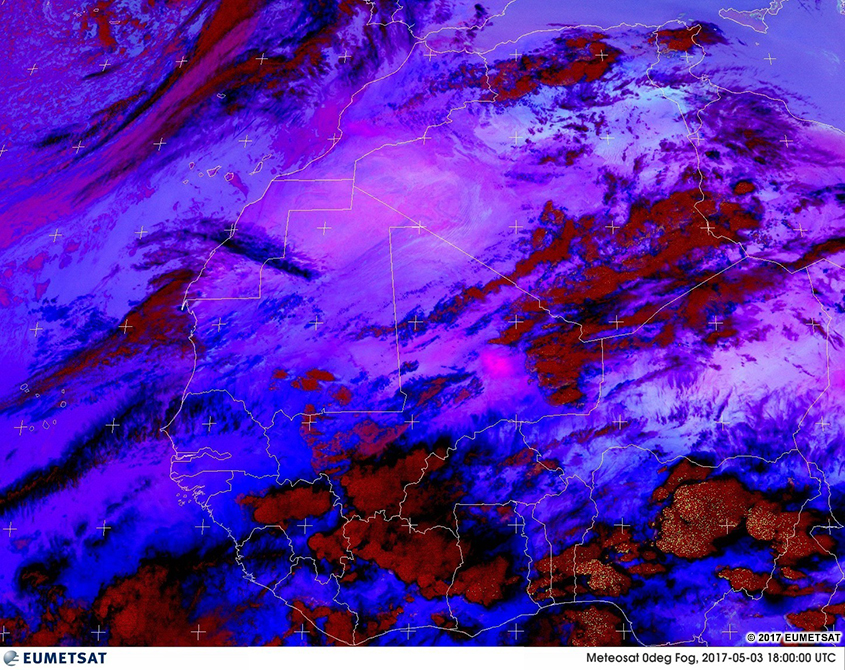
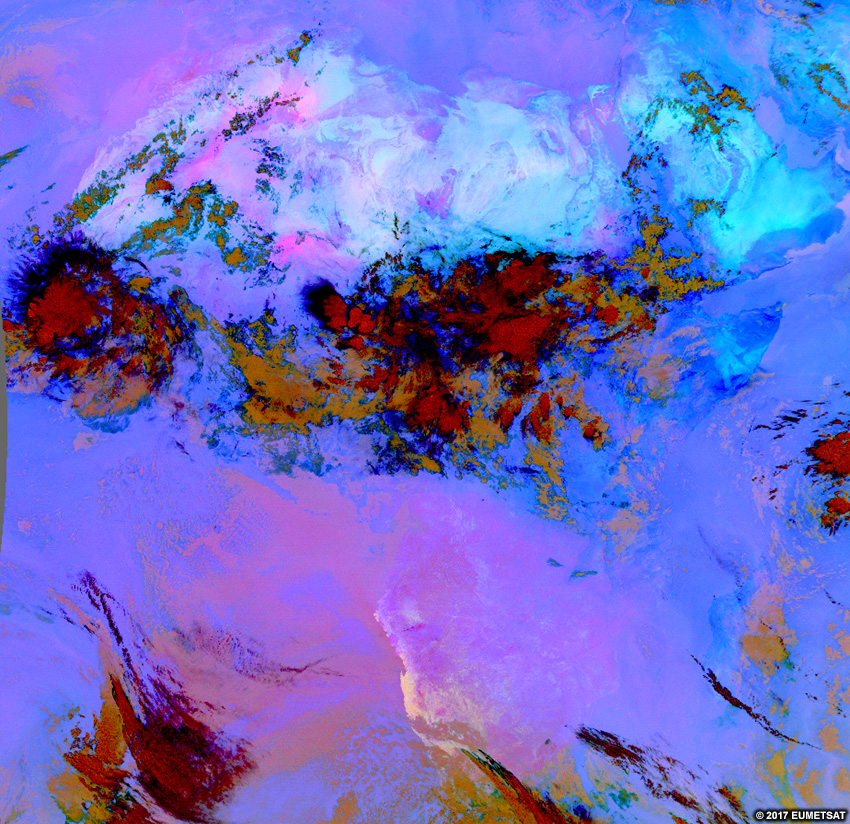
Feature Identification » Identifying Atmospheric Features » Dust Cloud Height/Thickness
Low-level atmospheric dust is often more concerning than higher-level tropospheric dust because it can result in health and/or economic problems. The height of dust clouds can only be determined reliably at night with the dust RGB product.
The dust RGB image above has one large area of dust, with differing heights throughout the swath. The more blue the dust area, the lower the altitude of the cloud. The more red the dust area, the higher the altitude.
Any given colour of dust in the dust RGB can have varying degrees of saturated colour. The more saturated the colour the thicker the dust is. If the bright pink is highly saturated, then it is thicker. So, the dust in southern Libya is thicker than the dust in northern Mali. If the low-level, purple-blue dust is a more saturated colour it is also thicker. The more diffuse the colour the thinner the dust cloud is overall. Therefore, the low-level dust in southeast Mauritania is thicker than the low-level dust in central Chad.
Feature Identification » Identifying Surface Features
In this section, we’ll look at how land features appear in the different products. But first, see if you can answer the following questions based on what you’ve learned about the channels and RGBs so far.
Question 1 of 3
Which products are useful for looking at vegetation in daytime?
The correct answers are a, b, d.
Land features, such as deserts, vegetation, and mountains, show up clearly on visible and infrared imagery and the RGB products made from them, like the natural colour RGB. Atmospheric moisture typically prevents water vapour channels from detecting the ground surface.
Question 2 of 3
Which products are used if you want to find deserts at night?
The correct answers are b, e.
Since the visible channel is not useful at night, the natural colour RGB cannot be used. That leaves IR imagery and night microphysics RGB, which is made from IR channels. Water vapour imagery is generally not useful for seeing surface features at any time of day.
Question 3 of 3
Which product is best for distinguishing snow and low clouds?
The correct answer is d.
Features look realistic in the natural colour RGB except for snow, which is cyan helping you distinguish it from clouds.
Let’s look more in depth at how different land features appear in the various products.
Feature Identification » Identifying Surface Features » Deserts
To identify deserts in visible imagery, look for lightly coloured surface areas.
Desert surfaces are sensitive to the diurnal heating cycle, so you can identify them in infrared imagery by animating the imagery and looking for areas with rapid temperature changes after sunrise and sunset.
Visible

Infrared
Here’s how desert appears in the RGBs.
- Natural Colour: Typically light brown to tan
- Dust: Light blue during the day and shades of pale yellow at night
- Night Microphysics: Magenta to lighter pink at night
Natural Colour RGB
Dust RGB (Day)
Dust RGB (Night)
Night Microphysics
Feature Identification » Identifying Surface Features » Vegetation
Vegetated surfaces are darker than deserts in visible imagery. In infrared imagery, the temperature of deserts varies more with diurnal heating than vegetated areas. So vegetated areas are cooler in daytime and warmer at night than deserts. In the natural colour RGB, vegetated areas are green.
Visible
Infrared (Day)

Infrared (Night)
Natural colour RGB
Feature Identification » Identifying Surface Features » Water Bodies
Bodies of water like oceans, large lakes, and even wide rivers are easy to see on most satellite products. The main exception is WV imagery, which cannot see to the surface.
Water temperatures do not change dramatically during the diurnal heating cycle like land surface temperatures do. Therefore, water is typically cooler than the surrounding land surfaces during daytime and has a whiter appearance in the infrared images below.
At night, when land surfaces cool rapidly, their temperatures may go below that of water. This means that water will have a warmer brightness temperature and appear darker than the surrounding land.
Occasionally, water and land temperatures are so similar that water bodies are completely camouflaged. That’s the case with Lake Malawi in the image below, which we can barely detect. However, in the previous image, you can find Lake Malawi quite readily on the border between Malawi, Tanzania, and Mozambique.
Let’s take a look at how water bodies appear in RGBs compared to VIS and IR imagery. In the slider interactions below, the IR image always displays first. Select the other images to compare them to it.
Here are images from mid-day.

Now look at midnight scenes.
Finally, let’s look at the 0600Z imagery. At this time, the sun has recently risen which rapidly changes the colors in some of the imagery. In some cases the water bodies remain warmer/colder than the surroundings, while in others, the land and water become nearly indistinguishable.
Question
For each product listed below, indicate the colour you would expect water to be during each time of the day. (Use the above sliders to help you answer these questions)
During the day:
If you haven’t already done so, verify your answers with the imagery above. Use the 12Z for the daytime questions and the 00Z for the nighttime questions.
Feature Identification » Identifying Surface Features » Snow
Although snow on the ground is uncommon in low elevation Africa, it can still be challenging to distinguish it from low clouds. You can do several things to differentiate snow on the ground from low clouds:
- Animate the imagery, looking for how the features change over time. Snow cover often lasts for longer periods without much change in shape, while clouds (as seen by their shape, size, and texture) tend to change more rapidly.
- Check the Natural Colour RGB in which snow cover and water clouds are different colours—snow is cyan while clouds are white.
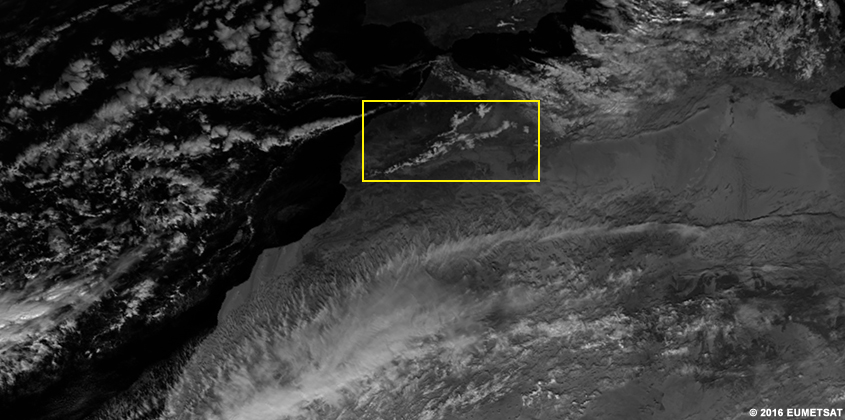
In the visible imagery below, there is snow in Lesotho, but it is impossible to detect without further investigation. Compare the visible to the natural colour RGB to find it below.

In mountainous regions, like the Atlas Mountains outlined in yellow, snow often has a dendritic (branched) pattern like that shown below. Clouds rarely look like this—only when they’re heavily influenced by topographic features.
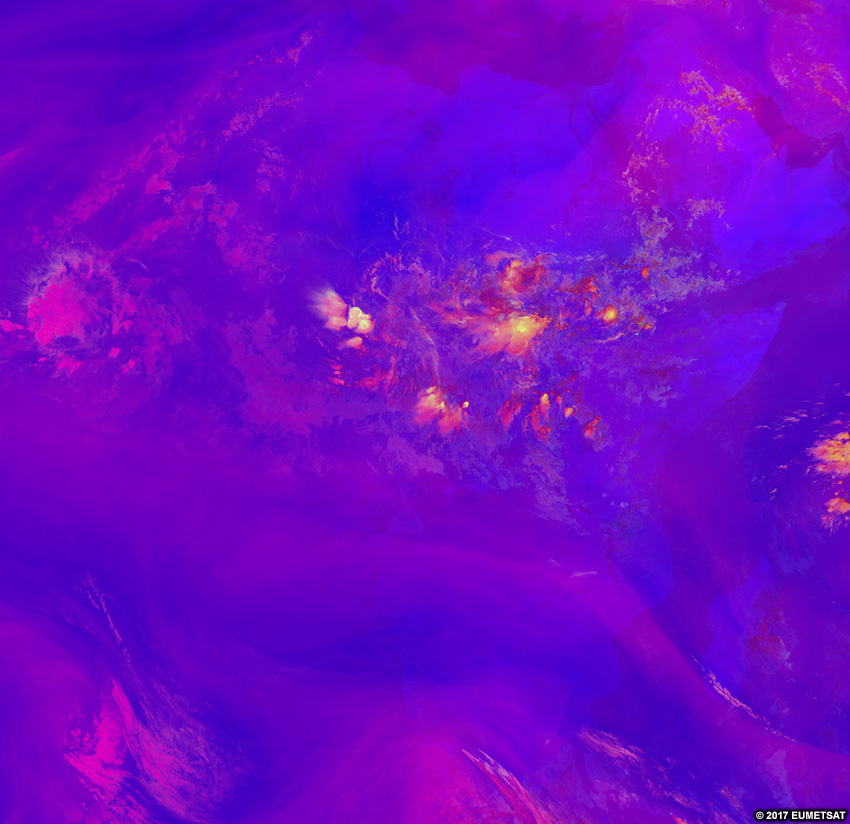
Exercise 1
This section lets you integrate the skills that you’ve learned. We’ll present different products and ask you to identify them and the features displayed.
Question 1 of 3
What product is this?
The correct answer is e.
The yellow cloud tops and overall blue and pink tones indicate that this is a severe convection RGB.
Exercise 2
Question 1 of 2
If you are looking for atmospheric dust and don’t have access to the Dust RGB, which product(s) could be used instead? Check all that apply.
The correct answers are a, b, f.
During daytime, these products can show some indication of dust. But none can do so reliably at night except the dust RGB.
Exercise 3
The questions below are based on the following products. View and compare them by selecting a different image for each radio button. Note that the imagery and products are no longer labeled for you. This means you will have to differentiate the imagery from each other before moving through the exercise for most effective learning. Write down which option number is which product for reference along the way.


Question 1 of 8
What time of day are the images from?
The correct answer is a.
The small amount of dark in the bottom left (western) corner of the visible and natural colour products tells us that it’s dawn.
Question 2 of 8
What month do you think it is in these images?
The correct answer is c.
Based on the slope of the terminator, the sun is north of the equator. This means the Northern Hemisphere is in the summer month of August.
Question 3 of 8
Since these products are from a summer morning, the low clouds in the night microphysics RGB should be:
The correct answer is b.
During the warm season and warm weather regimes, low clouds are light blue-grey. They are only light green during the cold season and cold weather regimes.
Question 4 of 8
View the night microphysics RGB and look at the low clouds. Why are they both light blue and light green?
The correct answers are b, c.
The height of the clouds and their latitudinal differences make them look different.
The cloud tops are warmer in the southern portion of the image so they are likely lower. However, since the thickness of the troposphere is markedly different in the northern and southern portions of the image, it is impossible to truly compare the cloud heights without more information, say, from soundings.
The closer to the equator you get, the less clouds look like “winter” low clouds on RGB imagery unless there is a climatological anomaly in the area.
Question 5 of 8
There are generally two heights of clouds off the western coast of Africa from Liberia to Senegal. Which product could you use to identify their cloud-top height differences?
The correct answers are b, c, d, e, and f.
The most effective products to use are the infrared channels and the night microphysics product. The water vapour, dust RGB, and severe convection RGB can be used for this but they shouldn’t be depended on in all situations to differentiate the cloud heights, especially at night with low-level clouds. The other imagery are not useful at night, or cannot see low enough in the atmosphere to see these clouds.
Question 6 of 8
Identify the two different height clouds in the following drag and drop interaction.
Use the above radio buttons to switch between imagery options, then drag the two different heights onto the appropriate clouds.
The cloud heights can be differentiated by cloud type or by colour in the different imagery. In the IR imagery, the lower clouds are smoother in texture. In the night microphysics RGB, the lower clouds have a center that contains sparse yellow-green speckling. In the dust RGB, the lower clouds are yellow with green edging. All the rest of the clouds are higher in that vicinity.
For an objective analysis of the entire infrared image, use the below image where red areas are low-level, green areas are mid-level, and blue areas are high-level clouds. Some clouds were not captured as they were too small for the objective analysis to pick out.
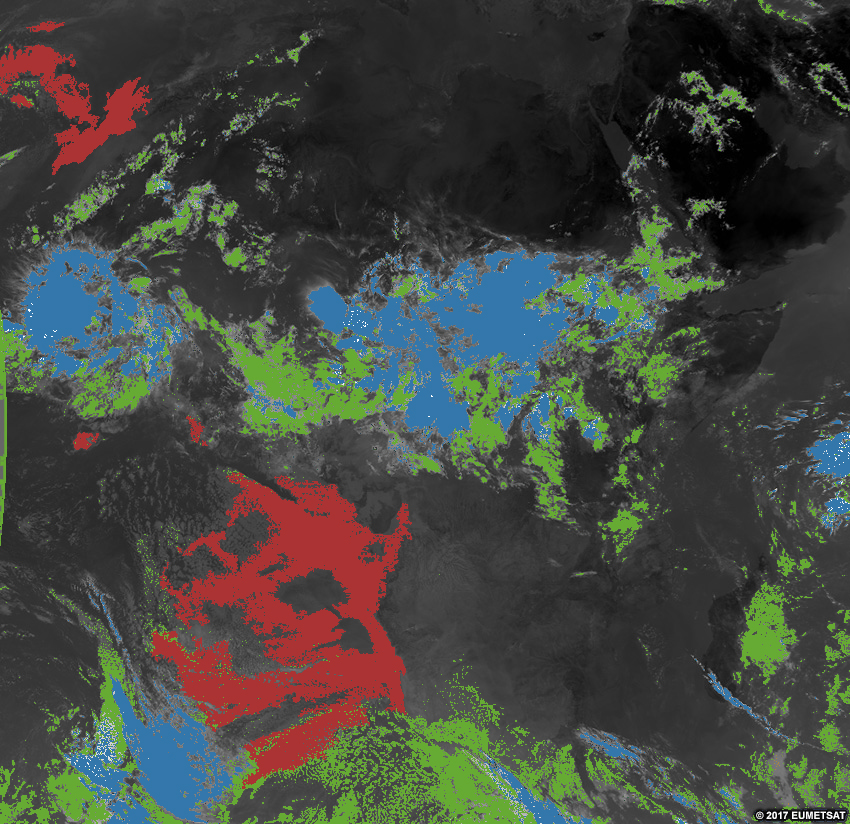
This is not an operational product as it is for instructional purposes only.
Question 7 of 8
Identify the areas that are land and ocean by dragging land and ocean markers to various locations that you can identify with the seven available images. Use the radio buttons below the imagery to switch the imagery type for ease of finding the surface features.

Use the above radio buttons to switch between imagery options, then drag the “land” and “ocean” labels to the correct locations on the image.
Option 6 makes it easier to define where land and ocean are. Ocean is dark blue or black, and land varies from earth tones through greens. In the areas where the natural colour imagery is dark, you can use other channels and products to help you identify the difference. The night microphysics RGB can be useful to help you differentiate clouds from land from ocean.
The following night microphysics RGB image shows an objectively-analyzed land and ocean mask. The land areas are coloured brown and the ocean areas are coloured blue. Areas where you can see the night microphysics RGB are areas where it iss too cloudy to differentiate the surface features.
Question 8 of 8
Arrange the list of products to the order of the options in the comparison slider above. For instance, if you believe "option 1" in the comparison slider to be the night microphysics RGB, move the "night microphysics RGB" answer choice to be the first in the following list.
- Water vapour
- Night microphysics RGB
- Severe convection RGB
- Dust RGB
- Visible
- Natural Colour
- Infrared
Summary
The EUMETSAT Meteosat Second Generation (MSG) satellite provides many channels of data. In this lesson, we explored the most commonly used channels and products: Visible, Infrared (IR), Water Vapour, Severe Convection RGB, Dust RGB, Night Microphysics RGB, and Natural Colour RGB.
Each product is best-suited to specific forecasting applications:
- Visible imagery has the highest resolution and can help you identify cloud types at all levels and surface features. Visible satellite imagery is not useful at night, however.
- Infrared imagery shows not only cloud types, but also gives quantitative information about the height of cloud tops. Infrared imagery does not provide as much horizontal detail as visible imagery due to its lower resolution.
- Water Vapour imagery provides considerable information on moisture in the mid-levels of the troposphere. It cannot detect features at or very near the surface, however.
- The Severe Convection RGB detects rapidly growing thunderstorms that could be considered severe at the surface. At night the product can lose some ability to differentiated severe from general convection.
- Dust RGB detects dust clouds at any level during the day or night, including information about dust cloud heights and thicknesses.
- Night Microphysics RGB enhances the ability to detect low clouds and fog at night, when it is especially hard to track. It cannot be used in the same manner during the day.
- Natural Colour RGB is a good companion or substitute for visible imagery, as its colouring adds more detail tosome features. It colours ice clouds and snow cyan which helps define some of the microphysical character of clouds. Since this is highly dependent on visible channels, this product cannot be used at night.
There are many comparisons to be made between the products that enhance monitoring and forecasting skills. The satellite product comparisons section walked you through some of these simple comparisons to improve your skills in atmospheric and surface feature identification.
You have practiced using different product information to assess cloud height and thickness, including dust clouds.
Lastly, you have identified product type when given the images without their titles. This practice allowed you to quickly assess different features and find the appropriate products for use in many different situations.
You should now assess your knowledge of the learning objectives for this lesson by completing the quiz. After the quiz, to receive your certificate of completion, you should complete the survey. We hope you have enjoyed learning about using satellite products over Africa using the MSG satellite.
Contributors
COMET Sponsors
MetEd and the COMET® Program are a part of the University Corporation for Atmospheric Research's (UCAR's) Community Programs (UCP) and are sponsored by NOAA's National Weather Service (NWS), with additional funding by:
- Bureau of Meteorology of Australia (BoM)
- Bureau of Reclamation, United States Department of the Interior
- European Organisation for the Exploitation of Meteorological Satellites (EUMETSAT)
- Meteorological Service of Canada (MSC)
- NOAA's National Environmental Satellite, Data and Information Service (NESDIS)
- NOAA's National Geodetic Survey (NGS)
- National Science Foundation (NSF)
- Naval Meteorology and Oceanography Command (NMOC)
- U.S. Army Corps of Engineers (USACE)
To learn more about us, please visit the COMET website.
Project Contributors
Program Managers
- Bruce Muller
- Vesa Nietosvaara - EUMETSAT
Project Leads
- Bryan Guarente
- Marianne Weingroff
Instructional Design
- Bryan Guarente
- Marianne Weingroff
Science Advisors
- Vesa Nietosvaara - EUMETSAT
- Mark Higgins - EUMETSAT
- Ian Mills - EUMETSAT
- Andrea Smith - COMET
Graphics/Animations
- Sylvia Quesada - COMET
- Steve Deyo - COMET
- Lindsay Johnson - COMET
Multimedia Authoring/Interface Design
- Gary Pacheco - COMET
COMET Staff, December 2017
Director's Office
- Dr. Elizabeth Mulvihill Page, Director
- Tim Alberta, Assistant Director Operations and IT
- Paul Kucera, Assistant Director International Programs
Business Administration
- Lorrie Alberta, Administrator
- Tara Torres, Program Coordinator
IT Services
- Bob Bubon, Systems Administrator
- Joshua Hepp, Student Assistant
- Joey Rener, Software Engineer
- Malte Winkler, Software Engineer
Instructional Services
- Dr. Alan Bol, Scientist/Instructional Designer
- Tsvetomir Ross-Lazarov, Instructional Designer
International Programs
- Rosario Alfaro Ocampo, Translator/Meteorologist
- Bruce Muller, Project Manager
- David Russi, Translations Coordinator
- Martin Steinson, Project Manager
Production and Media Services
- Steve Deyo, Graphic and 3D Designer
- Dolores Kiessling, Software Engineer
- Gary Pacheco, Web Designer and Developer
- Sylvia Quesada, Production Assistant
Science Group
- Dr. William Bua, Meteorologist
- Patrick Dills, Meteorologist
- Bryan Guarente, Instructional Designer/Meteorologist
- Matthew Kelsch, Hydrometeorologist
- Erin Regan, Student Assistant
- Andrea Smith, Meteorologist
- Amy Stevermer, Meteorologist
- Vanessa Vincente, Meteorologist