Satellite Products » Water Vapour Channel
Description
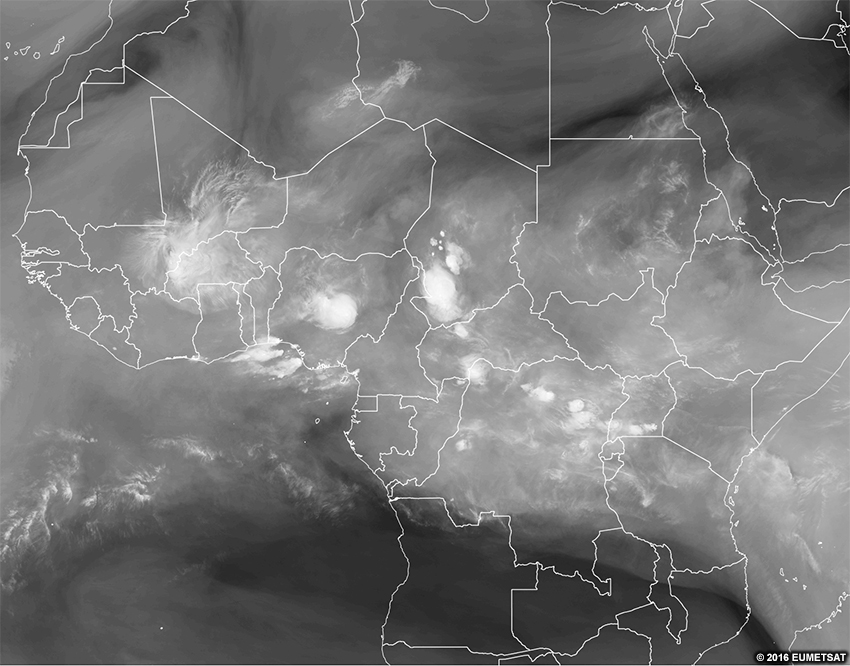
The water vapour (WV) channel measures radiation from a set amount of water vapour in the upper-levels of the troposphere in grey shades. Each pixel shows the same cumulative amount of water vapour detected from the top of the atmosphere downward. The colouration comes from the temperature at which the channel reaches that threshold amount of water vapour radiation as seen in the animation below.
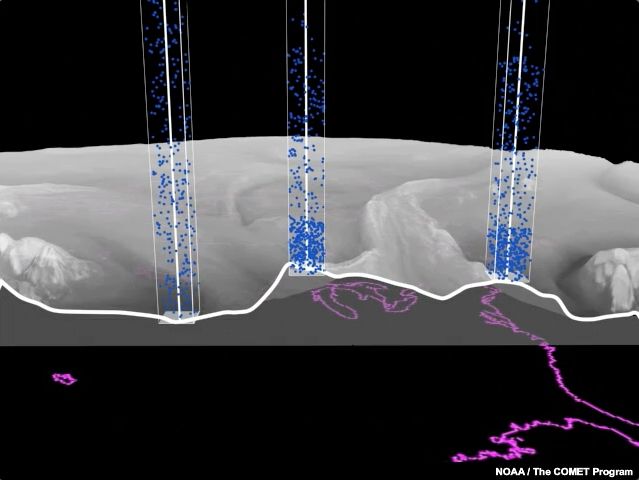
In this animation, the column on the left is longest, with the molecules loosely distributed over a deeper area. The molecules in the other columns are more densely packed and the bases of those columns are higher. The sensor measures the brightness temperature of the water vapour at the bottom of the columns.
Effective Use
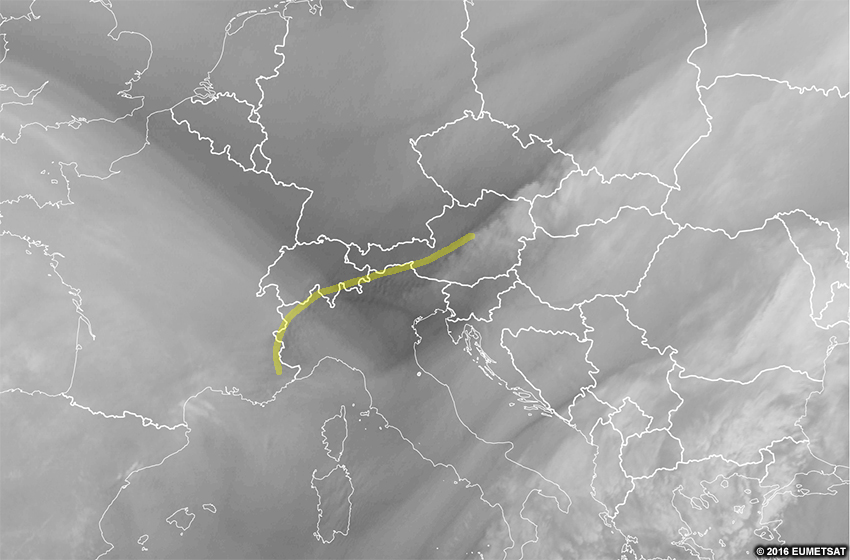
The water vapour channel essentially displays the height and distribution of water vapour features. It is particularly well-suited for showing the three-dimensionality of the atmosphere and the continuous layer of water vapour in the mid- and high-latitudes.
The WV channel is less useful for forecasting in the tropics since surface features and small variations drive more of the weather processes. However, WV channel can be good for monitoring developing thunderstorms, mesoscale downdrafts, and upper-level dynamics in the tropics.
WV channels cannot sense land or ocean surfaces since there’s too much water vapour between the sensor and the ground, causing the sensor to always detect a value before reaching the surface.
Here is the real-time imagery from the MSG water vapour channel. Explore the imagery by double-clicking (pinching on mobile devices) to zoom and dragging the image to move view. Below the real-time image, you will find a list of questions to ask yourself for exploration and self-evaluation purposes.
* Live data only available for interactive lesson.
Using the real-time imagery, answer the following questions.
- Are features visible at this time of day on the imagery?
- Would these features be visible at other times of day?
- What range of colours are clouds?
- Do those colours represent what your eye sees?
- Do those colours represent the temperature of the object?
- Do those colours represent some other process?
- What range of colours are surface features?
- Do those colours represent what your eye sees?
- Do those colours represent the temperature of the object?
- Do those colours represent some other process?
- If you are located within the satellite viewing area of MSG, look outside for clouds and surface features. See if those features show up on the imagery by zooming in to your location. What colours do you expect those features to be in this imagery? What colours are those features in the imagery?