Satellite Products » Infrared Channel
Description
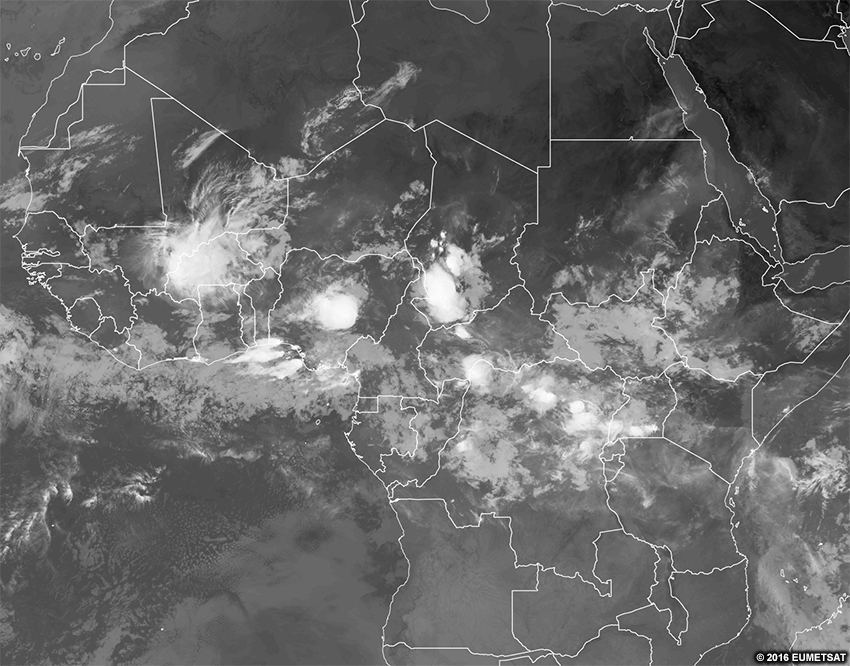
The long-wave infrared (IR) channel behaves like a camera that sees the temperature of objects in grey shades. Warmer objects appear dark gray while colder objects display as light gray through white.
Land surface temperatures change rapidly in response to diurnal heating - especially after sunrise. Temperature-dependent IR imagery helps us differentiate land surfaces from ocean surfaces, whose temperature changes very slowly, and from clouds, which typically do not respond to diurnal changes during their lifetimes. An exception is cumuliform clouds, whose cloud-top temperature can change rapidly throughout the day due to diurnally-forced convective processes.
Effective Use
Brightness temperatures in IR imagery make it relatively easy to differentiate land, ocean, and clouds. In daytime, land surfaces are usually warmer, and thus darker. These areas contrast with the cooler and lighter ocean surfaces and clouds. When land surfaces cool down at night, it can become difficult to differentiate them from oceans and clouds.
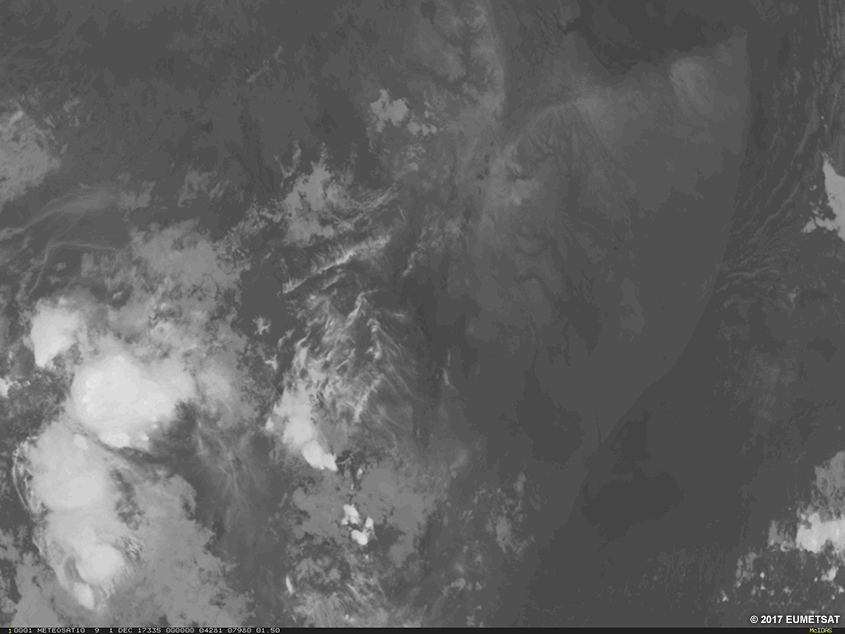
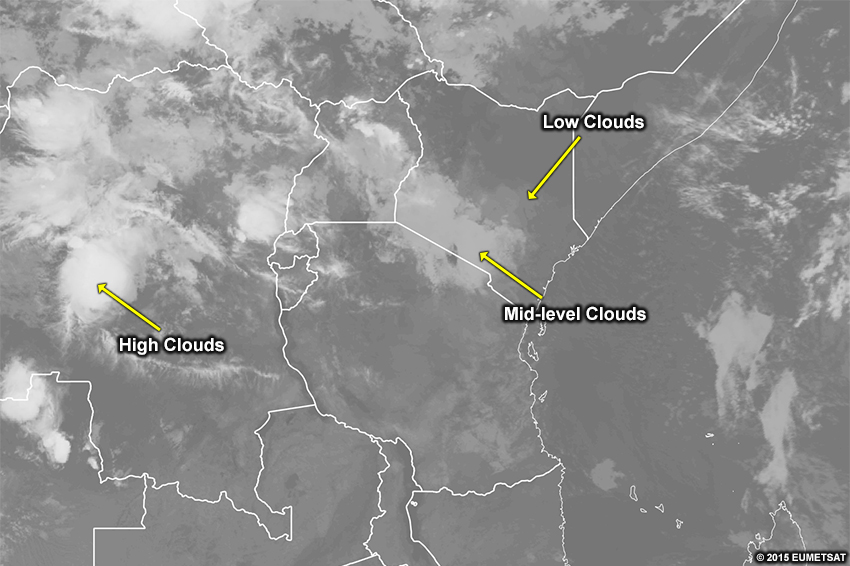
The temperature of the cloud tops can indicate their height since the atmospheric temperature typically decreases strongly with height through the troposphere. Colder (lighter coloured) cloud-top temperatures indicate higher clouds while warmer (darker coloured) cloud-top temperatures indicate lower cloud tops.
The most challenging features to identify in IR imagery are low clouds over land that is cold or snow-covered. Therefore, it’s best to combine IR imagery with other imagery, such as the visible channel, the night microphysics RGB, or the natural colour RGB.
Here is the real-time imagery from the MSG long-wave infrared channel. Explore the imagery by double-clicking (pinching on mobile devices) to zoom and dragging the image to move view. Below the real-time image, you will find a list of questions to ask yourself for exploration and self-evaluation purposes.
* Live data only available for interactive lesson.
Using the real-time imagery, answer the following questions.
- Are features visible at this time of day on the imagery?
- Would these features be visible at other times of day?
- What range of colours are clouds?
- Do those colours represent what your eye sees?
- Do those colours represent the temperature of the object?
- Do those colours represent some other process?
- What range of colours are surface features?
- Do those colours represent what your eye sees?
- Do those colours represent the temperature of the object?
- Do those colours represent some other process?
- If you are located within the satellite viewing area of MSG, look outside for clouds and surface features. See if those features show up on the imagery by zooming in to your location. What colours do you expect those features to be in this imagery? What colours are those features in the imagery?