
Select a Section:
III. Types of Dust Storms
Table of Contents
Synoptically Forced Dust Storms
Synoptically Forced Dust Storms » Introduction
Dust storms are typically classified by the broad meteorological conditions that create them.
In this section, we’ll examine large-scale, synoptically forced dust outbreaks that occur in the arid and semi-arid areas of the world. These are caused by frontal winds that primarily occur in winter and spring, and non-frontal persistent trade winds that occur in summer. Synoptically forced dust outbreaks are rare in autumn when the trade winds are weaker and cold air outbreaks from higher latitudes do not reach the deserts of northern Africa and the Middle East.
Mesoscale influences on dust, such as thunderstorm outflow, sea breeze effects, and terrain-altered winds will be addressed in the next section.
Synoptically Forced Dust Storms » Prefrontal Dust Events
Synoptically Forced Dust Storms » Prefrontal Dust Events » Introduction
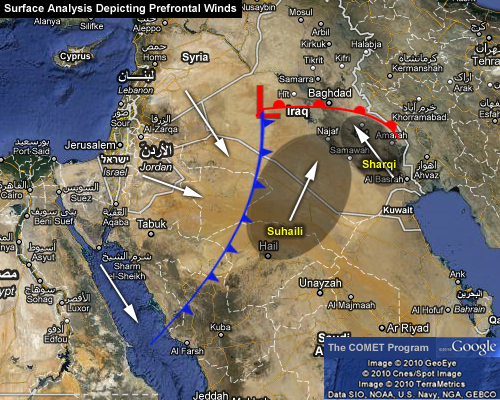
Prefrontal dust storms occur when a band of winds generated ahead of low-pressure areas moves across a dust source region such as the Sahara.
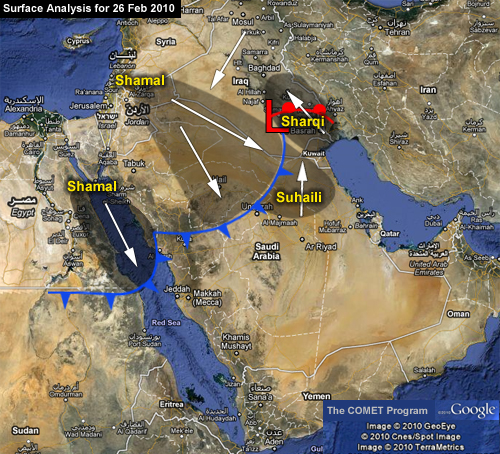
This chart depicts prefrontal winds as a low-pressure area migrates into Iraq. The southeasterly or Sharqi winds that blow northward up the Tigris/Euphrates River basin are intensified as low-level flow is funneled between the Zagros Mountains to the east and the high pressure area to the west. Towards the west, southwesterly or Suhaili winds pick up dust from western Arabia and move it northeastward in advance of the cold front.
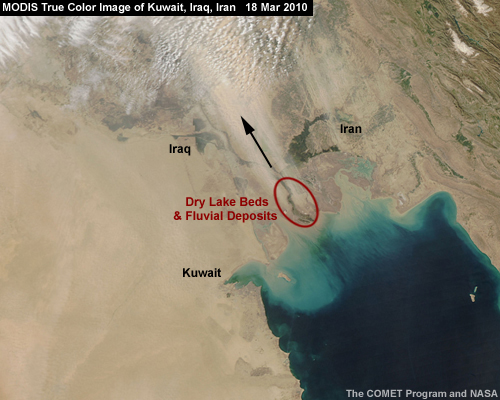
This MODIS true colour image shows Sharqi prefrontal dust plumes emanating from dry lake beds and fluvial deposits in southeastern Iraq. Fluvial deposits are associated with dry rivers and streams.
The interaction of the polar and subtropical jet streams often strengthens the front, which induces stronger prefrontal winds ahead of the upper-level trough. In addition, the overlapping of these jet cores and resulting coupling of secondary circulations between the jets can increase mid-level upward vertical velocities and promote further lifting of dust.
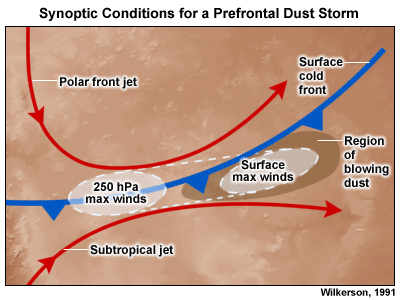
Under these conditions, westerly winds mobilize dust and sand across Jordan, Syria, and northwestern Saudi Arabia, transporting it east and northeastward across the Arabian Peninsula, Iraq, and the Persian Gulf countries.
Synoptically Forced Dust Storms » Prefrontal Dust Events » Prefrontal Example: North Africa
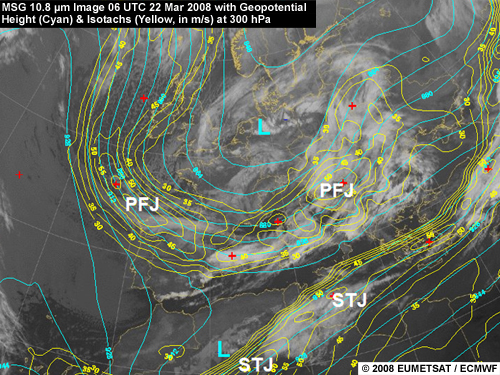
A prefrontal dust outbreak occurred on 22 March 2008 over Algeria, Tunisia, and Libya. The synoptic chart for 06 UTC shows a deep, long-wave trough over Central Europe with the related 300-hPa polar frontal jet (PFJ) crossing the northern parts of the Mediterranean Sea from the Gulf of Biscay to Croatia. The subtropical jet (STJ) is close to and just south of the PFJ over Algeria and Tunisia and ahead of a short-wave trough over Algeria, which favors stronger surface winds and dust production.
The RGB on the left shows that prefrontal southwesterly winds ahead of the upper-level short-wave trough over Algeria started strengthening around 10 UTC, lifting large amounts of dust into the air around Illizi in eastern Algeria. The prefrontal winds responsible for the blowing dust are referred to as the Scirocco in Tunisia, Ghibli in Libya, and Khamsin in Egypt. They can have speeds of up to 100 km/h and are most common during autumn and spring.
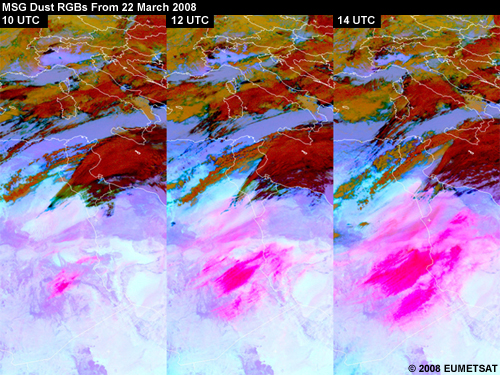
What happens over the next few hours? Select the statement(s) that apply to the images in the middle and on the right.
The correct answers are B and C.
Prefrontal winds continue strengthening during the afternoon hours and dust from different source regions in Algeria and Libya enlarges the dust cloud. The dust is transported upwards and to the northeast in a type of conveyor belt, probably to the level of the subtropical jet.
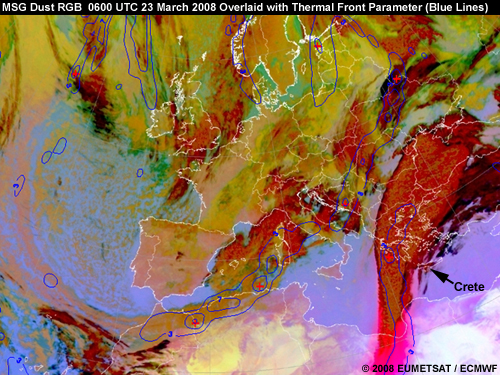
This image from the next day shows that the dust cloud gets stretched along the cold front as the shortwave trough moves eastward over Libya. The cold front is marked by the blue lines, which represent the thermal front parameter. (TFP is used for frontal analysis to help indicate the leading edge of cold and warm frontal boundaries.) At this stage, large amounts of dust get entrained into a cloud system that stretches from just west of Crete northward to the Black Sea.
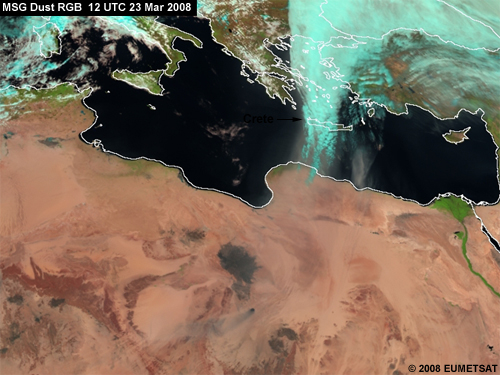
This MSG natural colour product shows that six hours later, at 12 UTC, the cold front and embedded dust cloud have reached the island of Crete. Since the dust cloud is optically thin, we can just make out some thin (brownish) clouds south of Crete but the island itself is covered with ice cloud (cyan).
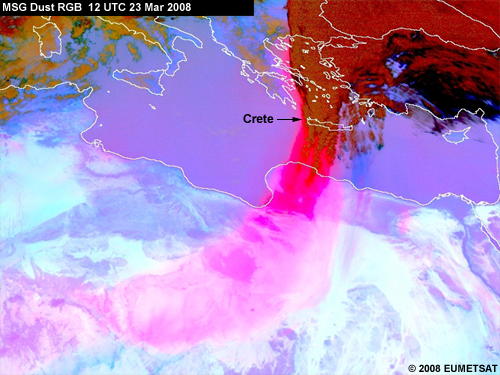
The dust cloud stands out much more vividly in magenta in the dust RGB. By now, it should be obvious why the product is so useful for detecting and monitoring dust.
Synoptically Forced Dust Storms » Prefrontal Dust Events » Prefrontal Example: Middle East
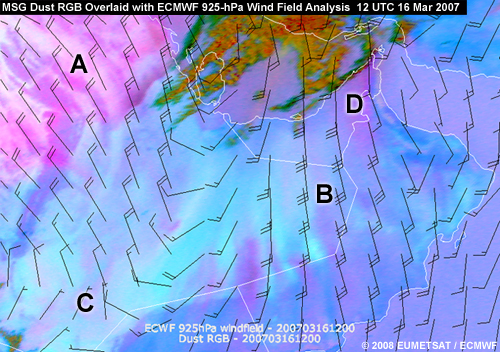
This MSG Dust RGB from 16 March 2007 is overlaid with 925-hPa winds and shows prefrontal (as well as postfrontal) dust. Which letters point out areas with prefrontal dust? (Select all that apply.)
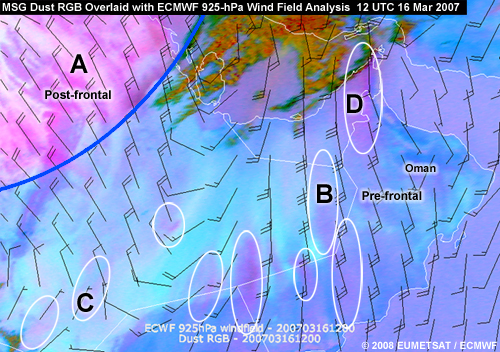
The correct answers are B and D.
The advection of prefrontal dust indicated by the dust streamers in darkish magenta is well aligned with the 925-hPa wind field in the southern parts of Oman. Behind the cold front, in the upper left part of the image, strong Shamal (northwesterly) winds are driving dust clouds (in brighter magenta) toward Yemen and Oman.
Later during the day, the prefrontal and postfrontal dust clouds actually converged over southern Saudi Arabia and the United Arab Emirates.
Synoptically Forced Dust Storms » Prefrontal Dust Events » Cloud Microphysics
We’ve seen how satellites can detect and trace dust clouds in cloud-free situations. They can also detect the presence of dust particles inside ice clouds, albeit indirectly. Since this mainly occurs with prefrontal dust storms, we’ll discuss it in this section.
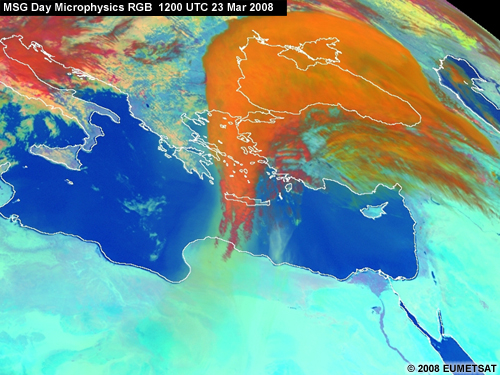
Dust aerosols can have a large impact on cloud microphysics such as cloud phase and cloud particle size. In general, clouds that have ingested dust glaciate more quickly, forming a large number of very small ice particles. These have a higher reflectance than large ice particles in the “microphysical” channels (near-IR 1.6 and IR 3.9 micrometer) and appear as bright orange in the day microphysics RGB.
In this example, the high-level cirrus shield forming in advance of a strong shortwave trough over the Mediterranean and Black Seas is bright orange due to the high reflectance of the cold ice cloud in the IR 3.9 µm channel. This indicates that the cloud has ingested a lot of dust particles, resulting in the formation of small ice particles.
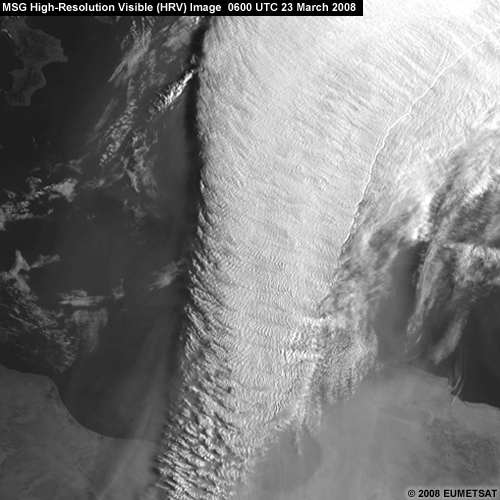
Aerosol concentrations strongly affect the structure of stratocumulus cloud fields over the ocean through the formation of open and closed Bénard cells. Likewise, dust aerosols can also impact the structure of clouds as observed by satellite. When a synoptic-scale conveyor belt transports dust particles to high levels in the troposphere, the cirrus shield often assumes a fine-scale cellular/granular texture similar to that observed in closed Bénard cells over the oceans. This can best be seen in early morning or late afternoon visible images, when the three-dimensional structure of the cloud tops is clearly visible due to shadows. It can also be seen in infrared images.
Synoptically Forced Dust Storms » Postfrontal Dust Events
Synoptically Forced Dust Storms » Postfrontal Dust Events » Postfrontal Dust Storms
As we have seen, widespread dust can also occur behind a cold front. Especially in winter, the passage of a cold front leads to strong northwesterly winds in the Northern Hemisphere and strong southwesterly winds in the Southern Hemisphere. In Southwest Asia, the resulting dust storm is referred to as a “Shamal” from the Arabic word for north. Shamals produce the most widespread hazardous weather in the Middle East.
This dust RGB animation shows a cold front-generated sandstorm stretching to the west of the Persian Gulf. The front has passed and lies to the south of the dust front. Strong northwesterly postfrontal flow is moving dust to the south and east.
Winter Shamals generally last for either 24 to 36 hours or three to five days.
The shorter-period winter Shamal typically begins with passage of the front. When the associated upper-level trough or rapidly moving short waves move eastward, winds diminish after 24 to 36 hours. Such cases are relatively common, occurring two to three times a month. Sustained winds typically reach 30 knots, with stronger gusts to 40 knots.
The longer-term (three- to five-day) winter Shamal generally occurs one to three times a winter and produces the strongest winds and highest seas in the Persian Gulf. Over the exposed Gulf waters, sustained wind speeds have reached 50 knots and produced 3- to 4-meter (10- to 13-foot) seas. This type of Shamal arises either from the temporary stagnation of a 500-hPa shortwave over or just east of the Strait of Hormuz, or the establishment of a mean longwave trough over the same area. Persistent dust and sand storms occur throughout the life spans of both types of Shamals.
Before the winter rains, dry conditions enhance dust during the first few cold frontal passages of the season. In fact, widespread dust often occurs with the first cold frontal passage of the season. Visibility is often restricted to less than three nautical miles. Subsequent fronts bring precipitation that binds soil particles together. In these circumstances, winds above 25 knots are often needed to raise dust.
Summer Shamals will be discussed in the "Dust Events Caused by Large-Scale Trade Winds" section.
Synoptically Forced Dust Storms » Postfrontal Dust Events » Winter Frontal Example
Here’s a typical synoptic-scale surface chart for winter frontal events that occur in late winter (in this case February 2010) in the Middle East. Strong pressure gradients develop behind a moderate to strong cold front due to upper-level subsidence and rapidly building surface high pressure over northwestern Saudi Arabia and Iraq. The strong northwesterly low-level winds are quickly reinforced by west-to-northwesterly upper-level winds behind the mid-level trough. Shamal winds and postfrontal blowing dust develop behind the cold front over southern Iraq and northeastern Saudi Arabia. Farther to the west, another area of postfrontal blowing dust forms to the north of the surface trough and shearline over southern Egypt.
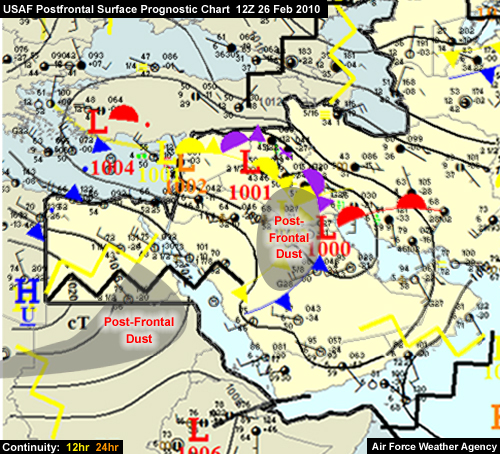
The surface analysis shows an area of low pressure centered over Iraq and Kuwait, with a strong pressure gradient to the southwest. As a result, there is strong northwesterly flow to the west of the low. When this flow is combined with unstable boundary layer stratification in the postfrontal environment, conditions are ripe for a dust storm.
Notice that in addition to the areas of postfrontal dust, prefrontal dust also forms over northeastern Saudi Arabia, southern Iraq, and Kuwait where there are winds of 20 to 25 knots.
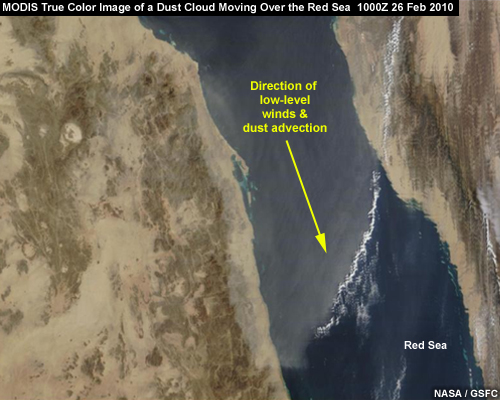
This MODIS true colour image shows the dust cloud over the Red Sea. The cold front has moved southward and the dust has been advected in that direction by strong northerly postfrontal winds.
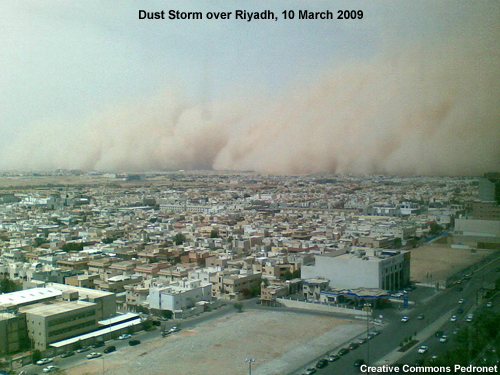
Synoptically Forced Dust Storms » Postfrontal Dust Events » Dust Squall over Riyadh
On the morning of 10 March 2009, one of the worst dust storms in a decade engulfed Riyadh, Saudi Arabia, blanketing it in a thick layer of orange dust.
This MSG dust RGB clearly shows the dust cloud in magenta. Notice how well it contrasts with the desert features in cyan. The sharp boundary of the dust cloud on its southern edge and its dark magenta colour suggest that the dust cloud is a low-level cloud--that is, a dust squall triggered by the cold front over western Iran. The cold front passed over Israel the day before, producing a wind storm and some rain. Notice the patches of dust over Iraq and the position of the high-level cirrus clouds over the Arabian Peninsula (in black).
On the image below, use the drawing tools to mark the position of the subtropical jet as well as the postfrontal jet that's related to the frontal system over western Iran. When you are finished, click Done.
To find the subtropical jet, follow the cirrus fibres that stretch from southeastern Egypt across the Arabian Peninsula to Iran. The jet is on the cold (northern) side of these cirrus clouds. The postfrontal jet, which is harder to find, is more or less parallel to the frontal system over western Iran and then curves northward in the cloud-free area over northern Saudi Arabia.
Synoptically Forced Dust Storms » Postfrontal Dust Events » Dust Crossing the Gulf of Aden
Postfrontal dust outbreaks caused by Shamal winds typically slow down over the southern part of the Arabian Peninsula where the diffluent northerly flow encounters southerly winds from the Arabian Sea. However, when troughs dig deeply down to the south, the dust clouds get blown far out into the Arabian Sea, crossing the Gulf of Aden and reaching the Yemini island of Socotra and sometimes even Somalia.
That’s what we see in this MODIS true colour RGB. Relatively thick dust plumes are bordered by a thick bank of clouds, which mark the southern boundary of the dust outbreak. The boundary represents the advancing cold front, separating dusty continental air from unmodified marine air to the south.
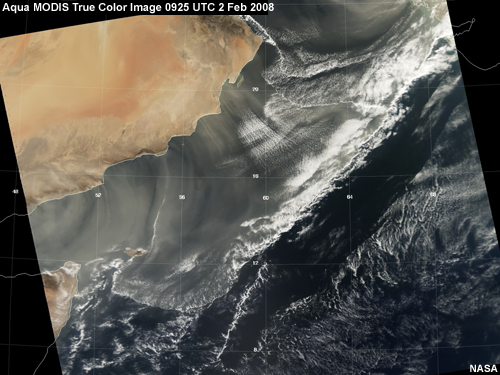
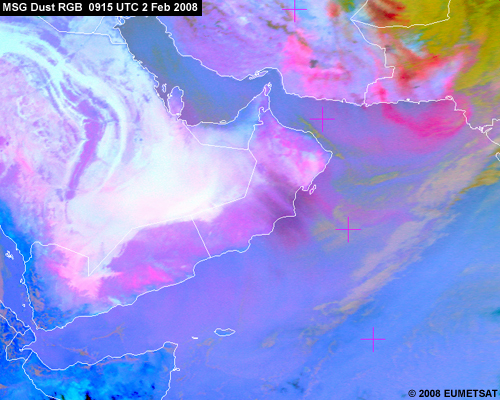
Notice how the true colour image made from solar channels does a better job of depicting the low-level dust cloud over the ocean than the IR-based dust RGB. However, if you compare the dust cloud over the heated land surfaces, such as Oman, Iran, and Pakistan, you’ll see that the dust RGB handles it better than the true colour image.
Synoptically Forced Dust Storms » Postfrontal Dust Events » Example of Frontal Rain and Dust
A spectacular combination of frontal rain and a major dust outbreak occurred in the eastern Mediterranean on 21 to 23 January 2004. The postfrontal dust cloud developed over eastern Libya on 21 January, crossed Egypt on 22 January, and moved into the Middle East on 23 January.
This nighttime IR10.8 µm image shows the cold front over northwest Egypt moving eastward towards Cairo. We cannot see the postfrontal dust cloud since it blends thermally with the cool desert surface.

However, the dust cloud is obvious in the area behind the cold front in the dust RGB.

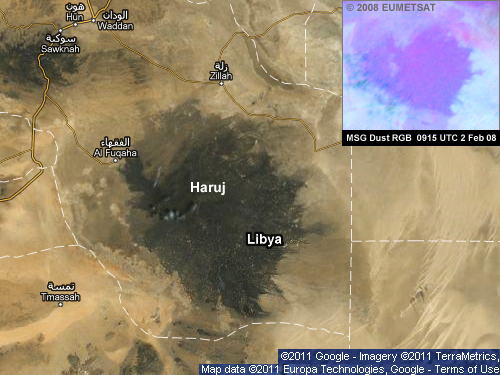
This image shows the storm hitting Cairo the next afternoon. The magenta dust streaks over Egypt and Libya indicate diffluent flow behind the cold front. Is the circled feature over central Libya a dust cloud? (Choose the best answer.)
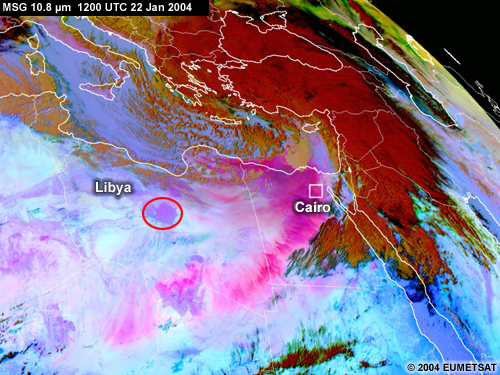
The correct answer is No.
When we compare the satellite image with a topographic map, we see that the feature is Haruj, a large volcanic field that covers 45000 km in central Libya.
Synoptically Forced Dust Storms » Postfrontal Dust Events » Australian Example
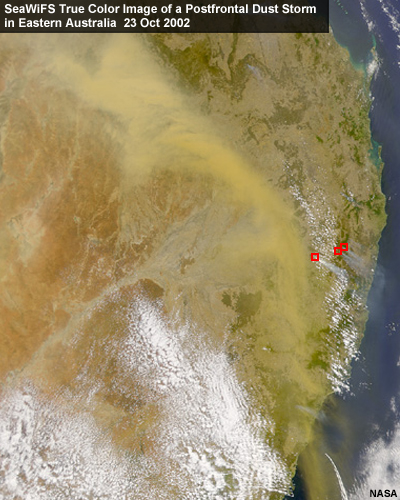
Initiation of dust storms by frontal passage is not limited to the Middle East. This SeaWiFS true colour image shows a massive dust storm that struck Sydney, Australia on 23 October 2002. The source region was an enormous dry lake bed in south central Australia. Eastern Australia had been in the grip of a drought for six months, which made the soil much easier to lift. The red boxes mark active bushfires. The smoke plumes show the low-level wind direction ahead of the advancing dust front. Notice that the colour of the smoke from the fires is different than the dust cloud.
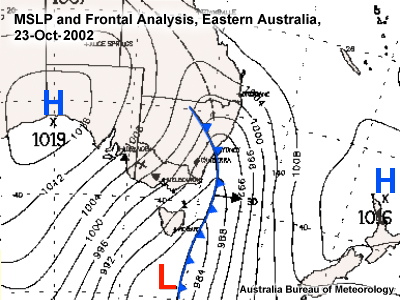
This weather map shows the location of the cold front and surface trough at about the same time as the SeaWiFS image. Notice the close correspondence between the front and the dust cloud.
Synoptically Forced Dust Storms » Postfrontal Dust Events » American Southwest Example
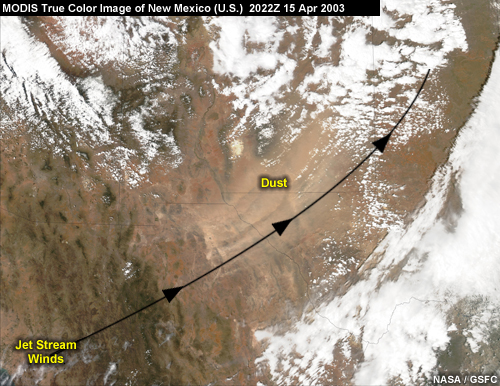
Postfrontal dust storms are also common across the American southwest. This MODIS true colour image shows one that originated in northern Mexico and western Texas. A jet maximum had rounded the base of an upper-level trough, transporting momentum and therefore strong winds to the surface.
Synoptically Forced Dust Storms » Postfrontal Dust Events » East Asia Example
Dust associated with frontal systems affects large portions of East Asia. The dust is lifted by strong winds from the arid regions of northwestern China and Mongolia and is transported across China and the Yellow Sea, impacting Korea and Japan. During the winter and spring, the westerly jet stream sometimes transports the dust over the North Pacific and as far east as North America.
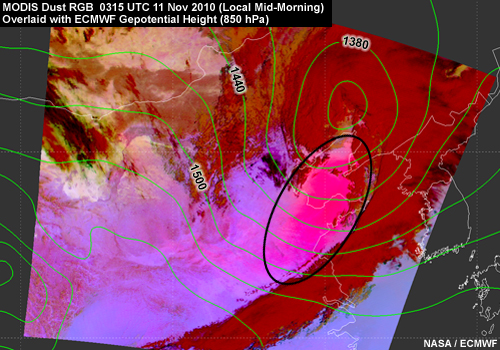
This MODIS dust RGB from the morning of 11 November 2010 shows a large area of postfrontal dust blowing across eastern China. The fast-moving dust was blowing east from the Gobi Desert, where a massive storm had originated the day before. The dust then moved towards the Korean Peninsula, reaching Korea that evening. Such large dust storms are common in China and usually occur in spring when fronts from Siberia sweep southeast across the Gobi Desert. Late autumn and winter dust storms are rare.
Synoptically Forced Dust Storms » Dust Events Caused by Large-Scale Trade Winds
Synoptically Forced Dust Storms » Dust Events Caused by Large-Scale Trade Winds » Global Trade Wind Patterns
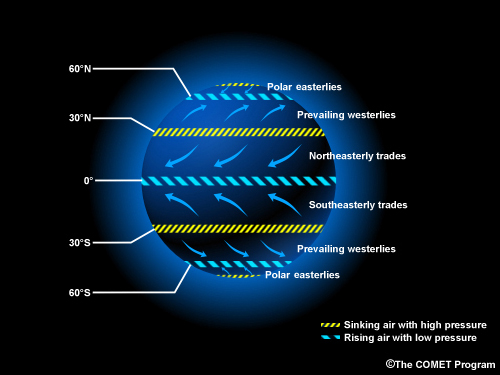
The trade winds (or trades) are the prevailing surface winds in subtropical areas. They blow predominantly from the northeast in the Northern Hemisphere and southeast in the Southern Hemisphere. Their direction can change over the continents due to local thermal lows, such as the summer heat low over Afghanistan and northern Pakistan. In the Middle East, the summer trade wind comes from the north and is called a Shamal, while in northern Africa, it comes from the northeast and is called a Harmattan. When trade winds are strong enough, they can lift large amounts of dust up into the air. The “40-day Shamal” refers to the length of time that these summer versions of the dust storms can last.
Trade and monsoon winds are responsible for transporting huge dust clouds from northern Africa and the Middle East westward across the Atlantic Ocean into the Caribbean Sea and southeastward across the Indian Ocean towards India.
Dust outbreaks caused by strong trade winds can occur throughout the year. However, summer dust outbreaks have a greater capacity to lift sand and dust due to convective instability induced by high surface temperatures.
Synoptically Forced Dust Storms » Dust Events Caused by Large-Scale Trade Winds » Summer Shamals
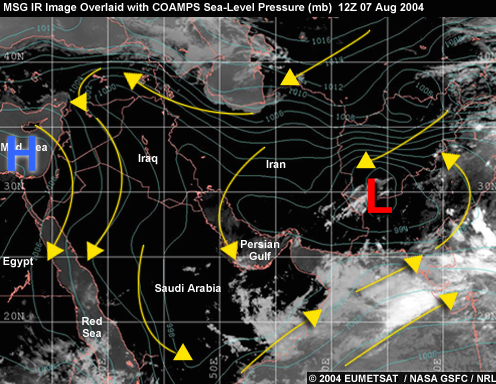
The synoptic pattern of large-scale summer dust outbreaks in the Middle East (Shamals) is characterized by:
- A semi-permanent high-pressure cell extending from the eastern Mediterranean to northern Saudi Arabia (a subtropical high)
- A thermal low-pressure cell over Afghanistan/Pakistan (part of the northern branch of the ITCZ)
- Thermal low pressure associated with the monsoon trough extending into southern Saudi Arabia
As this surface pressure analysis shows, the cyclonic circulation around the region of low pressure combines with the anti-cyclonic circulation around the high-pressure cell to increase the winds over the northern Persian Gulf region. These winds are normally confined from the surface up to 1500 meters (5,000 feet). The Shamal is particularly strong at ground level during the day and weakens overnight.
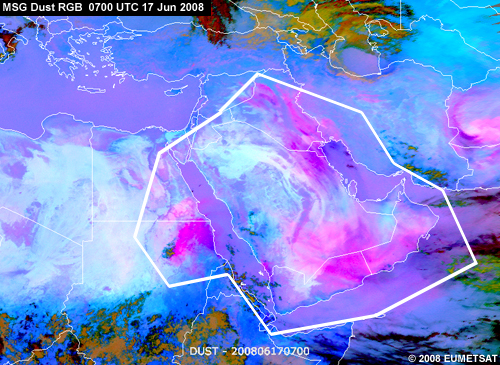
This dust RGB shows a typical summer Shamal from June 2008. It's late morning local time and the land surface has already heated. Massive dust clouds hover over the Middle East from Iraq to Oman/Pakistan and are spreading south past the Arabian Peninsula. Note the absence of any frontal systems.
Synoptically Forced Dust Storms » Dust Events Caused by Large-Scale Trade Winds » Winter Pattern in North Africa, Part I
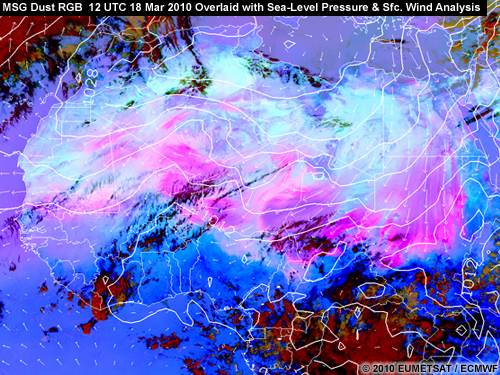
March 2010 was a spectacular month for dust storms, with dust blowing across the Sahara Desert and over the Atlantic Ocean for much of the time. The synoptic situation in this 18 March 2010 image shows the typical pattern that causes these large dust outbreaks over northern Africa:
- There's a high-pressure area over northern Africa, which is strengthened by cold air outbreaks from Europe
- There's a low-pressure area over the southern Sahel, which is related to the northward movement of the ITCZ
- The high-pressure area presses against the low-pressure area, with strong Harmattan winds in between
- This leads to continental-scale dust outbreaks over Sudan, Chad, Niger, Mali, and other countries.
Dust forecast models tend to handle these situations very well.
Synoptically Forced Dust Storms » Dust Events Caused by Large-Scale Trade Winds » Winter Pattern in North Africa, Part 2
Here's another example of a wintertime cold air outbreak from Europe to Northern Africa leading to a large-scale dust storm over Northern Africa.
The image in the upper left shows a dust outbreak that started over Morocco and Algeria on 5 March 2006 when a cold front reached Northern Africa. During the following days, the associated cyclone moved eastward through the Mediterranean Sea. Behind the trailing cold front, dust storm conditions developed over Northern Africa.
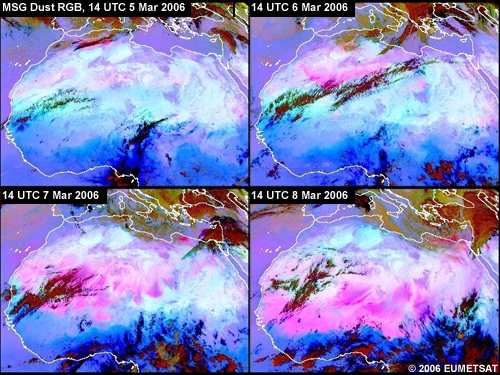
Look at the shape of the dust clouds and dust streaks in the image below. Then use the drawing tools to draw surface wind vectors on the image. When you are finished, click Done.
Dust is an ideal indicator/tracer for wind speed and direction. The dust plumes and dust streaks are generally parallel to the wind direction, with longer streaks associated with stronger winds. Following this rule, we can identify northerly winds over Sudan, northeasterly winds over the central Sahara, and easterly winds over West Africa. Note the strong northeasterly winds in the gap between the Tibesti and Ennedi Mountains.
Synoptically Forced Dust Storms » Dust Events Caused by Large-Scale Trade Winds » Major Dust Transport from West Africa to the Lesser Antilles
The subtropical circulation often transports desert dust westward from Africa to the Caribbean and Amazon. Over West Africa, the dust is lifted by thunderstorm gust fronts or strong Harmattan winds.
This 6-day, 15-minute sequence of MSG dust RGB images shows a plume of Saharan dust that blew off the west coast of Africa on 22 June 2007. It reached the Lesser Antilles in the Caribbean five days later, on 25 June. This translates to a distance of 4600 km in 123 hours or an average speed of 10 m/s (22 mph). The dust cloud traveled at a level close to 5 km. As you play the animation, note that it is long!
Notice how convective clouds developed when the dry dust front encountered the moist and unstable air of the Caribbean Sea.
Saharan dust brings mixed blessings as it crosses the Atlantic. It can bring pathogens that harm Caribbean corals and aggravate human health. But it also supplies the Caribbean islands with valuable nutrients for the soil, without which they might be rather barren.
Dust Storms Caused by Mesoscale Systems
Synoptically Forced Dust Storms » Introduction
This section examines dust storms generated and influenced by mesoscale forcing, focusing on examples from Northern Africa, the Middle East, and South America.
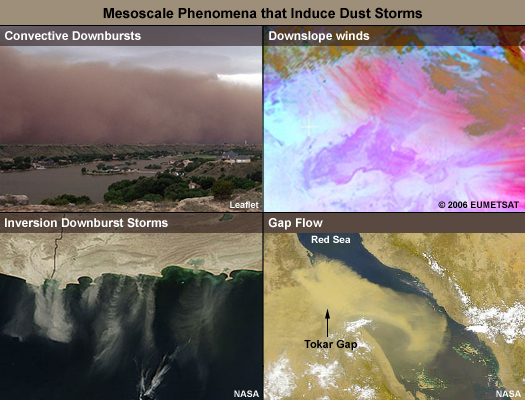
The mesoscale phenomena that induce dust storms include downslope winds, gap flow, convection, and inversion downburst storms. As you would expect, these are more difficult to forecast than synoptically forced dust storms related to frontal winds and other large-scale phenomena.
We'll begin our examination of mesoscale phenomena with downslope winds.
Dust Storms Caused by Mesoscale Systems » Downslope Winds
Dust Storms Caused by Mesoscale Systems » Downslope Winds » North Africa Example
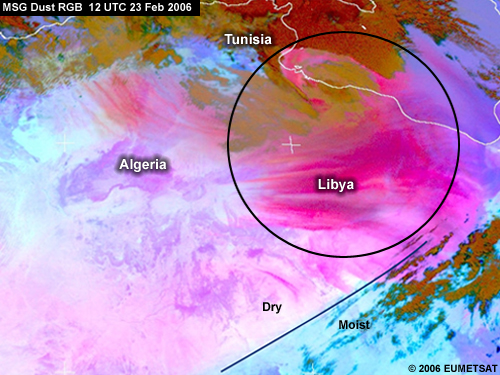
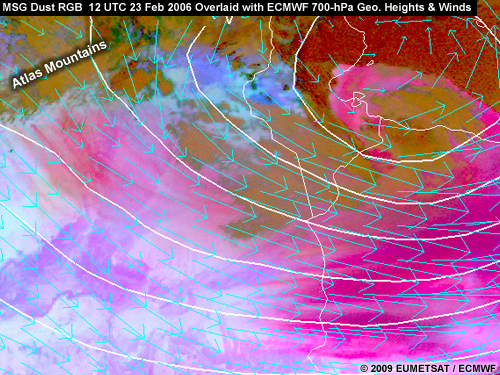
This MSG dust RGB shows two separate dust outbreaks over Algeria, Tunisia, and Libya on 23 February 2006. What's the large outbreak over Tunisia and Libya? (Choose the best answer.)
The correct answer is B.
This is a postfrontal dust storm related to a cyclone over Tunisia. Note the strong colour difference between the moist prefrontal air (blue) and the dry postfrontal air (pink) further to the west. That's due to the influence of water vapour on the product. Dry air is has a stronger red component than moist air in the dust RGB.
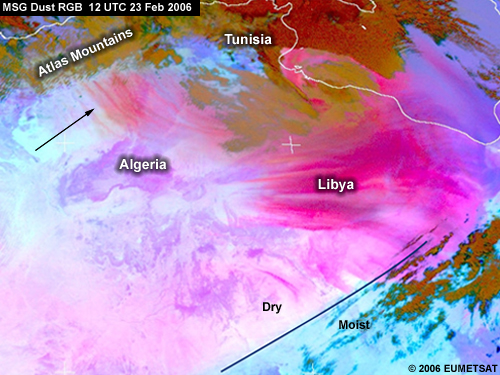
The second, smaller dust outbreak is over Algeria, south of the Atlas Mountains. Downslope winds on the leeward side of the mountains have picked up dust from a source region in that area. The plumes appear as dust streaks oriented northwest-southeast.
You can identify dust storms generated by downslope winds by looking for:
- A mountain range at least 2 km high
- Strong synoptic-scale winds moving perpendicular to it
- A dust cloud with a “streaky” structure
These conditions are met in our case. Strong, synoptic, 700-hPa winds are perpendicular to the Atlas Mountains, which are 4167 meters high.
Dust Storms Caused by Mesoscale Systems » Downslope Winds » Argentina Example
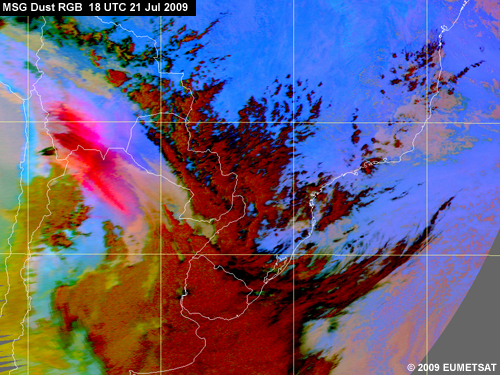
Here’s another example of a dust outbreak caused by strong downslope winds. In Argentina, a dry wind develops when polar maritime air descends from the Andes Mountains to the plains of the Argentinean Pampa. This downslope wind is called “viento zonda” (“Zonda” in English). The Zonda blows from May to November and often carries dust.
This daytime dust RGB is from 18 UTC on 21 July 2009 when large amounts of dust were carried across Bolivia and Argentina. The polar front is visible over Bolivia, Paraguay, and Southern Brazil, while the centre of the cyclone is located in the Uruguay-Argentina border region. The source region for the dust is the Salar de Uyuni, a dry lake bed in the Andes Mountains in Northern Argentina and Southern Bolivia. It's considered a “dust hotspot.”
What do you expect to happen to the high-level dust cloud over the next two hours? The image was taken during mid-afternoon local time. Select the words that complete the statements, then click Done.
Strong postfrontal winds have blown the dust very quickly in a southeasterly direction. It has reached far into Argentina and covers southern Bolivia nearly up to the Paraguay border. In addition, new dust is being lifted over the Andes Mountains, increasing the size of the dust cloud.

Looking at the source region and the structure of the dust cloud, how high do you think the cloud is? (Choose the best answer.)
The correct answer is C.
We can tell that it's mainly a high-level dust cloud (5000 m) because the dust originated in the Andes Mountains and is oriented northwest to southeast. Overlaying ECMWF surface wind barbs confirms that the high-level dust is not following the postfrontal southerly surface winds over Argentina, but is closer to the northwesterly winds over the high Andes plateau at about 4000 meters.
Dust Storms Caused by Mesoscale Systems » Gap Flow
Dust Storms Caused by Mesoscale Systems » Gap Flow » Tokar Gap
This SeaWiFS true colour image shows a dust storm that occurred around the Red Sea in July 1999. The large thermal contrast between the interior of Sudan and the Red Sea resulted in a strengthened pressure gradient that helped generate the dust storm. The lower terrain of the Tokar Gap provided a path for the dust to move over the Red Sea.
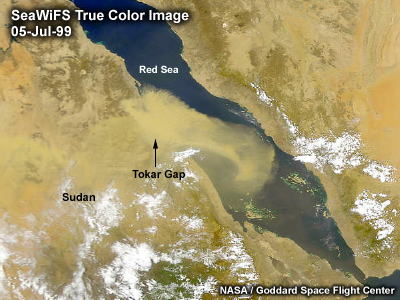
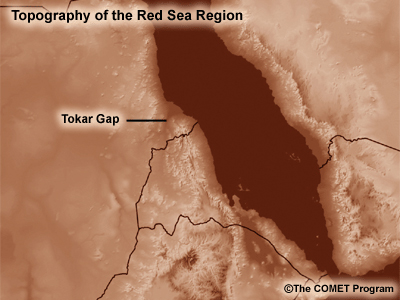
The Tokar Gap is a low-elevation break in the mountains that flank the west side of the Red Sea.
In the SeaWiFS image, the dense plume of dust entering the Red Sea disperses and casts a pall over the area. At this time, winds across the Red Sea within the layer between the surface and 850 hPa are dominated by a northwesterly flow. This appears to help advect the dust plume toward the southeast.
The Red Sea Convergence Zone also helps trap the dust in the centre of the sea. This convergence zone is formed by air flowing southward from the northern portions of the Red Sea meeting air flowing northward from the southern entrance of the Red Sea. This creates an area of convergence that traps the transported dust.
Accurately forecasting gap flows generally requires a mesoscale model with several grid cells inside the gap. Since the Tokar Gap is approximately 10 kilometers wide, high-resolution mesoscale models should be able to capture the flow. For more information on gap winds, see COMET's Gap Winds module at http://www.meted.ucar.edu/mesoprim/gapwinds/index.htm.
Dust Storms Caused by Mesoscale Systems » Gap Flow » Bodélé Depression
The Bodélé Depression of northern Chad contains a series of dry lake beds that form the world’s largest single source of wind-blown dust. The large dust events that frequently arise in this area are primarily caused by a high-pressure system over North Africa that drives the northeasterly Harmattan winds over the Sahara.
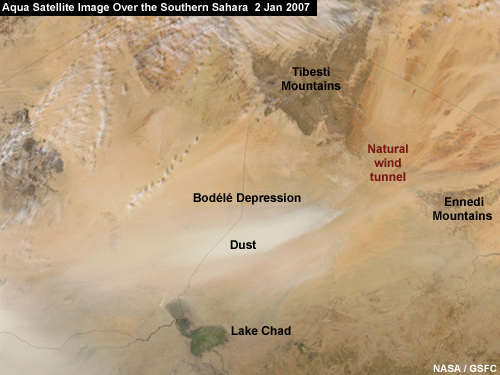
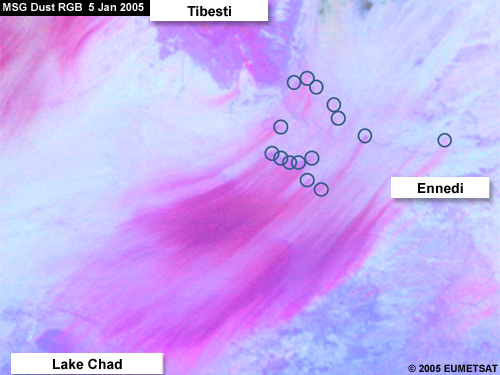
The gap between the Tibesti Mountains (3415 m) and the Ennedi Mountains (1450 m) plays a role as well. Although it's not as narrow as some, the gap creates a natural wind tunnel that focuses and intensifies winds across the region, forming a low-level jet. That’s evident in this MODIS image from 5 January 2005, which shows bright streaks of dust arcs across the Bodélé Depression toward Lake Chad.
This MSG dust RGB animation shows the evolution of a dust storm from 0800 UTC to 1600 UTC 5 January 2005. As you watch the animation, notice how the dust acts as a passive tracer for the channeled flow in the Borkou Gap between the Tibesti and Ennedi Mountains.
The graphic below shows a number of the dust hot spots, some of which are dry lake beds.
This animation shows the dust and natural colour RGBs for the same period (8 to 16 UTC). In the natural colour RGB, the dust clouds appear in a lighter colour, tending towards white. As you watch the animation, can you tell which dust clouds are the thickest (optically speaking)?
To identify thick dust clouds in the natural colour RGB, look for areas in which no surface features are visible. In our case, the thickest dust cloud is the one in the Bodélé Depression. It's harder to see the dust cloud west of the Tibesti Mountains because it's much thinner optically.
Based on this comparison, why is the dust enhancement generally better for tracking dust plumes than the natural colour RGB? (Select all that apply.)
The correct answers are A, B, and C.
The dust extending to Lake Chad is evident in the dust enhancement but not the natural colour loop. The same goes for the dust event west of the Tebesti Mountains. The problem with natural colour imagery is that dust resembles the surface from which it was scoured, creating ambiguity.
Dust Storms Caused by Mesoscale Systems » Gap Flow » Diurnal Cycle of Winds and Dust Release
This MSG dust RGB animation shows the Bodélé area from 00 UTC 13 November to 23 UTC 18 November 2009 when several dust clouds (dust "pulses") were released and drifted westward over the Sahara/Sahel.
As you watch the animation, notice the pronounced diurnal cycle of surface wind speeds and dust release in the Bodélé area. Both are at their minimum at night and maximum in late morning/noon. Surface winds are weak at night because they decouple from the Bodélé low-level jet, which flows above a near-surface temperature inversion. During the day, intense surface heating induces turbulence in the lowest layers and the jet mixes down to the surface, turning up dust.
Did you also notice the following in the animation?
- The high-level cirrus clouds moved in the opposite direction from the dust, from west to east. That's due to strong wind shear above the surface layer in which the dust is trapped.
- The Bodélé dust traveled a great distance (over Niger, Nigeria, and Mali), which is not unusual. In fact, large outbreaks of dust from that area can cross the Atlantic Ocean, reaching Central and South America.
Dust Storms Caused by Mesoscale Systems » Convection and Haboobs
Dust Storms Caused by Mesoscale Systems » Convection and Haboobs » Description
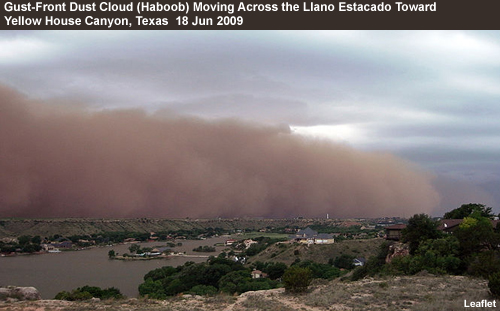
This dust squall is a Haboob, that is, a dust storm caused by convective downbursts. Haboobs are the true walls of dust and sand that most people think of as strong dust storms. The term is used in Argentina as well as Africa, Asia, and the desert southwest of the Unites States.
Dust Storms Caused by Mesoscale Systems » Convection and Haboobs » Properties of a Haboob
Winds associated with the gust front of a dry downburst from a convective storm average 35 to 50 knots and can easily excite a dust storm when they encounter an appropriate source area. Haboobs tend to be rather small, on the order of 100 to 150 kilometers, except in the Sahel area where they can extend up to 1000 kilometers horizontally.
Haboobs tend to be 1500 to 2500 meters high at the peak of the event. However, they can reach 4500 meters when exacerbated by convergent outflow boundaries. The average Haboob tends to be short-lived, lasting about three hours. Visibility usually begins to improve soon after the gust front passes.
In the Sahel, though, Haboobs created by squall lines tend to be much larger (up to 1000 km) and longer-lived (lasting up to 24 hours). They can keep visibility poor for many hours after the gust front passes.
Although Haboobs can be seen approaching an area from afar, they move in very quickly, typically at about half the velocity of the winds within the storm. So a Haboob packing 50-knot winds will move at about 25 knots.
Dust Storms Caused by Mesoscale Systems » Convection and Haboobs » Haboobs in Different Regions
Let's look at examples of Haboobs in different areas. Click each tab.
Mali
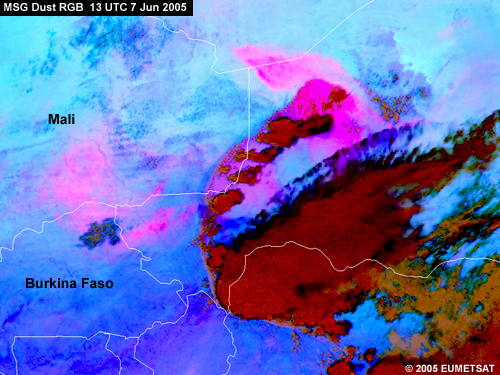
This MSG dust RGB shows a large daytime Haboob over Mali associated with a squall line over Burkina Faso. The gust front propagates westward, raising a lot of dust and triggering new convective storms. That same gust front raises much less dust to the south, where there's more vegetation. Note that the dissipating dust cloud further to the west is from a previous convective event.
Scroll up and select the next tab.
West Africa
This MSG dust RGB animation shows a large dust squall over Niger, Mali, and southern Algeria, which was triggered by a thunderstorm system in the lower part of the scene. The strong Haboob travelled hundreds of kilometers westwards over the Sahara, once again showing how far such systems can propagate and how well defined they can be at night.
On 9 June, we see daytime convection lifting part of the low-lying dust higher up (above the boundary layer) where westerly winds carry it back in an easterly direction. The higher-level dust is readily apparent in bright magenta in the late afternoon and nighttime hours as compared to the dark magenta of the low-level dust squall. Towards the end of the animation, the westward propagation of the dust squall slows down as it approaches a deformation zone.
Scroll up and select the next tab.
Morocco/Algeria
Easterly flow in the Sahel moves Haboobs westward and northward. In contrast, Haboobs over northern Africa, like the one shown here, are steered by westerly winds southward and eastward into the desert.
This animation shows a typical afternoon Haboob in the border area of Morocco and Algeria. The convective storm that triggered the outflow gust front developed over the Atlas Mountains and moved eastward into the Algerian desert. The intensity of the storm is not only manifested by the gust front, which indicates strong downdrafts, but also by gravity waves, which indicate strong updrafts seen on the top of the thunderstorm anvil.
Note that the animation is an HRV/dust RGB "sandwich product." It blends the high-resolution HRV channel and the lower-resolution dust RGB, letting us spatially co-locate cloud features (such as the storm's overshooting top and outflow boundaries) with dust clouds. This blended product is probably the best geostationary product to use for monitoring Haboobs during daytime.
You have completed this page, so proceed to the next one.
Dust Storms Caused by Mesoscale Systems » Convection and Haboobs » Forecasting Haboobs
Haboobs are much more difficult to forecast than synoptically forced dust storms and rely largely on nowcasting, i.e., determining if the environment is right for their formation. The following procedures can help you forecast Haboobs from both ongoing and collapsing thunderstorms.
Forecasting Haboobs from ongoing thunderstorms
- Look for signs of instability aloft, using the Most Unstable Lifted Index if available.
- Look for high environmental relative humidity between 700 and 500 hPa and/or high values of simulated radar reflectivity from WRF/COAMPS or actual reflectivity from a nearby EWR radar if it’s available. Also look for steep lapse rates between the surface and approximately 5 km (18,000 ft).
- Find the strongest wind at any level aloft where the wet bulb potential temperature is less than the (surface potential temperature 4°C or + 39°F). It’s possible that this wind may be brought to the surface.
- Determine if your forecast area is located in or near a dust source region.
Forecasting Haboobs from collapsing thunderstorms
- At what time of day is the thunderstorm occurring? Thunderstorm collapse is most likely after sunset.
- Determine the cloud base height of the thunderstorm. The higher it is (greater than 3k or 10,000 ft above ground level), the warmer the resultant outflow at the surface due to adiabatic compression, and the weaker the potential Haboob. Downdraft acceleration will mitigate the warming issue to a limited extent.
- Check for rapidly warming cloud tops in looped geostationary infrared imagery, which are indicative of thunderstorm collapse.
- Determine if the thunderstorm is occurring over a dust source region.
Dust Storms Caused by Mesoscale Systems » Inversion Downburst Storms
Inversion downburst windstorms occur on sloping coastal plains with a strong sea breeze. As the sea breeze intensifies, convergence along the sea breeze front can generate sufficient lift to break a capping inversion. This potential instability results in the downward mixing of cool air aloft, which flows downslope and out over the water. The descending air produces roll vortices and potentially severe local dust storms along the coast. Then the inversion is reestablished and the event dies out. Play the animation to see this process unfold.
Inversion downburst storms form in coastal terrain where slopes are at least 4 meters per kilometer, such as those along the Red Sea and Persian Gulf. They occur when the sea breeze exceeds 15 knots and there's an inversion aloft, but not a particularly strong one. The downburst winds last 15 to 45 minutes and reach speeds of 90% of the gradient flow immediately above the inversion, typically 20 to 25 knots. These storms are limited in size, although they can still reduce visibility to less than one kilometer depending on local surface soil conditions.
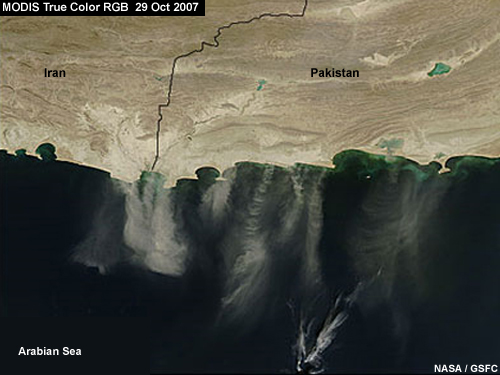
Inversion downburst storms typically lead to a very narrow streamer of dust out over the Persian Gulf. Although they occur on both sides of the Gulf, they are more common along the Iranian and Pakistani coasts where strong sea breezes are favored. Predicting their location is very difficult, but you should look for places where coastal curvature favors stronger sea breezes or sea breeze convergence. Variations in the strength of the inversion also impact where the event is located. And, like all dust events, they require an appropriate source region. For more information on sea breezes, see COMET's Sea Breeze module at http://www.meted.ucar.edu/mesoprim/seabreez/index.htm.
You have reached the end of the module. Click the Table of Contents link above and select Return to Table of Contents. Then take the quiz and survey.
Select a Section: