
Select a Section:
II. Dust Detection and Forecasting
Table of Contents
Dust Detection by Satellite
Dust Detection by Satellite » Visible and IR images
Dust Detection by Satellite » Visible and IR images » Introduction
Dust RGB products are made from several satellite channels and have vastly improved dust detection and monitoring.
So what role does that leave for single channel black and white visible and infrared images?
Single channel images are helpful when, for example, you:
- Are learning the physical principles behind satellite dust detection
- Want to understand how RGB products work since they’re made from single channel images
- Are forecasting for a region that does not have RGB products
For these reasons, we’ll begin this section by examining single channel imagery and then move on to dust RGBs. Specifically, you will see how:
- Visible and infrared images detect dust
- Animating single channel imagery can improve dust interpretation
- RGB products vastly improve dust detection and monitoring
Dust Detection by Satellite » Visible and IR images » Day-Night Differences with VIS and IR Imagery
Dust is easier to detect and monitor during the day than at night partly because stronger daytime winds stir and loft more dust into the atmosphere. But daytime dust interpretation varies based on whether you're using visible or infrared images and looking over land or sea.
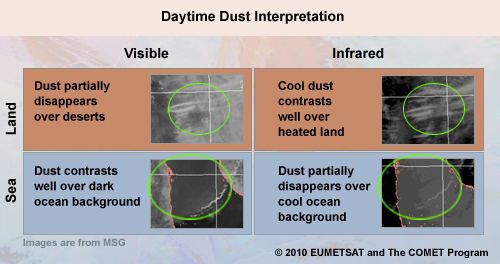
Review the table, then select the word that completes each statement. Click Done when you are finished.
In visible images, dust disappears over land because it blends in with reflective desert backgrounds. But dust can be identified in infrared images because of its contrast with the heated desert background.
When dust moves over the ocean, the opposite rules apply. It's easy to identify dust on visible images since the bright dust contrasts nicely with the dark water background. But the relatively cool dust blends in with the ocean thermal background, making infrared images hard to use.
On the next page, we'll apply these rules to some examples. There's an important exception for visible imagery, which we'll examine later.
Dust Detection by Satellite » Visible and IR images » Examples
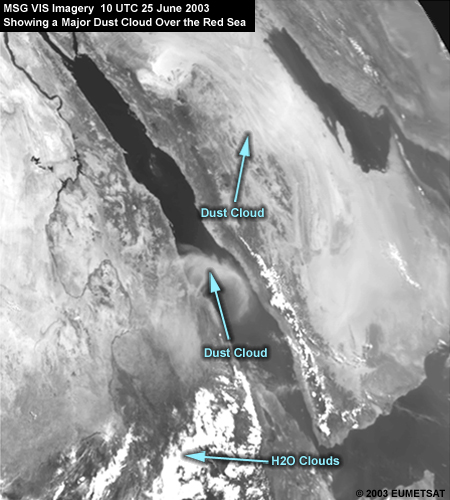
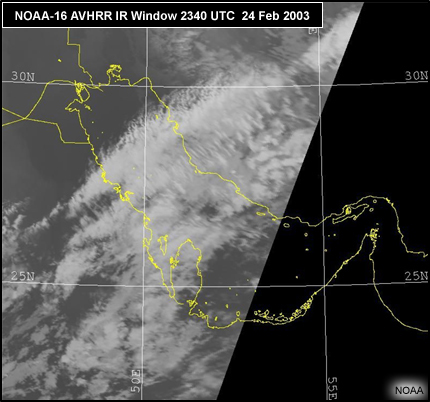
In this daytime IR image of the Red Sea, dust clouds are evident over the land but not the water. That's because they contrast well against dark (warm) land surfaces in IR images but not cool sea surfaces where they blend in. Click the tab to see the corresponding visible image. We can't see dust over the bright land background but it's clearly visible over the dark Red Sea.
Infrared
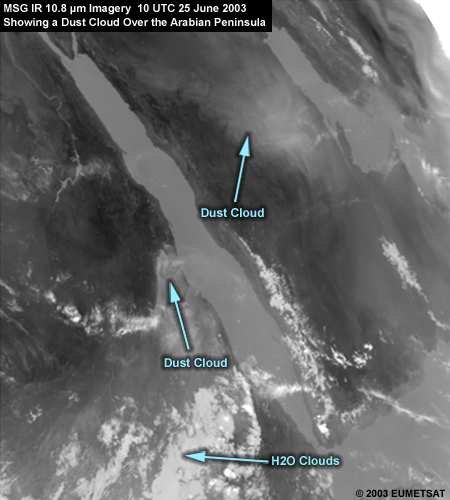
Visible
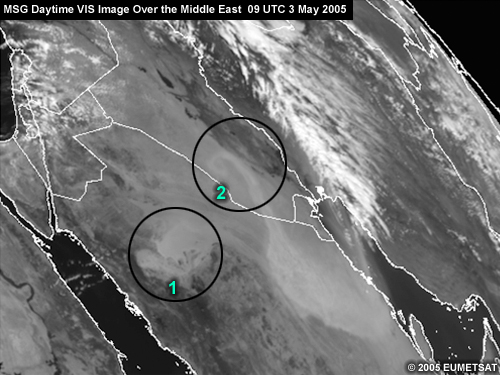
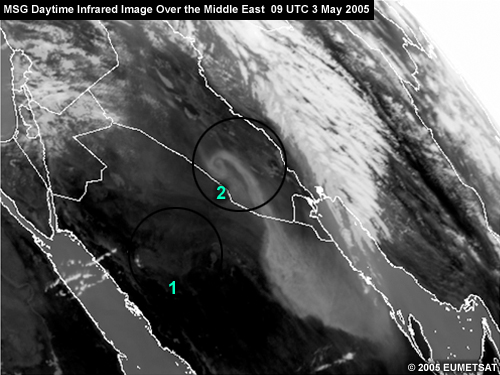
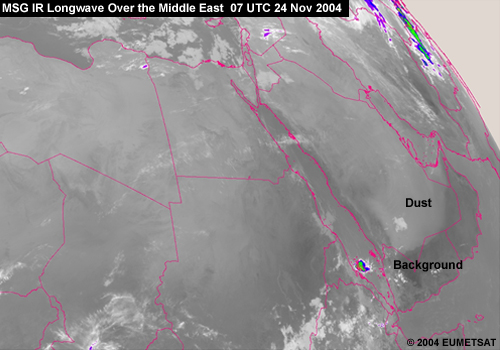
Which of the circles in this daytime MSG visible image contain dust clouds? Since we're looking at dust over land, it's hard to tell if the brighter areas in both circles are dust. The IR image provides the contrast needed to distinguish the cool dust from the heated land background. It's evident that circle 2 contains dust while circle 1 is bright dust-free desert.
Visible
Infrared
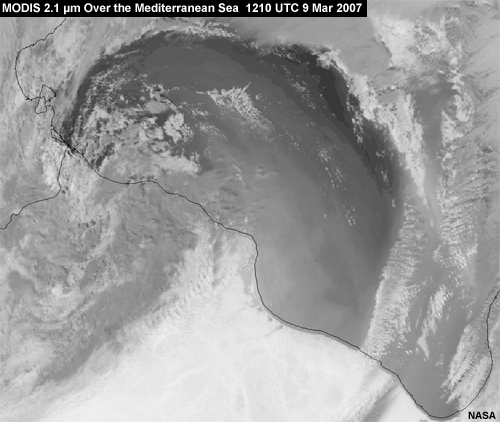
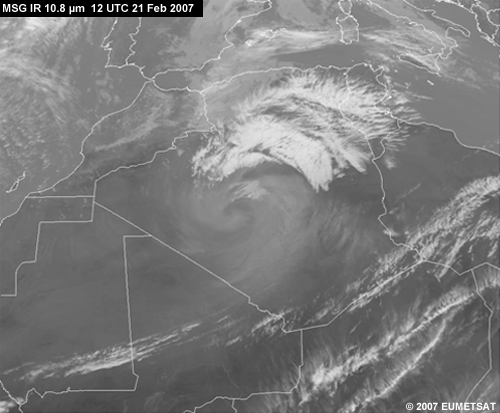
Finally, what type of image is this midday view of North Africa and the Mediterranean Sea? (Choose the best answer.)
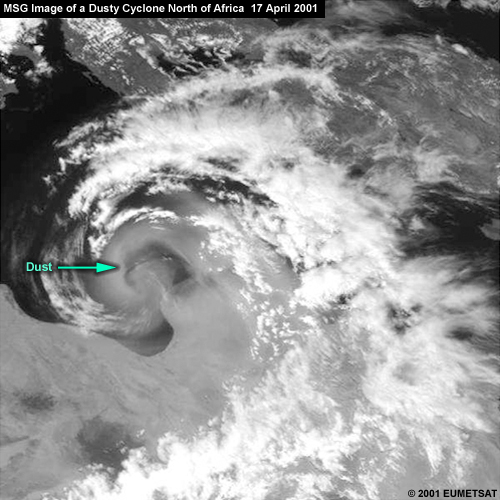
The correct answer is A.
It must be a visible image since the dust is evident over the dark water surface but not the bright desert to the south where it originated.
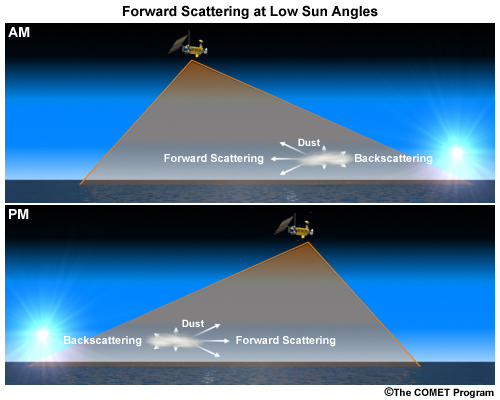
Dust Detection by Satellite » Visible and IR images » Forward Scattering at Low Sun Angles
The rules for visible imagery differ just before sunset and just after sunrise. If the satellite is looking in the general direction of the sun and the dust, the forward scattering of dust particles heightens the reflection from dust.
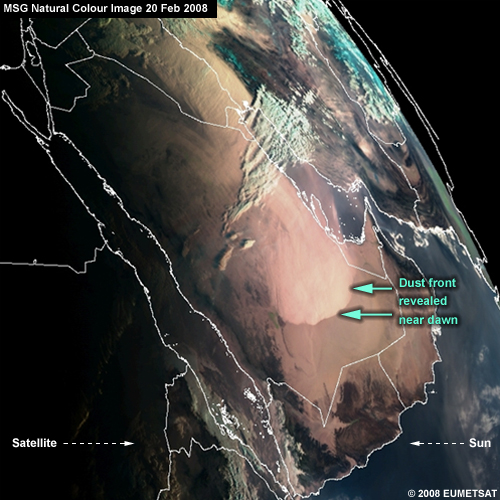
Let's look at some examples. This MSG natural colour product, derived from visible and other solar wavelengths, was taken over the Arabian Peninsula at dawn on 20 Feb 2008. The forward scattering off a large dust cloud reveals an advancing dust plume. This cloud would be difficult to detect during the middle of the day in the same product.
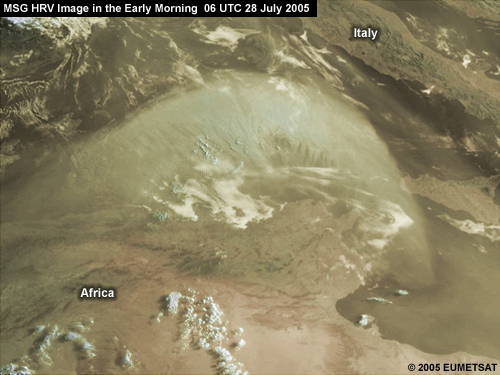
This MSG High Resolution Visible (HRV) image was taken in the early morning. The dust plume north of Africa is clearly evident due to the effect of forward scattering.
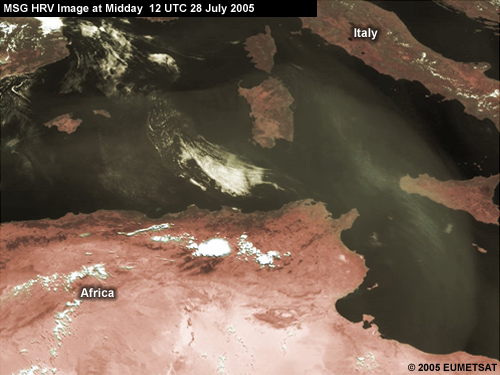
Six hours later, at midday, the forward scattering effect is gone and the dust is much harder to see. It's only faintly visible against the dark water background.
Dust Detection by Satellite » Visible and IR images » Differentiating Dust from Smoke
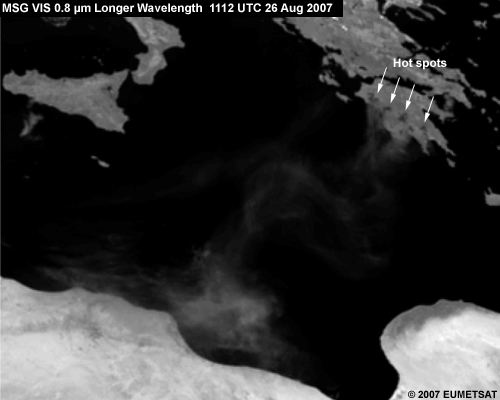
It can be hard to differentiate dust and smoke in visible images since both can have a similar brightness and produce diffuse patterns. In general, smoke particles are much smaller than dust particles (in the sub-micron vs. micron range). This means that smoke particles scatter more light at short wavelengths than longer wavelengths. As a result, smoke can tend to disappear at longer solar wavelengths. Dust particles, on the other hand, scatter more or less equally at those wavelengths.
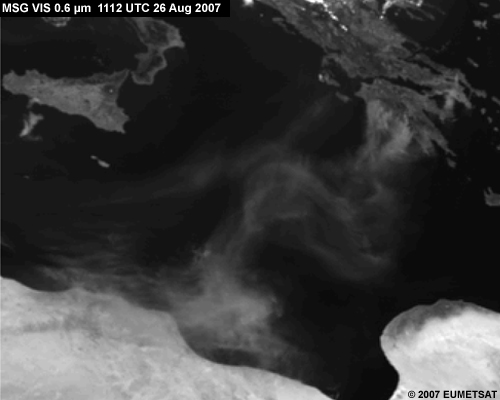
With these principles in mind, examine the diffuse plume in this visible 0.6 µm channel over the Mediterranean Sea. What is it likely to be? Recall that 0.6 µm is a short wavelength.
The correct answer is D.
While the right answer is D, it's hard to be positive from the image alone. Contextual clues indicate that it's probably smoke. The feature originated in Greece, which is subject to summer fires and is not a known dust source region.
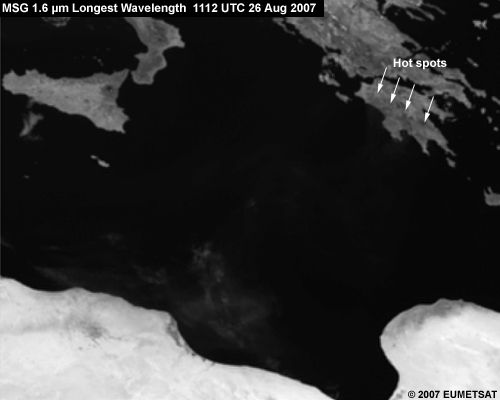
We get a clearer answer if we compare channels. Click the tabs to see images from different solar wavelengths. The feature seems to diminish as we move from shorter to longer wavelengths. This confirms that it's smoke because it consists of small particles that reflect relatively poorly at longer wavelengths.
Short

Longer
Longest
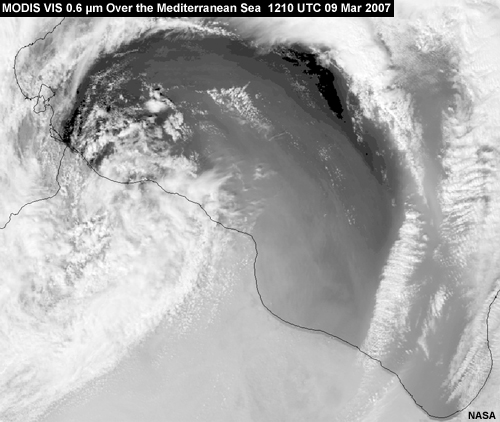
Now we'll look at a different scene in the same region, using the same solar channels. What do the light gray shades over water represent? (Choose the best answer.)
Vis 0.6
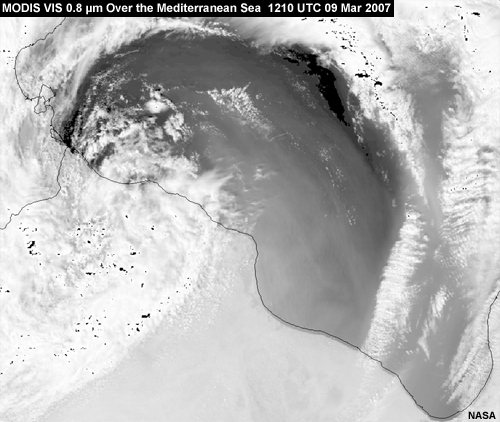
Vis 0.8
2.1
The correct answer is A.
It's clearly dust because the feature's appearance doesn't change much in the three images. Unlike small smoke particles, larger dust particles have similar reflectivities in all three solar wavelengths.
Dust Detection by Satellite » Visible and IR images » Animating Single Channel Imagery
We’ve seen how hard it can be to detect dust on single channel images due to its minimal contrast with the background.
Animating images can dramatically improve the detection of dust plumes. The infrared loop shows dust over the southern Arabian Peninsula. Note how its appearance changes throughout the animation.
What MOST accounts for the change in appearance? (Choose the best answer.)
The correct answer is C.
The dust changes appearance as the temperature of the background changes throughout the day. This produces different degrees of contrast (little in the morning, good at midday, and little again in the evening), making the dust more or less easy to detect.
Visible loops are often more valuable in detecting dust over low-contrast land surfaces. In this visible animation, the dust front near the bottom is even evident near sunset when the scene darkens.
Dust Detection by Satellite » Visible and IR images » Contrast Stretching of Nighttime IR Images
If you need to monitor dust at night and don't have access to RGB products, it can be useful to "contrast stretch" single channel images. This simple image enhancement technique stretches the intensity values to span a desired range and bring out particular features.
Which features show up prominently in this unenhanced nighttime infrared image? (Choose all that apply.)
The correct answer is A.
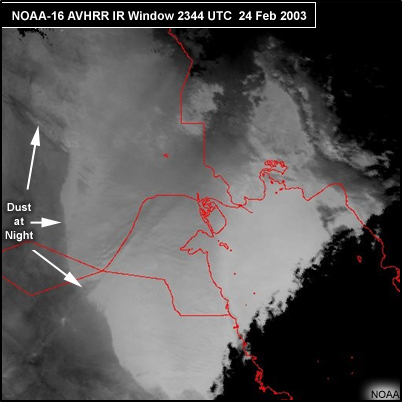
Cirrus over the Persian Gulf is obvious in white but very little else is apparent due to the lack of thermal contrast. There's dust over Kuwait but the image must be processed to see it.
We've zoomed into the area over Kuwait, enhanced the IR signal with "contrast stretching," and reversed the tonality to enhance the thermal signature of the dust. Now the dust is slightly warmer than the land background and is evident in bright grey shades. You can do this enhancement with an interactive workstation. Or you can automatically produce infrared images with a display range likely to detect dust at night, such as -10 C to 25 C.
Dust Detection by Satellite » Dust RGB Products
Dust Detection by Satellite » Dust RGB Products » Introduction
Dust RGB products are made from satellite imagers with enough channels to distinguish dust from moist or dust-free air as well as other types of soil. These imagers are on the following satellites:
- MSG and Metop (EUMETSAT)
- Aqua, Terra, and Suomi NPP (NASA/NOAA)
- Future NOAA GOES-R (NOAA)
- FY2D (China)
Since the channels often vary by satellite, dust can have a different appearance in products from different organisations. Therefore, be sure you are using the right guidelines when interpreting products from different sources.
EUMETSAT Dust RGB
MODIS Dust Enhancement
Chinese Dust RGB
We’ll start by examining EUMETSAT's dust RGB and then see how CALIPSO data can supplement it, particularly for determining dust height. In the last part, we’ll look at dust products from the United States and China.
Dust Detection by Satellite » Dust RGB Products » Constructing the Dust RGB
Unlike single channel images, EUMETSAT's dust RGB can monitor the evolution of dust storms during the day and at night, and can depict dust plumes over both land and sea. But given the challenging nature of these tasks, the product performs best over the ocean during daytime. We'll see why later in this section.
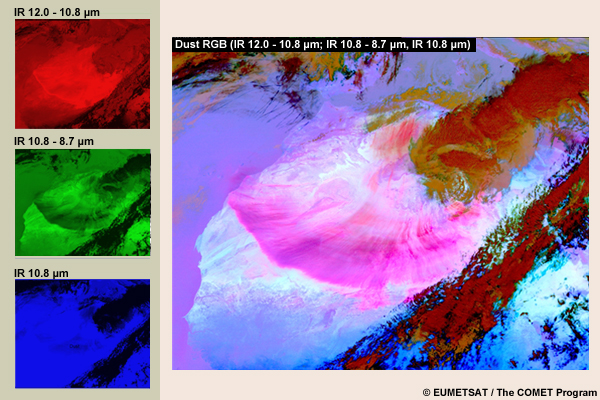
EUMETSAT’s dust RGB is made from three channels in the infrared region of the spectrum: IR 12.0 µm, IR 10.8 µm, and IR 8.7 µm. These channels were selected because of their sensitivity to dust, the desert background, and high and low clouds. The channels are assigned to the red, green, and blue colour guns such that the resultant colours highlight air-born dust and distinguish it from other atmospheric and surface features.

As you can see, there's only one channel in the blue colour gun while the red and green guns each have a channel difference. Channel differencing involves subtracting the pixel brightness temperature values of one image from another to bring out features, such as dust, that cannot be observed easily on single channel images.
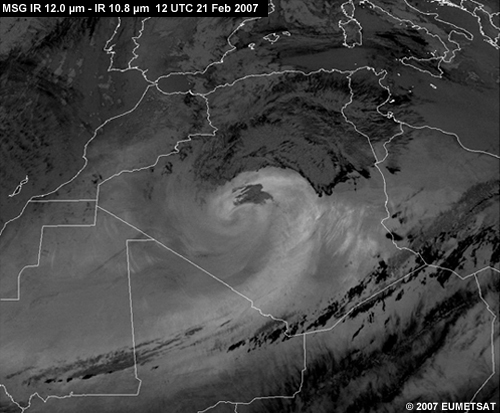
Here you can see the difference between a single channel image and one that's differenced. In the 10.8 image, the dust looks like a colder cloud (light gray) when compared to the warmer surface but the contrast is poor, especially for low-level dust. This problem gets worse at night.
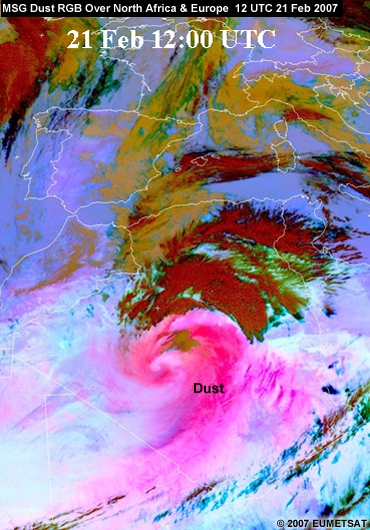
When the IR 12.0 and 10.8 channels are differenced, there's much better contrast between the dust and background. The dust and water/ice cloud to the north are vividly separated.
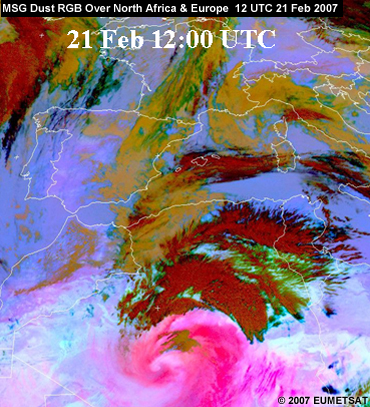
The finished dust RGB is even easier to understand where the dust area appears as bright pink/magenta.
For more information on EUMETSAT's dust RGB, see the COMET module RGB Products Explained at http://www.meted.ucar.edu/npoess/multispectral_topics/rgb/. It describes how RGBS are produced using the dust product as an example. It demonstrates other RGB products as well, and has links to sites where they can be obtained.
Dust Detection by Satellite » Dust RGB Products » Identifying Features in the Dust RGB
Here are guidelines for interpreting features in EUMETSAT's dust RGB. Review them, then answer the question below.
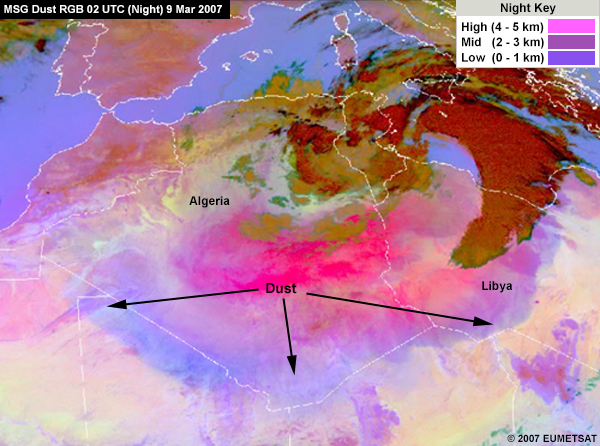
- Dust during daytime: Magenta but slightly reddish at higher levels
- Dust at night: Purple at low level, red at high level
- Clouds:
- Thick/high level: Dark reddish brown
- Thin/high level (cirrus/contrails): Dark blue/black but greens over some desert areas
- Thick/mid level: Brown
- Thin/mid level: Dark green
- Low level: Purples when atmosphere is warm; light brown when atmosphere is cold
- Volcanic ash: Orange or peach
- Desert: White to light blues in daytime; pink/rose at night
This dust RGB shows a massive dust storm over large parts of Northern Africa on 3 March 2004. What are the features at each letter? Select the correct letter for each feature, then click Done.
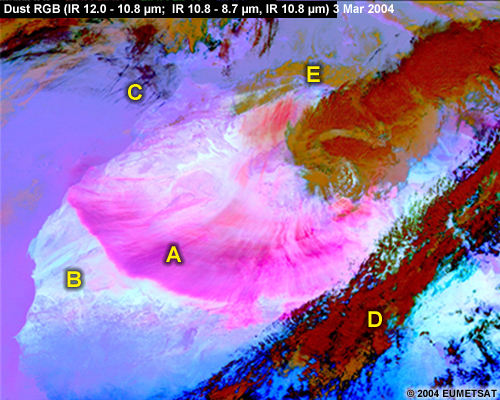
The dust was lifted by strong surface winds generated by a storm to the northeast of the dust pattern. The magenta fan-like pattern corresponds to air-borne dust (A) while the blue background is desert with no dust aloft (B). The dark stripes over the ocean are contrails (thin, high-level clouds or C). Thick cloud systems appear in various shades of brown, with darker tones for high-level tops (D) and lighter tones for low-level tops (E). Play the loop to better observe the evolution of these features.
Dust Detection by Satellite » Dust RGB Products » Diurnal Changes in the Desert
We’ve seen how the desert appears in shades of blue in the daytime dust RGB. As the temperature of the desert drops significantly at night, the brightness temperatures of the three channels decrease accordingly, impacting the colours in the product.
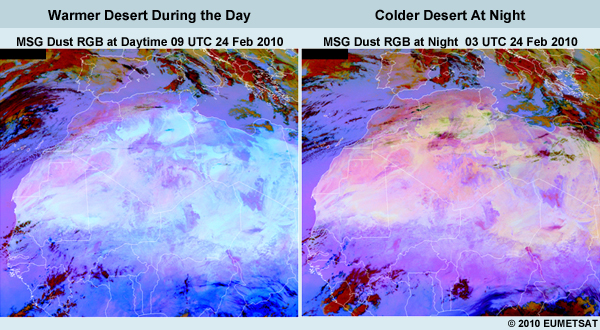
This colour change is mainly due to the influence of the IR 10.8 µm channel, which is used in all in three colour guns. The desert looks blue during the day when the signal from the 10.8 µm channel is strong. But as the signal weakens at night, there’s less of a blue contribution to the overall colour of the image and the desert appears pink/rose. This helps explain why it’s harder to identify dust at night than during the day. The colours of the dust and desert background are too similar to be readily distinguishable.
Dust Detection by Satellite » Dust RGB Products » Dust over the Ocean
It is harder to identify dust over the ocean because:
- There’s less contrast
- The dust disperses as it moves away from the source
Dust Detection by Satellite » Dust RGB Products » Identifying Surface Features
If you’re examining an image and cannot tell if something is a surface or atmospheric feature, see if it remains in same place throughout the day and at night. If so, it’s a surface feature. That’s the case with the feature in the boxes. It's El Eglab Massif, a mountain range in Algeria.

Dust Detection by Satellite » Dust RGB Products » Animating RGB Images
Animating dust RGBs can also help you differentiate surface from atmospheric features. In addition, animations are very useful for tracking the movement of dust storms.
Click Play to view a dust storm that moved over the Atlantic Ocean for a week.
Which of the following are evident in the animation? (Choose all that apply.)
The correct answers are A, B, and C.
Several dust plumes arose from specific source regions over Africa. The dust moved over the Atlantic Ocean, eventually reaching the Americas. As to the last option, dust is usually found at low and middle levels of the atmosphere and is often obscured by higher clouds on satellite products.
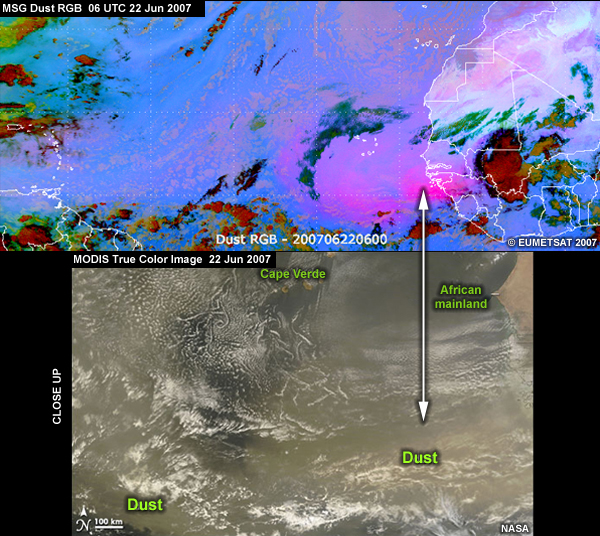
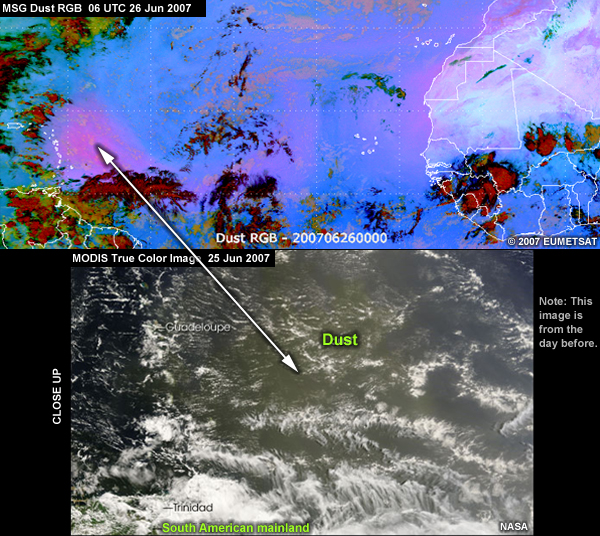
Compare close-up MODIS true colour images at various points in the dust storm's path. Notice how much more detail is available in the MODIS imagery. This is due to its higher spatial resolution and the better contrast between dust cloud areas and the ocean.
22 June
25 Jun
Dust Detection by Satellite » Dust RGB Products » Interpreting Features Other Than Dust
So far, we've focused on dust and desert areas in dust RGBs. But what about the other colours? What do they identify?
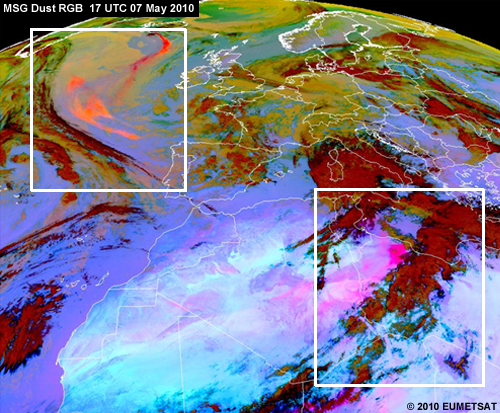
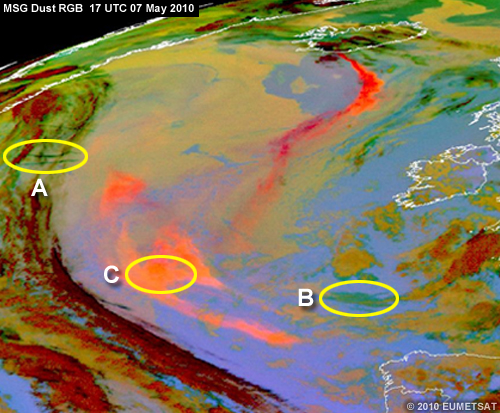
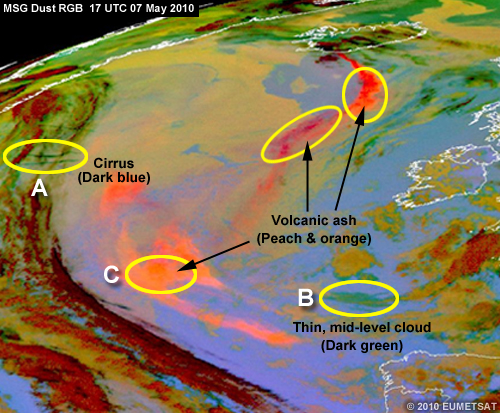
Review the colour interpretation guidelines below, then we’ll apply them to the areas in the two boxes shown in this reference image. The first tab shows the area in the upper left part of the image, the second tab shows the area in the lower right part.
- Dust during daytime: Magenta but slightly reddish at higher levels
- Dust at night: Purple at low level, red at high level
- Clouds:
- Thick/high level: Dark reddish brown
- Thin/high level (cirrus/contrails): Dark blue/black but greens over some desert areas
- Thick/mid level: Brown
- Thin/mid level: Dark green
- Low level: Purples when atmosphere is warm; light brown when atmosphere is cold
- Volcanic ash: Orange or peach
- Desert: White to light blues in daytime; pink/rose at night
Box on Left
For each area indicated, select the feature that it identifies. Then click Done.
The dark blue feature is cirrus; the dark green feature is thin mid-level cloud; and the peach and orange features are volcanic ash. Now go up and select the second tab.
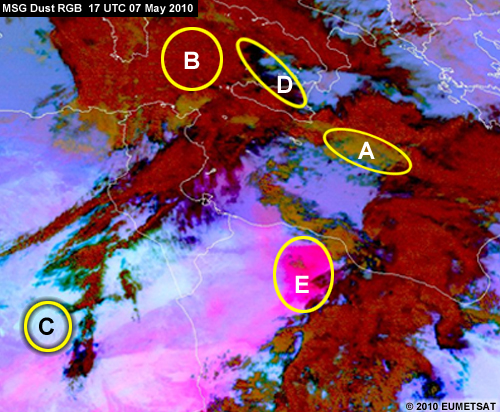
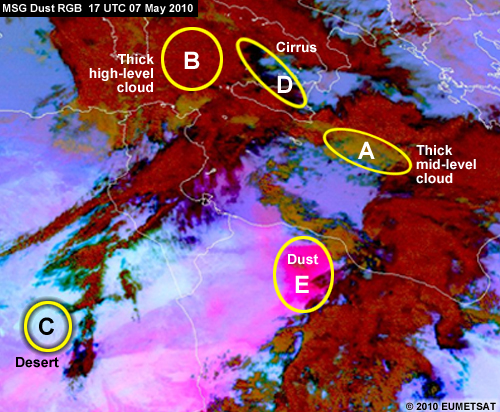
Box on Right
For each letter, select the feature that it identifies.
The light brown feature is thick mid-level cloud; the dark red/brown feature is thick high-level cloud; the light blue feature is desert; the black feature is thin cirrus; and the magenta feature is dust.
Dust Detection by Satellite » Dust RGB Products » Using RGBs to Differentiate Smoke and Dust
Earlier, we saw the difficulties in using single channel images to differentiate dust and smoke. Let's see the benefits of using products made from multiple channels.
This MODIS true colour RGB is made from three visible wavelengths. If you look closely, you can see evidence of strong surface winds blowing from the southwest through the high plains of Texas and Oklahoma. Clouds, smoke, and blowing dust are present but it’s hard to identify all of them. That’s why we’ve pointed out the smoke with white arrows and the dust with red arrows.
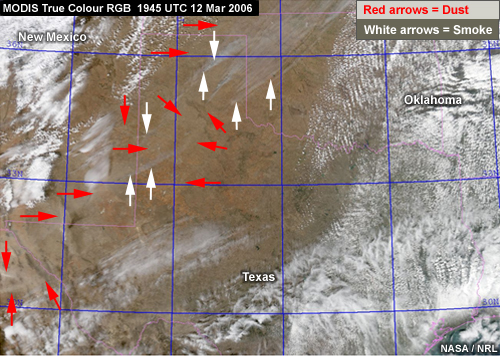
Let's switch to NRL's multispectral MODIS dust enhancement product. Both features are clearly evident, with smoke in blue and dust in orange.
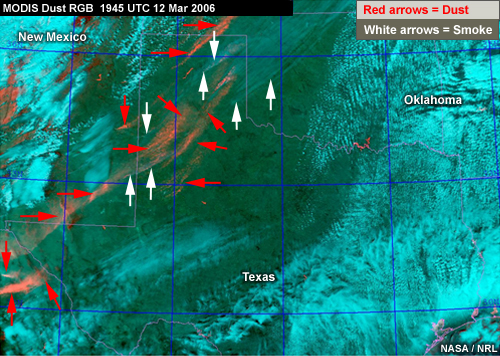
For each area pointed out on the image, select the feature that it identifies. When you are finished, click Done.
The dust and smoke have slightly different colours. Dust is brown and smoke is gray. But it's hard to really distinguish them. The NRL dust enhancement product makes it much easier. The smoke is greyish pink while the dust is orange.
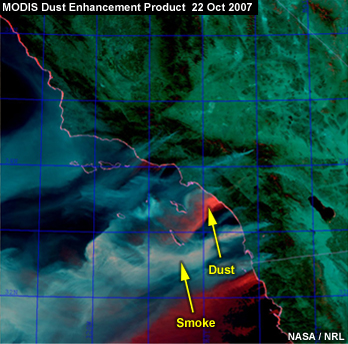
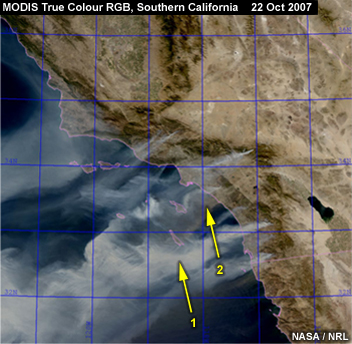
Which feature is at a higher altitude, the dust or the smoke?
The correct answer is B.
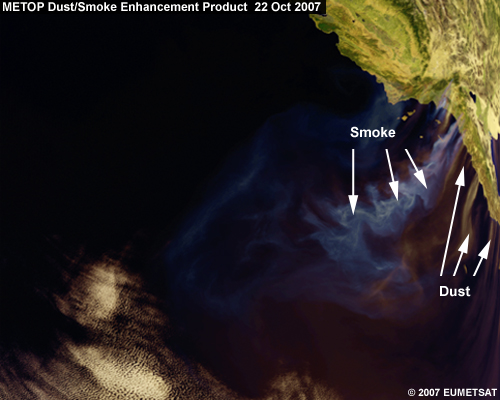
The smoke is higher since the dust disappears under it as it heads out to sea. This dust/smoke enhancement was made from a different satellite (METOP) but shows the same scene. The colours are slightly different but the information is the same.
Dust Detection by Satellite » Tracking Dust Storms with the SAL Product
Dust Detection by Satellite » Tracking Dust Storms with the SAL Product » Using the SAL Product
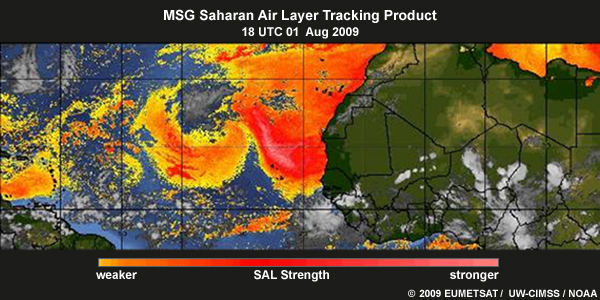
The Saharan Air Layer (SAL) is a dry, stable air layer over the Atlantic Ocean that comes from the Sahara desert and contains mineral dust. The SAL tracking product is used to monitor this layer. Since it separates areas with a strong dust load and/or dry air at low to mid levels (approximately 1500 to 4500 m) from tropical air masses with little dust, it complements the dust RGB.
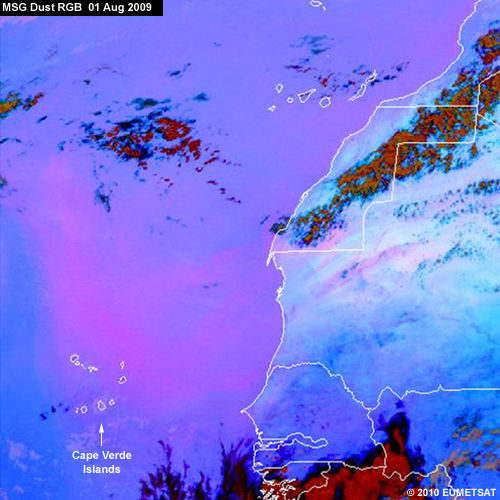
In the SAL product, water/ice clouds appear in shades of grey while SAL areas range from yellows to reds and white. The remaining pixels are blue over water and greens to browns over land. In this example, the SAL is evident as the reddish/white area north of the Cape Verde Islands and clearly corresponds to a dust cloud.
Notice the good correspondence between the dust areas in the RGB product and the stronger SAL in the SAL tracking product (area A).

Areas over the ocean that are free of both dust and clouds, such as region B, are clearly evident in both images. However, some ocean areas, such as region C, are violet in the dust RGB but still have a relatively strong signal in the SAL product. This means that they probably contain low- to mid-level dry air with little to no dust or moist tropical air with dust.
To summarize the SAL product:
- Weak to medium SAL (yellows to reds) usually indicates low- to mid-level dry air with possible dust; the Saharan air layer or mid-latitude dry air intrusions will produce this signal
- Strong SAL (whites) indicates very dry lower- to middle-level air with embedded dust likely
Real-time SAL products are used in nowcasting during, for example, hurricane seasons. The products are available at http://cimss.ssec.wisc.edu/tropic2/real-time/salmain.php?&prod=splitEW&time.
Dust Detection by Satellite » Confirming Dust Height
Dust Detection by Satellite » Confirming Dust Height » CALIPSO
We can supplement information from the dust RGB by superimposing CALIPSO measurements of cloud height, cloud phase, and aerosol characteristics. CALIPSO is a joint NASA/CNES satellite mission that studies the impact of clouds and aerosols on the Earth's radiation budget and climate. CALIPSO stands for Cloud-Aerosol Lidar and Infrared Pathfinder Satellite Observations or CALIPSO.
This EUMETSAT dust RGB animation shows a Haboob over Argentina during daytime on 29 October 2010. Haboobs are the true walls of dust and sand that most people think of as strong dust storms.
Play the animation, noticing how strong winds from a thunderstorm outflow create a northward-moving dust cloud (in magenta).
It's hard to determine the height of the dust storm from the RGB alone. But adding a CALIPSO profile provides precise information. In this close-up image, the white line shows the portion of the storm that CALIPSO is sampling. It indicates that the dust is fairly low level, mostly 1 to 2 km high.
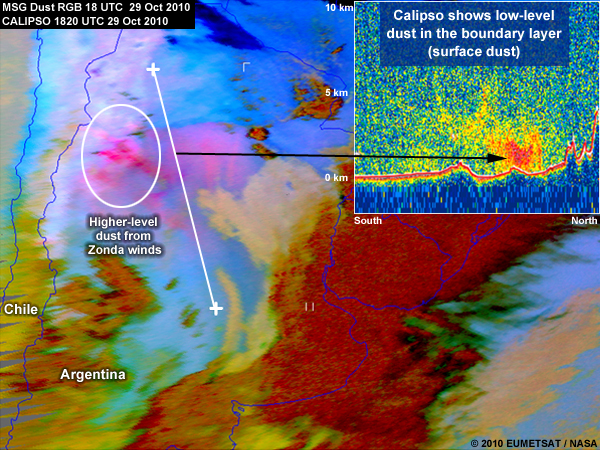
Notice that most of the orange dust on the CALIPSO plot has ragged edges. That’s consistent with the generally diffuse nature of dust in the atmosphere. But on the northern edge of the dust, the plume terminates abruptly, indicating the wall of dust.
Areas within a dust storm can differ. For example, the dust outbreak in the white oval is caused by strong winds crossing the Andes, known as “viento blanco.” They are probably producing high-level dust.
Dust Detection by Satellite » Confirming Dust Height » EUMETSAT's Experimental Colour Scheme
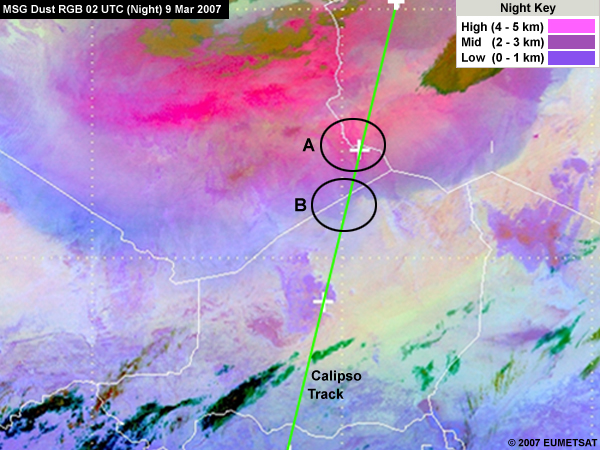
There's another way of determining the height of a dust cloud: using EUMETSAT's experimental colour scheme with its dust RGB. Note that the scheme is only valid for transparent (not very thick) dust clouds, a condition often seen when dust clouds have moved away from their source region.
In this close-up image, the colour scheme indicates that the dust in circle A is higher than in circle B. Let's test this with CALIPSO data.
CALIPSO shows the layer of dust sloping upward from south to north. The plot confirms that the highest dust in the RGB is in the orange/rose areas near letter A, while the purple dust near point B is shallower.
The terrain trace in the CALIPSO plot also helps identify a mountain range, Massif de l'Air. The purple colouration in the RGB may make you think that it's low-level dust, but CALIPSO shows little dust in the vicinity. Plus its unusual shape should help you realize that it's not dust.
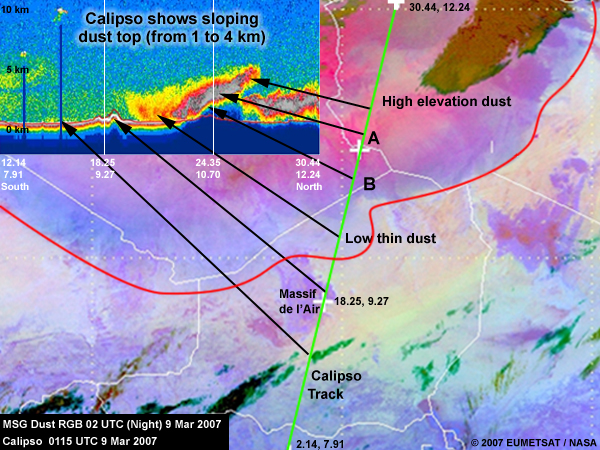
By adding CALIPSO observations to the dust product, we can also outline the southern boundary of the dust outbreak (the red line).
Dust Detection by Satellite » Confirming Dust Height » Comparing MODIS and CALIPSO

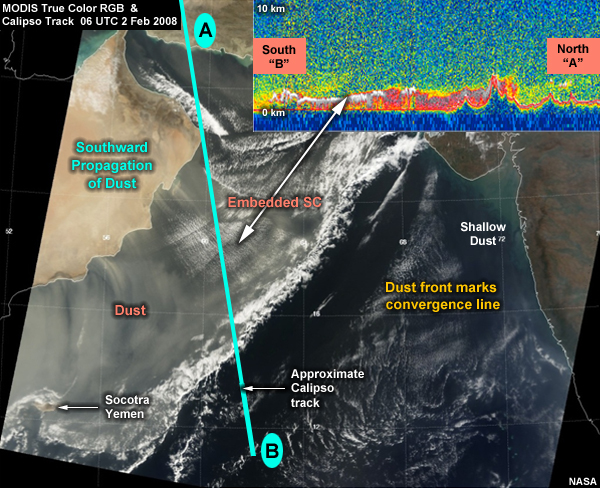
This MODIS true colour image shows a cold front that's moved over coastal waters off the Arabian Peninsula, with a dust outbreak over the Arabian Sea. Which statements apply to the region between points A and B? Use the CALIPSO trace for clues.
The correct answers are C, D, and E.
The product shows stratocumulus streaks embedded within a dust cloud. The dust streaks suggest that northwesterly winds are blowing dust over the sea. CALIPSO suggests a shallow, low-level dust layer within a cool, stable air mass, which is probably making visibilities poor.
Dust Detection by Satellite » Other Dust Products
Dust Detection by Satellite » Other Dust Products » Chinese Dust Product
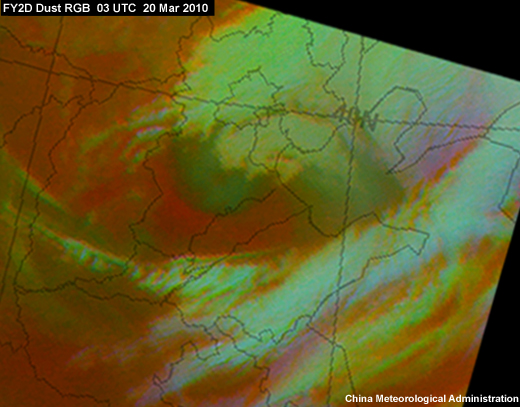
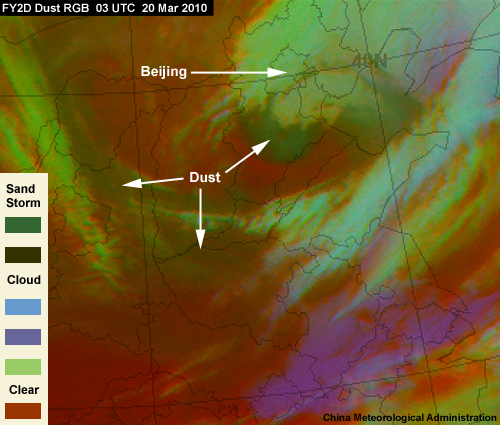
The geostationary Chinese satellite FY2D has different channels than MSG so its dust RGB is made in a different way. As a result, dust is dark green or brown rather than magenta.
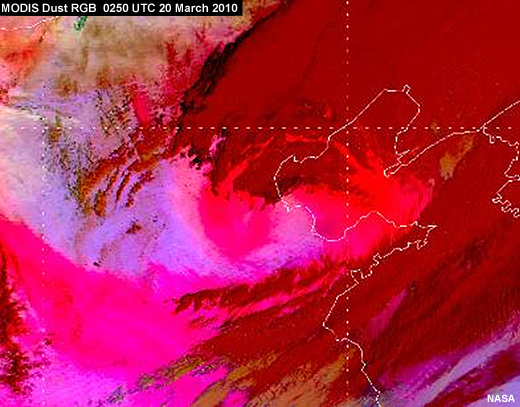
Many dust storms occur over the Gobi Desert and affect Mongolia and China. This Chinese dust RGB shows one such storm that affected northeastern China, including Beijing, on 20 March 2010. The dust appears in dark green to the south and southwest of Beijing. The light green and blue areas to the north and east of the dust are the cloud band structures of a low-pressure system.
Dust Detection by Satellite » Other Dust Products » Comparing the Chinese and MODIS Products
China Dust RGB
MODIS Dust RGB
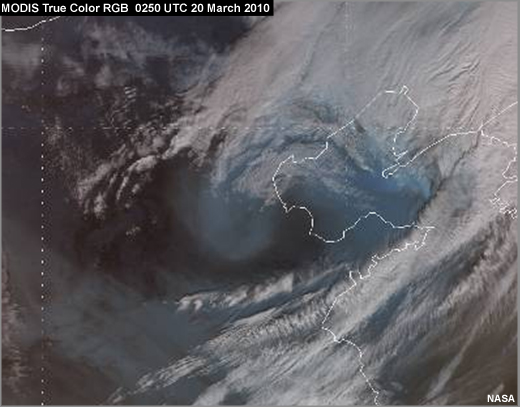
MODIS True Colour
Compare the Chinese dust RGB with the MODIS true colour and dust RGB products. Which shows the most or broadest areas of dust? (Choose the best answer.)
The correct answer is B.
The dust areas depicted in green and dark green on the Chinese product match the magenta areas in the MODIS dust RGB. However, the MODIS dust RGB has better spatial resolution and ends up showing wider areas of dust. The MODIS true colour image complements them, showing dust in shades of gray.
Dust Detection by Satellite » Other Dust Products » The SAF Nowcasting Dust Flag
Dust RGBs provide a "subjective" way of analyzing dust, making use of pattern and colour identification. But several "objective" products are available to help with dust analysis. Among them is the dust flag product from the EUMETSAT Satellite Application Facility, which supports nowcasting and very short-range forecasting (SAFNWC).
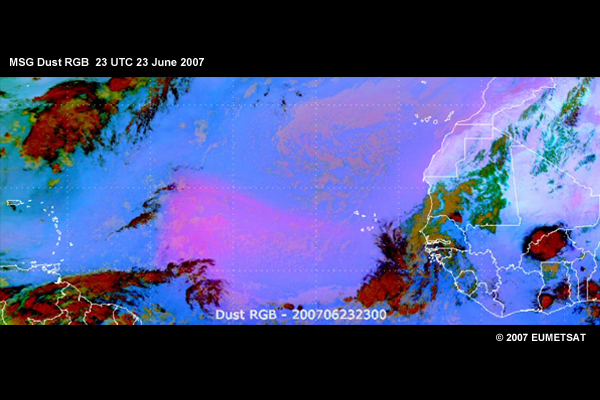
Compare the SAFNWC dust flag in the cloud mask product with the dust RGB for 23 UTC 23 June 2007. Notice how nicely delineated the features are in the dust flag product. For example, the dust in bright green is separated from the low clouds in light orange and the very low clouds in dark orange in the area from Cape Verde to the mid-Atlantic Ocean.
MSG Dust RGB
SAFNWC Dust Flag
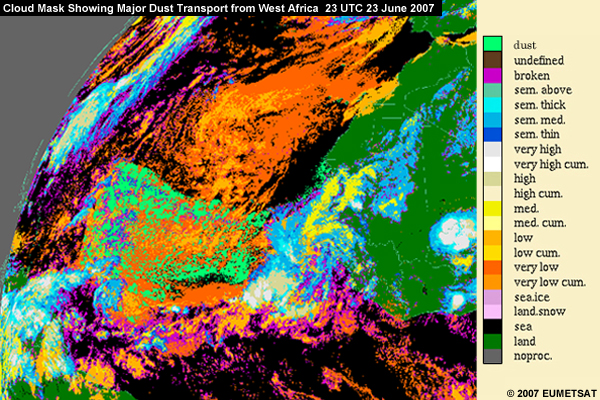
The effectiveness of the dust flag product comes from its use of different criteria for time of day (day and night) and background (land or ocean). The product is available every 15 minutes. However, it is not available over land at night. For more information, see the SAFNWC website (https://www.nwcsaf.org/HD/Main.jsp).
Dust Models
Dust Models » Dust Modelling
In the next section, we present a general process for forecasting dust storms, which incorporates satellite imagery (including RGB products), surface and upper-air observations, NWP models, and dust/aerosol models. Before we examine the process, we'll take a brief look at dust forecast models and identify their characteristics and types.
Dust models combine dust source information with predictions of the atmosphere to forecast the occurrence of dust storms. Dust models essentially simulate the atmospheric dust cycle. This includes emissions from source areas, turbulent diffusion, advection, convection, sedimentation, and dry and wet deposition.
The key component of a dust forecast model is its treatment of dust sources and emissions. This is dependent on having accurate input. But problems with the data, such as its being inaccurate or at a higher spatial scale than the model can use, make this challenging.
Dust emission schemes require the following input:
- Land use type and location of sources: Traditionally, models have used the bare ground categories of land cover maps to locate dust sources. But new model representations of dust sources are based on topographic, hydrologic, and geomorphologic considerations or are derived directly from satellite data. The latter include surface reflectance, frequency of high aerosol values, and ultraviolet-visible albedos. These create a much more refined view of global dust source regions.
- Friction velocity: As you'll recall, dust storm generation requires high wind, wind shear and turbulence, and unstable boundary layers. Friction velocity derived from NWP models expresses these parameters and is the key meteorological variable in dust emission modelling. Because dust emission is a threshold phenomenon, models use threshold friction velocities above which dust emission can occur. These may be constant or can depend on other soil features such as texture and humidity.
- Soil texture: Some simple models assume a constant distribution of soil size while others estimate mass fractions of clay, silt, fine to medium sand, and coarse sand.
- Soil humidity: Soil water can inhibit dust emission by increasing the cohesiveness of soil particles. Dust models typically get their soil moisture information from NWP models, where soil moisture is tied to precipitation. Model estimates of precipitation come from ground, radar, and/or satellite-based observations.
- Surface roughness length: Some models are starting to use satellite-derived estimates of roughness length to account for the fact that vegetation, pebbles, stones, and other non-erodible elements dissipate part of the wind momentum, which limits the amount available to promote saltation and dust emission.
Dust Models » Dust Model Limitations
Here are some of the issues that can limit the accuracy of dust models.
- Due to the relationship between wind and dust, small errors in a model's surface friction velocity lead to large errors in dust emissions. This makes the accuracy of the wind speed used in dust models crucial.
- Models tend to underestimate surface wind speeds over source regions.
- Models do not account for specific meteorological situations that are responsible for dust emissions, such as density currents and squall lines.
- Models are good at reproducing the spatial-temporal variability of dust emissions caused by large-scale dynamics, such as prefrontal and postfrontal winds. But dust emissions related to moist convective events (Haboobs) are often misrepresented.
Note that the use of wind fields derived from mesoscale models can improve forecasts when high resolution is essential, for example, for dust storms promoted by gap flow.
Dust Models » Current Dust Models
Here are the mesoscale and global-scale dust models that are currently available.
Mesoscale models:
- COAMPS, DTA-MM5, and DTA-WRF from the US Department of defense (DoD)
- BSC-DREAM8b and NMMB/BSC-Dust (regional) from the Barcelona Supercomputing Center (BSC) for Northern Africa, the Middle East and Europe
- Chimere-DUST from the IPSL/Laboratoire de Météorologie Dynamique (LMD) ) for Northern Africa, the Middle East, and Europe
- SKIRON from the University of Athens (Greece) for Northern Africa, the Middle East, and Europe
- CUACE/DUST from the China Meteorological Administration (CMA) for East Asia
- MASINGAR from the Japan Meteorological Agency (JMA) for East Asia
- ADAM from the Korea Meteorological Administration (KMA) for East Asia
Global-scale models:
- DTA-GFS, NAAPS, and NOGAPS from the U.S. DoD
- IFS-GEMS from the European Center for Medium-range Weather Forecasting (ECMWF)
- GFS-GOCART from the U.S. National Centers for Environmental Prediction (NCEP)
- NMMB/BSC-Dust (global) from the Barcelona Supercomputing Center
- MOCAGE from Météo-France
Dust Forecast Process
Dust Forecast Process » General Guidelines
Before developing a dust forecast, you should be familiar with your area of responsibility and local rules of thumb. In particular, you should know:
- The types and locations of local dust source regions; for example, if there are lake beds, salt flats, or newly developed drought regions
- The types of soil present
- The impact of local terrain on wind speeds
- The wind direction with respect to local dust source regions
- How the winds align from the upper levels down to the surface, especially during winter
- If available, the dust climatology of the region of interest from models, satellites, and other dust observations
The dust forecast process is divided into three parts, defined by the forecast lead time:
- Long range, 72 to 180 hours
- Medium range, 24 to 72 hours
- Short range, 0 to 24 hours
The use of dust model forecasts depends on the time range of the forecast. Short-range dust forecasts tend to rely on real-time analyses. Medium- and long-range forecasts rely far more on model output from mesoscale and global scale models. Mesoscale models generally provide high-resolution regional dust predictions for up to 3 days, while global-scale models provide lower-resolution global dust predictions for up to 5 to 6 days.
Here are some tips to keep in mind when viewing model guidance. When possible:
- Consult different dust products from the same dust model or a different model since each product provides slightly different information
- Animate forecast products to identify mesoscale dust features and their movement, extent, and location
A final note: COMET's Forecasting Dust Storms, V2 module presents the same forecast process as the one that you're about to see but applies it to a case as well. The case is from the Middle East and uses U.S. Department of Defense data, which are not available to those outside the agency. However, you might want to review the case to see how the process can be applied. To do so, go to http://www.meted.ucar.edu/mesoprim/dust/, begin the module, and select the Forecasting Dust Storms section.
Dust Forecast Process » Long-range Forecast Process
The long-range (72- to 180-hour or 3- to 5-day) dust storm forecast process has two steps.
- Look for large-scale, synoptically driven dust events in the 3 to 7.5-day range in global models such as DTA-GFS, NAAPS, IFS-GEMS, GFS-GOCART, NMMB/BSC-Dust, and MOCAGE.
- Look for model-forecast midlatitude troughs that drive prefrontal and postfrontal dust storms in winter and that can amplify the large-scale wind patterns associated with summer events. These large-scale waves are resolved by global NWP models, such as GFS, IFS, NMMB, and NOGAPS. The associated dust outbreaks are modeled by global dust models, such as DTA-GFS, NAAPS, IFS-GEMS, GFS-GOCART, NMMB/BSC-Dust, and MOCAGE.
Dust Forecast Process » Medium-range Forecast Process
For the 24- to 72-hr forecast, use mesoscale dust model output from models such as BSC-DREAM8b; NMMB/BSC-Dust; Chimere-DUST; SKIRON for Northern Africa, the Middle East, and Europe; CUACE/DUST, MASINGAR, and ADAM for East Asia; and larger-scale dust forecasts from the global DTA-GFS, NAAPS, IFS-GEMS, GFS-GOCART, NMMB/BSC-Dust and/or MOCAGE. Guidance from NOGAPS, GFS and or IFS shows the evolution of larger-scale atmospheric features and is helpful for identifying conditions favorable for a blowing dust event.
Here are the steps in the medium-range dust storm forecast process.
Step 1: Examine the following charts:
- 300-hPa height and wind forecast charts to track troughs and jet streaks; briefly examine upper-tropospheric winds to identify the presence of any jet streaks, especially for cool-season dust storms; jet streaks within a pronounced upper-level trough are indicative of an intensifying low-pressure system with stronger surface fronts and associated winds
- 500-hPa height and relative vorticity forecasts to identify and track troughs and vorticity maxima
- MSLP and surface wind forecast charts for fronts and potentially strong wind conditions
Step 2: Looking at the forecast soundings from a model, determine the forecast stability and wind profile at your forecast time of interest.
Step 3: Check the 6-hourly precipitation and 700-hPa relative humidity forecast charts to determine where increased moisture and precipitation are anticipated since they decrease the probability of dust lofting.
Step 4: Combine forecasts of surface friction velocity, surface winds, and soil wetness with your knowledge of dust source areas to see if the criteria for a potential blowing dust event are met. Recall that friction velocity incorporates atmospheric stability and wind speed into one variable.
Step 5: Examine forecasts of surface visibility and/or surface concentration due to dust. Compare them to forecasts of winds through the mixed layer and dust optical depth to help assess changes in geographical extent and intensity with each successive model run.
Step 6: From the model output and your initial analysis, develop a best-guess forecast as to the onset and duration of any dust events in your area of responsibility in the 24- to 72-hr window.
Dust Forecast Process » Short-range Forecast Process
The process for creating short-range (0- to 24-hr) dust forecasts includes the following steps.
Step 1: Analyze the present state of the atmosphere by looking at satellite imagery, upper-air charts, and surface analyses, keeping in mind the location and characteristics of relevant dust source regions.
Step 2: Examine the latest observed and/or forecast soundings. Note the strength of any inversions (usually during summertime) and determine if they will break due to turbulent mixing and daytime heating that would ripen the environment for a dust outbreak.
- A dry adiabatic lapse rate from the surface through a deep mixed layer allows the dust to loft to great heights, especially if winds are from the same direction and increase with height through the layer
- Note that dust storms generally occur in this kind of environment and that the strongest wind speed aloft within the dry adiabatic layer can be brought to the surface
- The height or top of an elevated dust layer can be approximated by determining where the lapse rate becomes less than the dry adiabatic lapse rate
- Dust storms are less likely in a stably stratified boundary layer although narrow plumes of blowing dust are still possible
Step 3: To determine the potential duration and type of dust event, pay special attention to dust lofting in your area of responsibility, local rules-of-thumb about advection, and geographic features such as the location of dust source regions, terrain, vegetation, and water sources. Also note where precipitation has fallen in the past 48 hours and whether it was convective or stratiform.
Step 4: Use satellite dust enhancement products (such as enhanced infrared imagery) and RGB and other multispectral imagery tuned for dust detection. Integrating these products with surface observations can provide information about the current extent and location of existing dust plumes and fronts.
Step 5: Make a best-guess forecast as to the onset, duration, and persistence of any dust events in your area of responsibility in the very short term, using short-range forecasts from mesoscale models as guidance. The global models can resolve large-scale features that drive smaller-scale dust events in the short term but cannot resolve more localized dust features.
You have reached the end of this chapter. Click the Table of Contents button at the top of the page and select Chapter III to proceed.
Select a Section: