Mesoscale Convective Systems
After completing this module, the learner will be able to:
- Recall the structure and lifecycle of different types of tropical MCSs (tropical squall line, bow echo, mesoscale convective complex, mesoscale convective vortex, and non-squall tropical cluster)
- Recognize MCSs in satellite and radar imagery
- List the potential weather hazards most likely associated with each type of MCS
- Identify key dynamic and thermodynamic environments favorable for each type of MCS, including favorable large-scale environments.
- Understand similarities and differences between tropical and midlatitude squall lines
- Describe the geographic climatology of tropical MCSs
Mesoscale Convective Systems Overview/Background
A Mesoscale Convective System (MCS) is an organized group of thunderstorms that produces a contiguous precipitation area measuring 100 km or more in at least one direction. This system grows upscale from convective towers to a convective-stratiform coupled vertical circulation, ultimately meeting its demise as only a stratiform rain region. Tropical convection is most often organized into mesoscale systems, with length scales of 100-1000 km and duration of several hours.

Many different types of MCSs exist and can be characterized by their environmental wind shear. Differences exist between both tropical and midlatitude MCSs as well as oceanic and terrestrial systems. We will explore these characteristics throughout this module. Where possible, we will differentiate between midlatitude and tropical MCS characteristics as there are subtle and not-so-subtle differences.
Mesoscale Convective Systems » Overview/BackgroundClimatology
MCSs produce as much as 90% of rainfall in certain land areas. For the global tropics, they produce more than 50% of the rainfall in heavily raining areas (where the average annual rainfall is greater than 3 mm day-1)
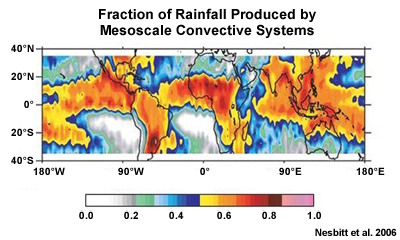
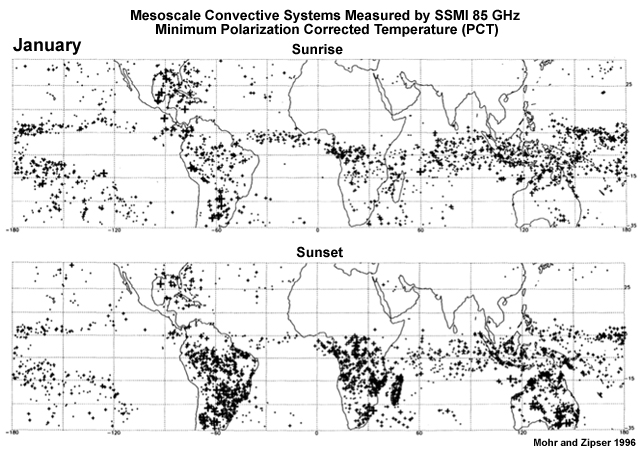
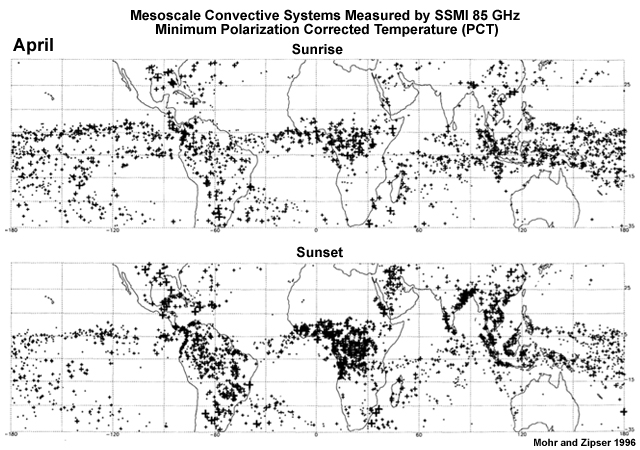
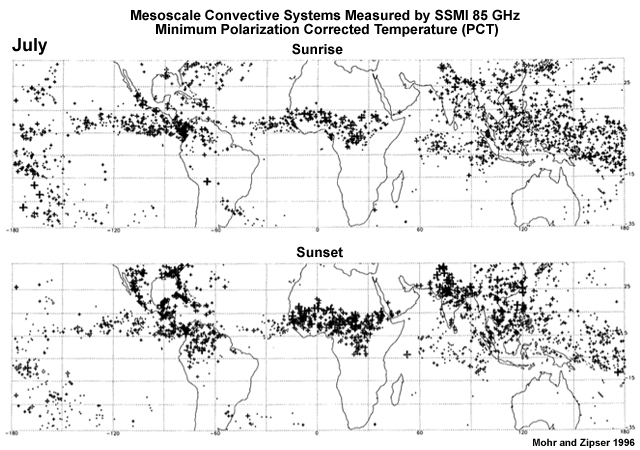
The following MCS climatology over the tropics illustrates the locations where MCSs are commonly found and at what time of year they occur. Note the seasonal maxima and minima as well as the concentrations of MCSs from sunrise to sunset (each pairing of images). This climatology includes all types of MCSs that match the 85 GHz Ice Scattering criteria defined in Mohr and Zipser (1996).
January
April
July
October

Mesoscale Convective Systems » Overview/BackgroundImpacts
Tropical MCSs can produce copious amounts of precipitation. This can quickly lower visibility and cause flooding. Those MCSs with the slowest forward speed (Non-squall Tropical Clusters) and those that last for a long time (Mesoscale Convective Complexes) have greater risk of flash flooding depending on your local hydrological conditions. Other situations like training cells over the same area can also cause flash flooding.
With any MCS, there is the possibility of strong winds, but the more low-level shear present in the environment of the system, the greater the possibility of severe surface winds (Squall Lines and especially Bow Echoes). In environments with more shear, surface winds can reach 100 kts or more. This is extremely rare in the tropics.
MCSs are also one of the important sources of turbulence, namely:
- Convectively induced turbulence (CIT), which occurs within deep convective clouds, updrafts, downdrafts, and thunderstorm anvils and
- Near-cloud turbulence (NCT) in the clear air around the MCS, due to gravity waves propagating from the MCS, unstable upper-level storm outflow, and cirrus cloud bands.
MCSs also produce frequent lightning, small hail, occasional tornadoes, and waterspouts.
Fundamental Characteristics
Fundamental Characteristics Structure
MCSs contain complex updraft and downdraft structures. However, most mature MCSs can be represented as mesoscale updrafts and downdrafts whose arrangement/tilt can differ between the types/modes. The tilt of the updraft is dependent on the environmental shear. Squall lines and bow echoes have the greatest rearward tilt in their updrafts.
At certain times in their lifecycle, each MCS will precipitate from either or both a grouping of convective towers or a stratiform cloud deck. The organization of the stratiform and convective precipitation varies depending on the type/mode. Sometimes different modes occur as stages of an MCS lifecycle.
The lifecycle of a typical MCS begins with a growth phase dominated by convective towers, usually initiated by the daytime heating. These towers grow and loft cloud- and precipitation-sized particles into the upper-troposphere where they spread out to produce a stratiform precipitation region in the mature phase. Stratiform precipitation is also produced from in situ condensation and deposition in the stratiform region. As the system begins to decay, the convective cells taper off and the stratiform rain region dominates.
Fundamental Characteristics » Structure Updraft/Downdraft
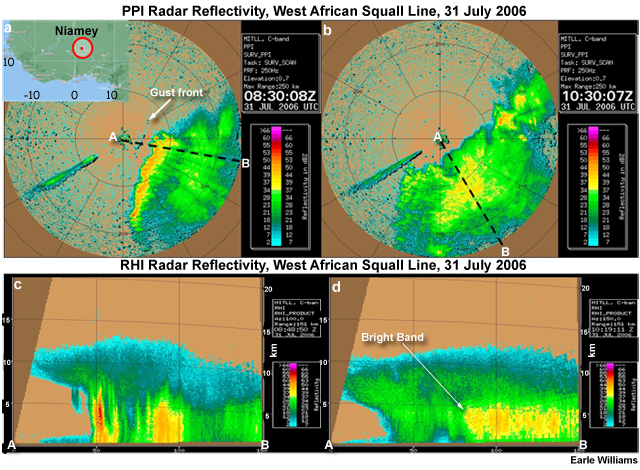
The most prominent dynamical structures in MCSs are convective updrafts and downdrafts and a mesoscale updraft/downdraft couplet in the stratiform region. The updrafts originate from low-level convergence, which in turn builds convective towers through layer lifting/overturning (A). Depending on the environmental shear profile and the system motion, these lofted particles will blow upstream, downstream, or both creating a broadening anvil on satellite imagery and increased low reflectivity in that direction over time. This creates the stratiform precipitation area (B). These lofted particles slowly fall out of the stratiform cloud. As the particles fall, latent cooling (from melting and sublimating particles at or around the melting level and at stratiform anvil cloud base) and precipitation loading make a downdraft and cold pool (C). Some of this downdraft/cold pool air pushes toward the convective updraft at or near low levels increasing the low-level convergence, thus creating a positive feedback that enhances the updraft. The melting of ice particles in the stratiform region generates a layer of high reflectivity called the "brightband".
Squall lines have been categorized, according to the orientation of the convective and stratiform precipitation, as Trailing-stratiform (TS), leading-stratiform (LS), and parallel-stratiform (PS). While the patterns were based on midlatitude cases, they are still applicable in parts of the tropics. The trailing-stratiform lines are the most common but the other two are significant in monsoon areas of southeast Asia, where they occur along the Mei-yu/Baiu front.
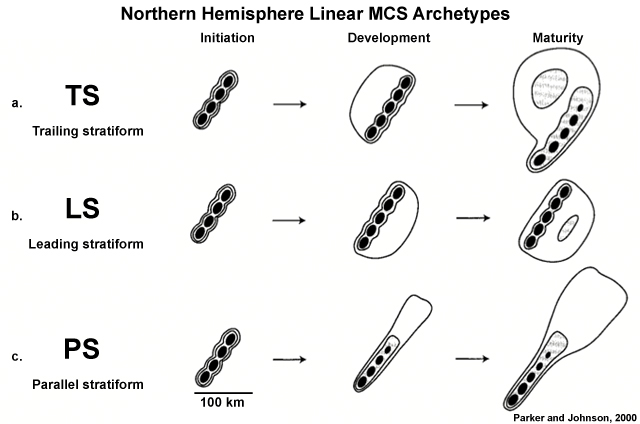
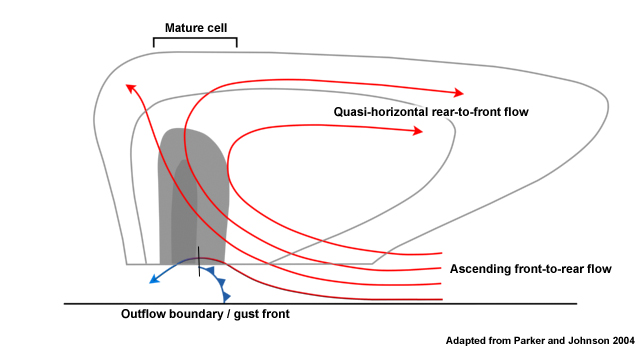
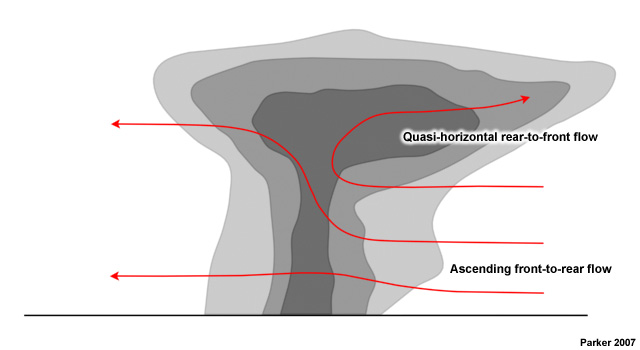
As noted earlier, the low-to-mid-troposphere shear is a major factor in the line orientation, while the CAPE is key to their depth and duration. The different types of line-oriented MCS categories and their line-relative flow are shown in cross-sections below. Generally, the TS systems move quickly in response to the strong perpendicular shear while the other two types of systems move more slowly and exhibit back-building or training of cells, which increases their flash flood potential.
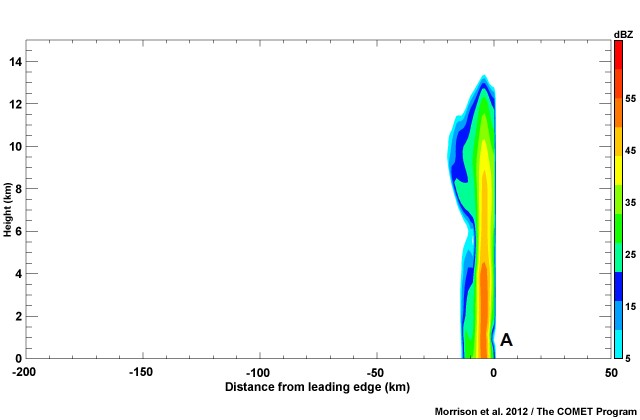
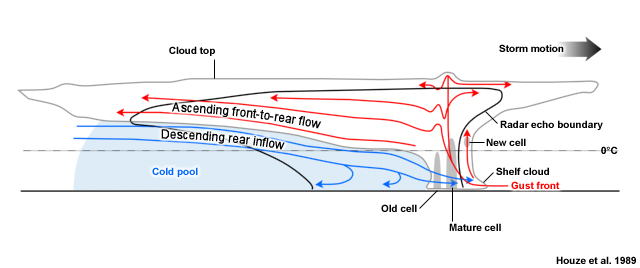
The following vertical cross-sections of large, mature, MCSs show the tilted nature of the updraft/downdraft couplet as well as the complete airflow through the system once it is in the mature phase (red and blue arrows). Note the difference in tilt of the updraft during ascent through the convective region versus in the stratiform region, hinting at the differences in upward vertical velocities. In MCSs with a trailing stratiform region, updraft speeds range from 5-17 m s-1 in the convective region and 35-45 cm s-1 in the stratiform region. Mesoscale downdrafts, in the stratiform region, of the typical tropical MCS are in the 5-25 cm s-1 range.
Trailing (TS)
Leading (LS; Weak Flow)
Leading (LS; Strong Flow)
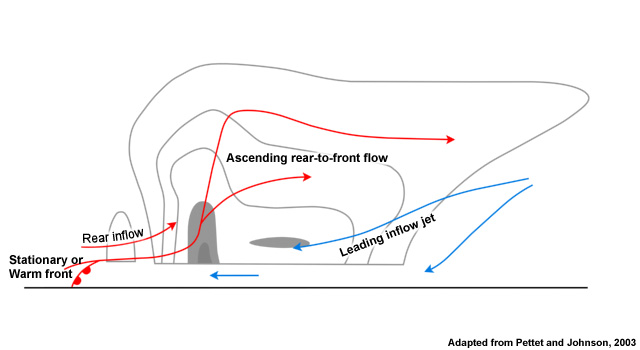
Parallel (PS)
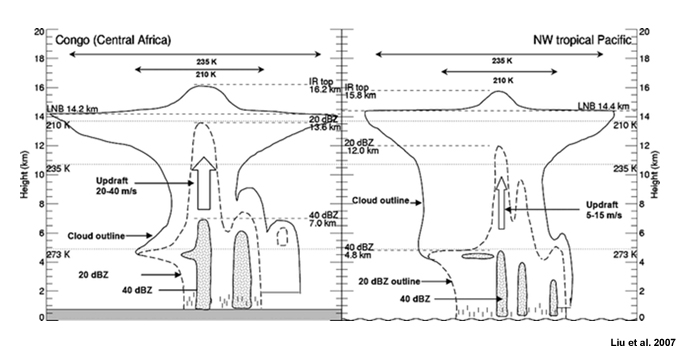
Fundamental Characteristics » Structure Continental Versus Oceanic
The strength and extent of the updrafts and downdrafts vary between continental and oceanic MCSs in the tropics. Typically, oceanic systems have weaker updrafts and thus shorter reflectivity cores and they are also larger than continental MCSs. The graphic below shows some of the differences between continental (left; Congo) and oceanic (right; NW tropical Pacific) mesoscale convective systems.
Fundamental Characteristics » Structure Thermodynamic Profile
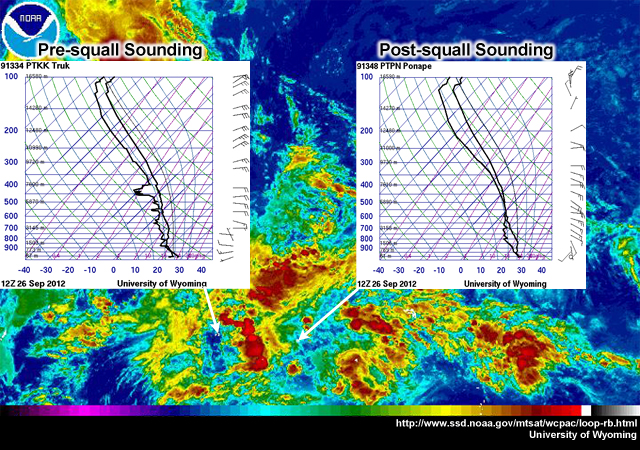
Prior to the passage of MCSs, the environment typically has moderate amounts of CAPE over a deep layer. After the passage, thermodynamic profiles often show an "onion-shaped" low-level temperature/dewpoint profile indicative of downdrafts from the MCS. Relatively dry mid-tropospheric air, which enters from both rear and front of the MCS, is cooled by evaporation of rain, then sinks. The separation between the temperature and dewpoint indicates the warming and drying effects of the subsidence. These unsaturated downdrafts suppress convection in the wake of the MCS. Below are examples of the environment before and after a squall line over the tropical West Pacific.
Fundamental Characteristics » Structure Precipitation
As discussed previously, each MCS will precipitate from both or either of a grouping of convective towers or a stratiform cloud deck, depending on the stage in its lifecycle. Most tropical MCSs will only produce rain, but occasionally a system will produce small hail.
In the following diagram of the lifecycle of a non-squall tropical cluster, you can see the trend in precipitation for the convective (early peak) versus stratiform (late peak) rain regions. Although this graph is for a non-squall tropical cluster near Borneo, the trend is similar for other types/modes of MCSs.
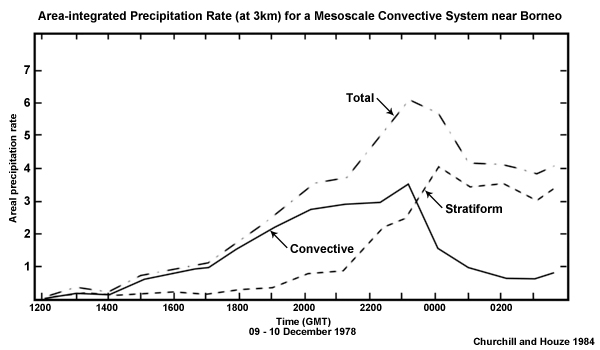
Unlike other convection, MCS precipitation often peaks in the nocturnal hours often even after midnight local time. MCSs are sustained by a warm moist boundary layer, which is replenished at nighttime by a low level jet. Many MCSs have a precipitation pattern and evolution as depicted below based on radar imagery, except for non-squall tropical clusters, which do not have the distinctive arc-shaped leading convective line. However, the rest of the pattern can be similar for most MCSs including the decay of convective cells leaving a dominant stratiform rain region near the end of their lifecycle.
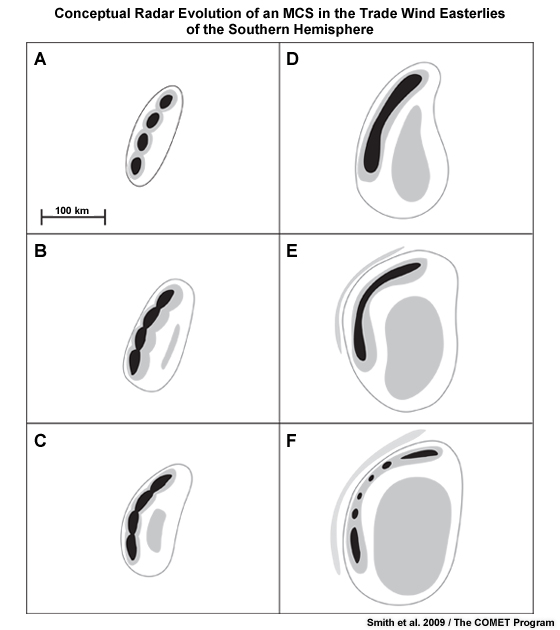
Conceptual radar evolution of a typical tropical MCS in the easterlies of the Southern Hemisphere. Black shading represents radar reflectivities of 50 dBZ and above, gray shading represents 35–50 dBZ and the gray outline represents the 0-dBZ echo boundary. Typically, after the initial cells begin to merge in panel A, one to three hours will elapse between each subsequent stage.
Comparing the precipitation contributions from convective to stratiform regions in MCSs, typically the convective line produces 50-70% of the total precipitation, while 30-50% comes from the stratiform region. Precipitation variations occur due to environment (shear dependency), stratiform-type (leading versus parallel versus trailing), and lifecycle (growing versus mature versus decaying).
In some mature MCSs, a transition zone occurs between the convective and stratiform rain regions, where the precipitation is in transition from convective to stratiform.
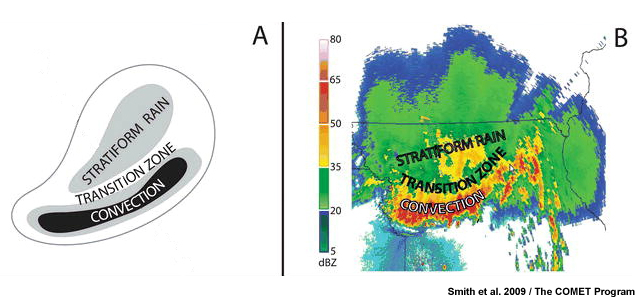
The transition zone is the local minimum in radar reflectivity as well as the area directly beneath the initial upper-level spreading of the convective updraft. This area will have the least amount of precipitation-sized particles because of localized mid-level downdrafts (refer back to the trailing stratiform cross section in the "Updrafts/Downdrafts" subsection).
Propagation
Initially, both tropical and midlatitude MCSs will propagate with the synoptic-scale flow. MCS motion will follow the synoptic flow until a significant cold pool develops which nearly coincides temporally with upper-level anvils merging into a complete cloud shield.
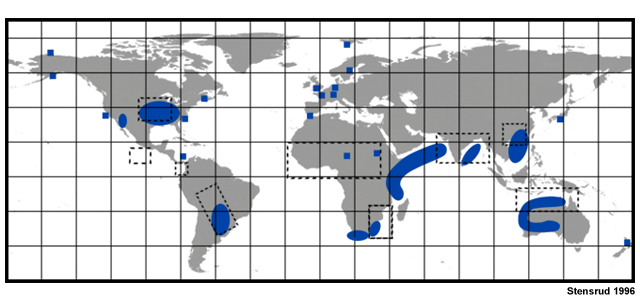
Once the cold pool is established, it is important to understand the low-level jet (likely present in the more organized systems) to help forecast the system motion. The low-level jet is a narrow band of strong winds at or near 2-3 km above the ground. Some low-level jets are predominantly generated at night (e.g., over the US Great Plains) but can be sustained into the following day, while others are more persistent and synoptically-forced, e.g., the African easterly jet. Below you can see the areas of prominent low-level jets (solid blue shade) around the globe and associated regions of MCS activity (dashed boxes).
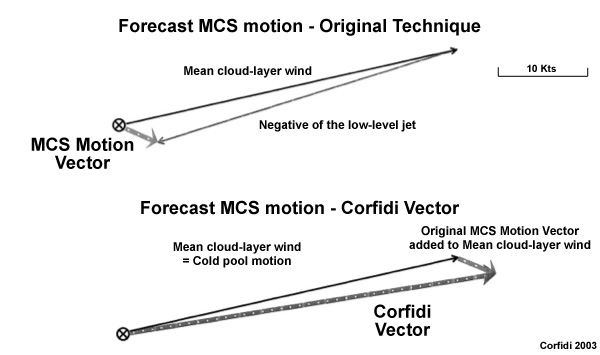
After the establishment of the cold pool, you can use some information about the low-level jet motion vector to establish the new system motion. The motion of the cold pool needs to be added to the average cloud motion to get the new MCS motion vector. The cold pool motion is hard to determine operationally, but can be estimated by adding the negative of the environmental low-level jet vector to the average cloud motion vector to find the cold pool motion vector. Then this cold pool motion vector can be added to the average cloud motion vector to get the final motion vector of the system after it builds a relationship with its cold pool.
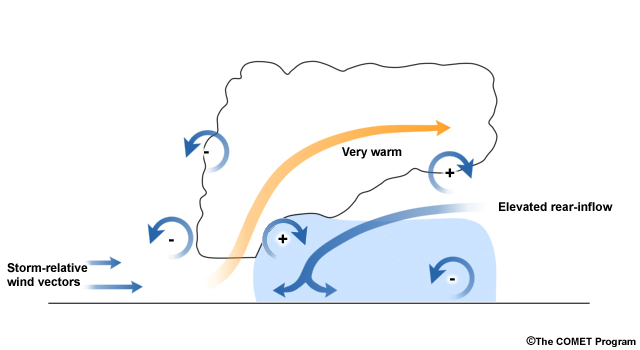
If the downdraft-generated horizontal vorticity balances with the low-level environmental shear ahead of the convective line, then the MCS will maintain its mature phase, continuing its forward propagation. If the horizontal vorticity balance along the outflow boundary/leading edge of the cold pool breaks down, then the outflow boundary gets away from the convective towers, breaking the upward feed of energy. Eventually, cutting off the convective updraft will diminish the stratiform precipitation region, which was fed by advection of the convective updraft precipitation particles.
Below you can see a conceptual depiction of the balance between the cold-pool horizontal vorticity and the environmental shear for a mature, long-lived, tropical MCS.
PropagationCoriolis
The Coriolis force plays a very important role in the organization and propagation of MCSs. In the midlatitudes where the Coriolis force is stronger, if MCSs last long enough, they will become asymmetrical. That is, their cloud and precipitation pattern will favor the poleward side of the system, with more stratiform precipitation and less convective precipitation. The convective precipitation and cold pool spreads preferentially equatorward, inducing new convection on the equatorward side of the system. The system motion has a component towards the equator, where new cells are forming on the leading edge of the cold pool, and an eastward component from the mean layer steering winds.
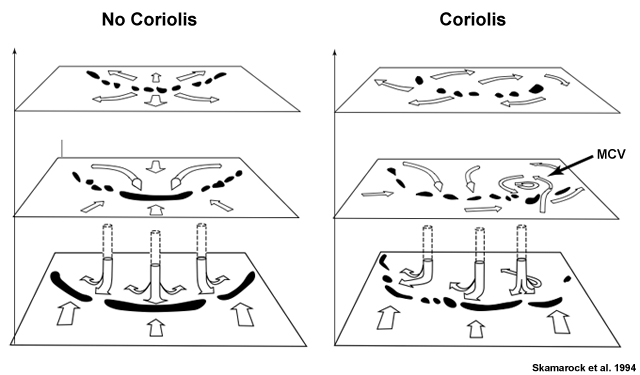
Simulated, long-lived squall lines with and without Coriolis force. If this system is in the midlatitudes, the viewer is typically looking west. If this system is in the tropical easterlies, the viewer is typically looking east.
In the tropical easterlies, these equatorward and poleward shifts of the precipitation pattern and motion will be opposite of the above. However, in the tropics, which have little or no Coriolis force, the systems tend to not have a directional shift over time unless they are bordering on the subtropics, where the Coriolis force is large enough to affect the flow, or they are long-lasting enough to be affected by the Coriolis force.
Wind Shear Spectrum and Effects
MCSs in both the midlatitudes and tropics usually have weak or straight-line mid-level shear profiles. Most of the wind shear in these environments is found in the low-levels (often generated by a low-level jet). The balance between the vorticity due to the shear and the vorticity due to the cold pool keeps the leading edge of the cold pool beneath the convective towers and maintains the convective and mesoscale updrafts and corresponding downdrafts. Without this low-level shear, MCSs would not last nearly as long. The greater the low-level shear, the greater the possibility of long-lived, strong, surface winds.
MCSs can be placed on a spectrum based on their low-to-middle tropospheric wind shear. In general, tropical MCSs develop in environments with weaker cold pools and weaker horizontal wind shear than the midlatitudes. Between 950 and 650hPa, non-squall tropical clusters (the weakest of the MCSs) have shear less than 5 m s-1 while tropical squall lines with bow echoes (the systems with the greatest possibility of strong, straight-line surface winds) have mean shear of about 13 m s-1. By comparison 10 m s-1 is the upper threshold for weak shear environments in midlatitude MCSs.
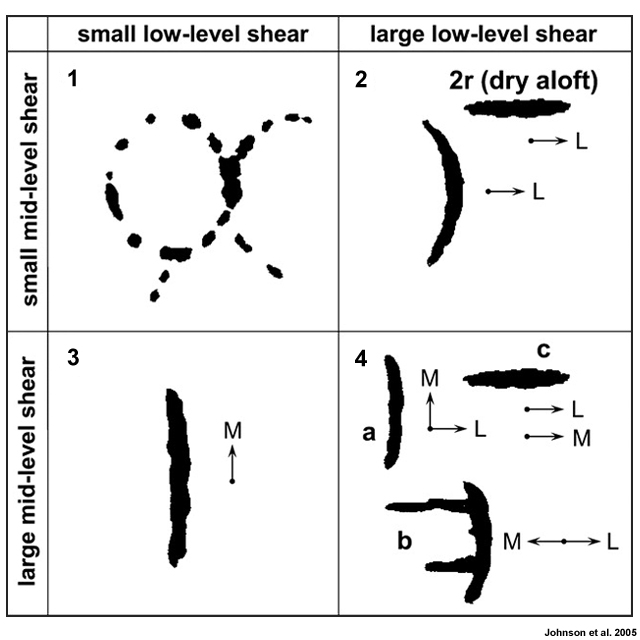
Four main categories of convective structures for given vertical shears in the lower troposphere (1000–800 hPa) and at middle levels (800–400 hPa) based on the Coupled Ocean Atmosphere Response Experiment (COARE) observations, but modified to include results from the South China Sea Monsoon Experiment (SCSMEX). Lengths of the schematic convective bands are 100–300 km; line segments in upper-left panel are up to 50-km length. Cutoff between 'strong' and 'weak' shear for lower layer (1000–800 hPa) is 4 m s-1 and for middle layer (800–400 hPa) is 5 ms-1. Arrows marked L and M are shear vectors for lower and middle layers, respectively.
With an increase in low-level shear, the possibility of strong/damaging surface winds and the longevity of the system increases.
Types/Modes
As they are organized by their environmental wind shear, we can then explore different types/modes of MCSs from least to greatest environmental shear.
Types/Modes Non-squall Tropical Clusters
Like all MCSs, non-squall tropical clusters go through a life cycle of convective, convective and stratiform, then solely stratiform in character. Non-squall tropical clusters have the least amount of environmental shear before their initiation, and never achieve strong shear between 700 and 250hPa. West African non-squall clusters are dramatically different than their squall cluster/line cousins which exhibit a strong mid-level jet in the 700-600 hPa layer giving them ample shear. Because of the lack of shear in the mid-levels, non-squall tropical clusters will align with the shear vector and thus gain little to no energy due to generation across the shear vector. Non-squall tropical clusters are slow moving, typically less than 5 m s-1, slower than a typical easterly wave, with which they are often associated. They usually diminish after they fall behind the easterly wave's 700-hPa trough axis.
Types/Modes » Non-squall Tropical ClustersEnvironment
Environments that support non-squall tropical clusters are typically devoid of strong low-level shear. In several cases, generation of the system comes from previous convective outflows/cold pools. In these cases, the lifting mechanism is the leading edge of the cold pool or the outflow boundary. In supportive environments, cold pools will spread evenly in all directions (except where topography hinders), triggering convection along the leading edge, forming non-squall tropical clusters with a circular radar echo pattern (1st panel).
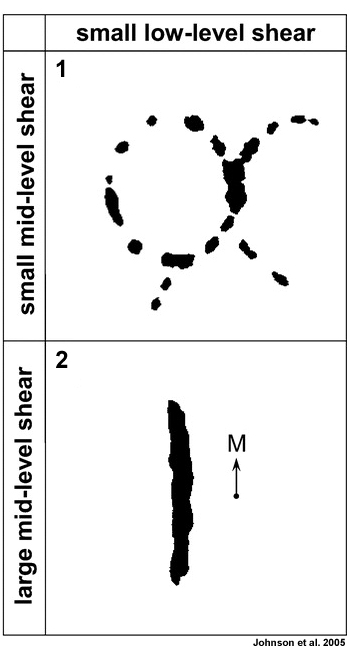
In other cases, leftover/stalled boundaries from previous convection can be the trigger for convection. Then, the convection will be more linear in form, but never really achieve the size or organization of a squall line or MCC. Note the qualitative shear listed for these two cases, one with weak low-level shear and the other with large mid-level shear parallel to the convective line.
Large-scale flow patterns are usually benign, thus there is not a preferential or composite large scale environmental pattern to show for this type of MCS. These systems have moderate convective instability; usually relatively weaker than other the MCS types.
Types/Modes » Non-squall Tropical ClustersExamples
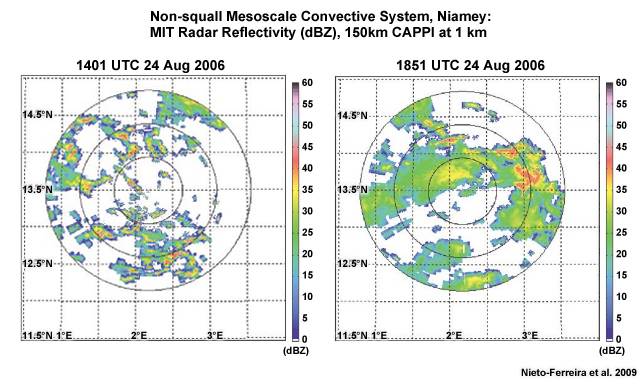
Radar imagery is most useful for identifying non-squall clusters, which are poorly-organized and less intense then squall lines and MCCs.
Radar
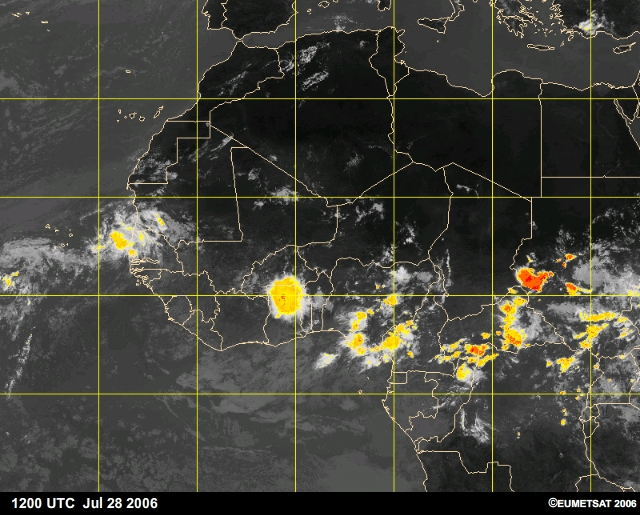
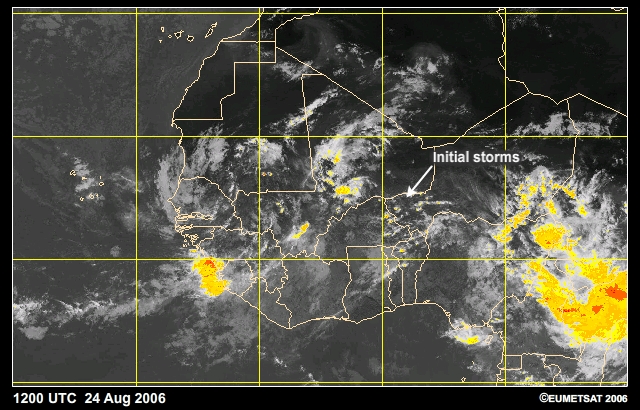
Satellite
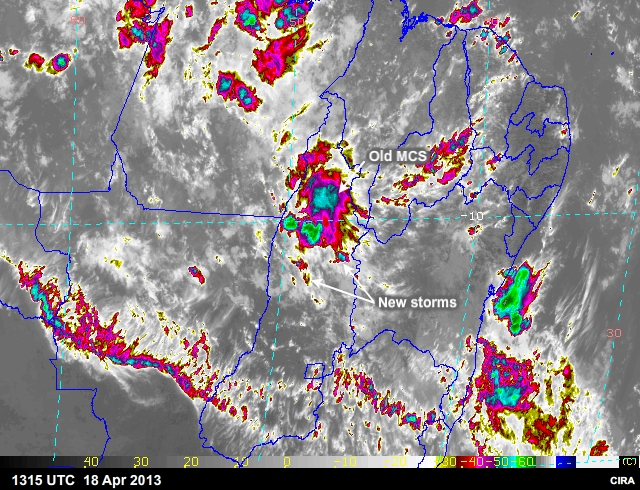
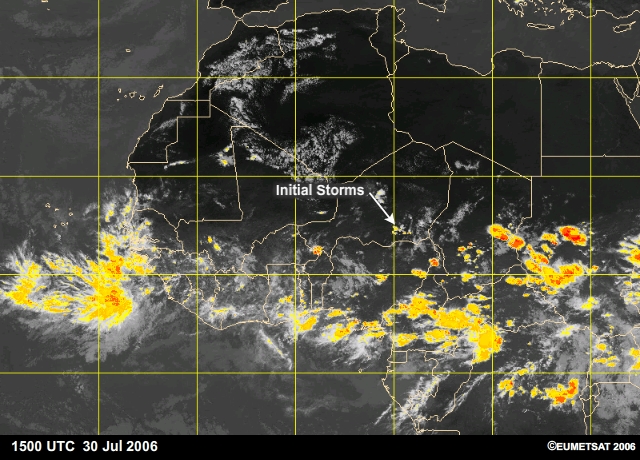
Non-squall clusters do not have a defining signature in IR satellite images. Some West African non-squall clusters are identified in contrast to squall clusters, i.e., they move more slowly and lack the distinctive oval or arc-shaped cloud leading edge observed in squall clusters. Some have cloud tops that match the size criteria for MCCs.
28 Jul 2006
24 Aug 2006
18-19 Apr 2013
| Type | Wind Shear | Genesis | Propagation | Dissipation |
|---|---|---|---|---|
| Non-squall Tropical Clusters | Moderate low-level shear, Weak mid-level shear (especially from 700 to 250hPa) | ITCZ/Monsoon trough/ Easterly Waves/Sea-land breeze convergence/ Moderate CAPE | ~ 5 ms-1 (slower than an easterly wave) along the mean shear vector | System moves away from low-level convergence/ When convective line falls behind 700-hPa trough of the easterly wave |
Types/Modes Mesoscale Convective Complexes (MCCs)
MCCs are very large, long-lasting MCSs that are defined by their size and quasi-circular appearance on infrared satellite imagery. However, the precipitation pattern beneath the cloud top can be similar to the squall line structure. They have mean cold cloud shield areas of 350,000 km2. MCCs typically will peak in intensity between midnight and 3 a.m. local time. MCCs persist for an average of 11 hours. Oceanic systems are, on average, slightly larger and longer lasting but less intense convectively. MCCs have greater environmental shear in the low-levels than non-squall tropical clusters. MCCs however do not exhibit as much shear in the low-levels as occurs with squall line/bow echo systems. Once formed, they are largely self sustaining.
Types/Modes » Mesoscale Convective Complexes (MCCs)Environment
MCCs commonly occur in the following synoptic environments.
- Along surface-based frontal boundary or baroclinic zone where a low-level jet rises over the boundary, lifting warm, moist air over cooler or drier air. Such conditions are found near the monsoon trough, stationary fronts, and the Mei-Yu/Baiu front in Asia. The low-level jet is nearly aligned with the surface winds, but stronger, creating the necessary low-level shear. Mid-level shear is usually weak.
- A small fraction of MCCs form in a more barotropic environment, where air is lifted along a surface-based cold pool that is generated by previous convection. The development of this type of "meso-high MCC" depends on the interaction between the vertical shear and the strength of the cold pool.
MCCs typically have the most convective instability of all the MCS types. They are sufficiently large and long-lived that they can modify the large-scale environments in which they develop. They tend to become inertially-stable, i.e., they develop mid-level mesoscale convective vortices and anticyclonic perturbations near the tropopause, which are balanced relative to the Coriolis effect.
Types/Modes » Mesoscale Convective Complexes (MCCs)Examples
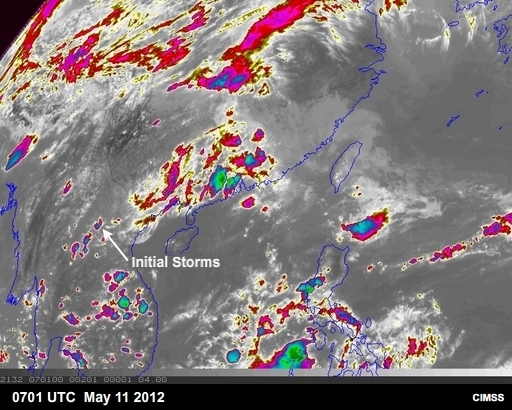
11 May 2012
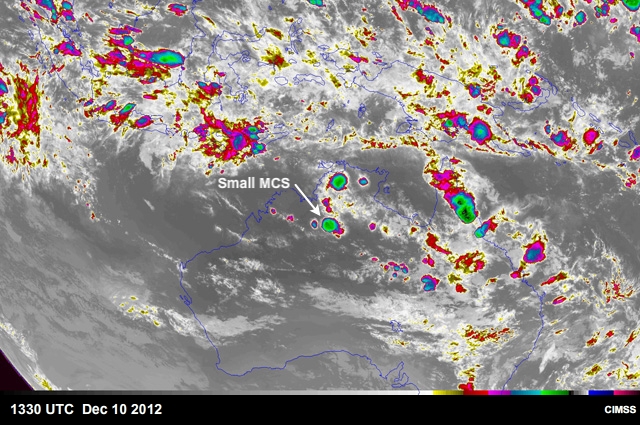
10-11 Dec 2012
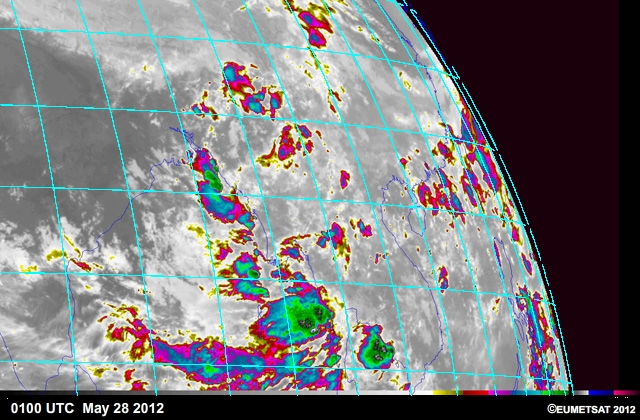
28-29 May 2012
| Type | Wind Shear | Genesis | Propagation | Dissipation |
|---|---|---|---|---|
| Mesoscale Convective Complex | Moderate low-level shear, weak mid- to upper-level shear | Near surface baroclinic boundary/Lee of high terrain/ Low-level Jet/ High CAPE/ Warm, moist boundary layer | ~ 10-20 m s-1 | When system moves away from conditionally unstable air and low-level warm advection, the convective line dissipates, and stratiform precipitation slowly tapers off. |
Types/Modes Squall Clusters/Lines
Squall lines or squall clusters are highly organized MCSs arranged along a line. They last from 6 to 12 hours generally, long enough for the Coriolis force to effect motion, depending on the latitude. They usually begin as a set of convective towers that initiate from the same triggering mechanism, e.g., local topographical forcing or low-level convergence in an easterly wave, and eventually aggregate. The merged cells build a large enough coherent cold pool that they can propagate together using slanted layer-lifting to regenerate updrafts. Within the mid-levels of the convective updraft as well as in the stratiform region, downdrafts are formed due to entrainment and latent cooling, forcing air downward behind the convective line and under the stratiform cloud deck reinforcing the cold pool and generating horizontal vorticity. If the horizontal vorticity ahead of the convective line is equally strong, then the updrafts can be maintained within the convective line and propagation becomes dependent on the motion of the cold pool. Only when the cold pool vorticity overcomes the vorticity ahead of the outflow does the outflow move away from the convective towers and the system deteriorates.
Types/Modes » Squall Clusters/LinesEnvironment
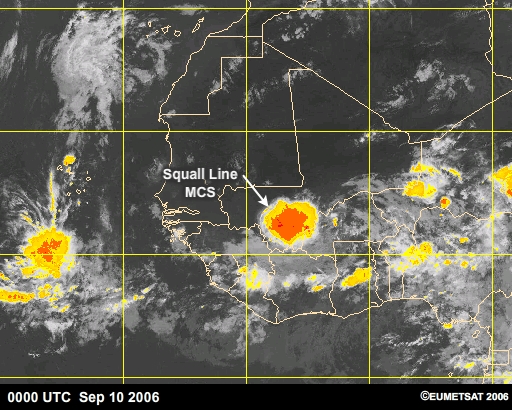
Squall lines require a boundary to focus strong surface convergence, air with high equivalent potential temperature ahead of the boundary (often brought by a low-level jet), and strong low-level shear (enhanced by the low-level jet). Intense, long-lived squall lines are usually oriented perpendicular to the low-level shear. In the tropics, CAPE values are typically marginal to moderate compared to those in the midlatitudes, which can have quite large CAPE and large shear. Tropical squall lines are commonly forced by convergence in the ITCZ, equatorial trough, and monsoon trough; along sea/land breeze boundaries; and in the lee of high terrain that acts as an elevated heat source. Across West Africa, squall line genesis is favored west of the easterly wave trough, while in the Sahel squall lines initiate both west and east of the trough. Across Australia and the Maritime Continent, squall lines also occur during break monsoon periods, with predominantly easterly shear.
In other instances, squall lines in the tropics may be generated much like extra-tropical squall lines, forced by cold fronts that intrude from the midlatitudes.
Squall lines typically have moderate to high convective instability compared to other MCS types.
Types/Modes » Squall Clusters/LinesExamples
Satellite
30-31 Jul 2006
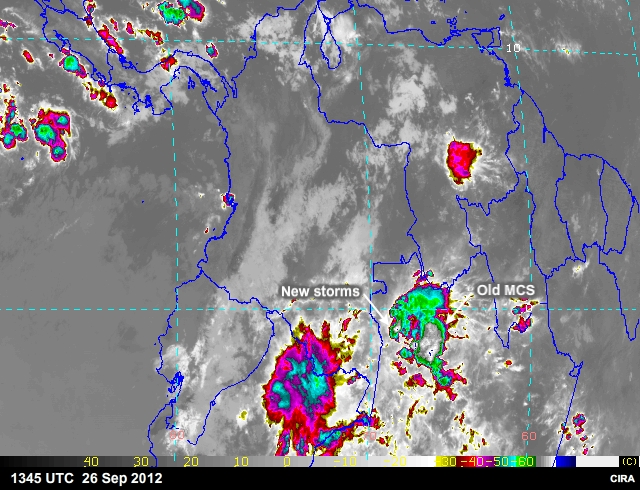
26-27 Sep 2012
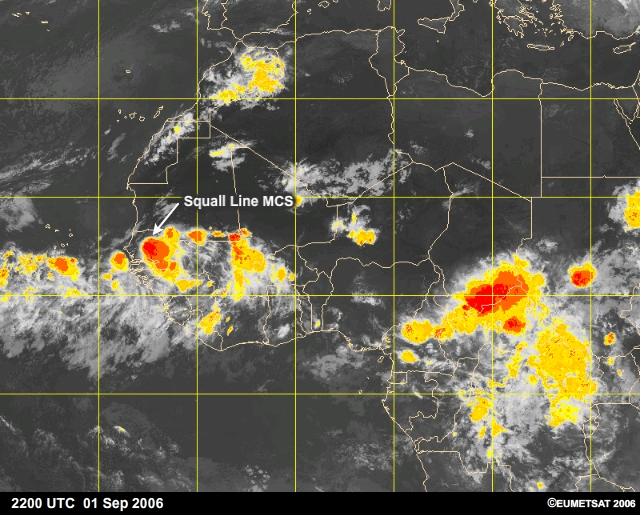
1-3 Sep 2006
Radar
| Type | Wind Shear | Genesis | Propagation | Dissipation |
|---|---|---|---|---|
| Squall Line/Bow Echo | Strong low-level and mid-level shear / Shear perpendicular to convective line creates bowing segments and more trailing stratiform | ITCZ/ Monsoon Trough/ Topography/ Easterly wave/ Break monsoon easterlies/ Low-level jet/Moderate to high CAPE | ~10-20 ms-1, similar to 700 hPa easterly jet | System moves away from low-level convergence, conditional instability/ In ridge of easterly wave/ When convective line dissipates, the stratiform precipitation will slowly begin to taper off. |
Types/Modes » Squall Clusters/LinesBow Echoes
Bow echoes are a special case of the squall line, with a convex or bow-shaped leading convective line. They form where strong rear-to-front mid-level flow, called a rear-inflow jet (RIJ), descends to the surface near the front of the squall line. The descending RIJ forms when latent warming in the ascending updraft and latent cooling in the stratiform rain area causes perturbation pressure gradient forces that accelerate the flow. When the RIJ reaches the surface, the resulting strong surface winds flex the leading edge of the squall line into a bow shape. Bow echoes tend to cause their own demise relatively rapidly (within 1-3 hours) as they cut off the upward motion generating the layer-lifting and convective towers. However, the parent squall line can last for several hours.
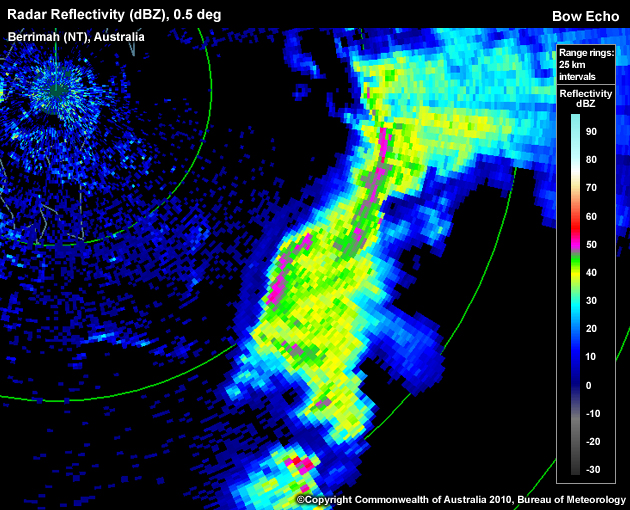
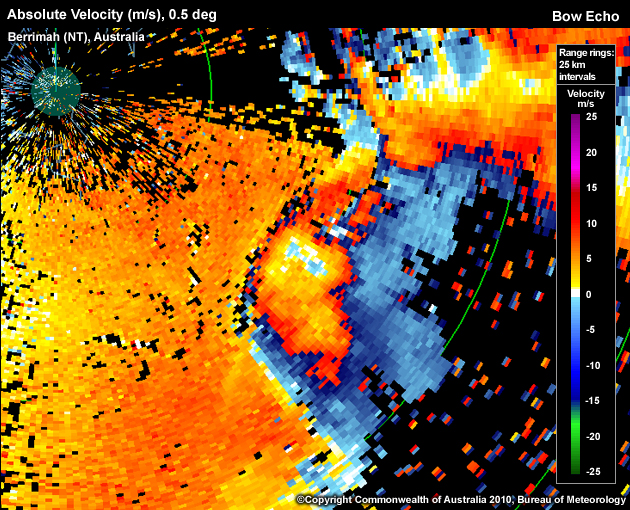
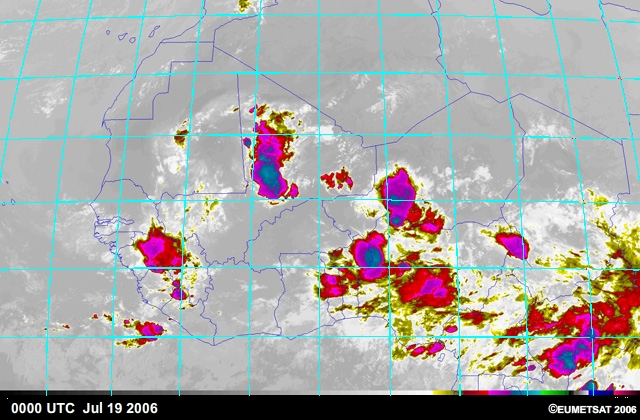
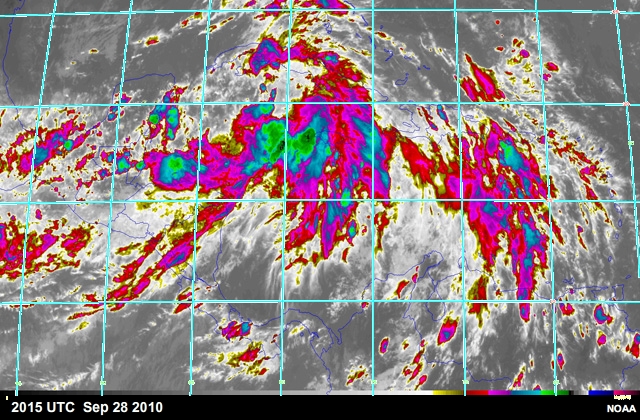
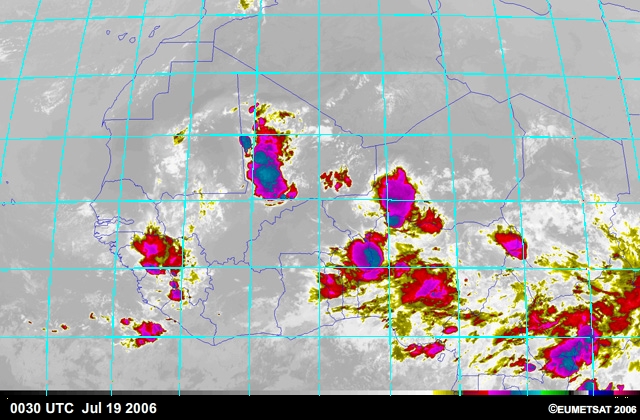
Bow echoes are defined by their radar echo signature. The apex of the bow usually has high reflectivity and strong reflectivity gradients. The RIJ is usually evident in radar imagery as an area of weak echo behind the bow, often called a rear-inflow notch. Bow echoes do not have a satellite signature but can sometimes be identified by as a sharp arc of deep convective clouds at the leading edge of squall lines.
Types/Modes » Squall Clusters/LinesExamples of Bow Echoes
Radar
Reflectivity
Velocity
Satellite
19 Jul 2006
28-29 Sep 2010
1-2 Sep 2006
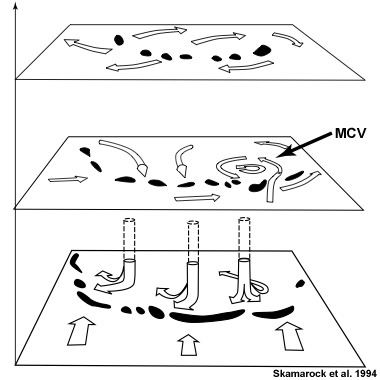
Types/Modes Mesoscale Convective Vortices (MCVs)
When an MCS (tropical or midlatitude) is large or long-lived, it can create its own mid-level mesoscale circulation due to thermal processes and the Coriolis effect.
MCVs form in the stratiform region of MCSs. MCV formation is due to stretching of vorticity in response to mid-level latent heating in the stratiform region. Heating produces a warm anomaly that induces a dynamic response: expanding isentropic layers, a positive potential vorticity anomaly, and a mesoscale convective vortex. Observations over East Asia show that vorticity generation in subtropical and tropical MCVs tends to occur at a lower altitude than in mid-latitude MCVs.
After the precipitation dissipates, the circulation survives; initiating more convection on subsequent days as long as the circulation remains.
MCVs can aid in the formation of tropical cyclones, as in the case of Hurricane Helene in 2006. The MCV that became Hurricane Helene is found in the MCV examples section under the tab “10-12 Sep 2006”.
Types/Modes » Mesoscale Convective Complexes (MCCs)Environment
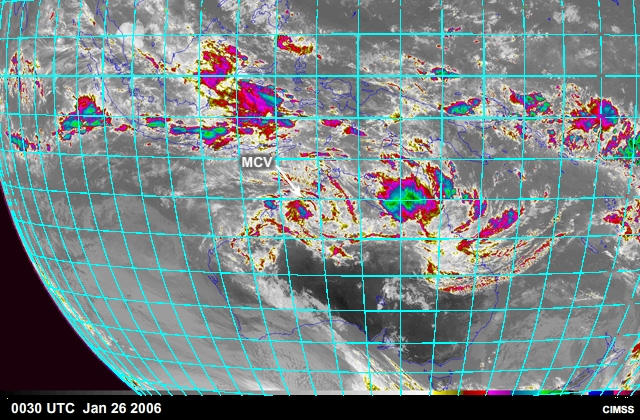
Any environment that supports an MCC or squall line/bow echo can produce an MCV. Longer-lasting systems have a better chance of becoming MCVs. In the tropics, it is harder to make an MCV since the Coriolis force is weaker. MCVs often appear as a spiral of mid-level clouds that remain after the active MCS convection has decayed. Since the observation network is inadequate for detailed mesoscale analysis, if you observe such a system turning from its mean flow in the direction of Coriolis deflection, consider the presence of a MCV.
Types/Modes » Mesoscale Convective Complexes (MCCs)Examples
Satellite
10-12 Sep 2006
19-20 Jul 2006
26-29 Jan 2006
Radar
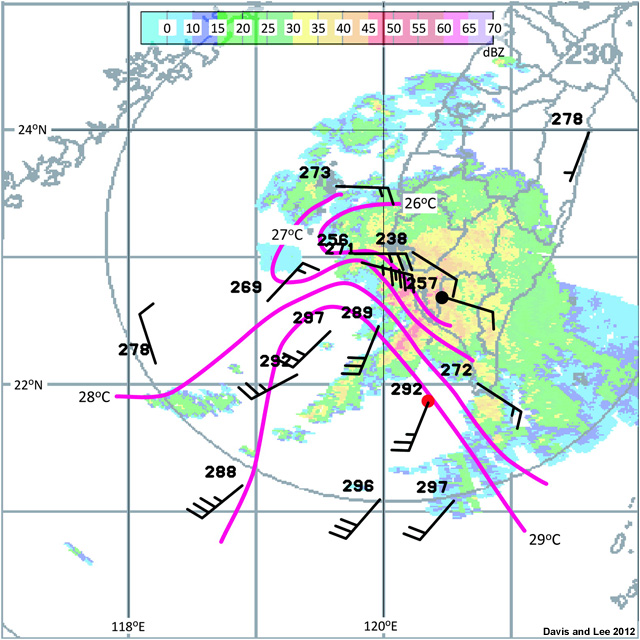
Temperature (degrees C; magenta) and wind barbs (black) overlaid on radar reflectivity. Note the rotation pattern in the winds.
Summary
Tropical mesoscale convective systems (MCSs) can be organized into these main types:
- Non-squall Tropical Clusters
- Mesoscale Convective Complexes
- Squall Lines/Clusters
- Bow Echo
- Mesoscale Convective Vortices
Lifecycle and Structure
- All MCSs are organized initially by their environmental wind shear, which dictates their organizational mode, the tilt of the mesoscale updraft relative to the mesoscale and convective downdrafts.
- Initially, MCSs are convective towers.
- As MCSs age, they organize along their own cold pool, balancing the environmental and cold pool vorticity. At the mature stage, MCSs are areally-dominated by stratiform precipitation, but still contain strong convective precipitation, particularly at their leading edge.
- MCSs break down when their cold pool outruns their convective towers cutting off surface convergence. At this stage, precipitation becomes entirely stratiform as the convective towers die out.
- In long-lived, large MCSs, latent heating and convergence in the stratiform region lead to the formation of mesoscale convective vortices. New convection initiates within the vortices during subsequent diurnal heating cycles.
Impacts
- All MCSs can cause flooding.
- Well-organized MCSs can also cause severe weather, including damaging surface winds, hail, and occasional tornadoes. In addition, they are sources of turbulence, a major hazard for aviation.
- Occasionally, when other favorable factors are present, MCSs and MCVs aid in tropical cyclone formation.
References
Churchill, D. D. and R. A. Houze, Jr., 1984: Development and structure of winter monsoon cloud clusters on 10 December 1978. J. Atmos. Sci., 41, 933-960.
Corfidi, S. F., 2003: Cold Pools and MCS Propagation: Forecasting the Motion of Downwind-Developing MCSs. Wea. Forecasting, 18, 997–1017.
Davis, C. A. and W-C Lee, 2012: Mesoscale Analysis of Heavy Rainfall Episodes from SoWMEX/TiMREX. J. Atmos. Sci., 69, 521–537.
Houze, R. A., Jr., 2004: Mesoscale convective systems. Rev. Geophys., 42, 10.1029/2004RG000150, 43 pp.
Houze, R. A., Jr., M. I. Biggerstaff, S. A. Rutledge, and B. F. Smull, 1989: Interpretation of Doppler Weather Radar Displays of Midlatitude Mesoscale Convective Systems. Bull. Amer. Meteor. Soc., 70, 608–619.
Johnson, R. H., S. L. Aves, P. E. Ciesielski, and T. D. Keenan, 2005: Organization of Oceanic Convection during the Onset of the 1998 East Asian Summer Monsoon. Mon. Wea. Rev., 133, 131–148.
Laing, A. G. and J. M. Fritsch, 2000: The large-scale environments of the global population of mesoscale convective complexes. Mon. Wea. Rev., 128, 2756–2776.
LeMone, M., E. J. Zipser, and S. Trier, 1998: The role of environmental shear and thermodynamics conditions in determining the structure and evolution of mesoscale convective systems during TOGA-COARE. J. Atmos. Sci., 55, 3493-3518.
Lane, T. P., R. D. Sharman, S. B. Trier, R. G. Fovell, and J. K. Williams, 2012: Recent Advances in the Understanding of Near-Cloud Turbulence. Bull. Amer. Meteor. Soc., 93, 499–515.
Liu, C., E. J. Zipser, and S. W. Nesbitt, 2007: Global Distribution of Tropical Deep Convection: Different Perspectives from TRMM Infrared and Radar Data. J. Climate, 20, 489–503.
Mohr, K. I. and E. J. Zipser, 1996: Mesoscale Convective Systems Defined by Their 85-GHz Ice Scattering Signature: Size and Intensity Comparison over Tropical Oceans and Continents. Mon. Wea. Rev., 124, 2417–2437.
Morrison, H., S. A. Tessendorf, K. Ikeda, and G. Thompson, 2012: Sensitivity of a Simulated Midlatitude Squall Line to Parameterization of Raindrop Breakup. Mon. Wea. Rev., 140, 2437–2460
Nesbitt, S. W., R. Cifelli, S. A. Rutledge, 2006: Storm Morphology and Rainfall Characteristics of TRMM Precipitation Features. Mon. Wea. Rev., 134, 2702–2721.
Nieto-Ferreira, R., T. Rickenbach, N. Guy, and E. Williams: Radar observations of convective system variability in relationship to African easterly waves during the 2006 AMMA special observing period. Mon. Wea. Rev., 137, 4136-4150, 2009.
Parker, M. D., 2007: Simulated Convective Lines with Parallel Stratiform Precipitation. Part I: An Archetype for Convection in Along-Line Shear. J. Atmos. Sci., 64, 267–288.
Parker, M. D. and R. H. Johnson, 2000: Organizational Modes of Midlatitude Mesoscale Convective Systems. Mon. Wea. Rev., 128, 3413–3436.
Parker, M. D. and R. H. Johnson, 2004: Simulated Convective Lines with Leading Precipitation. Part I: Governing Dynamics. J. Atmos. Sci., 61, 1637–1655.
Pettet, C. R., R. H. Johnson, 2003: Airflow and Precipitation Structure of Two Leading Stratiform Mesoscale Convective Systems Determined from Operational Datasets. Wea. Forecasting, 18, 685–699.
Rickenbach, T. M., 2004: Nocturnal Cloud Systems and the Diurnal Variation of Clouds and Rainfall in Southwestern Amazonia. Mon. Wea. Rev., 132, 1201–1219.
Skamarock, W. C., M. L. Weisman, and J. B. Klemp, 1994: Three-dimensional evolution of simulated long-lived squall lines. J. Atmos. Sci., 51, 2563--2584.
Smith, Andrea M., G. M. McFarquhar, R. M. Rauber, J. A. Grim, M. S. Timlin, B. F. Jewett, and D. P. Jorgensen, 2009: Microphysical and Thermodynamic Structure and Evolution of the Trailing Stratiform Regions of Mesoscale Convective Systems during BAMEX. Part I: Observations. Mon. Wea. Rev., 137, 1165–1185.
Stensrud, D. J., 1996: Importance of Low-Level Jets to Climate: A Review. J. Climate, 9, 1698–1711.
Contributors
COMET Sponsors
The COMET® Program is sponsored by NOAA National Weather Service (NWS), with additional funding by:
- Bureau of Meteorology of Australia
- Bureau of Reclamation (United States Department of the Interior)
- European Organisation for the Exploitation of Meteorological Satellites (EUMETSAT)
- Meteorological Service of Canada (MSC)
- NOAA National Environmental Satellite, Data and Information Service (NESDIS)
- Naval Meteorology and Oceanography Command (NMOC)
Project Contributors
Senior Project Manager
- Dr. Greg Byrd — UCAR/COMET
Project Lead
- Dr. Arlene Laing — UCAR/COMET
Project Meteorologist and Instructional Designer
- Bryan Guarente — UCAR/COMET
Science Advisor
- Dr. Arlene Laing — UCAR/COMET
Graphics/Interface Design
- Steve Deyo — UCAR/COMET
Multimedia Authoring
- Carl Whitehurst — UCAR/COMET
COMET HTML Integration Team 2020
- Tim Alberta — Project Manager
- Dolores Kiessling — Project Lead
- Steve Deyo — Graphic Artist
- Gary Pacheco — Lead Web Developer
- Justin Richling — Associate Scientist
- David Russi — Translations
- Gretchen Throop Williams — Web Developer
- Tyler Winstead — Web Developer
COMET Staff, Spring 2013
Director
- Dr. Rich Jeffries
Deputy Director
- Dr. Greg Byrd
Administration
- Elizabeth Lessard, Administration and Business Manager
- Lorrie Alberta
- Michelle Harrison
- Hildy Kane
Hardware/Software Support and Programming
- Tim Alberta, Group Manager
- Bob Bubon
- Ken Kim
- Mark Mulholland
- Chris Webber - Student Assistant
- Malte Winkler
Instructional Designers
- Dr. Alan Bol
- Lon Goldstein
- Bryan Guarente
- Dr. Vickie Johnson
- Tsvetomir Ross-Lazarov
- Marianne Weingroff
Media Production Group
- Bruce Muller, Group Manager
- Steve Deyo
- Dan Riter
- Carl Whitehurst
Meteorologists/Scientists
- Wendy Schreiber-Abshire, Senior Project Manager
- Dr. William Bua
- Patrick Dills
- Matthew Kelsch
- Dolores Kiessling
- Dr. Arlene Laing
- Dave Linder
- Dr. Elizabeth Mulvihill Page
- Amy Stevermer
Spanish Translations
- David Russi
NOAA/National Weather Service - Forecast Decision Training Branch
- Anthony Mostek, Branch Chief
- Dr. Richard Koehler, Hydrology Training Lead
- Brian Motta, IFPS Training
- Dr. Robert Rozumalski, SOO Science and Training Resource (SOO/STRC) Coordinator
- Ross Van Til, Meteorologist
- Shannon White, AWIPS Training
Meteorological Service of Canada Visiting Meteorologists
- Nicholas Major