Case Profile and Introduction
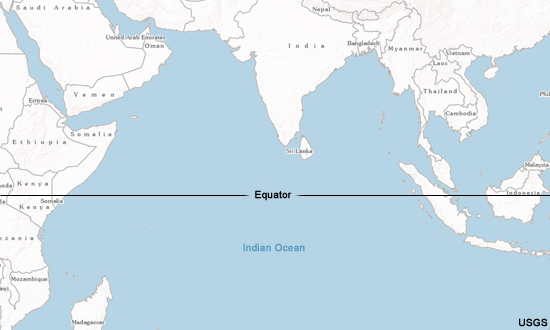
This case study covers events related to the Madden-Julian Oscillation and equatorial waves in May 2002 over the Indian Ocean basin (see graphic below). It will show you how to monitor the MJO and equatorial waves using satellite data and observational analyses and how to assess the potential for tropical cyclone development based on MJO and equatorial wave interactions. You will also see how to use your analyses to forecast expected weather hazards in the regions affected by these tropical features.
Refresher on Waves Contributing to Tropical Variability
Refresher on Waves Contributing to Tropical Variability Madden-Julian Oscillation (MJO)
The MJO is the primary controller of tropical intraseasonal variability, with a period of 30 to 60 days. Its behavior is characterized by a region of enhanced convection which propagates eastward from the western tropical Indian Ocean and into the western tropical Pacific. While the convection and the related cloudiness and precipitation tend to die out east of 180º latitude, the MJO wind signal continues eastward through the eastern Pacific, South America, and into the tropical Atlantic.
Refresher on Waves Contributing to Tropical Variability » Madden-Julian Oscillation (MJO) Conceptual Models of the MJO: Cross-section
An idealized MJO lifecycle is seen in the graphic below, an equatorial cross-section of tropopause height, convective cloudiness, zonal wind and vertical velocity streamlines, and sea level pressure.
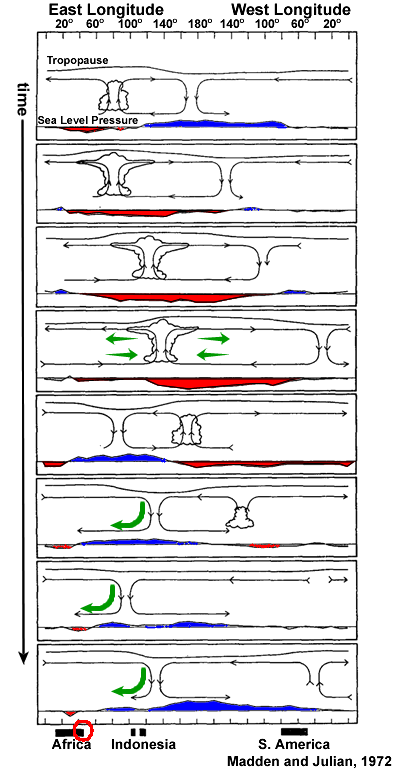
The MJO propagates from west to east, straddling the equator and is traceable in the tropics through the wind field. Where convection is active, the associated latent heating results in low sea level pressures and mid-tropospheric upward motion. This also results in large-scale moisture convergence in the lower troposphere, which encourages more convection. In the MJO, convection usually initiates east of Africa and is subsequently maintained by lower troposphere convergence and upper troposphere divergence as it propagates eastward over time.
Looking down on this from above, we can see how the convection and upper level divergence are related to each other. The graphic below shows the infrared (IR) brightness temperature with the 200 hPa velocity potential (a measure of upper level divergence) superimposed, from January 22 through February 18, 2009.
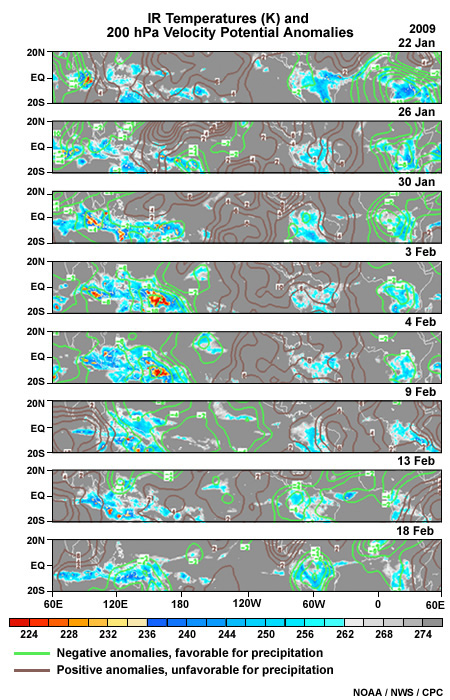
Wind anomalies flow outward across velocity potential anomaly contours from low (green) to high (brown) values. The green contours, indicating divergence, are usually centered at or near low IR (warm color) values, indicating convection.
Refresher on Waves Contributing to Tropical Variability » Madden-Julian Oscillation (MJO) Conceptual Model of the MJO: Three Dimensions
How does the MJO look in three dimensions? You can see that in this idealized depiction of the MJO from 30°E to 150°W longitude and from 40°S to 40°N latitude.
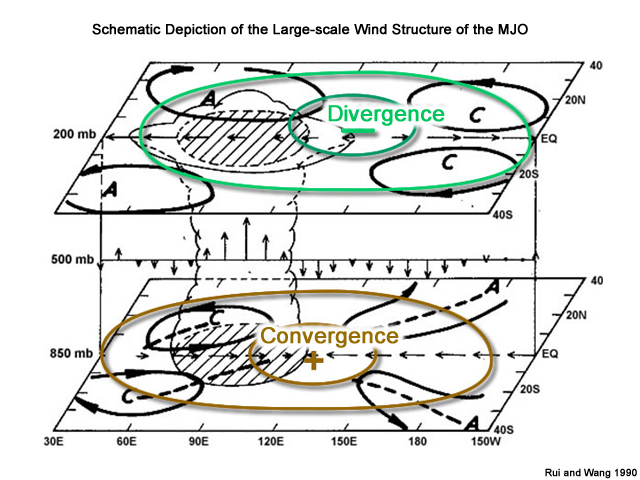
The center of action is the convection, here shown at about 90°E longitude. At 500 hPa we can find the impact along the equator only in the vertical motion field, with rising motion within the convective area and sinking to neutral motion over the rest of the equatorial domain.
Refresher on Waves Contributing to Tropical Variability » Madden-Julian Oscillation (MJO) Impact on Tropical Cyclones
It makes physical sense that when the MJO’s convective phase, with lower tropospheric convergence and upper tropospheric divergence, passes over a region favorable for tropical cyclones, the large-scale environment becomes conducive to their development. Studies have demonstrated that this is the case (e.g. Aiyyer and Molinari, 2008). The passage of the convective phase of the MJO over a region also helps in development of equatorial waves of shorter wavelength and faster propagation speed. These waves are reviewed next.
Refresher on Waves Contributing to Tropical Variability Equatorial Waves
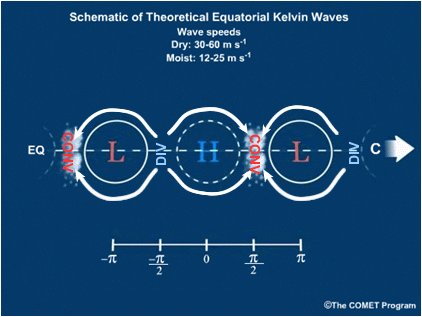
Refresher on Waves Contributing to Tropical Variability » Equatorial Waves Equatorial Kelvin Waves (EKW)
EKWs are initiated by convection at the equator. Because the apparent (Coriolis) force from the earth’s rotation turns flow to the right in the northern hemisphere and to the left in the southern hemisphere, west-to-east flow is effectively trapped at the equator. As a result, EKWs can only move from west to east.
If there is no active convection associated with them, EKWs move eastward at 30-60 m s-1 . With active convection, they travel at 12-25 m s-1, with higher amplitude. Convection is typically active in EKWs when they are over warm continents or ocean waters (Indian and western Pacific Oceans), and during the active convection stage of the MJO.
Conceptually, EKWs show the lower troposphere pressure and active convection patterns along the equator as below. Convection is favored in areas of lower tropospheric convergence, between a low pressure anomaly in the lower troposphere and a high pressure anomaly to its west. This pattern results from lower level convergence and divergence patterns driven by the Coriolis force in concert with the pressure gradient force away from the Equator.
The outgoing long wave radiation (OLR) pattern and wind anomalies are not as clear-cut as the conceptual model, but can be recognized in rainfall anomalies, satellite OLR patterns, and velocity potential anomalies as shown here.
Refresher on Waves Contributing to Tropical Variability » Equatorial Waves Equatorial Rossby Waves (ER)
ERs are alternating low and high pressure areas symmetrically straddling the equator. A conceptual model of the lower-tropospheric pressure patterns of ERs and associated convection can be seen in the graphic below.
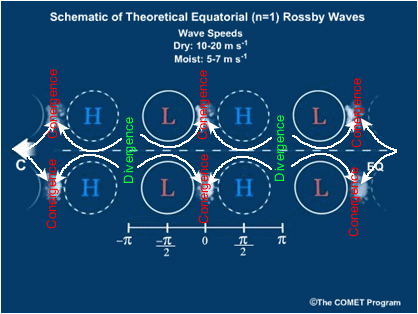
Greater wind velocities are associated with ERs nearer to the equator. Consequently in both hemispheres, low-level divergence exists between low pressure to the east and high pressure to the west, leading to sinking motion and dry weather in these areas. Conversely, low-level convergence exists between high pressure to the east and low pressure to the west, leading to convection. The convergence-divergence pattern in the lower troposphere leads to alternating increases and decreases in mass off the equator. This results in east-to-west propagation of ERs, at speeds of 10-20 m s-1 for dry waves and 5-7 m s-1 for convectively active waves. The distance between vortices (from -π to π in the conceptual graphic) typically ranges from 4,000 to as much as 10,000 km.
ERs can be recognized on satellite pictures as twin vortices in enhanced IR fields on either side of the equator. Examples of this can be seen in the IR image below, from 00 UTC 7 October 2002.
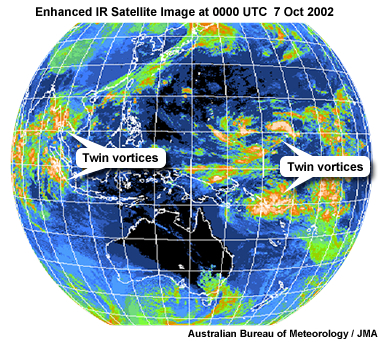
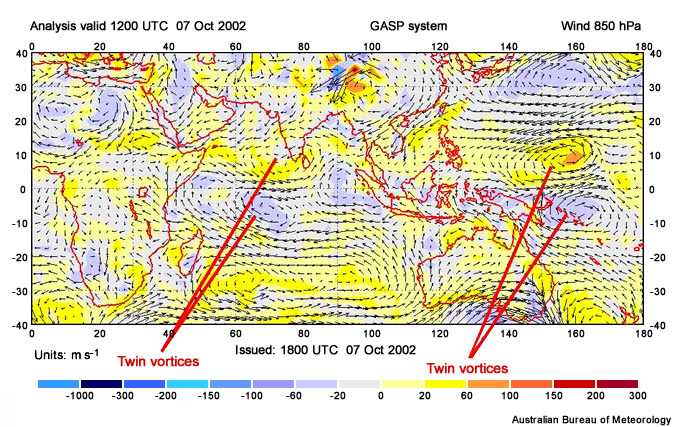
There is a pair of twin vortices, highlighted over Southeast Asia and to its south on the southern side of the equator, with the second pair over the west-central tropical Pacific. These can be seen in the 850 hPa analysis provided by Australian Bureau of Meteorology valid 12 hours later, annotated with the same pair of twin vortices.
Refresher on Waves Contributing to Tropical Variability » Equatorial Waves Mixed Rossby-Gravity (MRG) Waves
MRG waves are maintained by (and help maintain) thunderstorm clusters. The divergent flow from these clusters in the upper troposphere crosses the equator, and exchange of mass between hemispheres drives the movement of off-equator highs and lows from east to west. Lower level convergence east of the anomalous low pressure centers maintains convection and the waves, which move at 8-10 m s-1.

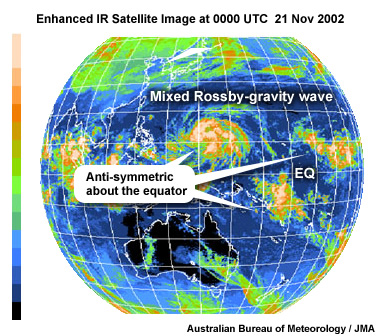
An actual example of MRG waves is shown in the satellite image below, provided by the Australian Bureau of Meteorology valid 00 UTC 21 November 2002. Note the anti-symmetric, off-equator convective clusters over the central and western Pacific.
Relevant Climatologies
When examining synoptic charts and satellite data to determine if equatorial waves will impact the local area, seasonal climatologies of equatorial waves and tropical cyclone formation should be considered. This allows the forecaster to check if what they see in their synoptic analysis is anomalous or typical. An anomalous situation would suggest further analysis for confirmation, and a more careful forecast of how the atmosphere might evolve. Related climatologies, such as sea surface temperatures, should also be considered. These climatologies are discussed next.
Relevant Climatologies Regional Sea Surface Temperature (SST)
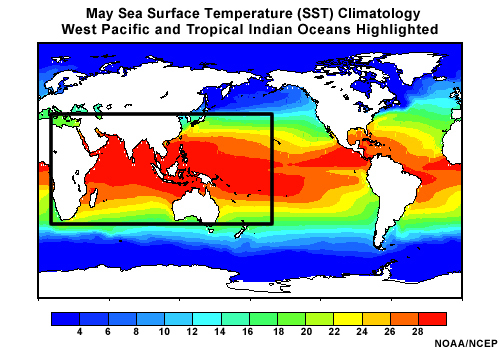
The global SST climatology for May is shown below, with the region of interest highlighted. Temperatures are warmer than 26°C throughout the tropics in the highlighted domain, indicating that one of the ingredients for tropical cyclone (TC) genesis is climatologically present.
Relevant Climatologies Equatorial Waves
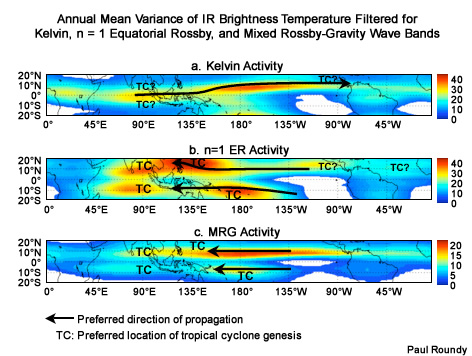
The climatological locations of the three main types of equatorial waves and their relationship to regions of tropical storm formation are shown in the graphic below through the depiction of variance in IR brightness temperature. The variance is filtered to pick out Kelvin, Equatorial Rossby, and Mixed Rossby-Gravity waves; these are shown from top to bottom, respectively. Their propagation direction is shown by the arrows. Locations of tropical cyclogenesis are annotated with TC (with question marks where the relationship is more tenuous between the two).
Equatorial waves contribute to tropical cyclogenesis, especially over the Indian and west Pacific basins. So that is where we'll concentrate our efforts for the case study examples in section 4.
Relevant Climatologies Tropical Cyclones (TCs)
TC formation areas in the Western Pacific and Indian Oceans are shown in the graphic below.
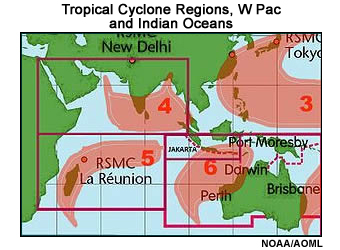
We will be interested in regions 4 and 5 on this graphic. According to the Joint Typhoon Warning Center, the North Indian Ocean tropical cyclone season has climatological maxima in April/May and October/November. Region 5 has maximum cyclone activity in both mid-January and mid-February to early March, though the season begins in October/November and ends in May.
Case Study
This case study will help you:
- Identify the MJO and equatorial waves on surface maps, pressure surface height maps, and satellite imagery
- Examine the relationship between the MJO and equatorial waves formation; and
- Understand the relationship of the MJO and equatorial waves to other tropical weather phenomena.
The case shown here is from May 2002.
Case Studies May 2002 Case
Case Studies » May 2002 Case Initial Analysis, 1 May 2002
We will start with a time-longitude analysis (Hovmöller diagram) of filtered outgoing longwave radiation (OLR) averaged over the 15°S to 15°N equatorial band, taken from 0°E to 360°E. Blue and purple colors represent negative OLR anomalies (enhanced convection), while gold to brown colors represent positive OLR anomalies (suppressed convection). Time moves forward going down the graphic, and spatial orientation is west-to-east from left-to-right. The Indian Ocean basin is marked with a black rectangle. These graphics are used to locate and forecast propagating MJOs and equatorial waves.
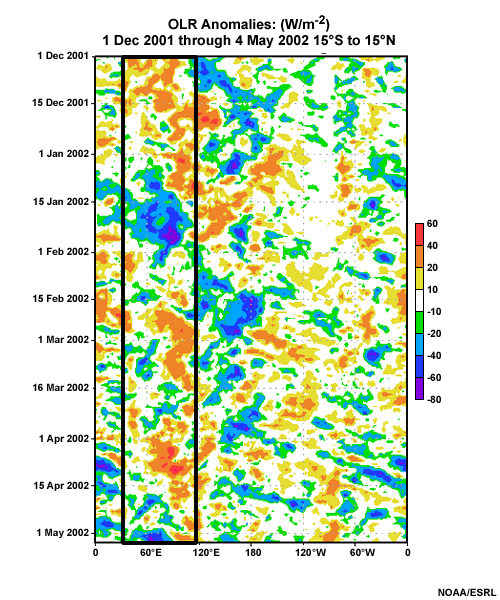
Examine the graphic of filtered OLR (above) for the period from 1 December 2001 to 4 May 2002, noting the OLR anomalies and the direction and speed at which they are moving. Then answer the question below.
Question 1
Which of the following statements about the OLR anomaly graphic are true? (Choose all that apply.)
The correct answers are b), c), and e).
West-to-east anomaly propagation over time with a phase speed allowing the feature to cross the globe in no less than 30 days would indicate an active MJO. The negative OLR anomaly feature would be a good example. The negative anomalies tracking across the Indian Ocean during mid-to-later January and from Africa into the Indian Ocean and amplifying in late April and early May would be another. There is no other MJO activity evident in the graphic. Because the MJO does not propagate from east-to-west, d) is incorrect. There was no MJO activity of consequence over the Indian Ocean in March, so a) is incorrect.
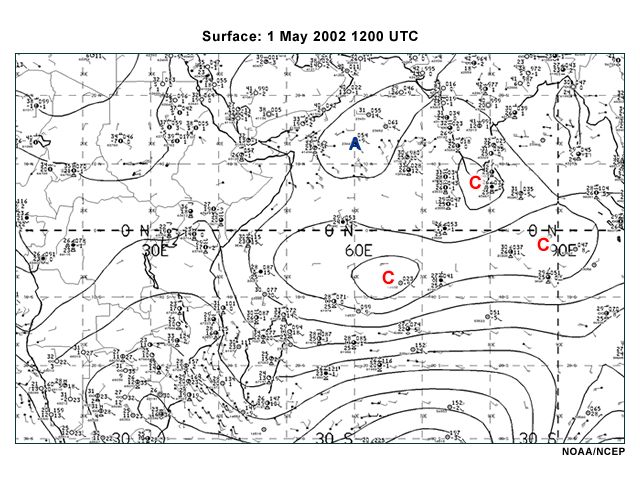
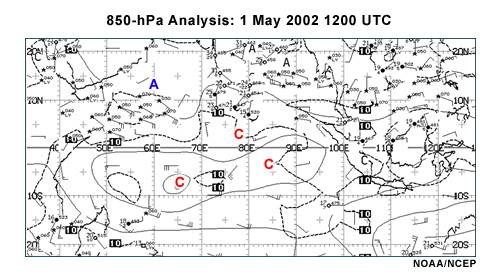
Below is a synoptic chart of surface observations with mean sea level pressure analyzed from 1 May 2002 at 12 UTC over the Indian Ocean and adjacent Africa and South Asia. The C denotes a center of low pressure (cyclone), while the A denotes a center of high pressure (anticyclone). Use this chart to answer the next question.
Question 2
Examine the pattern of cyclones and anticyclones over the Indian Ocean in the image above. What kind of wave is in this analysis? (Choose the best answer.)
The correct answer is d).
The anti-symmetric pattern of cyclonic circulations, with two cyclones south of the equator at 65°and 90°E, and another near Sri Lanka at about 78°E, is consistent with mixed Rossby-gravity waves. Kelvin waves are single centers of low and high pressure along the equator, so a) is incorrect. Equatorial Rossby waves are seen as symmetric lows and highs on opposite sides of the equator, so b) is incorrect. The Madden-Julian Oscillation is a large scale planetary scale oscillation of much larger scale than what is shown in the analysis. So c) is incorrect.
Question 3
Given the type of wave depicted in the analysis, which direction would you expect the wave to move? (Choose the best answer.)
The correct answer is c) westward.
Mixed Rossby-gravity waves move from east to west in response to cross-equatorial transport of mass which result in westward propagation of lows and highs in each hemisphere. Therefore a), b), and d) are incorrect.
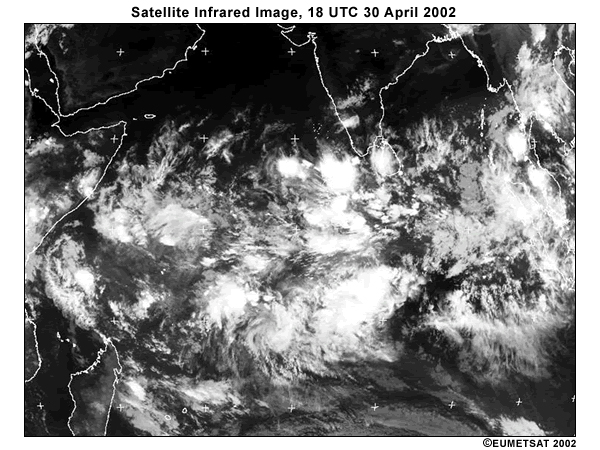
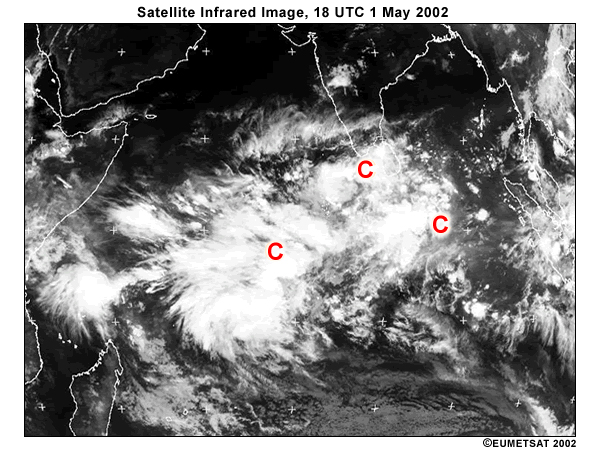
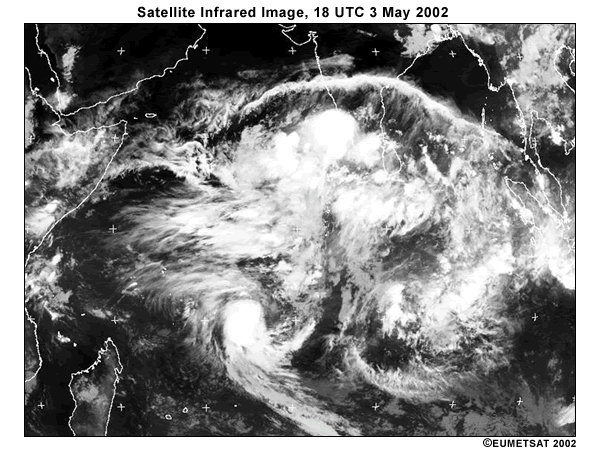
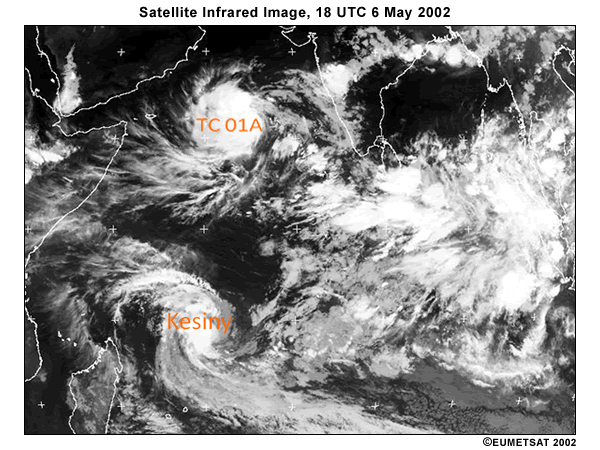
Satellite images from 30 April through 1 May 2002
The satellite images from 30 April and 1 May 2002 (both at 18 UTC) are shown below. The equatorial Indian Ocean from south of the horn of Africa to southeast of the southern tip of India is convectively active both days. The location of cyclonic low-level circulations at 12 UTC on 1 May 2002 is marked in the latter graphic.
Question 4
Consider the climatology of tropical cyclone formation in the tropical North Indian Ocean found here, and of equatorial wave frequency and propagation indicated here. What would you consider the likelihood of tropical cyclone formation to be in this case? (Choose the best answer.)
The best answer is b), above normal.
Climatologically, the Northern Indian Ocean has tropical cyclogenesis most frequently during the current (April/May) period. Because other antecedent conditions, such as active mixed Rossby-gravity waves and climatologically high sea surface temperatures are present, you would consider the risk of tropical cyclone development to be above normal. Hence, a), c), and d) are incorrect.
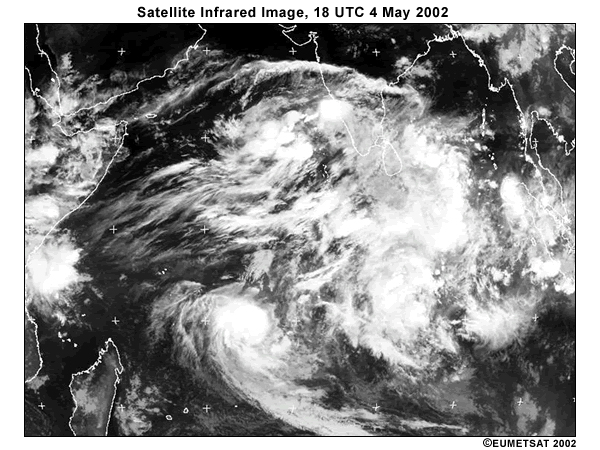
Case Studies » May 2002 Equatorial Wave Evolution: 1 - 4 May 2002
How did the equatorial waves evolve over the next few days? Below you’ll find two animations: one a set of 4 analyses at 850 hPa at 12 UTC on 1 through 4 May 2002, and the other a set of four IR satellite pictures from 18 UTC on the same days. Watch how the tropical flow evolves over the three-day period using both observing methods. You can look at the sequence for each, or at satellite and 850 hPa analysis on the same day. After completing your examination of the 850 hPa wind and height analyses for 1 May to 4 May 2002, answer the question below.

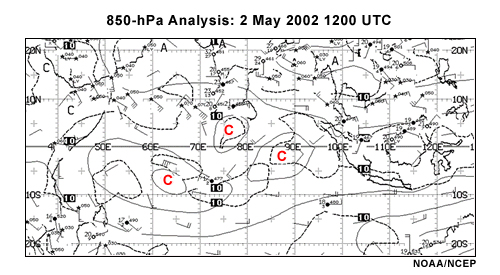
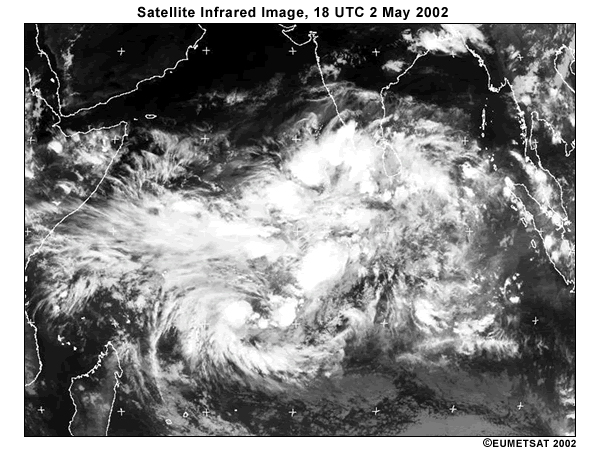
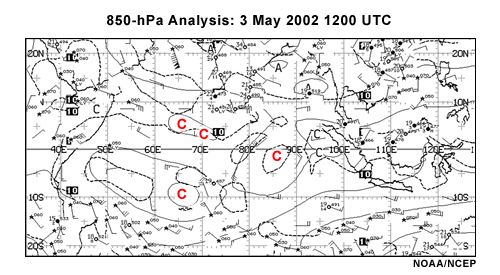

Question
After examining the synoptic charts and satellite IR images, choose the statement(s) below that make the most accurate description of conditions by 4 May 2002? (Choose all that apply.)
The correct answers are a) and b).
During the 1 May to 4 May 2002 period, the circulation south of the equator associated with the MR wave develops into a tropical cyclone named Kesiny. The large area of active convection covering most of the equatorial Indian Ocean is associated with the ongoing eastward propagation of the MJO. Since equatorial Rossby waves are typified by "twin" cyclonic circulations in the lower troposphere and surface low pressure and this does not exist during the period, c) is incorrect.
Case Studies » May 2002 Further Developments: 4 May through 9 May 2002
The MJO continued moving eastward across the eastern tropical Indian Ocean basin toward Indonesia during the period, and continued to influence equatorial wave development in the underlying regions. By 9 May 2002, the MJO had reached Indonesia. The next question asks about the weather you might expect in the MJO's area of influence.
Question 1
Based on what you know about the MJO, which of the following can be expected in the eastern Indian Ocean and over Indonesia in the period from 4 through 9 May 2002? (Choose all that apply.)
The correct answers are c), d), and e).
The “wet” phase of the MJO over the Indian and western Pacific Oceans provides the large-scale environment favorable for organized convection [answer c)], which in turn can initiate waves like equatorial Rossby waves and mixed Rossby-gravity waves [answers d) and e)]. Though the presence of this phase of the MJO can foster development of easterly waves into tropical cyclones, such waves are generated by instabilities in the Africa Easterly Jet and found in the Atlantic, not Indian, Ocean. With the heavy precipitation associated with the MJO, flooding is more likely to be associated with its wet phase, not drought [answer f)].
Now let us look at the smaller scale using 850 hPa and satellite IR images, as we did previously. The next set of animations are for the period 4 May through 7 May 2002. The two tabs in the graphic window are for the 850 hPa height and wind fields and the satellite IR imagery over the Indian Ocean, respectively. Remember that the red “C”’s refer to cyclonic circulations on the 850 hPa charts, and that brighter whites in the IR images represent colder cloud tops.
Refer to these animations for the next two questions about the types of waves evident in the images.

Use the animated 850 hPa height and wind charts and satellite IR images (from the tabs above) to identify the equatorial waves that exist in the equatorial region within the boxes shown in the 850 hPa (1st tab) and IR (2nd tab) diagrams (shown below). Finally, answer the question that follows the tabs.
Question 2
Click and drag the wave initials belonging to the waves you identified to their correct locations on this Indian Ocean chart and drop the label on the feature. Click Done when finished to see the correct response.
The correct answers are shown in the graphic. There is a Kelvin wave progressing eastward through Borneo into the western Pacific, and a pair of equatorial Rossby waves north and south of the equator moving westward past Indonesia to the south and Malaysia to the north. There is considerable convective activity associated with these waves.
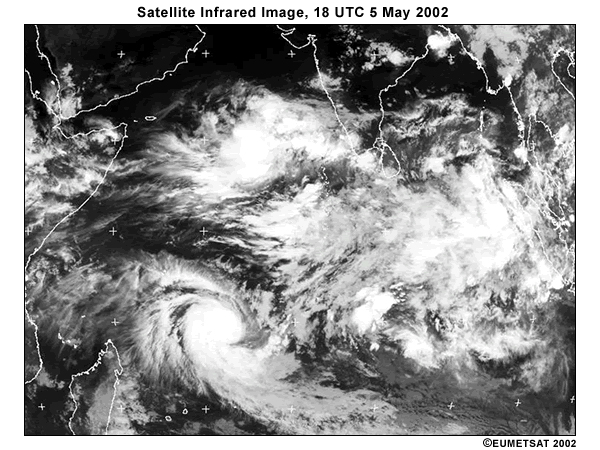
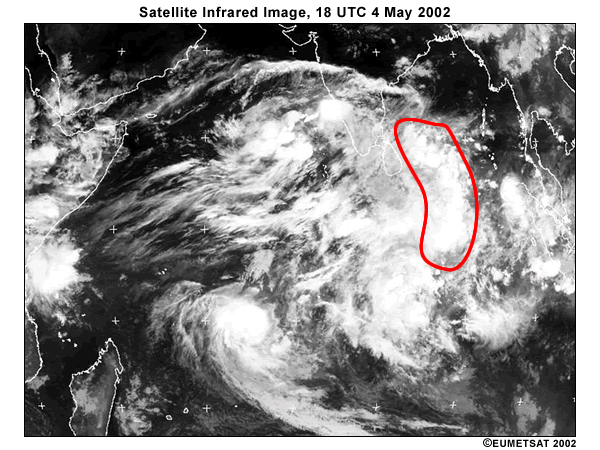
The Kelvin wave appears to have initiated from a linear cluster of convection east to southeast of Sri Lanka late on 4 May 2002. See the area in the graphic below enclosed in red.
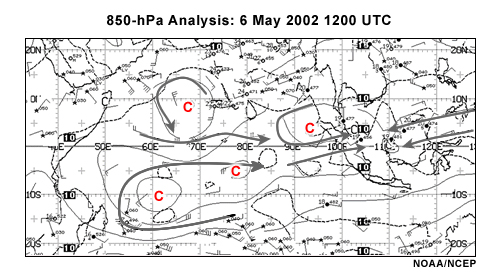
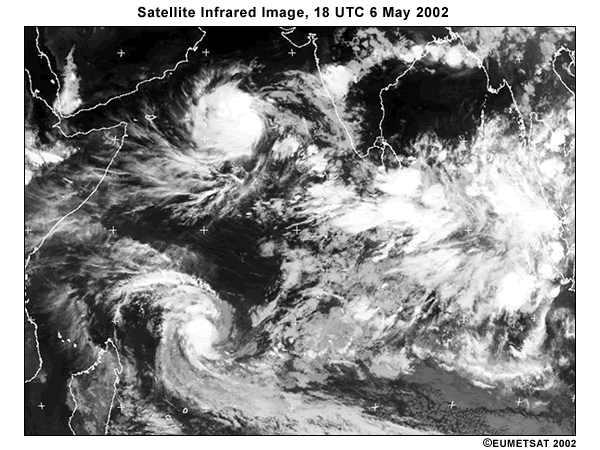
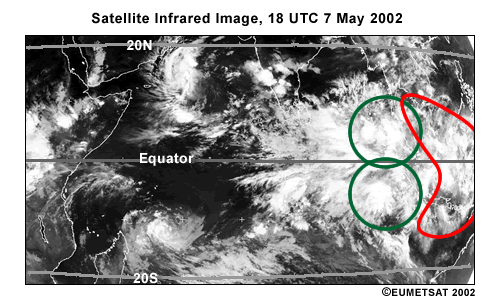
Over time, the Kelvin wave moves eastward along the equator, resulting in enhanced convection and latent heat release during 5 and 6 May 2002. On 6 May, it appears that equatorial Rossby waves are being forced by this latent heating, indicated by the light green circles (shown on the last frame of the animation) at the northern and southern ends of the Kelvin wave convection.
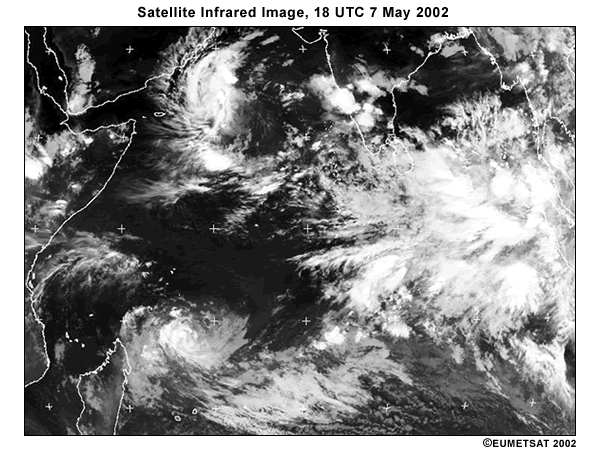
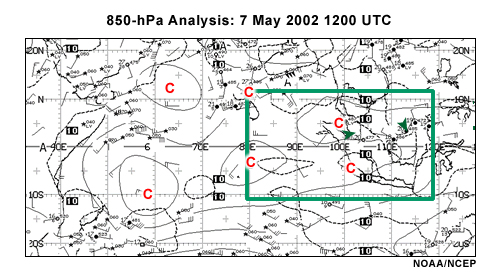
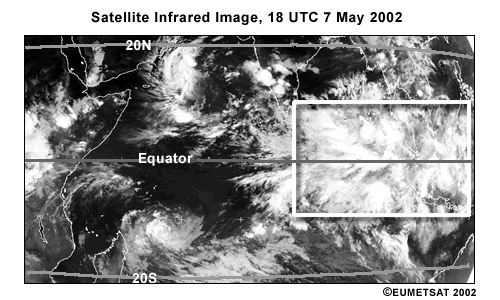
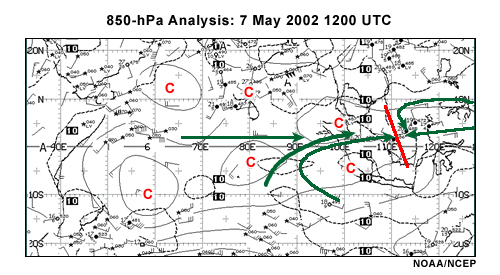
By 18 UTC 7 May 2002, the equatorial Rossby waves have become more developed and have begun to move westward from their initial locations.
The 850 hPa analysis and some streamlines for 12 UTC 7 May 2002 reflect the two types of waves. The forward progress of the Kelvin wave is indicated with the red line, while the equatorial Rossby waves are located at the “C’s” (twin cyclonic circulations) on either side of the equator at about 100°E.
Question 3
Given the position of the equatorial waves on 7 May 2002 indicated in Question 2 feedback (reproduced in the graphics below), what significant weather developments would you be watching for over the next few days in this general region? Choose all that apply from the answers below, and explain your reasoning in the text box after the choices. Click “DONE” once you have answered the question, and you will see the correct answers and “expert reasoning” in the feedback.
Reference images:
The correct answers are b), c), and d).
Here follows the expert reasoning that leads to these answers.
The Kelvin wave will continue eastward out of the region. The northern equatorial Rossby wave will continue westward into the Bay of Bengal, resulting in increased convection there. As the Bay of Bengal and the south Indian Ocean are climatologically favored for tropical cyclone development, the equatorial Rossby waves will have to be closely monitored. Under the subsiding part of the Madden-Julian oscillation, weather should be good over most of the Arabian sea.
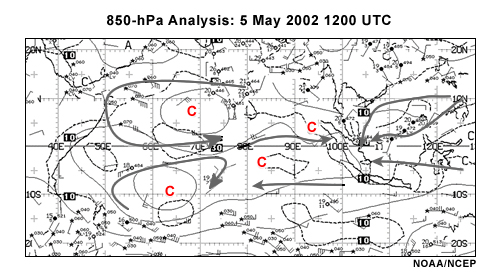
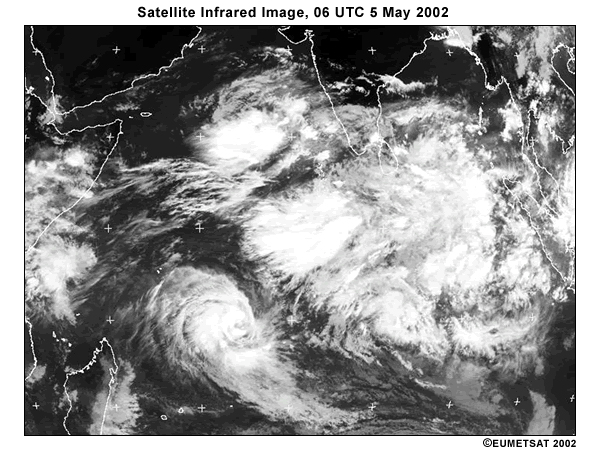
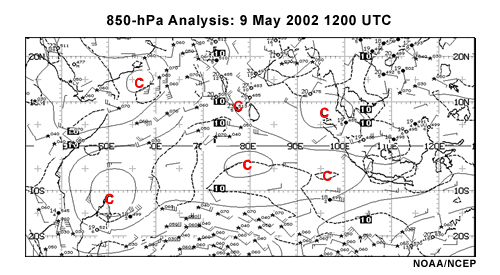
The evolution of the equatorial Rossby waves is shown in the 850 hPa graphic from 12 UTC 9 May 2002 and in the daily satellite IR animations from 18 UTC 8 May to 18 UTC 10 May 2002 (below).
Summary
This case study examined the role of the Madden-Julian Oscillation (MJO) and three types of equatorial waves; Kelvin, equatorial Rossby, and mixed Rossby-gravity waves in tropical variability and cyclone development. First we reviewed the structure of these equatorial waves. Then we used the 30 April to 10 May 2002 period over the Africa/Indian Ocean/Indonesia sector to demonstrate that the favorable large-scale environment provided by the active MJO leads to their development.
On 30 April 2002, the MJO moved from Africa out into the Indian Ocean. By the next day, mixed Rossby-gravity waves had already formed and were moving westward.
The westernmost northern and southern Indian Ocean cyclonic circulations developed into twin tropical cyclones by 6 May 2002.
On 4 May 2002, a linear formation of convection became a Kelvin wave straddling the equator and propagating eastward.
Consequently, the convection from the active Kelvin wave generated twin vortices on 6 to 7 May 2002. These represented a pair of westward-moving equatorial Rossby waves.
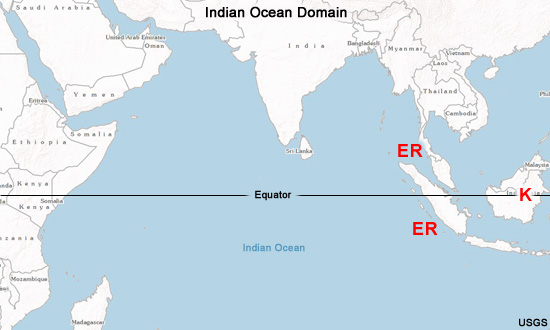
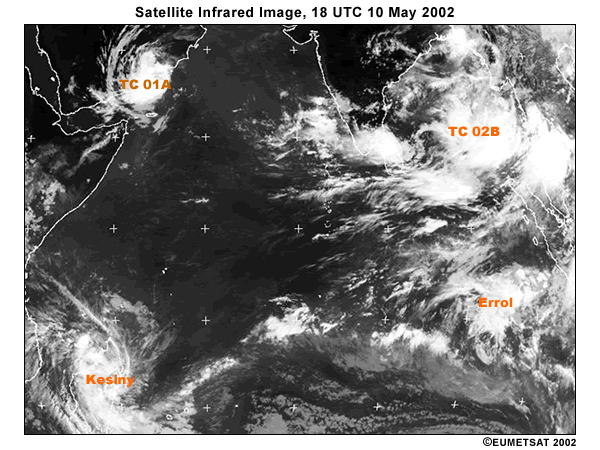
These equatorial Rossby waves provided the circulations from which two additional tropical cyclones developed: TC2B and Tropical Cyclone Errol. These are shown as they were on 10 May 2002 at 18 UTC, below.
References
- Matsuno, T., 1966: Quasi-geostrophic motions in the equatorial area. J. Meteor. Soc. Japan, 44, 25-43. (theoretical solutions)
- Madden, R., P. Julian, 1971: Detection of a 40-50 day oscillation in the zonal wind in the tropical Pacific. J. Atmos. Sci., 28, 702-708.
- Madden, R., P. R. Julian, 1972: Description of global scale circulation cells in the Tropics with 40–50 day period. J. Atmos. Sci., 29, 1109-1123.
- Madden, R. A., P. R. Julian, 1994: Observations of the 40-50-day tropical oscillation - A review. Mon. Wea. Rev., 122, 814-837.
- Gill, A. E., 1980: Some simple solutions for heat-induced tropical circulation. Quart. J. Roy. Meteor. Soc., 106, 447-462.
- Zhang, C., 2005: Madden-Julian Oscillation. Rev. Geophys., 43, RG2003, doi:10.1029/2004RG000158.
- Kiladis, G. N., M. C. Wheeler, P. T. Haertel, and P. E. Roundy, 2009: Convectively coupled equatorial waves. Rev. Geophys., 47, RG2003. (Comprehensive review of equatorial waves)
- Schreck, Carl J., John Molinari, Karen I. Mohr, 2011: Attributing Tropical Cyclogenesis to Equatorial Waves in the Western North Pacific. J. Atmos. Sci., 68, 195–209. doi:10.1175/2010JAS3396.1
- Shen, B.-W., W.-K. Tao, Y.-L. Lin, and A. Laing, 2012: Genesis of twin tropical cyclones as revealed by a global mesoscale model: The role of mixed Rossby-gravity waves. J. Geophys. Res., 117, D13114, doi:10.1029/2012JD017450.
Contributors
COMET Sponsors
The COMET® Program is sponsored by NOAA National Weather Service (NWS), with additional funding by:
- Bureau of Meteorology of Australia
- Bureau of Reclamation (United States Department of the Interior)
- European Organisation for the Exploitation of Meteorological Satellites (EUMETSAT)
- Meteorological Service of Canada (MSC)
- NOAA National Environmental Satellite, Data and Information Service (NESDIS)
- Naval Meteorology and Oceanography Command (NMOC)
Project Contributors
Senior Project Manager
- Dr. Greg Byrd — UCAR/COMET
Project Lead
- Dr. Arlene Laing — UCAR/COMET
Principal Science Advisor
- Dr. Bill Bua — UCAR/COMET
Graphics/Interface Design
- Steve Deyo — UCAR/COMET
Multimedia Authoring
- Carl Whitehurst — UCAR/COMET
COMET HTML Integration Team 2020
- Tim Alberta — Project Manager
- Dolores Kiessling — Project Lead
- Steve Deyo — Graphic Artist
- Gary Pacheco — Lead Web Developer
- David Russi — Translations
- Gretchen Williams — Web Developer
- Tyler Winstead — Web Developer
COMET Staff, Fall 2012
Director
- Dr. Timothy Spangler
Deputy Director
- Dr. Greg Byrd
Administration
- Elizabeth Lessard, Administration and Business Manager
- Lorrie Alberta
- Michelle Harrison
- Hildy Kane
Hardware/Software Support and Programming
- Tim Alberta, Group Manager
- Bob Bubon
- Ken Kim
- Mark Mulholland
- Victor Taberski - Student Assistant
- Chris Webber - Student Assistant
- Malte Winkler
Instructional Designers
- Dr. Alan Bol
- Maria Frostic
- Lon Goldstein
- Bryan Guarente
- Dr. Vickie Johnson
- Tsvetomir Ross-Lazarov
- Marianne Weingroff
Media Production Group
- Bruce Muller, Group Manager
- Steve Deyo
- Dan Riter
- Carl Whitehurst
Meteorologists/Scientists
- Wendy Schreiber-Abshire, Senior Project Manager
- Dr. William Bua
- Patrick Dills
- Matthew Kelsch
- Dolores Kiessling
- Dr. Arlene Laing
- Dave Linder
- Dr. Elizabeth Mulvihill Page
- Amy Stevermer
Spanish Translations
- David Russi
NOAA/National Weather Service - Forecast Decision Training Branch
- Anthony Mostek, Branch Chief
- Dr. Richard Koehler, Hydrology Training Lead
- Brian Motta, IFPS Training
- Dr. Robert Rozumalski, SOO Science and Training Resource (SOO/STRC) Coordinator
- Ross Van Til, Meteorologist
- Shannon White, AWIPS Training
Meteorological Service of Canada Visiting Meteorologists
- Brad Snyder