Media elements used in this module are protected by a variety of copyright licenses. Please use the "copyright terms" link associated with each item below for more information.
Description:
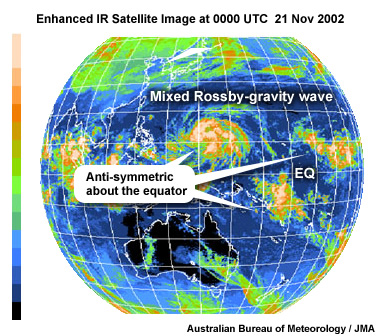
The enhanced IR satellite image of an equatorial mixed Rossby-gravity wave at 0000 UTC 21 November 2002 illustrates the impact of the convection on the wave structure. Satellite image originally processed by the Bureau of Meteorology from the geostationary satellite GMS-5 operated by the Japan Meteorological Agency.
File Name:
21nov02.jpg
Credits:
Australian Bureau of Meteorology/JMA
Copyright Terms:
COMET Standard Terms
of Use
Description:
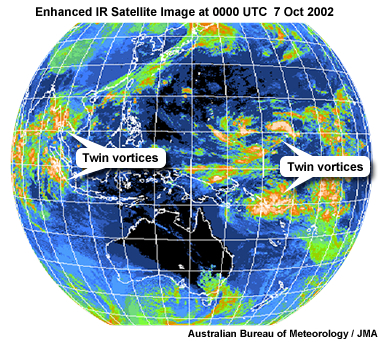
Enhanced IR satellite image corresponding to the 850hPa tropical wind analysis for 1200 UTC 7 October. 2002, pictured in Fig. 5.16. Satellite image originally processed by the Bureau of Meteorology from the geostationary satellite GMS-5 operated by the Japan Meteorological Agency
File Name:
7oct02.jpg
Credits:
Australian Bureau of Meteorology/JMA
Copyright Terms:
COMET Standard Terms
of Use
Description:
Data loop of 850hPa Analysis forecasts
File Name:
850_loop1_0001.htm
Credits:
NOAA/NCEP
Copyright Terms:
COMET Standard Terms
of Use
Description:
Data loop of 850hPa Analysis forecasts
File Name:
850_loop2_0001.htm
Credits:
NOAA/NCEP
Copyright Terms:
COMET Standard Terms
of Use
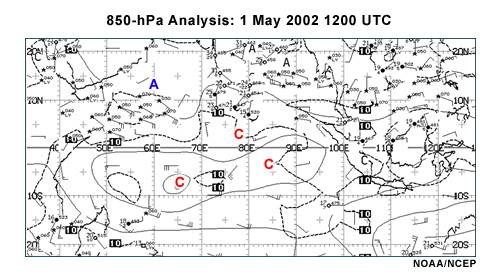
Description:
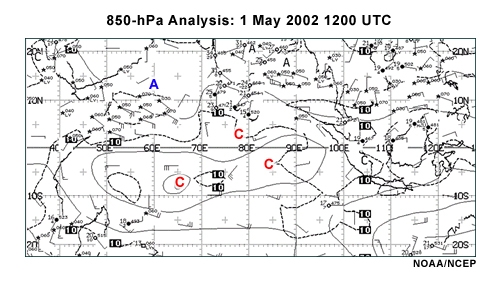
NOAA/NCEP 850-hPa analysis of Indian Ocean basin and adjacent landmasses, 12 UTC 1 May 2002
File Name:
850anl_2002050112.jpg
Credits:
NOAA/NCEP
Copyright Terms:
COMET Standard Terms
of Use
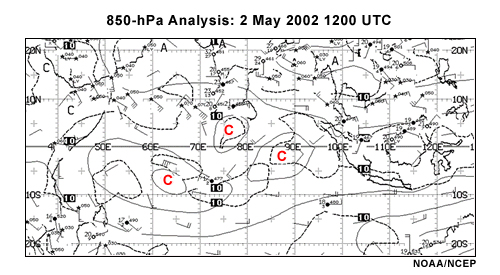
Description:
NOAA/NCEP 850-hPa analysis of Indian Ocean basin and adjacent landmasses, 12 UTC 2 May 2002
File Name:
850anl_2002050212.jpg
Credits:
NOAA/NCEP
Copyright Terms:
COMET Standard Terms
of Use
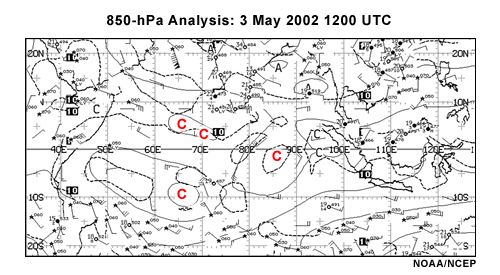
Description:
NOAA/NCEP 850-hPa analysis of Indian Ocean basin and adjacent landmasses, 12 UTC 3 May 2002
File Name:
850anl_2002050312.jpg
Credits:
NOAA/NCEP
Copyright Terms:
COMET Standard Terms
of Use
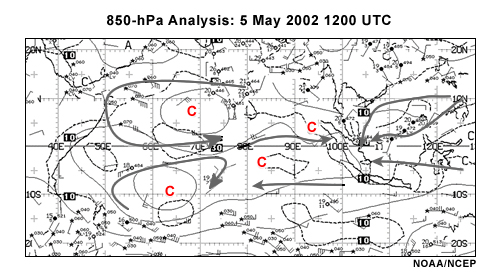
Description:
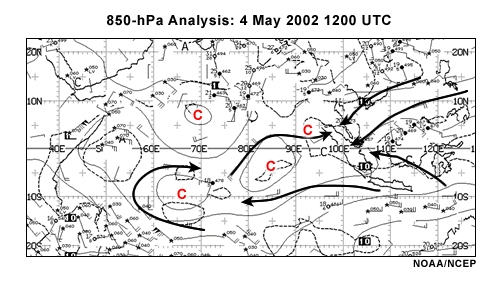
NOAA/NCEP 850-hPa analysis of Indian Ocean basin and adjacent landmasses, 12 UTC 5 May 2002
File Name:
850anl_2002050512.jpg
Credits:
NOAA/NCEP
Copyright Terms:
COMET Standard Terms
of Use
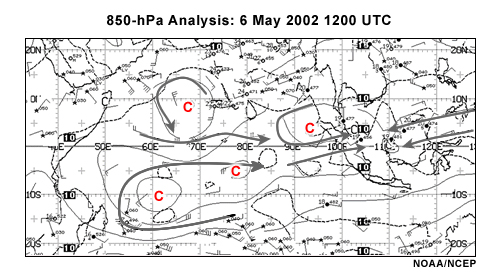
Description:
NOAA/NCEP 850-hPa analysis of Indian Ocean basin and adjacent landmasses, 12 UTC 6 May 2002
File Name:
850anl_2002050612.jpg
Credits:
NOAA/NCEP
Copyright Terms:
COMET Standard Terms
of Use

Description:
NOAA/NCEP 850-hPa analysis of Indian Ocean basin and adjacent landmasses, 12 UTC 7 May 2002
File Name:
850anl_2002050712.jpg
Credits:
NOAA/NCEP
Copyright Terms:
COMET Standard Terms
of Use
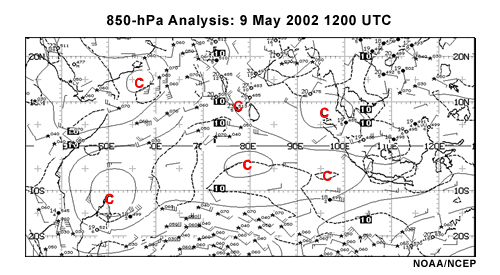
Description:
NOAA/NCEP 850-hPa analysis of Indian Ocean basin and adjacent landmasses, 12 UTC 9 May 2002
File Name:
850anl_2002050912.jpg
Credits:
NOAA/NCEP
Copyright Terms:
COMET Standard Terms
of Use
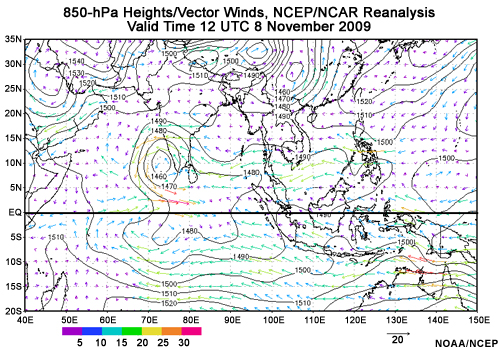
Description:
850-hPa winds and heights valid 12 UTC 8 November 2009. Heights are in geopotential meters, and winds are in knots.
File Name:
850windhgt_2009110812.jpg
Credits:
NOAA/NCEP
Copyright Terms:
COMET Standard Terms
of Use
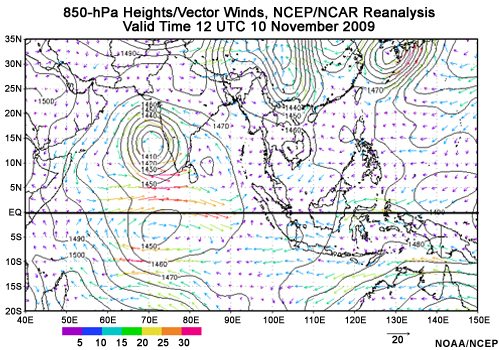
Description:
850-hPa winds and heights valid 12 UTC 10 November 2009. Heights are in geopotential meters, and winds are in knots.
File Name:
850windhgt_2009111012.jpg
Credits:
NOAA/NCEP
Copyright Terms:
COMET Standard Terms
of Use
Description:
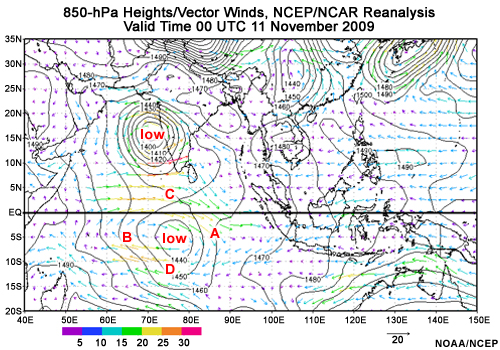
850-hPa winds and heights valid 00 UTC 11 November 2009. Heights are in geopotential meters, and winds are in knots. Annotated with low pressure centers over the Indian Ocean and locations for answering question 6 in post module quiz.
File Name:
850windhgt_2009111100_Q6.jpg
Credits:
NOAA/NCEP
Copyright Terms:
COMET Standard Terms
of Use
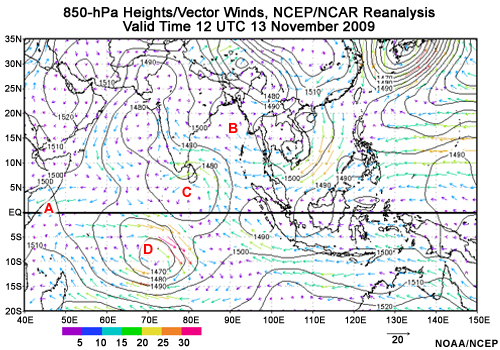
Description:
850-hPa winds and heights valid 12 UTC 131 November 2009. Heights are in geopotential meters, and winds are in knots. Annotated with locations for answering question 7 in post module quiz.
File Name:
850windhgt_2009111312.jpg
Credits:
NOAA/NCEP
Copyright Terms:
COMET Standard Terms
of Use
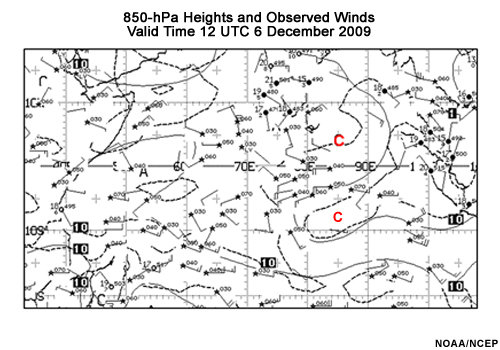
Description:
850-hPa heights, and radiosonde winds valid 12 UTC 6 December 2009. Heights are in geopotential meters, and winds are in knots. Annotated with locations for answering question 8 in post module quiz.
File Name:
850windhgt_2009120612.jpg
Credits:
NOAA/NCEP
Copyright Terms:
COMET Standard Terms
of Use
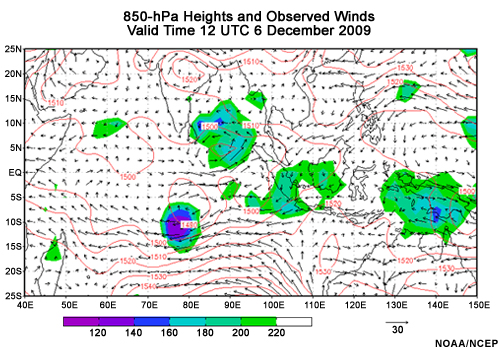
Description:
850-hPa heights, winds and outgoing longwave radiation valid 00 UTC 7 December 2009. Heights are in geopotential meters, winds are in knots, and OLR is in watts per meter squared.
File Name:
850zwndOLR_20091207.jpg
Credits:
NOAA/NCEP
Copyright Terms:
COMET Standard Terms
of Use
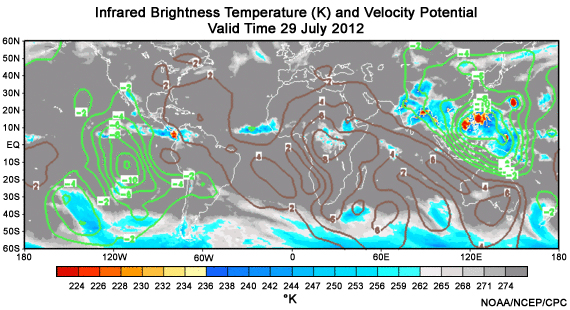
Description:
Infrared satellite data (brightness temperature, shaded) and velocity potential (contoured, green is negative) for 29 July 2012.
File Name:
am_ir_monthly_1.jpg
Credits:
NOAA/NCEP/CPC
Copyright Terms:
COMET Standard Terms
of Use
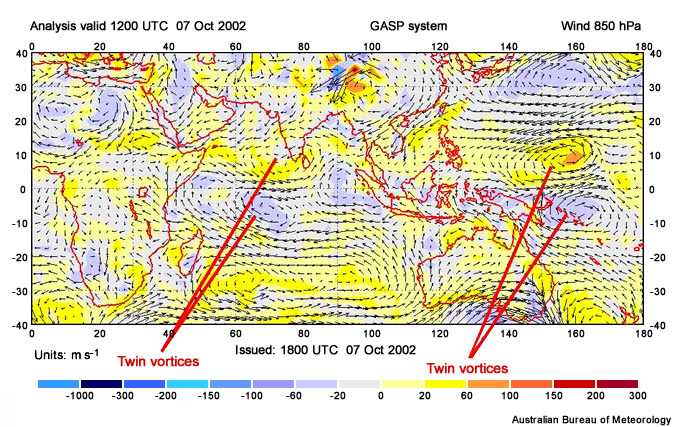
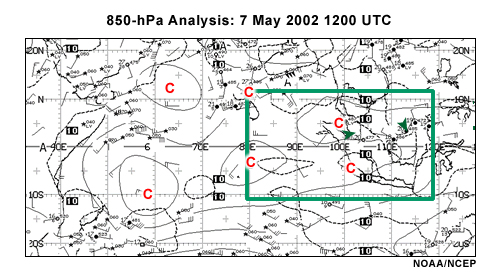
Description:
Evidence of equatorial Rossby waves in the Australian Bureau of Meteorology (BOM) 850hPa tropical wind analysis for 7 October 2002, 12 UTC.
File Name:
eq_rossby_wave_example.jpg
Credits:
Australian Bureau of Meteorology
Copyright Terms:
COMET Standard Terms
of Use
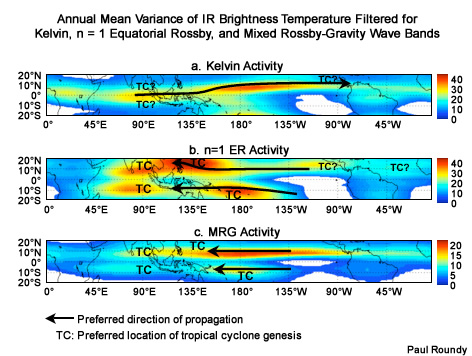
Description:
Distribution of annual mean variance of IR brightness temperature filtered for the (a) Kelvin, (b) n = 1 ER, and (c) MRG. Also shown are preferred direction of propagation and preferred location of tropical cyclone genesis associated with each mode (courtesy of Paul Roundy).
File Name:
eq_wave_activity_TCs.jpg
Credits:
Paul Roundy
Copyright Terms:
COMET Standard Terms
of Use
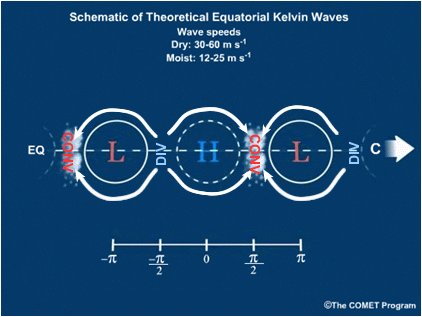
Description:
Conceptual diagram of Equatorial Kelvin wave, annotated with areas of lower-level convergence and divergence.
File Name:
EqKelvin_schematicannot.gif
Credits:
©The COMET Program
Copyright Terms:
COMET Standard Terms
of Use
Description:
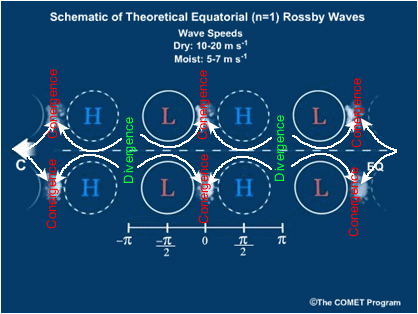
Conceptual diagram of Equatorial Rossby wave, annotated with areas of lower-level convergence and divergence.
File Name:
EqRossby_schematicannot.gif
Credits:
©The COMET Program
Copyright Terms:
COMET Standard Terms
of Use
Description:
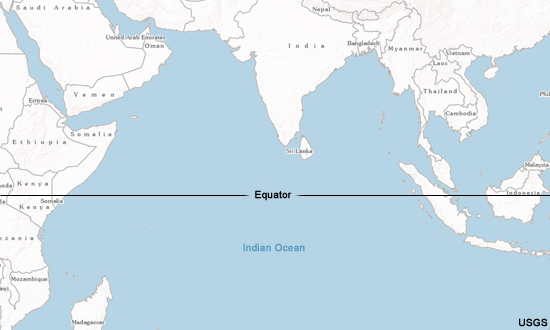
Map of Indian Ocean basin, where case study takes place.
File Name:
indianocean.jpg
Credits:
USGS
Copyright Terms:
COMET Standard Terms
of Use
Description:
Map of Indian Ocean basin, where case study takes place, annotated with answers to question 7 of the MJO/Equatorial Waves case study module.
File Name:
indianocean_feedback.jpg
Credits:
USGS
Copyright Terms:
COMET Standard Terms
of Use
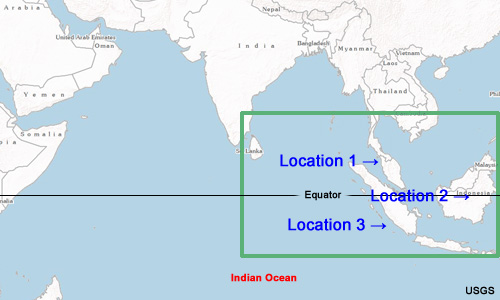
Description:
Map of Indian Ocean basin, where case study takes place, with 4 locations marked for question.
File Name:
indianocean_question.jpg
Credits:
USGS
Copyright Terms:
COMET Standard Terms
of Use
Description:
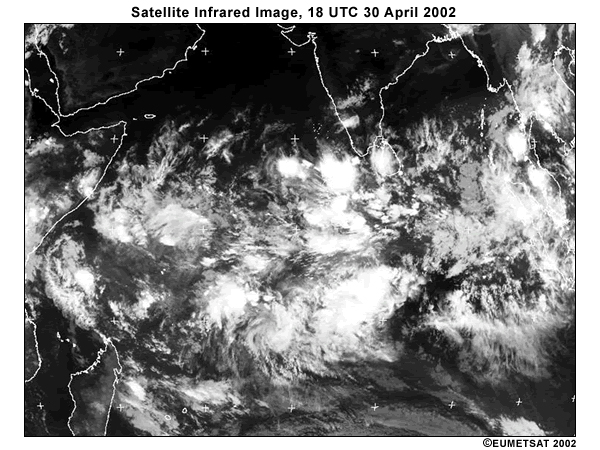
Infrared satellite view of Indian Ocean basin and surrounding landmasses, 18 UTC 30 April 2002. Note bright clouds associated with convection and equatorial waves.
File Name:
IR_2002043018.jpg
Credits:
©EUMETSAT 2002
Copyright Terms:
COMET Standard Terms
of Use
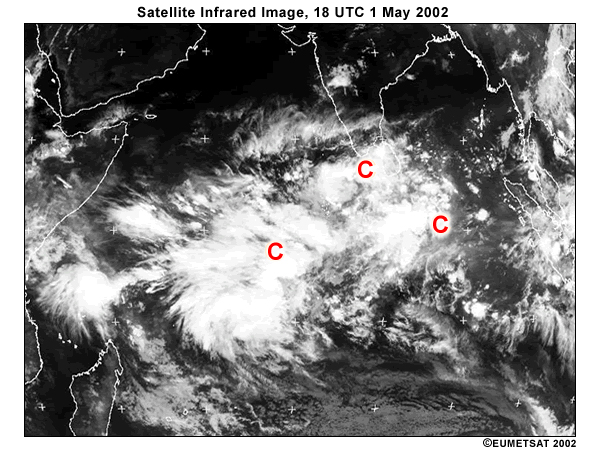
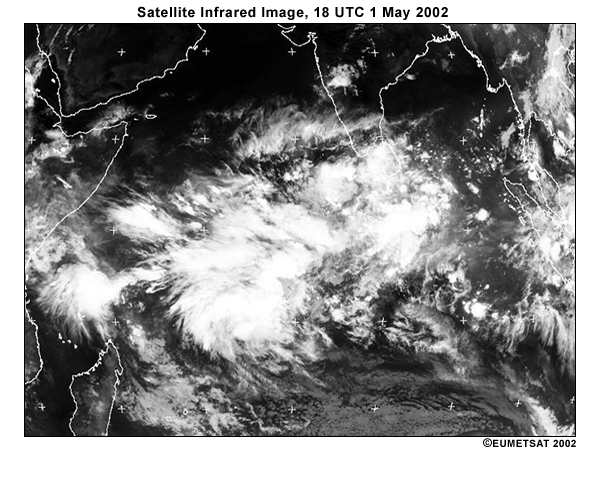
Description:
Infrared satellite view of Indian Ocean basin and surrounding landmasses, 18 UTC 1 May 2002. Note bright clouds associated with convection and equatorial waves.
File Name:
IR_2002050118.jpg
Credits:
©EUMETSAT 2002
Copyright Terms:
COMET Standard Terms
of Use

Description:
Infrared satellite view of Indian Ocean basin and surrounding landmasses, 18 UTC 1 May 2002. Note bright clouds associated with convection and equatorial waves.
File Name:
IR_2002050118a.jpg
Credits:
©EUMETSAT 2002
Copyright Terms:
COMET Standard Terms
of Use
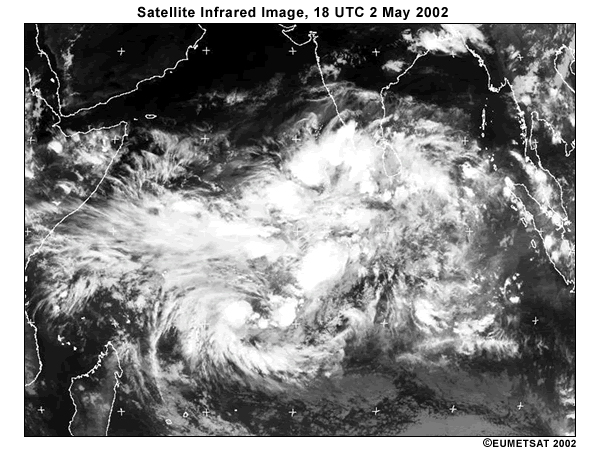
Description:
Infrared satellite view of Indian Ocean basin and surrounding landmasses, 18 UTC 2 May 2002. Note bright clouds associated with convection and equatorial waves.
File Name:
IR_2002050218.jpg
Credits:
©EUMETSAT 2002
Copyright Terms:
COMET Standard Terms
of Use
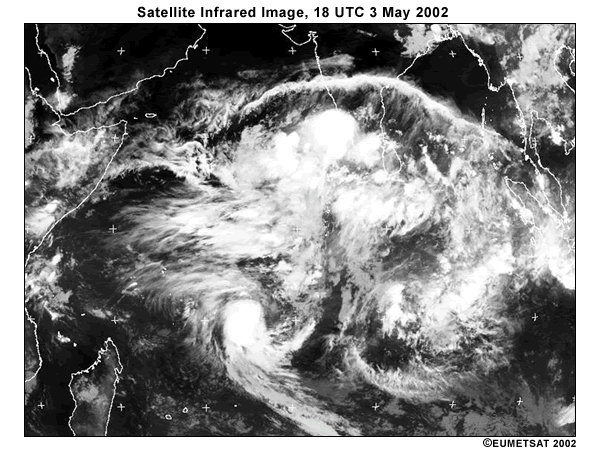
Description:
Infrared satellite view of Indian Ocean basin and surrounding landmasses, 18 UTC 3 May 2002. Note bright clouds associated with convection and equatorial waves.
File Name:
IR_2002050318.jpg
Credits:
©EUMETSAT 2002
Copyright Terms:
COMET Standard Terms
of Use
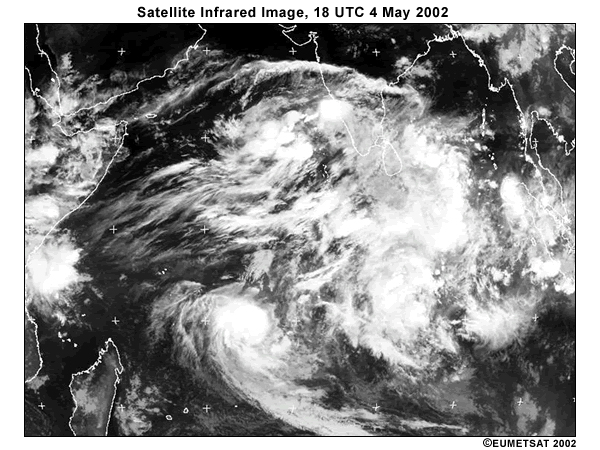
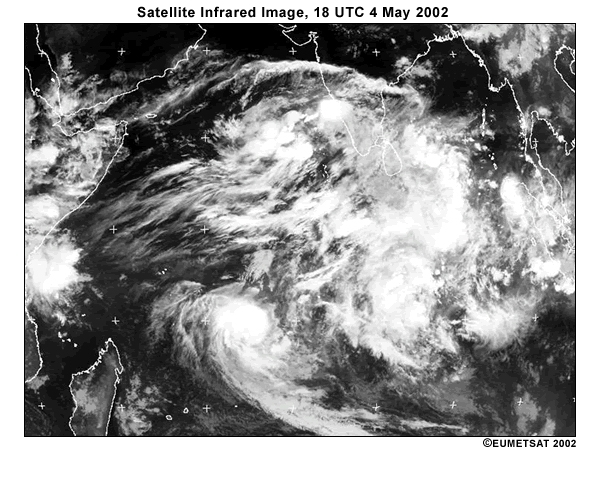
Description:
Infrared satellite view of Indian Ocean basin and surrounding landmasses, 18 UTC 4 May 2002. Note bright clouds associated with convection and equatorial waves.
File Name:
IR_2002050418.jpg
Credits:
©EUMETSAT 2002
Copyright Terms:
COMET Standard Terms
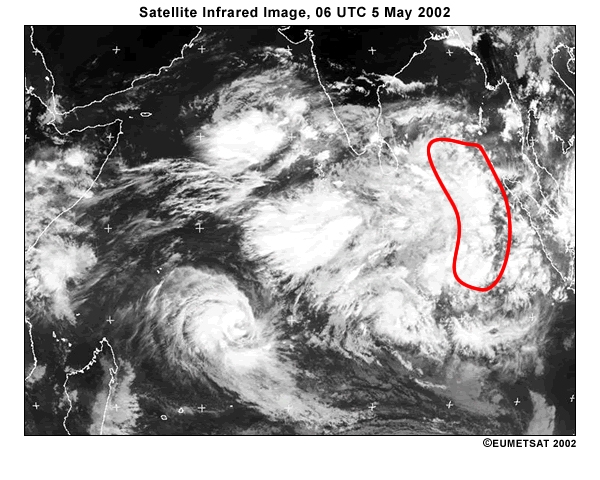
of Use
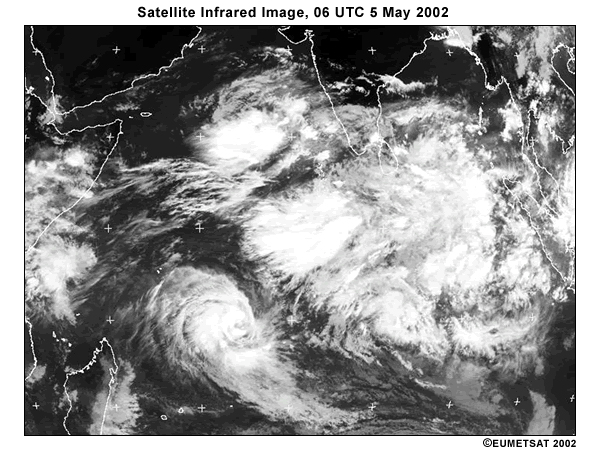
Description:
Infrared satellite view of Indian Ocean basin and surrounding landmasses, 06 UTC 5 May 2002. Note bright clouds associated with convection and equatorial waves.
File Name:
IR_2002050506.jpg
Credits:
©EUMETSAT 2002
Copyright Terms:
COMET Standard Terms
of Use
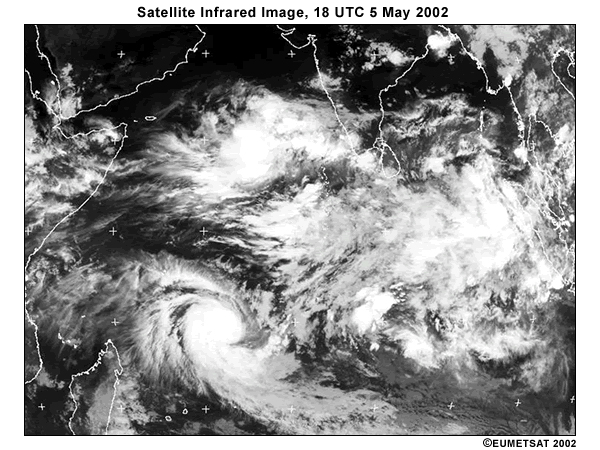
Description:
Infrared satellite view of Indian Ocean basin and surrounding landmasses, 18 UTC 5 May 2002. Note bright clouds associated with convection and equatorial waves.
File Name:
IR_2002050518.jpg
Credits:
©EUMETSAT 2002
Copyright Terms:
COMET Standard Terms
of Use
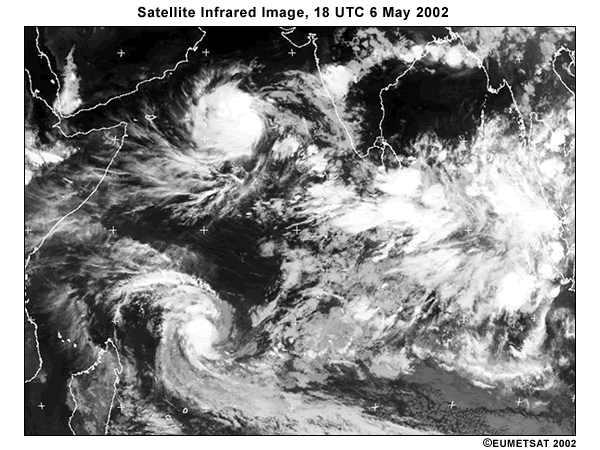
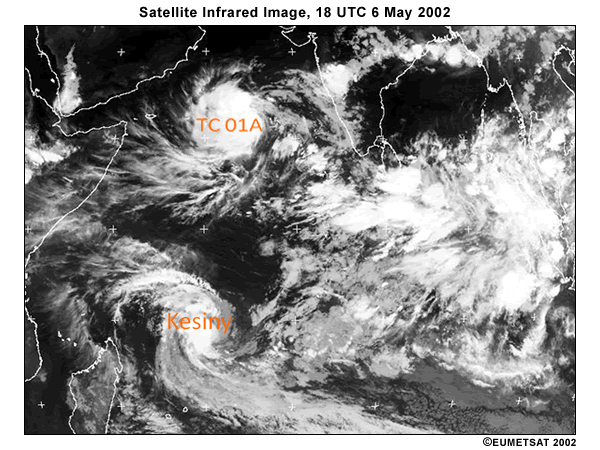
Description:
Infrared satellite view of Indian Ocean basin and surrounding landmasses, 18 UTC 6 May 2002. Note bright clouds associated with convection and equatorial waves.
File Name:
IR_2002050618.jpg
Credits:
©EUMETSAT 2002
Copyright Terms:
COMET Standard Terms
of Use
Description:
Infrared satellite view of Indian Ocean basin and surrounding landmasses, 18 UTC 6 May 2002. Note bright clouds associated with convection and equatorial waves. Graphic is annotated with Mixed Rossby-Gravity wave-generated tropical cyclones.
File Name:
IR_2002050618a.jpg
Credits:
©EUMETSAT 2002
Copyright Terms:
COMET Standard Terms
of Use
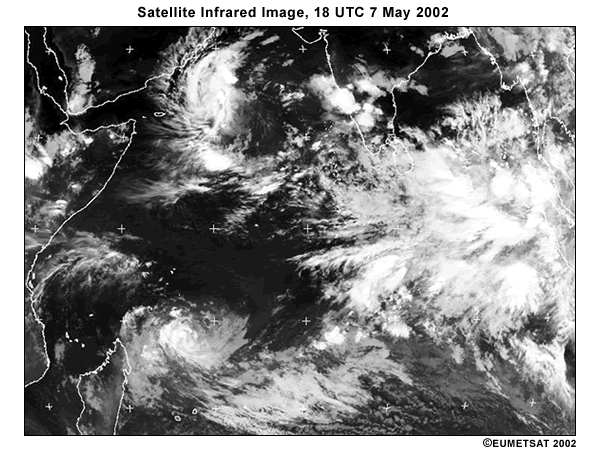
Description:
Infrared satellite view of Indian Ocean basin and surrounding landmasses, 18 UTC 7 May 2002. Note bright clouds associated with convection and equatorial waves.
File Name:
IR_2002050718.jpg
Credits:
©EUMETSAT 2002
Copyright Terms:
COMET Standard Terms
of Use
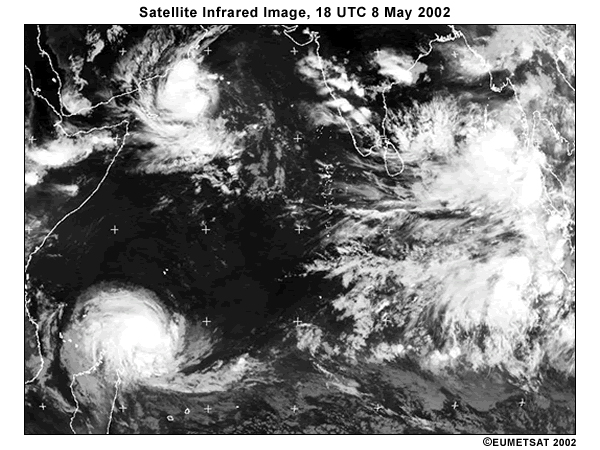
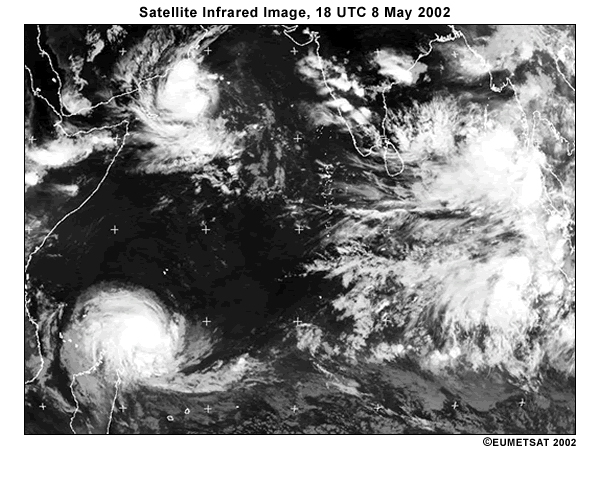
Description:
Infrared satellite view of Indian Ocean basin and surrounding landmasses, 18 UTC 8 May 2002. Note bright clouds associated with convection and equatorial waves.
File Name:
IR_2002050818.jpg
Credits:
©EUMETSAT 2002
Copyright Terms:
COMET Standard Terms
of Use
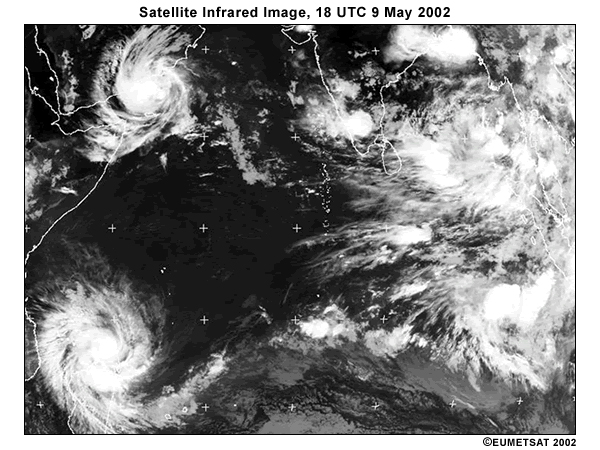
Description:
Infrared satellite view of Indian Ocean basin and surrounding landmasses, 18 UTC 9 May 2002. Note bright clouds associated with convection and equatorial waves.
File Name:
IR_2002050918.jpg
Credits:
©EUMETSAT 2002
Copyright Terms:
COMET Standard Terms
of Use
Description:
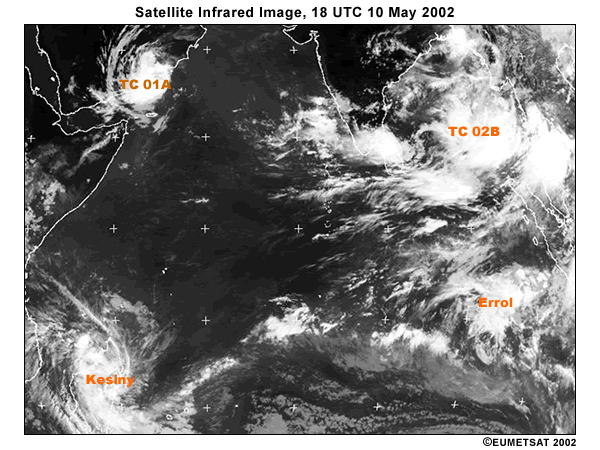
Infrared satellite view of Indian Ocean basin and surrounding landmasses, 18 UTC 10 May 2002. Note bright clouds associated with convection and equatorial waves.
File Name:
IR_2002051018.jpg
Credits:
©EUMETSAT 2002
Copyright Terms:
COMET Standard Terms
of Use
Description:
Data loop of IR satellite imagery
File Name:
IR_loop1_0001.htm
Credits:
©EUMETSAT 2002
Copyright Terms:
COMET Standard Terms
of Use
Description:
Data loop of IR satellite imagery
File Name:
IR_loop2_0001.htm
Credits:
©EUMETSAT 2002
Copyright Terms:
COMET Standard Terms
of Use
Description:
Data loop of IR satellite imagery
File Name:
IR_loop3_0001.htm
Credits:
©EUMETSAT 2002
Copyright Terms:
COMET Standard Terms
of Use
Description:
Data loop of IR satellite imagery
File Name:
IR_loop4_0001.htm
Credits:
©EUMETSAT 2002
Copyright Terms:
COMET Standard Terms
of Use
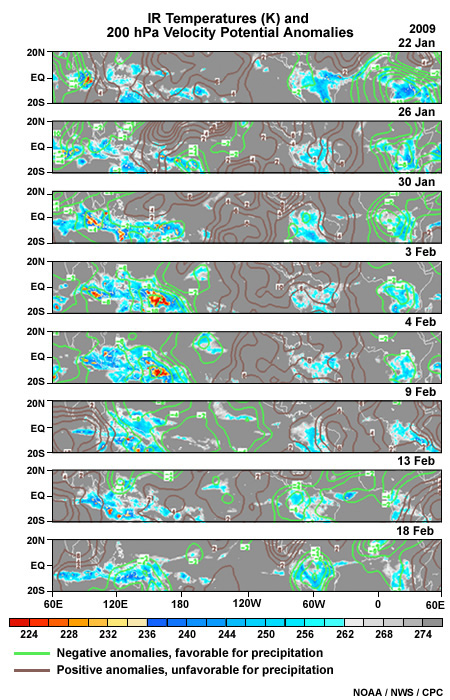
Description:
Part of an MJO cycle indicated by cloud top IR temperatures and velocity potential anomalies at 200 hPa.
File Name:
ir_temp_vel_anom.jpg
Credits:
NOAA/NWS/CPC
Copyright Terms:
COMET Standard Terms
of Use
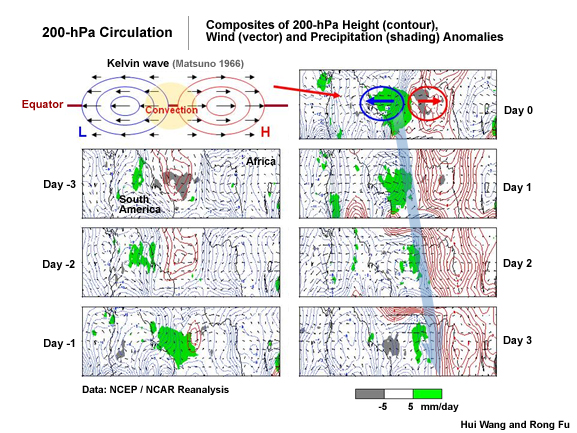
Description:
Composite of 200 hPa height (contour), wind (vector) and precipitation (shading) anomalies. Top left shows the theoretical Kelvin wave derived by Matsuno (1966).
File Name:
kelvin_wave_wang_fu2005.jpg
Credits:
Hui Wang and Rong Fu
Copyright Terms:
COMET Standard Terms
of Use
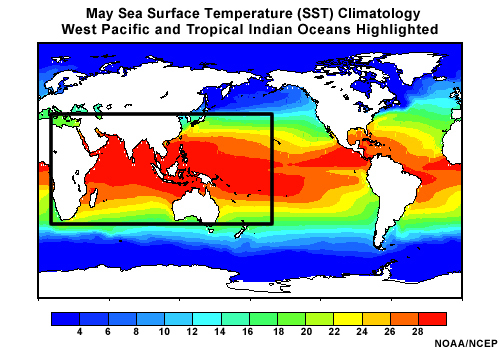
Description:
National Centers for Environmental Prediction May Sea Surface Temperature climatology. Region of interest is highlighted.
File Name:
MayClimo.jpg
Credits:
NOAA/NCEP
Copyright Terms:
COMET Standard Terms
of Use

Description:
Conceptual diagram of mixed Rossby-Gravity wave, annotated with areas of lower-level convergence and divergence.
File Name:
MixedRossbyGravity_schematic.jpg
Credits:
©The COMET Program
Copyright Terms:
COMET Standard Terms
of Use
Description:
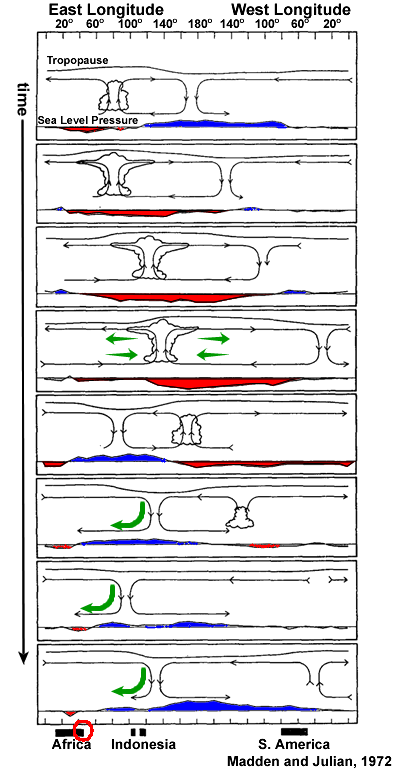
Schematic depiction of the longitudinal progression of the MJO across the tropical Indian and Pacific Oceans. Time progresses downwards at roughly 5 day intervals.
File Name:
mjo_madden72_print.gif
Credits:
Madden and Julian, 1972
Copyright Terms:
COMET Standard Terms
of Use
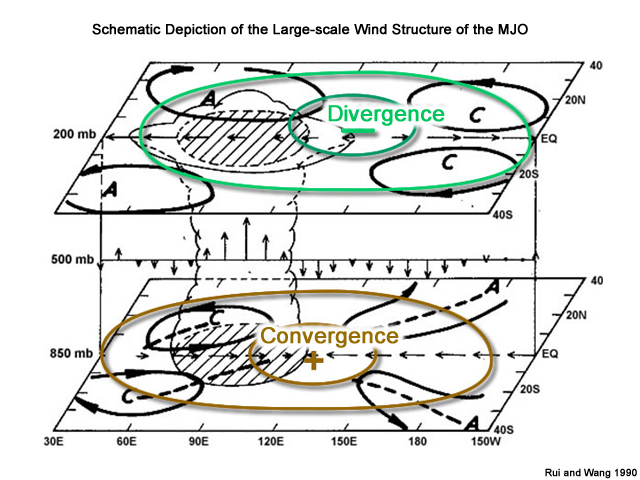
Description:
Conceptual diagram of Madden-Julian Oscillation (MJO) with lower level winds, upper level winds, idealized velocity potential lines and convergence/divergence couplet annotated.
File Name:
MJO_wind_structure.jpg
Credits:
Rui and Wang 1990
Copyright Terms:
COMET Standard Terms
of Use
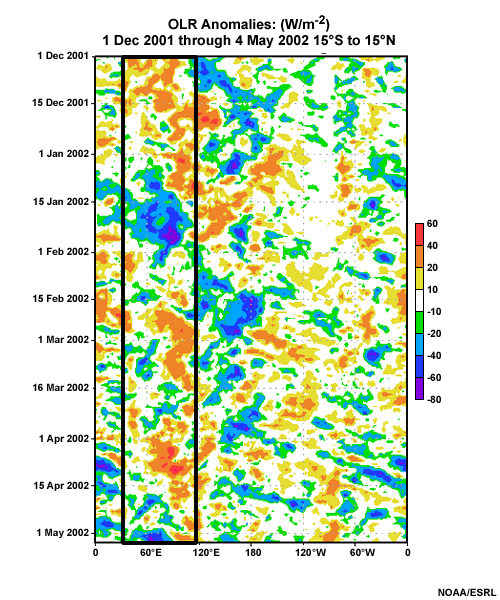
Description:
Hovmoller diagram of mean outgoing longwave radiation anomalies from 15 South to 15 North latitude, and from 0 East to 0 West longitude, 1 January to 4 May 2002. Later than this date, the OLR is obscured.
File Name:
olranom_20011201_20020504.jpg
Credits:
NOAA/ESRL
Copyright Terms:
COMET Standard Terms
of Use
Description:
NOAA/NCEP 850-hPa analysis of Indian Ocean basin and adjacent landmasses, 12 UTC 7 May 2002 annotated with rectangle for question 7 in case study.
File Name:
Q7_850anl_2002050712.jpg
Credits:
NOAA/NCEP
Copyright Terms:
COMET Standard Terms
of Use
Description:
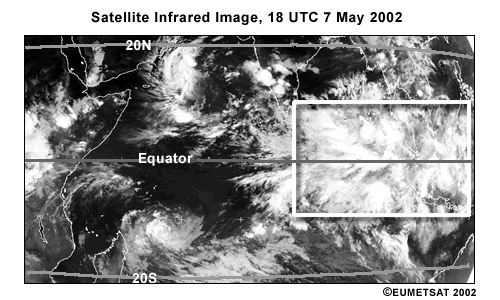
Infrared satellite view of Indian Ocean basin and surrounding landmasses, 18 UTC 7 May 2002. Note bright clouds associated with convection and equatorial waves. Annotated with rectangle for question 7 in case study.
File Name:
Q7_IR_2002050718.jpg
Credits:
©EUMETSAT 2002
Copyright Terms:
COMET Standard Terms
of Use
Description:
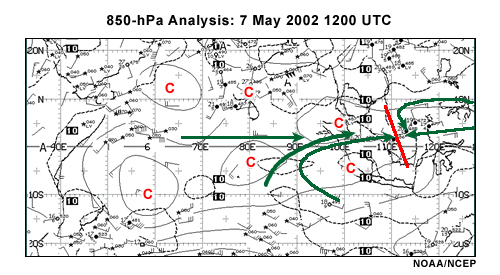
NOAA/NCEP 850-hPa analysis of Indian Ocean basin and adjacent landmasses, 12 UTC 7 May 2002 annotated with location of waves and resulting 850-hPa winds.
File Name:
Q7F_850anl_2002050712.jpg
Credits:
NOAA/NCEP
Copyright Terms:
COMET Standard Terms
of Use
Description:
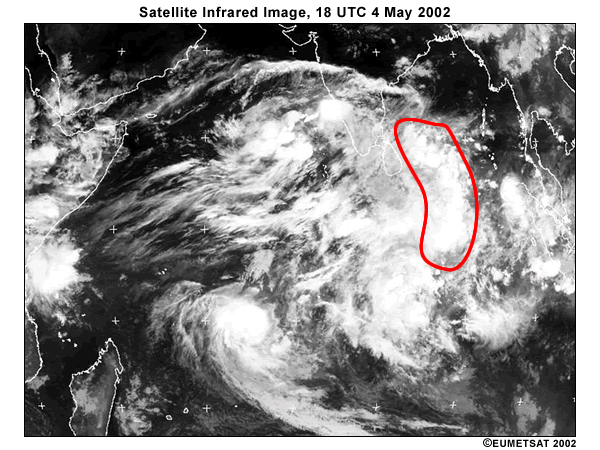
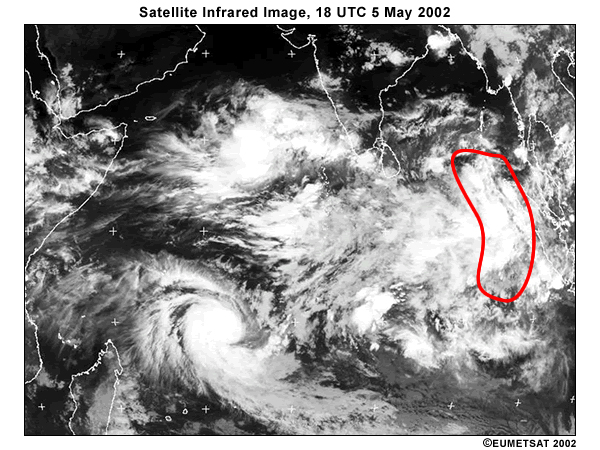
Infrared satellite view of Indian Ocean basin and surrounding landmasses, 18 UTC 4 May 2002. Red contour labels location of convection that seems to generate Kelvin wave.
File Name:
Q7F_IR_2002050418.jpg
Credits:
©EUMETSAT 2002
Copyright Terms:
COMET Standard Terms
of Use
Description:
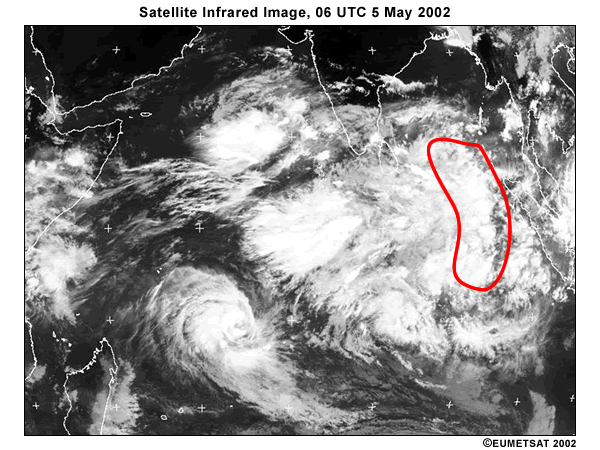
Infrared satellite view of Indian Ocean basin and surrounding landmasses, 06 UTC 5 May 2002. Red contour labels location of convection that seems to generate Kelvin wave.
File Name:
Q7F_IR_2002050506.jpg
Credits:
©EUMETSAT 2002
Copyright Terms:
COMET Standard Terms
of Use
Description:
Infrared satellite view of Indian Ocean basin and surrounding landmasses, 18 UTC 5 May 2002. Red contour labels location of convection that seems to generate Kelvin wave.
File Name:
Q7F_IR_2002050518.jpg
Credits:
©EUMETSAT 2002
Copyright Terms:
COMET Standard Terms
of Use
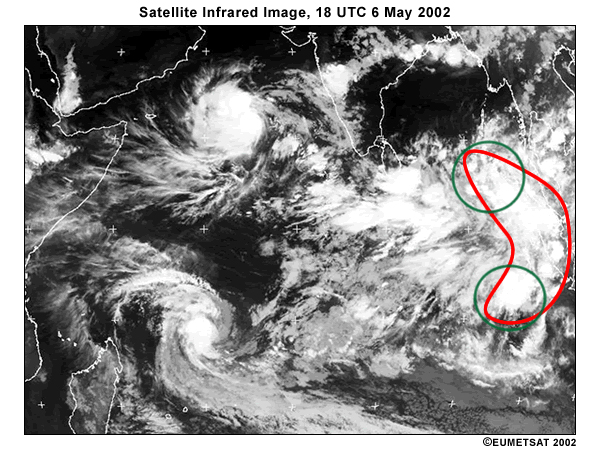
Description:
Infrared satellite view of Indian Ocean basin and surrounding landmasses, 18 UTC 6 May 2002. Red contour labels location of convection that seems to generate Kelvin wave.
File Name:
Q7F_IR_2002050618.jpg
Credits:
©EUMETSAT 2002
Copyright Terms:
COMET Standard Terms
of Use
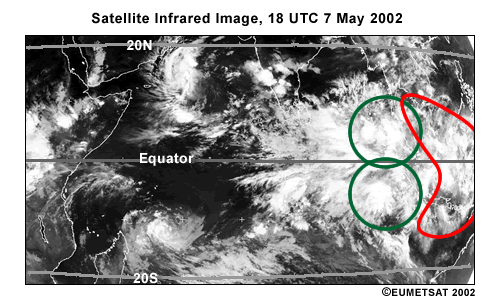
Description:
Infrared satellite view of Indian Ocean basin and surrounding landmasses, 18 UTC 7 May 2002. Red contour labels location of convection that seems to generate Kelvin wave. Green circles indicate the locations of symmetric equatorial Rossby wave circulations forced by the heating of the Kelvin wave.
File Name:
Q7F_IR_2002050718.jpg
Credits:
©EUMETSAT 2002
Copyright Terms:
COMET Standard Terms
of Use
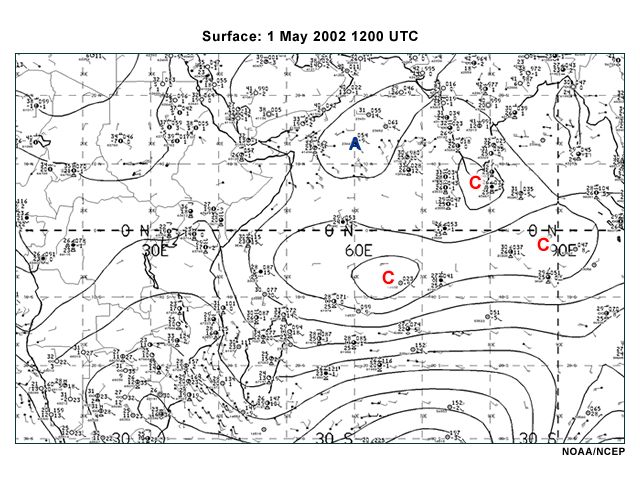
Description:
NOAA/NCEP surface analysis of Indian Ocean basin and adjacent landmasses, 12 UTC 1 May 2002
File Name:
sfcanl_2002050112.jpg
Credits:
NOAA/NCEP
Copyright Terms:
COMET Standard Terms
of Use
Description:
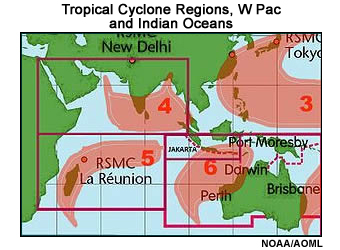
Regions of tropical cyclone formation and propagation in the western Pacific and Indian Oceans. Polygons indicate regions of responsibility for New Delhi, La Reunion, and Australia, plus part of region for which Tokyo is responsible.
File Name:
TC_WPac_IO.jpg
Credits:
NOAA/AOML
Copyright Terms:
COMET Standard Terms
of Use