Introduction
A major hurricane made landfall to the east of Mobile Bay, Alabama and grew in size within the 12-hour period before making landfall. The strongest winds extended about 40 miles from the center of the storm. The image below shows the observed flooding that occurred using the Sea, Lakes, and Overland Surges from Hurricanes (SLOSH) model to display the data. The thin black line represents the observed storm track and the solid black circle denotes the radius of maximum winds.
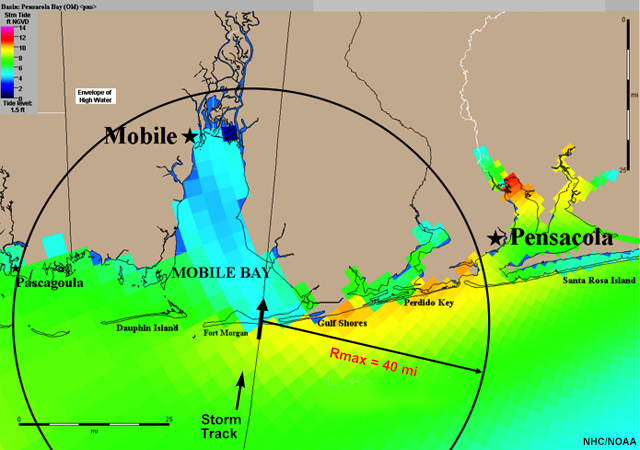
Notice that Mobile Bay had between 2 to 4 feet of storm surge above NGVD 29, and the Pensacola, Florida area experienced nearly 8 to 12 feet of storm surge.
The tabs below show the deterministic and probabilistic storm surge forecasts issued 12 hours prior to landfall. Review the data in each tab and answer the question below.
Observations
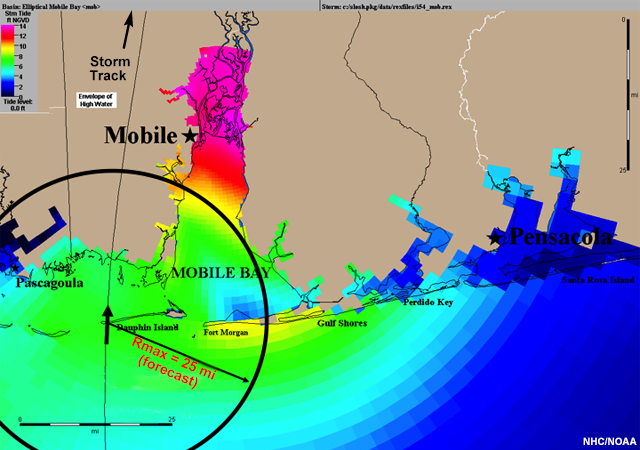
Deterministic Forecast
The thin black line represents the deterministic forecast track and the solid black circle denotes the radius of maximum winds. For this hurricane, the strongest winds extend about 25 miles from the center of the storm.
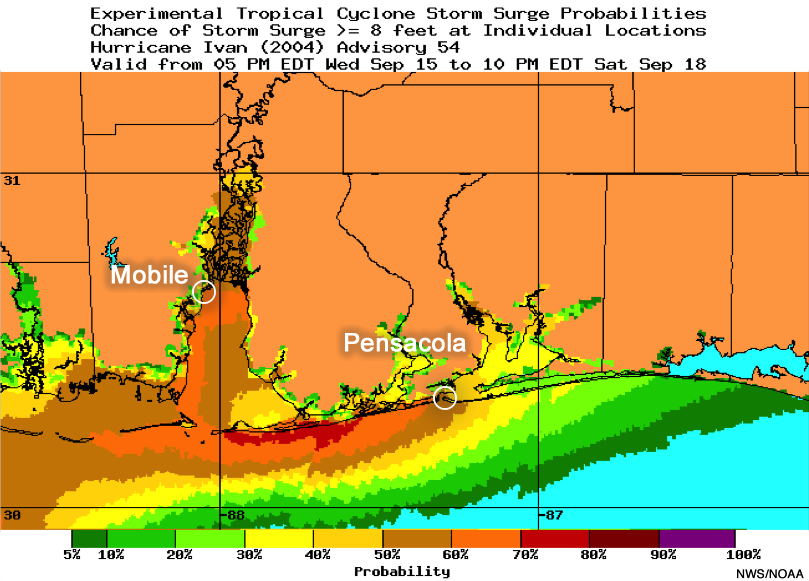
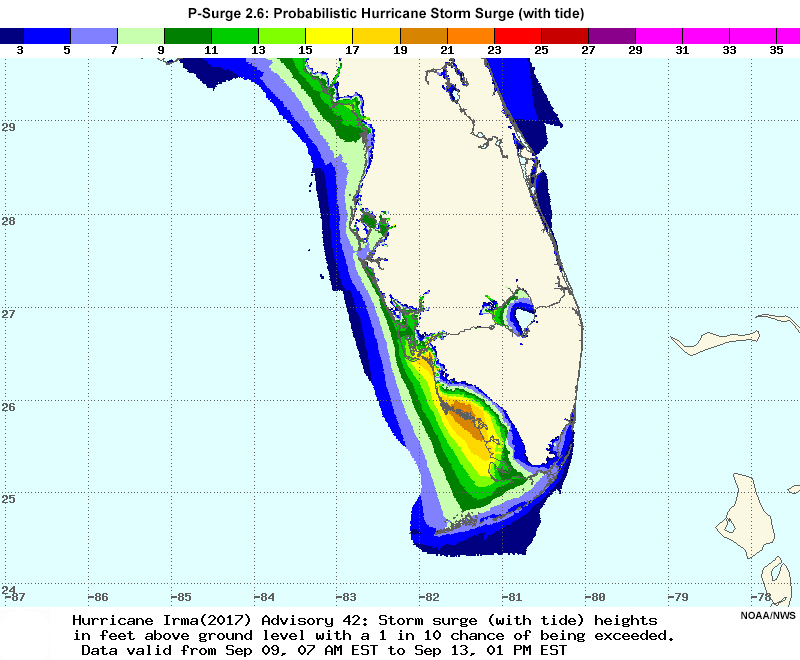
Probabilistic Forecast
The Probabilistic Storm Surge (P-Surge) product shows the probability of storm surge exceeding 8 feet at individual locations. The probabilities are indicated by the colors, which are defined in the legend at the bottom.
Question
Which forecast best represented the overall storm surge risk from the hurricane? Select the best answer.
The correct answer is b.
The deterministic forecast shows the highest storm surge around Mobile in the northern part of the bay. The orientation of the forecast track would allow the storm to push a lot of water into Mobile Bay, where storm surge could reach 14 feet above NGVD 29 in the upper reaches of the bay. However, the deterministic forecast shows 2 to 3 feet of storm surge east of the bay in Pensacola, which would only cause minor flooding for this area. The threat to Pensacola is much greater than this.
The probabilistic forecast shows that both areas have similar chances of experiencing life-threatening storm surge of at least 8 feet: 60% to 70% for locations in the the Mobile Bay area, and 50% to 60% for locations in the Pensacola area. For decision support, there are no significant differences in storm surge probabilities between Mobile Bay and Pensacola. The higher observed storm surge occurred near Pensacola (not Mobile Bay), due to the slight eastward shift in storm track and increase in storm size within the 12-hour period prior to landfall.
This forecast comparison emphasizes how forecast uncertainties in tropical cyclone characteristics (track, forward speed, winds, etc.) can play a major role in the magnitude and location of the storm surge forecast by the SLOSH model. The probabilistic forecast (P-Surge) accounts for multiple forecast outcomes by considering uncertainties in storm track, size, and intensity. This makes it possible for P-Surge to provide a better representation of the storm surge risk in this case.
This lesson will describe the real-time storm surge products that are issued by the National Hurricane Center (NHC) and National Weather Service Weather Forecast Offices (NWS WFOs) during a significant tropical cyclone event along the Atlantic and Gulf coasts of the United States: the Probabilistic Storm Surge (P-Surge) product, the Potential Storm Surge Flooding Map, the Tropical Cyclone Public Advisory, and the Storm Surge Watch and Warning.
Real-time Storm Surge Products
Forecasting storm surge risk is a challenge because of the uncertainties in the behavior of a tropical cyclone. Relying on a single deterministic storm surge forecast is unwise because it provides only one of many plausible outcomes and is likely imperfect.
The next part of this lesson will focus on the Probabilistic Storm Surge (P-Surge) product, and other products based on it, such as the Potential Storm Surge Flooding Map and the Storm Surge Watch/Warning.
| Ensemble Guidance | |
|---|---|
| Type | Product |
| Pre-Computed |
|
| Real-Time |
|
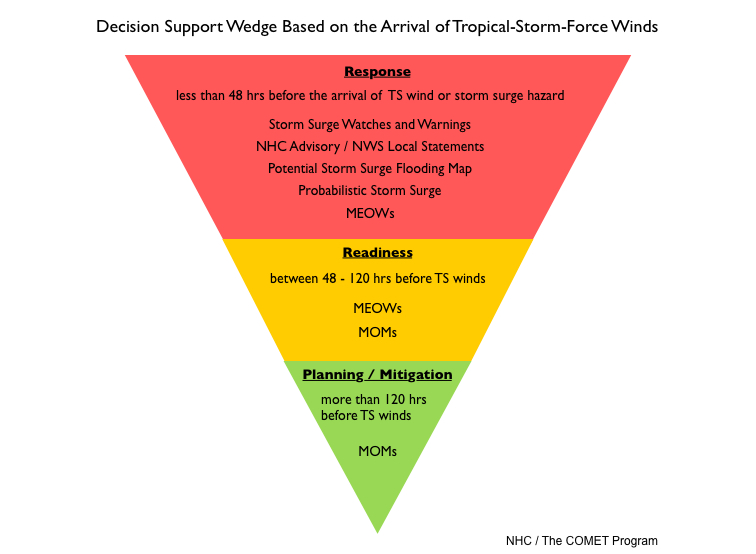
The NHC's Storm Surge Unit has developed a decision-support wedge that illustrates a three-tiered approach to using their storm surge products before, during, and after a tropical cyclone makes landfall. Review the wedge and answer the question below.
Question
In what phase do the real-time storm surge products become available? Select the best answer.
The correct answer is c.
Real-time storm surge products become available within 48 hours of the arrival of tropical-storm-force winds along the coast, or within the "Response" phase shown in red (the Watch/Warning time frame). These products are based on the forecast for that particular storm rather than hypothetical storms that the pre-computed MOMs and MEOWs are based on. During this time, the NHC advisories and local statements from the NWS WFOs are also available.
Evacuation decision-making is based, in part, on clearance times. That is, the time it takes to evacuate people from the threatened areas. For locations that have clearance times greater than 48 hours, initial decisions are usually based on MEOWs. Within 48 hours, implemented decisions are often refined based on real-time products. For locations that have clearance times less than 48 hours, real-time products offer the best guidance for effective decision-making.
For more information about MOMs, MEOWs, and P-Surge, see COMET’s Forecasting Tropical Cyclone Storm Surge lesson.
Probabilistic Storm Surge
Storm surge probabilities, much like wind speed probabilities, are based on the NHC official forecast advisory. They are tuned to the actual storm threatening the coast.
The availability of P-Surge coincides with the issuance of hurricane (and sometimes tropical storm) watches and warnings along the coast within 48 hours of the arrival of tropical-storm-force winds. The P-Surge product is ready approximately 30-60 minutes after the NHC advisory is released. For example, if an advisory goes out by 5 PM Eastern Daylight Time, P-Surge will be available by 5:30-6:00 PM.
The P-Surge product accounts for uncertainties in the forecast. Since forecasters cannot make a perfect tropical cyclone forecast (to learn more, see COMET's Tropical Cyclone Forecast Uncertainty lesson), P-Surge alters some of the parameters that go into forecasting storm surge. In other words, it will expand the range of possible storm surge outcomes by altering the track, landfall location, size, forward speed, and intensity of the tropical cyclone using historical errors. The probabilistic spread of these types of storms is based on the quality of the NHC forecasts over the past several years.
The P-Surge product accounts for tides and displayed water level heights are available above the NAVD 88 datum and above ground level.
Potential Storm Surge Flooding Map
The Potential Storm Surge Flooding Map provides a quantitative risk assessment for community decision-makers. Its goal is to depict the risk of storm surge from a particular tropical cyclone using a high-resolution map. The Potential Storm Surge Flooding Map is based on the version of P-Surge that includes tidal effects, and is always based on the 10% exceedance threshold.

Question
Why is it a good idea to use the 10% exceedance threshold? Select the best answer.
The correct answer is a.
The 10% exceedance threshold is not an absolute worst-case scenario, but it is a reasonable worst-case scenario for individual locations of interest. At each location, if protective actions are taken against the value depicted, then in 90% of cases (9 in 10 times) you will be well-prepared. The map shows how high above ground the water could reach at individual locations. Notice that it says "could", not "will." It is unwise to offer a specific, deterministic forecast for storm surge because of the forecast uncertainty. Since storm surge is a leading killer in hurricanes, the map offers forecast guidance having the least regret for decision-making and widest safety margin (within reason).
Remember, the map does not depict an expected storm surge flooding footprint, but rather what COULD occur at individual locations.
For more information about the 10% exceedance products, see COMET's Forecasting Tropical Cyclone Storm Surge lesson.
The initial Potential Storm Surge Flooding Map for a tropical cyclone will be issued at the same time as the initial Hurricane Watch or Storm Surge Watch in most cases. The map will be available about 60-90 minutes following the advisory release. That is, once P-Surge is available (30 minutes after the advisory), the scripts that run to produce this map could take another 30 to 60 minutes. Overall, the Potential Storm Surge Flooding Map will be available about 1 to 1.5 hours after the NHC advisory is released.
Potential Storm Surge Flooding Map » Datum Method
Question
Consider this question: Do people living in Florida’s coastal areas know the elevation of their homes? Select the best answer.
The correct answer is c.
A study by Dr. Jay Baker from Florida State University found that only 14% of those surveyed knew the elevation of their home. Of the rest, 55% did not venture a guess, 12% indicated a lower elevation than reality, and 19% indicated a higher elevation. These results show that most people do not know the elevation of their homes or businesses.
This is a problem because in the past NHC has issued storm surge products based on the geodetic and tidal datums. People do not know what their elevation is relative to those specific datums. This makes it very hard to interpret a storm surge forecast and know what type of flooding you might get at your house.
To better serve the public, the NHC has transitioned its products to storm surge above ground level or inundation. Let's see what difference this makes.
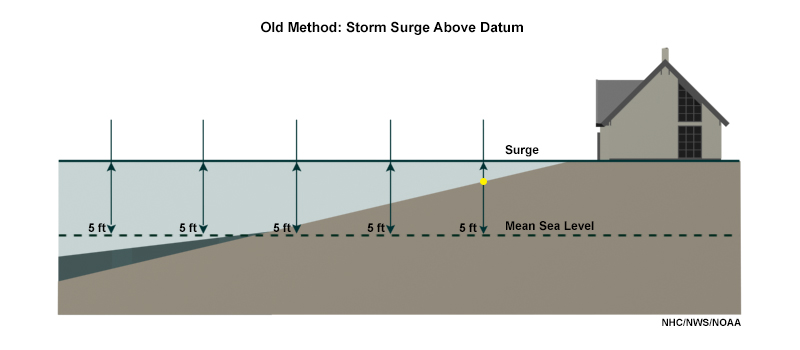
The following example shows the old method of using storm surge above datum, with the surge height indicated by the solid line, and the mean sea level datum indicated by the dashed line.
Question
What is the potential storm surge inundation at the point (yellow dot)? Select the best answer.
The correct answer is d.
It is hard to determine the storm surge inundation at that point because there is no indication of the difference between the ground surface and the mean sea level datum. We would say that the forecast storm surge height is 5 ft above mean sea level. Even if that forecast was right, the amount of inundation that would occur at any location along the coast is going to vary depending on the elevation of the ground. We would see about 5 ft of actual inundation right where the ocean meets the land. However, notice that mean sea level does not change with the ground level - it stays constant. As ground level rises inland, the actual water levels will be less than 5 ft, but the storm surge is still 5 ft above mean sea level.

Question
How high above ground level is the potential storm surge inundation at the point? Select the best answer.
The correct answer is c.
When using above ground as the datum, it is easy to determine that the forecast storm surge height is 1 ft. As the elevation of the ground increases, we see less storm surge inundation. The point that is well inland and some feet above mean sea level may experience 1 ft of inundation, whereas there is 5 ft of inundation at the coast where the elevation is lower. The new method is a much easier way to communicate storm surge information to those along the coast who do not know their exact elevation.
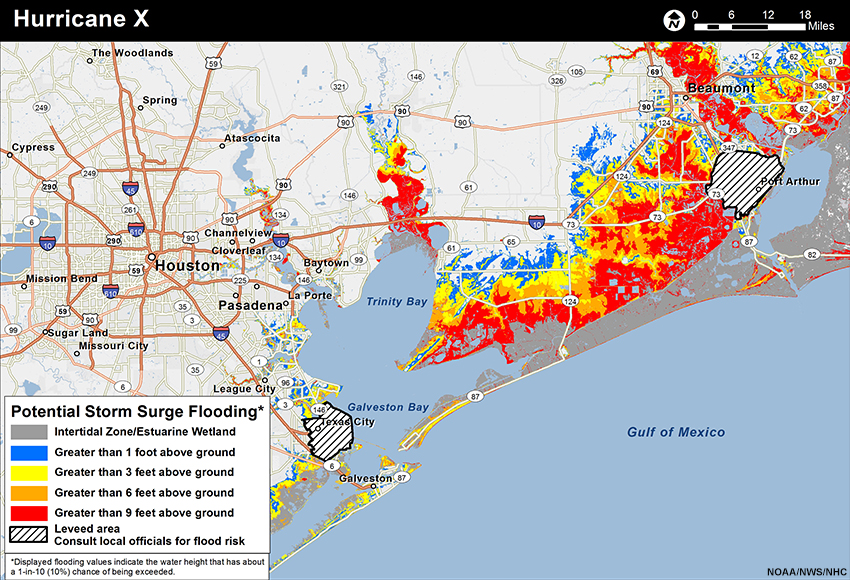
Now we will practice interpreting the following Potential Storm Surge Flooding Map for a hypothetical storm threatening the Houston, Texas area.
Question
What is the potential storm surge height above ground for locations A through D on this map?
Click and drag each value range to the appropriate location on the map.
Location A could experience more than 9 ft of storm surge flooding above ground level; location B greater than 3 ft; location C greater than 6 ft, and location D greater than 1 ft.
Question
How would you summarize the potential storm surge height and its probability of occurrence for location A? Select the best answer.
The correct answer is a.
The Potential Storm Surge Flooding Map is based on the 10% exceedance threshold and should be thought of as a reasonable worst-case scenario, or what could happen at each location given the uncertainties in the forecast. Greater than 9 ft of storm surge could occur at location A making (d) incorrect, but the amount is neither expected nor likely, so option (b) is also incorrect. Also, because the exceedance maps are location-specific, conclusions about how much storm surge will occur within a particular stretch of coastline cannot be made. This makes option (c) incorrect.
The map shows that the flooding is not limited to the barrier islands; it can reach many miles inland from the actual coastline. This gives people along the coast a much better representation of whether they are in the threat area of the storm surge.
Potential Storm Surge Flooding Map » Map Details
The Potential Storm Surge Flooding Map uses the latest SLOSH basins as its baseline grid and factors in a coastal elevation "grid". Each gridpoint has P-Surge data that is smoothed to a higher resolution to generate the map.
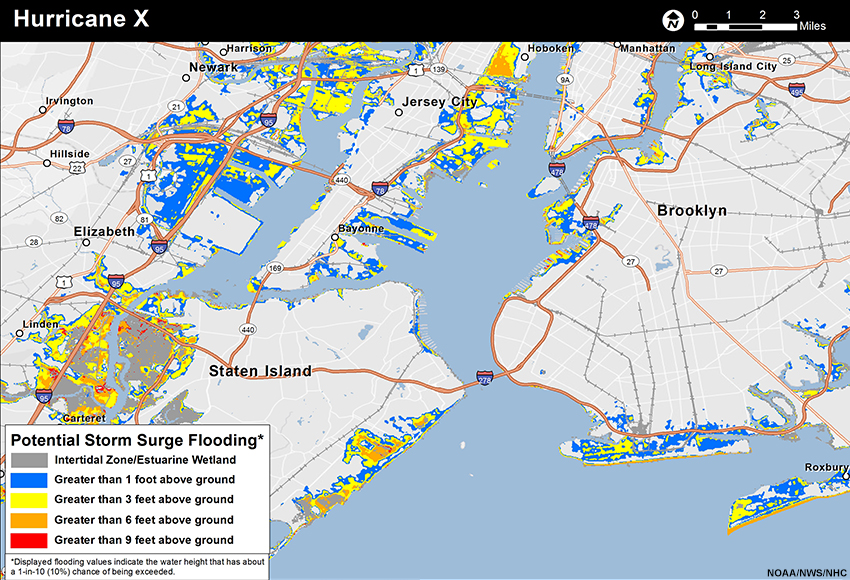
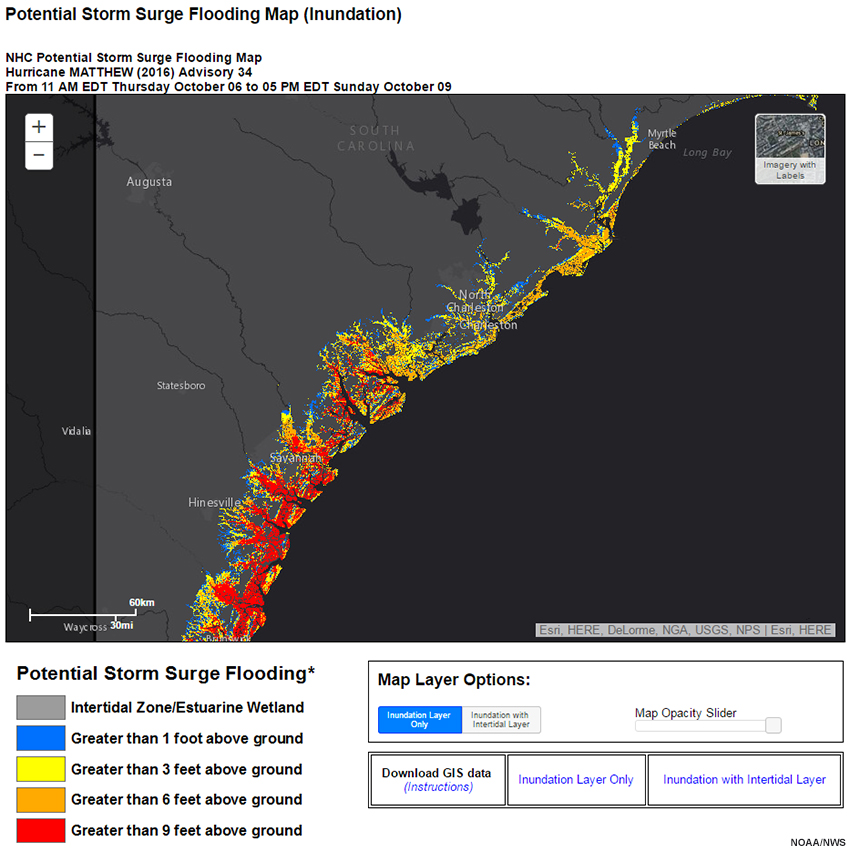
The image above is the Potential Storm Surge Flooding Map for the Staten Island/Brooklyn area in New York. Areas in red have the potential for the highest inundation, or the most amount of water sitting on what would normally be dry ground. As you go farther inland, the inundation values drop to their lowest and are shown in blue.
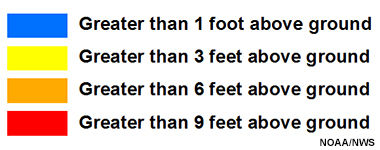
The height of the storm surge flooding above ground level is expressed in four different categories: greater than 1 ft above ground (shown in blue), greater than 3 ft above ground (shown in yellow), greater than 6 ft above ground (shown in orange), and greater than 9 ft above ground (shown in red).
The Potential Storm Surge Flooding Map also contains a mask for the intertidal zone, or the area that is above water at low tide and under water at high tide. This mask also shows locations of estuarine wetlands, or lands that are saturated with water, either permanently or seasonally. This selectable mask layer allows users to differentiate between areas that could experience consequential flooding of normally dry ground and areas that routinely flood during typical high tides. The intertidal mask is depicted as gray on the Potential Storm Surge Flooding Map.
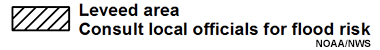
Potential storm surge flooding is not depicted within certain levee areas, such as the Hurricane & Storm Damage Risk Reduction System in Louisiana. These areas are highly complex and overtopping water levels are difficult to predict. Users are urged to consult local officials for flood risk inside these leveed areas. If applicable to the region displayed by the map, these leveed areas will be depicted with a black and white diagonal hatch pattern.
Potential Storm Surge Flooding Map » Interactive Interface
During a tropical cyclone event, the Potential Storm Surge Flooding Map is available (online) in an interactive interface, where users can zoom in/out and pan around. Importantly, scientific and technological limitations prevent zooming into an individual's home address to determine the height of storm surge inundation. Since the map is to be used for assessing community-scale storm surge threats, it confines the scope of map depictions to that level.
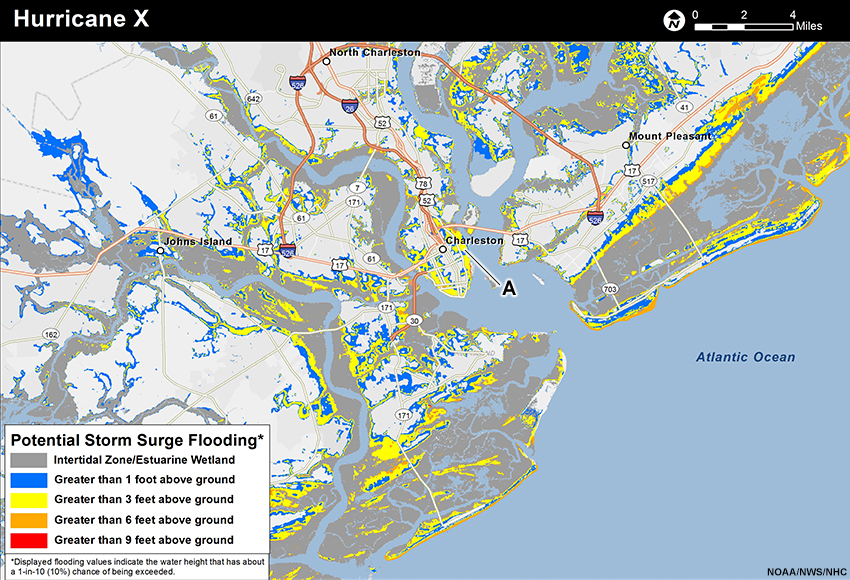
Before moving to the next section, let’s practice interpreting the Potential Storm Surge Flooding Map again. This time, it is for a hypothetical storm threatening the Charleston, South Carolina area.
Question
How would you summarize the potential storm surge height and its probability of occurrence for location A? Select the best answer.
The correct answer is d.
The Potential Storm Surge Flooding Map depicts what could happen at individual locations from the reasonable worst-case scenario perspective. Greater than 3 ft of storm surge could occur at location A making (b) incorrect, but the amount is neither expected nor likely, so option (a) is also incorrect. Also, because the exceedance maps are location specific, conclusions about how much storm surge will occur within a particular stretch of coastline cannot be made. This makes option (c) incorrect.
The Charleston coastline is unique and very complicated. Rivers flow into the Charleston Harbor, which then flows into the ocean, and there are barrier islands and many marshy areas. This makes it difficult to describe the type of storm surge that could occur using words alone. The Potential Storm Surge Flooding Map is a powerful tool that aids in evacuation and storm surge preparedness decision-making.
Tropical Cyclone Public Advisory
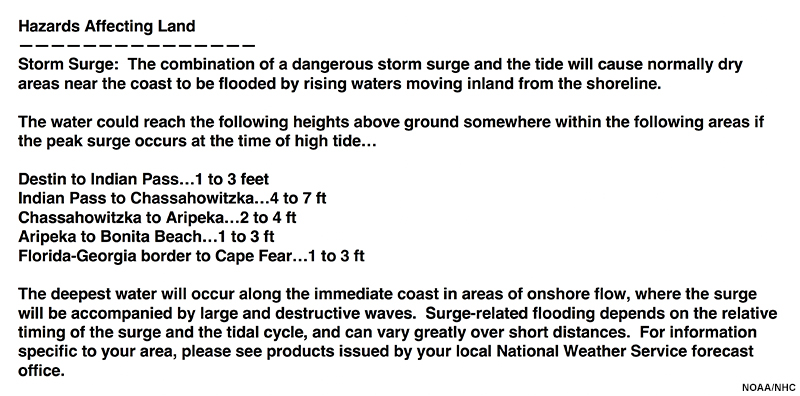
In addition to the Potential Storm Surge Flooding Map, the NHC provides storm surge inundation values in the hazard section of the Tropical Cyclone Public Advisory. These values represent the forecast peak storm surge inundation heights above ground level within broad sections of the coastline and are not location specific. In other words, they are forecast to occur somewhere within the specified coastal area. The NHC Storm Surge Unit uses guidance such as P-Surge, MEOWs, and their forecast expertise to derive the forecast of peak inundation. The forecast peak inundation values, typically introduced within a watch or warning (wind or surge), are generally issued 48 hours before the onset of the conditions. The values in the Tropical Cyclone Public Advisory will likely differ from those in the Potential Storm Surge Flooding Map since that map depicts location-specific reasonable worst-case scenarios.
An example of the hazard section in a Tropical Cyclone Public Advisory is shown below.
The Tropical Cyclone Public Advisory also contains a description of the areas under a Storm Surge Watch or Warning. The approximate lateral extent of the areas within a Storm Surge Watch or Warning are conveyed using "communication points", predetermined point locations along the coastline. The locations of these communications points can be found here.
Storm Surge Watch/Warning
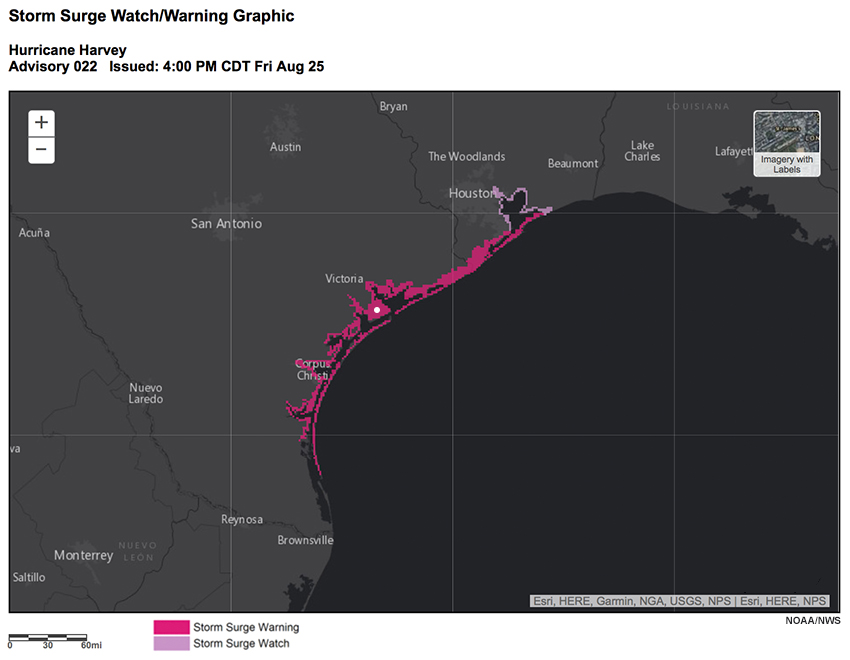
Now we will look at the Storm Surge Watch/Warning. This graphic highlights areas that have a significant risk of life-threatening inundation from storm surge.
Question
What does the graphic indicate for the highlighted location (white dot)? Select the best answer.
The correct answer is b.
A Storm Surge Warning is in effect for the location, indicating the danger of life-threatening flooding from rising water moving inland from the shoreline. The Storm Surge Watch/Warning is intended to help message the storm surge risk to the public. It is media friendly, and less subject to misinterpretation. Much like a Hurricane Watch or Warning, it activates warning systems and functions as a motivator to the public to heed evacuation orders and to listen to local officials. It is a collaborative product produced through the combined contributions of NHC's Storm Surge Unit and local NWS forecast offices along the coast. It provides little quantitative information, and simply identifies locations where storm surge has become a threat to life. Storm Surge Watches and Warnings are currently issued for the Atlantic and Gulf coasts of the contiguous United States.
These are the Storm Surge Watch and Warning definitions:
Watch: The possibility of life-threatening inundation from rising water moving inland from the shoreline somewhere within the specified area, generally within 48 hours, in association with a tropical, subtropical or post-tropical cyclone. The watch may be issued earlier when other conditions, such as the onset of tropical-storm-force winds, are expected to limit the time available to take protective actions for surge (e.g., evacuations). The watch may also be issued for locations not expected to receive life-threatening inundation, but which could potentially be isolated by inundation in adjacent areas.
Warning: The danger of life-threatening inundation from rising water moving inland from the shoreline somewhere within the specified area, generally within 36 hours, in association with a tropical, subtropical or post-tropical cyclone. The warning may be issued earlier when other conditions, such as the onset of tropical-storm-force winds, are expected to limit the time available to take protective actions for surge (e.g., evacuations). The warning may also be issued for locations not expected to receive life-threatening inundation, but which could potentially be isolated by inundation in adjacent areas.
Question
How do the watch and warning definitions differ from each other? Select the two options below that describe how the watch and warning are different.
The correct answers are a, c.
The watch refers to the possibility of life-threatening inundation due to rising water moving inland, and is issued within 48 hours before its occurrence. The warning has a time frame of within 36 hours and indicates that the risk has increased significantly to the point of where there is a danger of life-threatening inundation. Given these details, options (b) and (e) are incorrect.
Option (d) is incorrect since both the watch and warning can be issued for areas that may remain dry but become helplessly cut off. This is an area where local knowledge and expertise would come into play, and a reason for the collaborative process.
NWS Collaborative Process
Although the NHC uses P-Surge to help determine the areas to be placed under a Storm Surge Watch or Warning, collaborations between the NHC and local WFOs determine the final Watch/Warning areas.
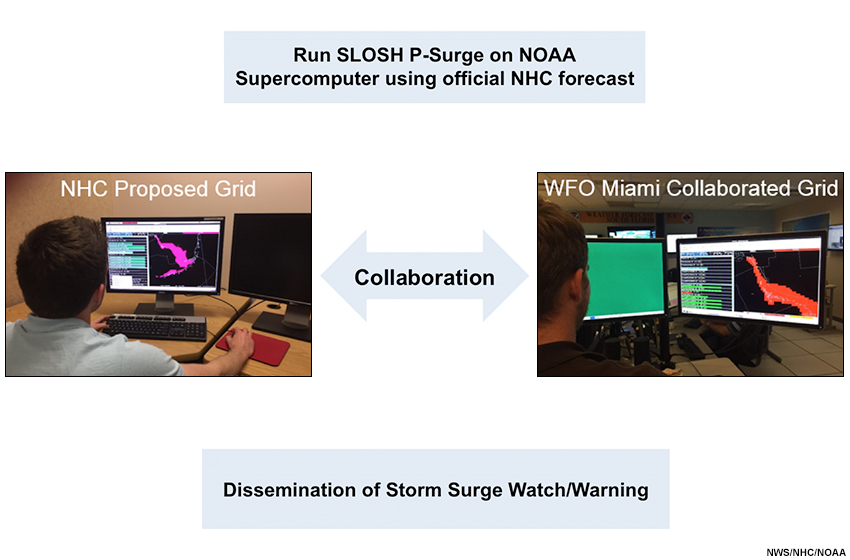
That is, forecaster expertise is added to account for effects unknown to the SLOSH model. Although highlighted areas on the map are driven by objective guidance, the final watch/warning areas account for complexities with rainfall runoff, river discharge, status of flood control barriers, and exposure to breaking waves. Subjective factors such as forecaster confidence, continuity with previous issuances, wind triggering, smoothing, and areas that could be cut-off also play a role. The product is updated collaboratively with each advisory cycle.
A Tale of Two Maps
We have just reviewed two new products in the storm surge suite from the NHC and local WFOs.

Question
Based on the information that you have reviewed so far, select the product that is best described by each statement.
The correct answers are indicated above.
The table below summarizes the products we have discussed so far.
Potential Storm Surge Flooding Map |
Storm Surge Watch and Warning |
|
Purpose |
|
|
Audience |
|
|
Product Type |
|
|
WFO Local Products
In addition to the tropical cyclone products produced by (or collaboratively with) the NHC, coastal forecast offices issue products with local hazards information that includes storm surge flooding. The offices' suite of textual, graphical, and gridded products offer area-specific and/or neighborhood-specific tropical cyclone wind, storm surge, flooding rain, and tornado decision-making information. Each hazard is addressed relative to the local forecast, and is accompanied by an expanded threat assessment to account for uncertainty as well as a description of potential impacts. The main goal is to get the right people to do the right things at the right time in preparing for an approaching tropical cyclone.
Point-and-Click Forecast Interface
Question
Decide whether the following statement is True or False.
Every community in the United States has a local NWS forecast page.
The correct answer is a.
The page can be accessed by clicking on an area in the U.S. map on the NWS home page. Then, the user is transferred to a local NWS WFO page with a map. When users click on a location in the map, they get a page similar to the one below that shows the hazardous weather conditions (if any), current conditions, and the weather forecast for the location.
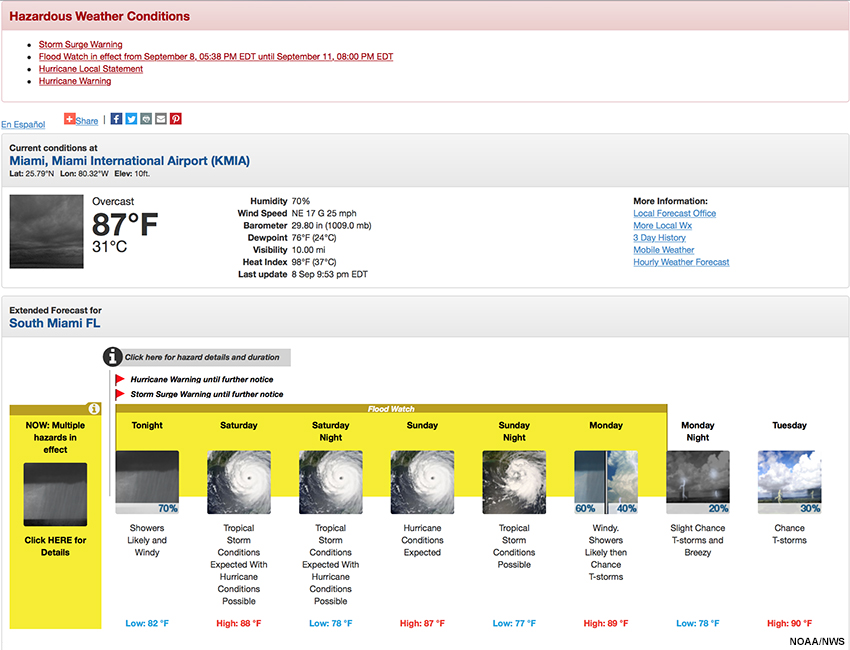
NWS WFOs will issue detailed hazardous weather information products when local areas are threatened by a tropical cyclone. Links to these products will appear in the "Hazardous Weather Conditions" section, and will display information applicable to the county zone selected on the map. In the example above, a Storm Surge Warning, Flood Watch, Hurricane Local Statement, and Hurricane Warning are issued. Additionally, the likelihood of tropical storm and/or hurricane conditions will be mentioned in the 5-day forecast in both text and icon form.
In the next two sections, we will explore two products that pertain to tropical cyclones: the Tropical Cyclone Watch/Warning Statement (TCV) and the Hurricane Local Statement (HLS). When users click on any of the links in the "Hazardous Weather Conditions" section (e.g. Tropical Storm Watch or Warning, Hurricane Watch or Warning, Storm Surge Watch or Warning), the information displayed comes from the TCV product for the area/zone the user clicked on in the map. All of these products contain storm surge forecast information if applicable.
The threat and potential impacts section of the TCV are derived from threat grids WFOs create during tropical cyclone events (once a watch or warning is in effect within their area of responsibility). The grids depict the threat from wind, storm surge, flooding rain, and tornadoes. Also, the grids represent a reasonable worst-case scenario for any location relative to time to impact. A WFO sample grid for the storm surge threat is shown below.
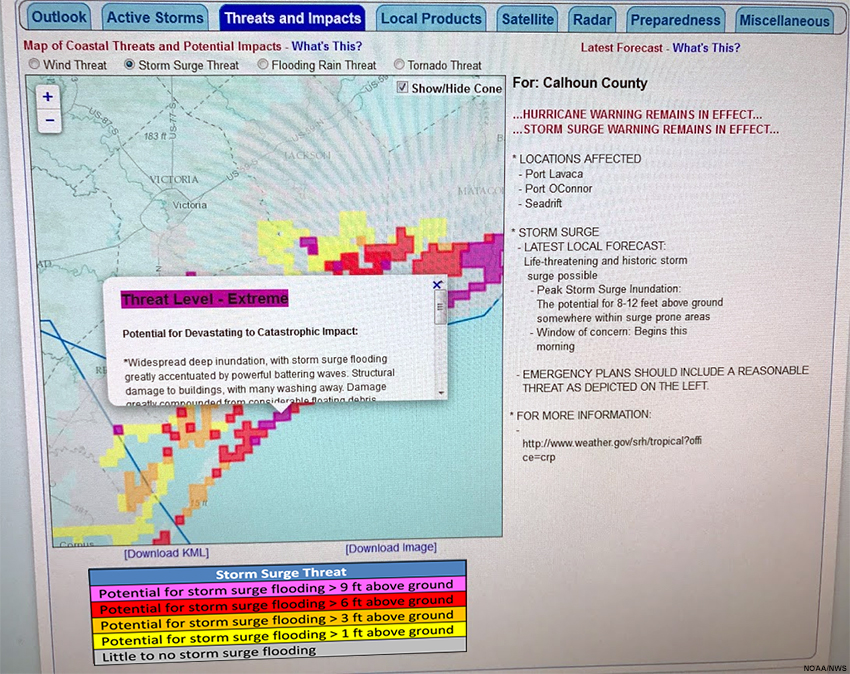
The threat level for some locations in Calhoun County indicates the potential for storm surge flooding greater than 9 ft above ground. This threat statement matches what is described in the storm surge section of the TCV, which we will explore in the next section.
Note: Early on in a tropical cyclone watch period, the storm surge threat grid (and derived TCV surge information) and the Potential Storm Surge Flooding Map are usually based on the 10% exceedance threshold. If forecast confidence increases as the event gets closer, the storm surge threat grid may use a higher exceedance level and/or trend toward values that are more likely to happen or are even expected for a given location. In that case, the values in the TCV for a local area would trend lower than those reflected in the Potential Storm Surge Flooding Map, which is always based on the 10% exceedance. Last but not least, the storm surge threat grid has a resolution of 2.5 km while the Potential Storm Surge Flooding Map has a resolution less than 100 m. For these reasons, the information conveyed by these products may differ.
WFO Local Products » Tropical Cyclone Watch/Warning Statement
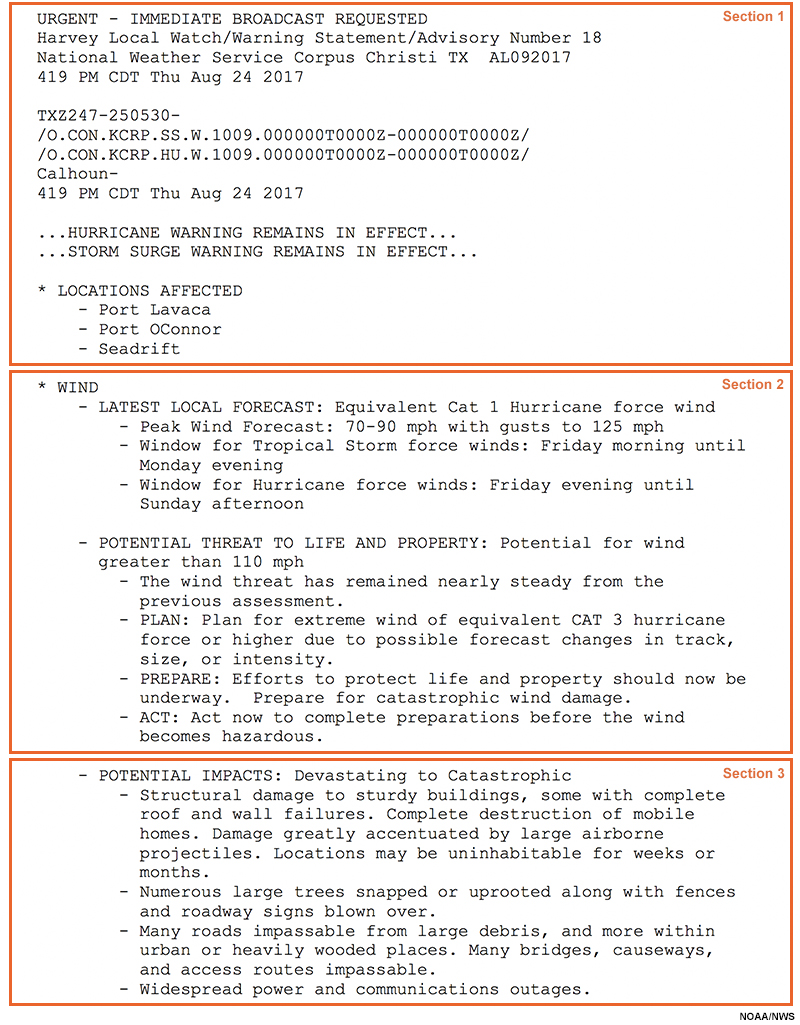
The Tropical Cyclone Watch/Warning Statement is a compilation product comprised of the Tropical Storm and Hurricane Watches and Warnings, and Storm Surge Watches and Warnings for a WFO's area of responsibility and the particular location that you selected on the map. It also provides a detailed overview of the forecast, associated threats, and potential impacts for the location. Triggers for product availability include the issuance of watches/warnings for tropical cyclone wind and/or storm surge.
Hazard information is divided into three sections and its format makes it suitable for subsequent distribution through several media platforms, such as interactive websites, Facebook and Twitter according to user needs. When the product is issued, it activates emergency alerts (NOAA Weather Radio, Emergency Wireless Alerts if applicable, etc.) and hazardous weather scripts for TV crawls.
Question
Review the Tropical Cyclone Watch/Warning Statement and answer the following question.
Match the section of the statement to the information it provides.
The correct answers are indicated above.
The product header includes the storm name and NHC advisory number. In Section 1, the tropical headline indicates the type of watch or warning in effect and the locations that are affected. Section 2 contains forecast and threat assessment information per hazard to help decision-makers. Section 3 has information on potential impacts that makes it useful to visualize what COULD happen if the event were to unfold according to the reasonable worst-case scenario.
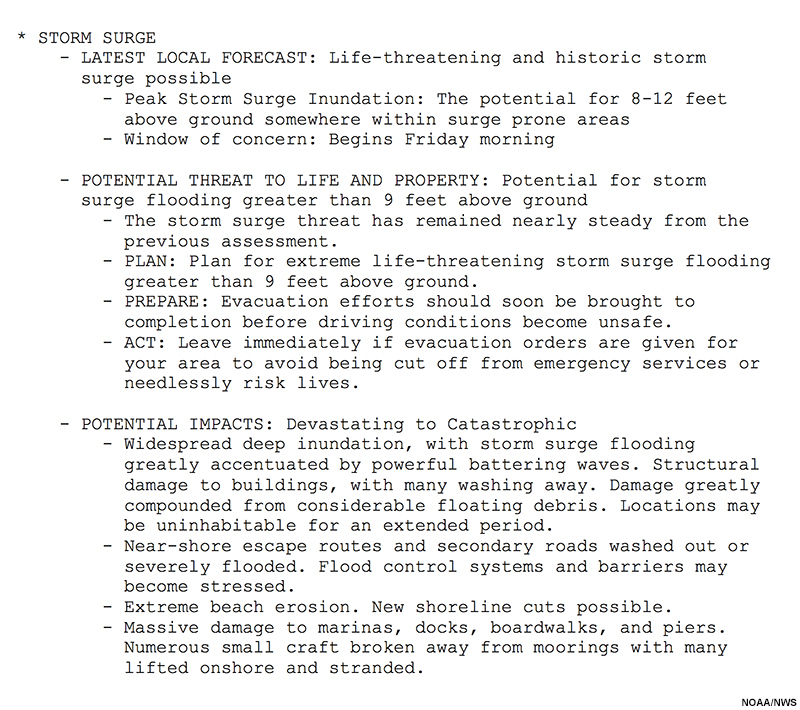
Specifically, the storm surge hazard sub-section includes the potential storm surge values and the window of concern, the threat level for which to plan and prepare, and the potential storm surge impacts to protect against. This information is important because storm surge flooding can be experienced well ahead of a storm and be slow to recede afterward. The greater the threat, the greater the potential impacts. Assessments for each hazard account for the forecast uncertainty.
Note: In addition to high winds and storm surge, tropical cyclones bring the threat of flooding rain and tornadoes. Sub-sections for these hazards are also provided within the Tropical Cyclone Watch/Warning product (not shown). Contrastingly, it is also possible to have a threat of flooding rain and tornadoes from the peripheral effects of a tropical cyclone when the local area is not being subject to a Tropical Cyclone Wind and/or Storm Surge Watch/Warning. In these situations, information is provided through traditional hazard products.
Next, let's explore another product that pertains to tropical cyclones, the Hurricane Local Statement.
WFO Local Products » Hurricane Local Statement
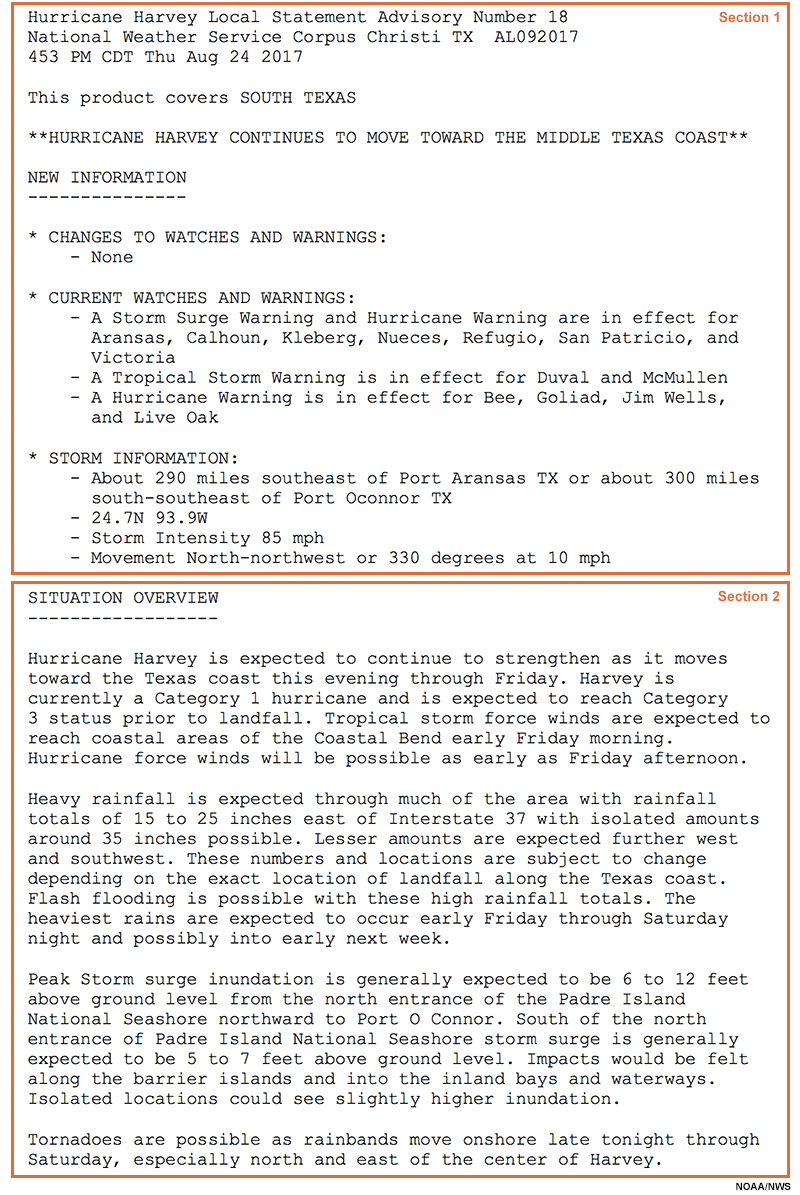
The Hurricane Local Statement provides a regional overview of the situation, focusing on the main hazards of concern and locations most threatened within the domain of interest.
Question
Review the Hurricane Local Statement and answer the following question.
Match the section of the statement to the information it provides.
The correct answers are indicated above.
The product provides the latest storm information, a summary of local watches and warnings (section 1), a situation overview for your region (section 2), potential impacts of primary concern, and preparedness/readiness instructions. When there is a chance of life-threatening storm surge, it is addressed in the situation overview and potential impacts sections.
The Hurricane Local Statement is available whenever Tropical Cyclone Watches and/or Warnings (for wind and/or storm surge) are in effect within a WFO's area of responsibility. The exception is for rumor control, which can arise when evacuation orders are implemented before the watch is issued or when related falsehoods are causing public confusion.
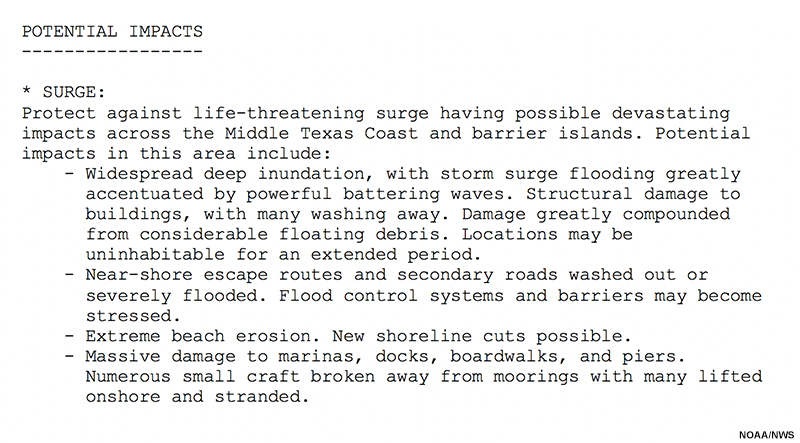
The information contained in the potential impacts section is derived from WFO threat grids (similar to the Tropical Cyclone Watch/Warning Statement). Descriptions of potential impacts puts the local "surge situation" in relatable terms as shown below. It gives the individual a sense of what to protect against if actual conditions tend toward the reasonable worst-case scenario. Potential impacts are more easily messaged to the public, helping to articulate the meaning of a storm surge forecast and its uncertainty. Unique descriptions of potential storm surge impacts can be refined by local field offices in conjunction with input from local emergency management entities.
Summary
This lesson described the real-time storm surge products issued by the National Hurricane Center (NHC) and National Weather Service Weather Forecast Offices (NWS WFOs) during an active tropical cyclone event along the coast of the United States.
When providing decision support within 48 hours of a storm, it is best to use real-time products like the Potential Storm Surge Flooding Map and the Storm Surge Watch/Warning. They are generated for the specific tropical cyclone. Pre-computed storm surge products (e.g., MEOWs, MOMs) are best used beyond 48 hours of the storm surge event or arrival of tropical storm force winds.
The Potential Storm Surge Flooding Map provides a quantitative risk assessment for decision-makers in the emergency management community. Its goal is to depict the type of storm surge risk from a particular storm. It uses the "above ground" datum to make its interpretation easier. The map is derived from probabilistic guidance and does not guarantee continuity regarding the values for a given location from cycle to cycle.
The Storm Surge Watch/Warning highlights areas that have a significant risk of life-threatening inundation from storm surge. The areas depicted within the watches and warnings are produced through a collaboration process between NHC and local WFOs. It is based on both probabilistic guidance and forecaster input, and will have some measure of continuity.
The lesson also introduced the location-specific forecast pages on the NWS website for communicating locally-refined storm surge information. The "Hazardous Weather Conditions" section provides access to current watches and warnings in effect for the location of interest. The Tropical Cyclone Watch/Warning product and the complementary Hurricane Local Statement provide a compilation of tropical cyclone threats and potential impacts across a WFO's area of responsibility for a specific location. They offer a great deal of information that is helpful to community decision-makers and the local public.
You have reached the end of the lesson. Please complete the quiz and share your feedback with us via the user survey.
Contributors
COMET Sponsors
MetEd and the COMET® Program are a part of the University Corporation for Atmospheric Research's (UCAR's) Community Programs (UCP) and are sponsored by NOAA's National Weather Service (NWS), with additional funding by:
- Bureau of Meteorology of Australia (BoM)
- Bureau of Reclamation, United States Department of the Interior
- European Organisation for the Exploitation of Meteorological Satellites (EUMETSAT)
- Meteorological Service of Canada (MSC)
- NOAA's National Environmental Satellite, Data and Information Service (NESDIS)
- NOAA's National Geodetic Survey (NGS)
- Naval Meteorology and Oceanography Command (NMOC)
- U.S. Army Corps of Engineers (USACE)
To learn more about us, please visit the COMET website.
Project Contributors
Program Manager
- Elizabeth Page — UCAR/COMET
Project Lead
- Tsvetomir Ross-Lazarov — UCAR/COMET
Instructional Design
- Tsvetomir Ross-Lazarov — UCAR/COMET
- Vanessa Vincente — UCAR/COMET
Science Advisors
- Robbie Berg, Hurricane Specialist, National Weather Service, National Hurricane Center
- Daniel Brown, Senior Hurricane Specialist/Warning Coordination Meteorologist, National Weather Service, National Hurricane Center
- Dr. Pablo Santos, Meteorologist In Charge, National Weather Service
- David Sharp, Science and Operations Officer, National Weather Service
- Shannon White, AWIPS Instructor with the Forecast Decision Training Branch
- Andy Devanas, Science and Operations Officer, National Weather Service
- John Koch, Deputy Chief, Eastern Region Headquarters, Meteorological Services Division
- Matthew Moreland, Meteorologist in Charge, National Weather Service
- Jennifer McNatt, Emergency Response Specialist, Southern Region Headquarters,
National Weather Service
Graphics/Animations
- Steve Deyo — UCAR/COMET
- Sylvia Quesada — UCAR/COMET
Multimedia Authoring/Interface Design
- Gary Pacheco — UCAR/COMET
Audio/Video Editing/Production
- Steve Deyo — UCAR/COMET
COMET Staff, June 2016
Director's Office
- Dr. Rich Jeffries, Director
- Dr. Greg Byrd, Deputy Director
- Lili Francklyn, Business Development Specialist
Business Administration
- Dr. Elizabeth Mulvihill Page, Group Manager
- Lorrie Alberta, Administrator
- Hildy Kane, Administrative Assistant
IT Services
- Tim Alberta, Group Manager
- Bob Bubon, Systems Administrator
- Dolores Kiessling, Software Engineer
- Joey Rener, Student Assistant
- Malte Winkler, Software Engineer
Instructional and Media Services
- Bruce Muller, Group Manager
- Dr. Alan Bol, Scientist/Instructional Designer
- Steve Deyo, Graphic and 3D Designer
- Lon Goldstein, Instructional Designer
- Bryan Guarente, Instructional Designer
- Lindsay Johnson, Student Assistant
- Dr. Vickie Johnson, Instructional Designer (Casual)
- Gary Pacheco, Web Designer and Developer
- Sylvia Quesada, Production Assistant
- Sarah Ross-Lazarov, Instructional Designer (Casual)
- Tsvetomir Ross-Lazarov, Instructional Designer
- David Russi, Spanish Translations
- Andrea Smith, Meteorologist/Instructional Designer
- Marianne Weingroff, Instructional Designer
Science Group
- Wendy Schreiber-Abshire, Group Manager
- Paula Brown, Visiting Meteorologist, CIRA/Colorado State University
- Dr. William Bua, Meteorologist
- Dr. Frank Bub, Oceanographer (Casual)
- Lis Cohen, Meteorologist (Casual)
- Patrick Dills, Meteorologist
- Matthew Kelsch, Hydrometeorologist
- Dr. Elizabeth Mulvihill Page, Meteorologist
- Amy Stevermer, Meteorologist
- Vanessa Vincente, Visiting Meteorologist, CIRA/Colorado State University