Introduction
A major hurricane made landfall to the east of Mobile Bay, Alabama and grew in size within the 12-hour period before making landfall. The strongest winds extended about 40 miles from the center of the storm. The image below shows the observed flooding that occurred using the Sea, Lakes, and Overland Surges from Hurricanes (SLOSH) model to display the data. The thin black line represents the observed storm track and the solid black circle denotes the radius of maximum winds.
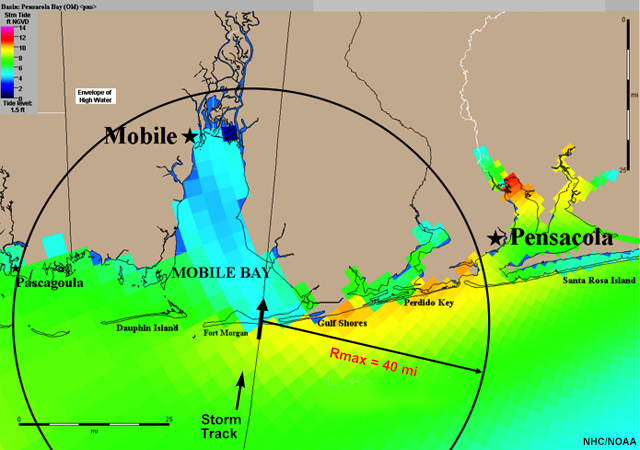
Notice that Mobile Bay had between 2 to 4 feet of storm surge above NGVD 29, and the Pensacola, Florida area experienced nearly 8 to 12 feet of storm surge.
The tabs below show the deterministic and probabilistic storm surge forecasts issued 12 hours prior to landfall. Review the data in each tab and answer the question below.
Observations
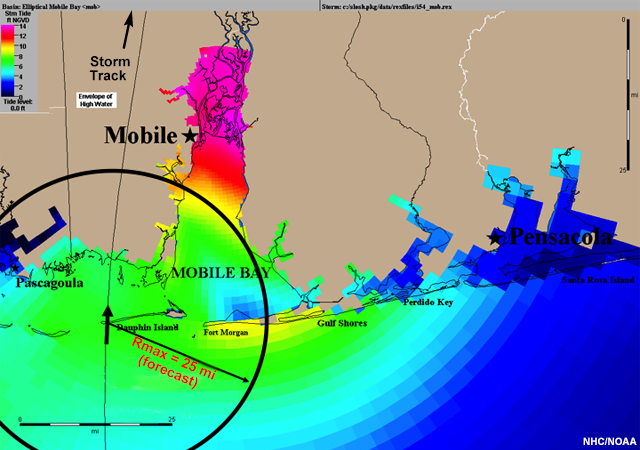
Deterministic Forecast
The thin black line represents the deterministic forecast track and the solid black circle denotes the radius of maximum winds. For this hurricane, the strongest winds extend about 25 miles from the center of the storm.
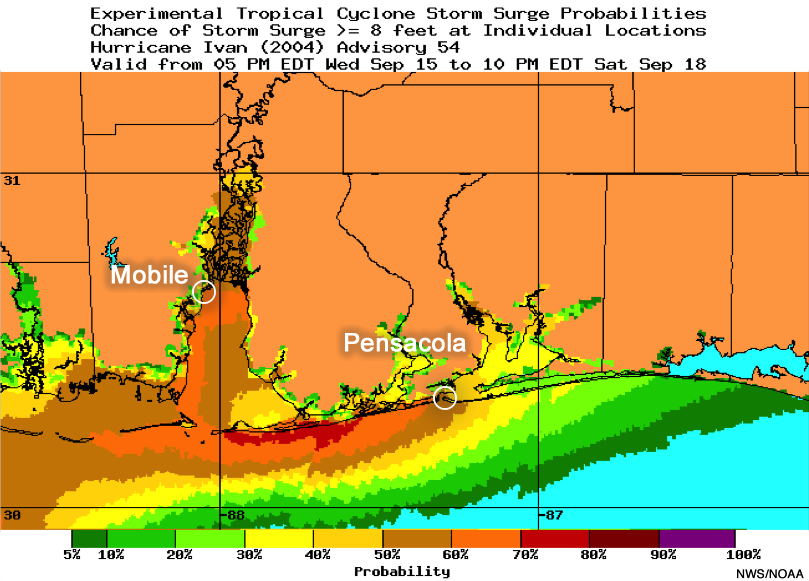
Probabilistic Forecast
The Probabilistic Storm Surge (P-Surge) product shows the probability of storm surge exceeding 8 feet at individual locations. The probabilities are indicated by the colors, which are defined in the legend at the bottom.
Question
Which forecast best represented the overall storm surge risk from the hurricane? Select the best answer.
The correct answer is b.
The deterministic forecast shows the highest storm surge around Mobile in the northern part of the bay. The orientation of the forecast track would allow the storm to push a lot of water into Mobile Bay, where storm surge could reach 14 feet above NGVD 29 in the upper reaches of the bay. However, the deterministic forecast shows 2 to 3 feet of storm surge east of the bay in Pensacola, which would only cause minor flooding for this area. The threat to Pensacola is much greater than this.
The probabilistic forecast shows that both areas have similar chances of experiencing life-threatening storm surge of at least 8 feet: 60% to 70% for locations in the the Mobile Bay area, and 50% to 60% for locations in the Pensacola area. For decision support, there are no significant differences in storm surge probabilities between Mobile Bay and Pensacola. The higher observed storm surge occurred near Pensacola (not Mobile Bay), due to the slight eastward shift in storm track and increase in storm size within the 12-hour period prior to landfall.
This forecast comparison emphasizes how forecast uncertainties in tropical cyclone characteristics (track, forward speed, winds, etc.) can play a major role in the magnitude and location of the storm surge forecast by the SLOSH model. The probabilistic forecast (P-Surge) accounts for multiple forecast outcomes by considering uncertainties in storm track, size, and intensity. This makes it possible for P-Surge to provide a better representation of the storm surge risk in this case.
This lesson will describe the real-time storm surge products that are issued by the National Hurricane Center (NHC) and National Weather Service Weather Forecast Offices (NWS WFOs) during a significant tropical cyclone event along the Atlantic and Gulf coasts of the United States: the Probabilistic Storm Surge (P-Surge) product, the Potential Storm Surge Flooding Map, the Tropical Cyclone Public Advisory, and the Storm Surge Watch and Warning.