The Challenges of Tropical Cyclone QPF
Excessive rainfall from tropical cyclones (TCs) can cause extensive flooding and threaten the lives of people living in the affected area. Correct interpretation of the Weather Prediction Center’s (WPC) TC rainfall products is crucial for the accurate and timely issuance of WFO precipitation forecasts.
Quantitative precipitation forecasting, in general, is characterized by major successes and major failures. TC precipitation forecasting is similarly challenging.
Question
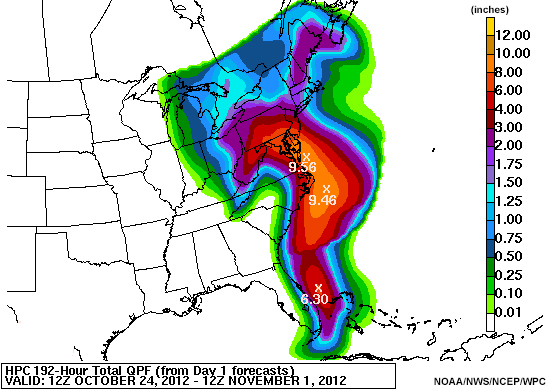
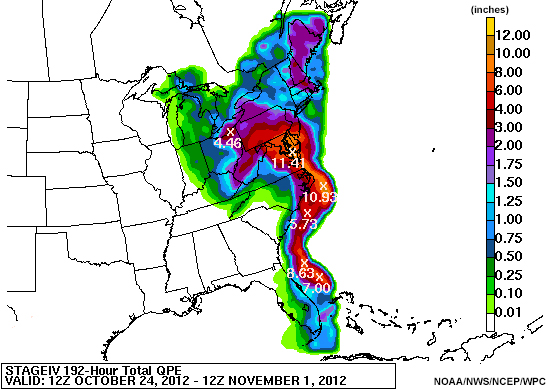
Compare the 192-hour quantitative precipitation forecast (QPF) for Hurricane Sandy (2012) from 12 UTC October 24 - 12 UTC November 1 with the observed amounts for the same time period. Drag the circle left or right to compare the two images below.
How well did the WPC’s forecast predict the distribution and amount of precipitation across the eastern U.S.? Choose the best answer.
The correct answer is a.
The forecast predicted precipitation over the northeast U.S. and along the U.S. east coast, with higher amounts across the mid-Atlantic. These projections are reflected well in the precipitation analysis, suggesting that WPC produced a very reliable forecast at long lead times. However, depending on the size, track, forward speed, and behavior of the storm, the outcome may have been significantly different. Hurricane Sandy was a large and well-formed TC, and was well forecast with excellent lead time.
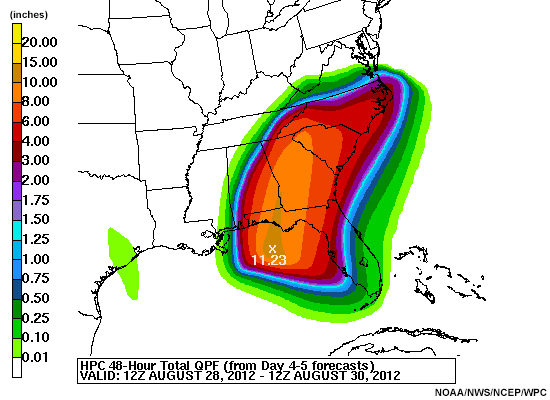
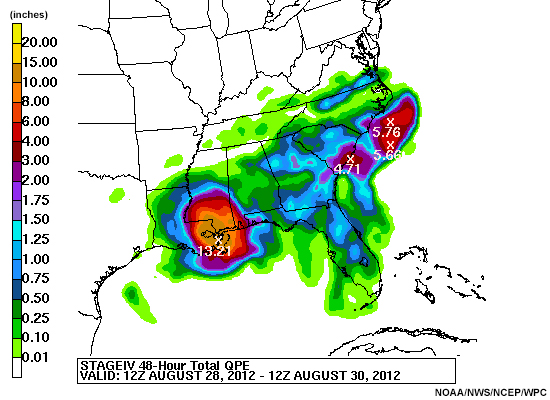
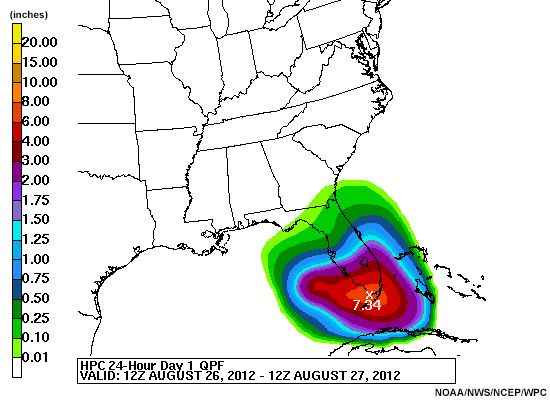
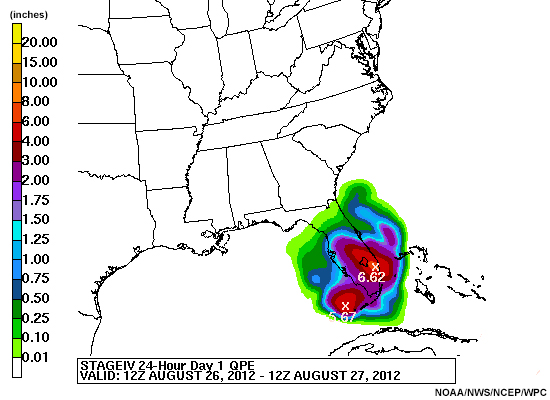
In other cases, sudden changes to TC track, timing, or intensity may dramatically increase or decrease the forecast precipitation over a given area. Compare the 48-hour QPF for Hurricane Isaac (2012) from 12 UTC August 28 - 12 UTC August 30 with the observed amounts for the same time period. Drag the circle left or right to compare the two images below.
Question
How well did the WPC’s forecast predict the distribution and amount of precipitation across the southeast U.S.? Choose the best answer.
The correct answer is c.
The track forecast kept shifting westward, so some of the Day 4-5 QPFs from WPC had particularly large errors (showing heavy amounts over Georgia). Those forecasts also did a poor job of accounting for uncertainty and the potential for dry air entrainment after landfall. WPC has since made strides in this area with the Day 1 forecast performing much better. This is shown in the example below of a Day 1 QPF and observations. Drag the circle left or right to compare the two images.
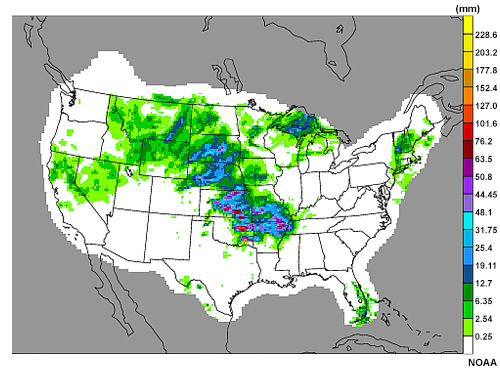
Even when the TC track is well forecast, small-scale banded structures can lead to extreme variability in locally observed rain amounts, as seen in the image below. Tropical Storm Allison (2001) produced significant gradients in precipitation across southeast Texas. The precipitation ranged from ~10-20 inches over the southwest side of Houston to >40 inches in a few local spots.
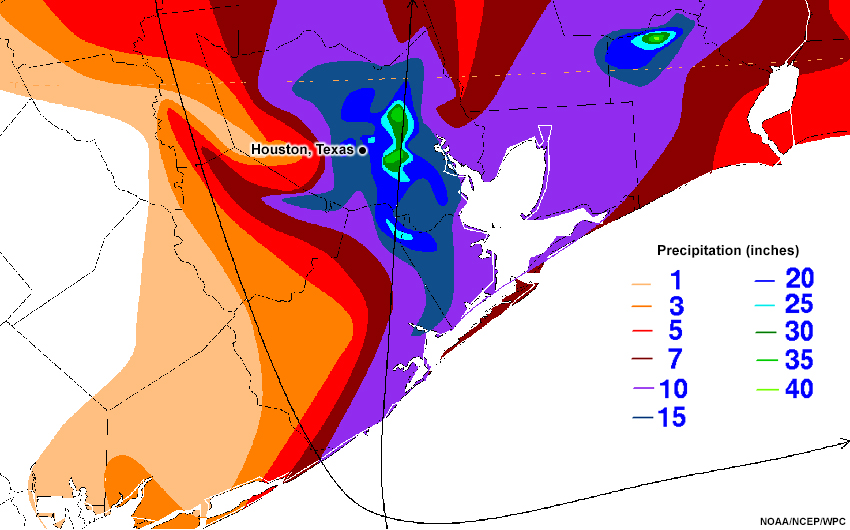
Tropical cyclone rainfall data across Houston, TX during Tropical Storm Allison from June 4-18, 2001.
WPC Rainfall Guidance Products
A primary role of quantitative precipitation forecasting is to help National Weather Service (NWS), Weather Forecast Offices (WFOs), and River Forecast Centers (RFCs) increase lead times of watches and warnings for flood- and snow-related events.
TC precipitation products are complemented by the event-driven rainfall hazard statement within the National Hurricane Center’s (NHC) public advisories and related TC quantitative precipitation forecast (QPF) graphics. The TC QPF graphic is a sector view of WPC’s deterministic QPF.
This lesson will focus on the correct interpretation of the deterministic QPF graphic and associated discussion, the probabilistic QPF (PQPF), and the Excessive Rainfall Outlook (ERO) in the context of TCs. Correct interpretation will help in identifying areas potentially affected by TC-related heavy precipitation.
WPC Rainfall Guidance Products » Deterministic QPF
One of WPC’s primary interests is expressing precipitation variability in a way that is useful for hydrologic modeling efforts. To help address forecast uncertainties, WPC takes an areal average approach to quantitative precipitation forecasting because confidence in small-scale precipitation details is often low, particularly during the convective warm season.
Question
Which of the following actions do you think are taken to produce the deterministic QPF graphic? Select True or False for each action.
The answers are displayed above.
The WPC deterministic QPF graphic shows the expected “areal average” (on a 20 x 20 km grid) rainfall (inches) because precipitation amounts can vary over short distances. WPC forecasters create a QPF at roughly 20 km resolution, and subsequent downscaling techniques increase the resolution to 5 km for web graphics (2.5 km in Graphical Forecast Editor if a WFO can display it).
The QPF contours (isohyets) are drawn to encompass areal average amounts of 0.01 inch, 0.25 inch, 0.50 inch, 1 inch, 1.50 inches, and 2.00 inches. Any values greater than 2.00 inches are drawn in one-inch increments. In this lesson, the location of precipitation maxima are indicated on the chart by an "X", with the associated value printed underneath. The maxima indicated by the “X” are interpolated and not chosen by the forecaster - forecasters do not think deterministically down to hundredths of an inch! See WPC Technical Descriptions of QPF. As of 2017, WPC has discontinued showing the QPF maxima on web images.
Question
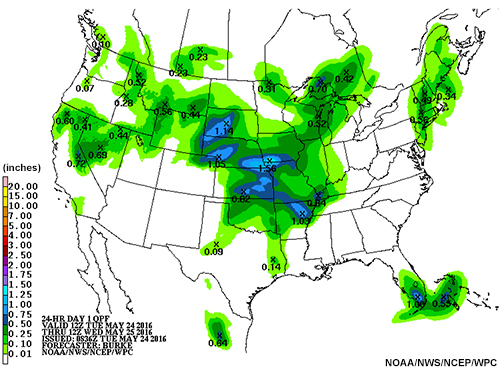
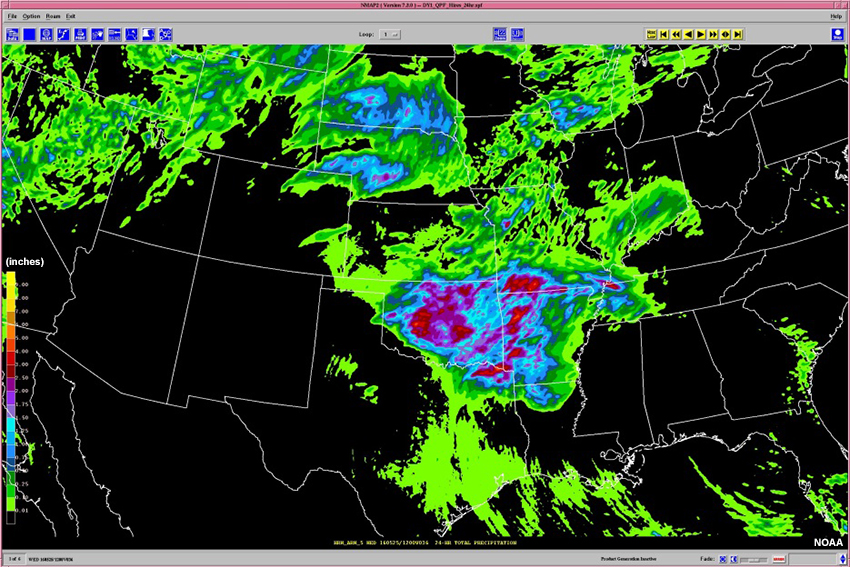
In the tabs below are convective precipitation forecasts across the Southern Plains from three different models (ECMWF, WRF-ARW, and GFS) and WPC. The GFS precipitation forecast across Oklahoma and Arkansas ranges from 0.1 to 0.75 inches in a 24-hour period. The ECMWF and WRF-ARW precipitation forecasts during the same period show localized 3.5 inch amounts. Although these forecast models are among the better trusted guidance in WPC, they show great precipitation variability in both magnitude and placement.
ECMWF
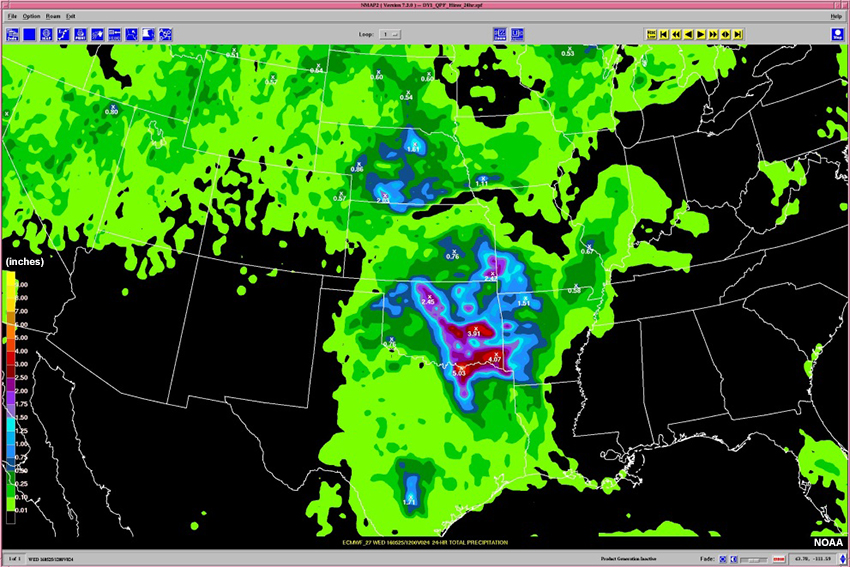
ECMWF precipitation forecast for the 24h period from 12 Z May 24 through 12 Z May 25, 2016.
WRF
WRF precipitation forecast for the 24h period from 12 Z May 24 through 12 Z May 25, 2016.
GFS
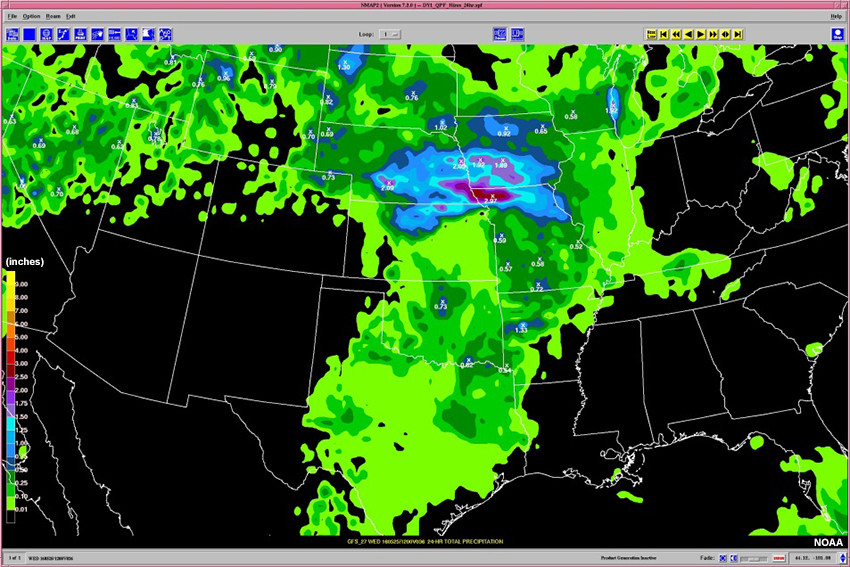
GFS precipitation forecast for the 24h period from 12 Z May 24 through 12 Z May 25, 2016.
WPC
Day 1 quantitative precipitation forecast, valid from 12 Z May 24 through 12 Z May 25, 2016.
Observed precipitation for the 24h period from 12 Z May 24 through 12 Z May 25, 2016.
Compare the WPC QPF and other model forecasts to the precipitation analysis.
How would you describe the performance of WPC’s forecast compared to the other model forecasts and the observed precipitation? Choose the best answer.
The correct answer is a.
The WPC forecast reduced some small-scale details, but captured the main impacted areas as shown in the observed totals. In this case, the areal average QPF was better than any of the individual model forecasts.
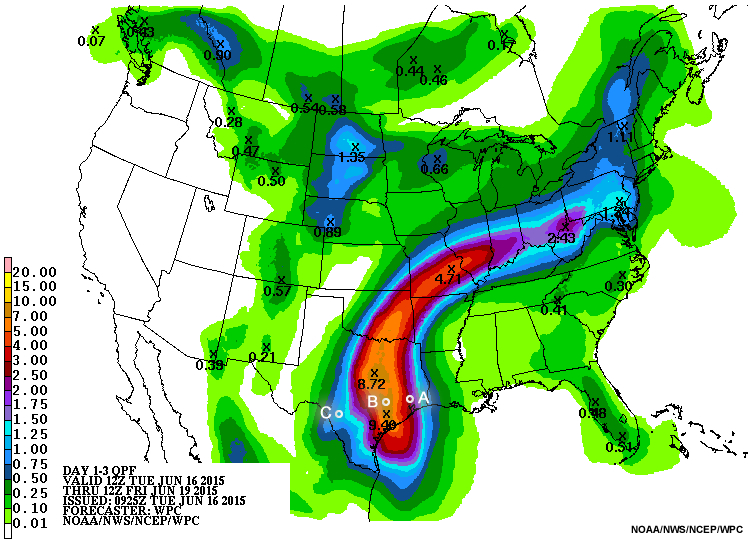
Question
Based on the QPF graphic above, which location could experience the highest areal average precipitation from Tropical Storm Bill? Choose the best answer.
The correct answer is b.
All areas from the Texas coast to the mid-Mississippi Valley are at risk of precipitation from the tropical storm. Areas around location B might experience the greatest amounts on average, while small-scale effects could lead to more intense rain gauge totals in other locations. Note that an areal average of 3-5 inches of precipitation could be experienced at locations from the Texas coast to Illinois.
WPC will boost rainfall coverage and magnitude for TC events, particularly when confidence in the storm track and structure is high.
WPC Rainfall Guidance Products » Mesoscale Precipitation Discussion
Since forecasting TC precipitation is fraught with uncertainties, it is a good idea to review the Mesoscale Precipitation Discussion (MPD) together with other guidance. MPDs for TCs span a 6-hour period, and are issued frequently. These discussions can express increased confidence at small scales, and may include expectations of more precipitation than what is seen in the deterministic QPF.
Question 1 of 2
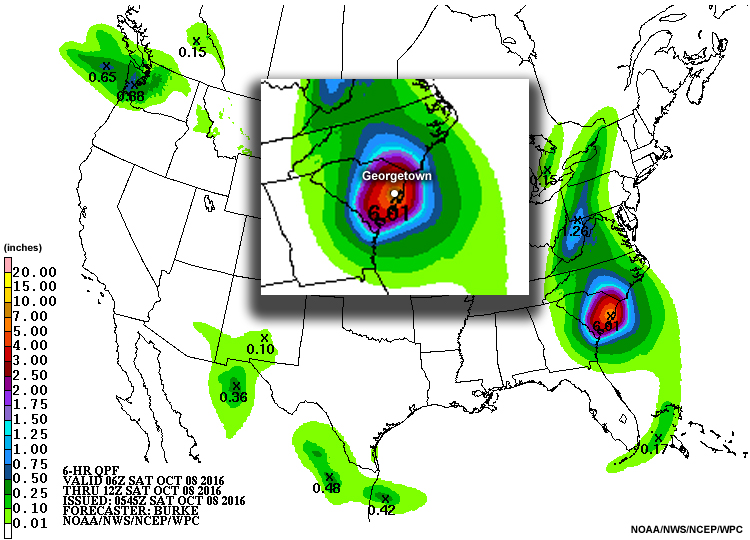
Based on the deterministic QPF graphic, how much rain could fall over Georgetown, SC? Choose the best answer.
The correct answer is d.
Question 2 of 2
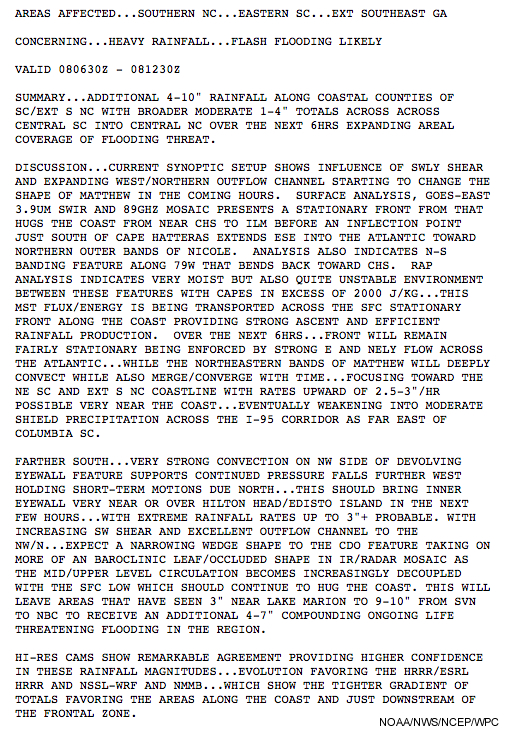
Mesoscale Precipitation Discussion (text)
Mesoscale Precipitation Discussion (graphic)
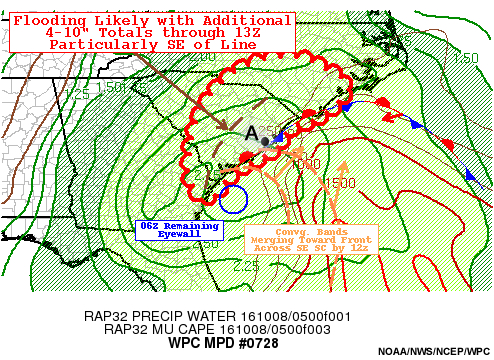
Based on the MPD, how would you change your forecast for Georgetown, SC? Choose the best answer.
The correct answer is b.
The MPD highlights an area likely to get 4-10 inches of rainfall and flooding, including Georgetown. This information is not captured in the QPF.
WPC discussion products complement the gridded forecasts by detailing the models that were used in QPF production, conveying important trends and the degree to which they influenced the forecast, and summarizing any plausible extremes that are not reflected in the areal average forecast. Much like at the local offices, WPC forecasters may use a discussion headline to draw attention to an exceptional event.
While deterministic QPF represents an areal average, it is the role of other forecast products to describe the range of possibilities, forecaster confidence, and important messages worth highlighting. Next, let’s highlight two products that help draw the precipitation forecast down to the potential impacts at the local level.
WPC Rainfall Guidance Products » PQPF
The deterministic QPF product shows only one possible outcome for precipitation at a given location. To address more possibilities, WPC uses the deterministic QPF to drive the creation of a probabilistic QPF distribution (PQPF). Heavier weight is given to the human forecast (QPF) when PQPF is created.
Question
Which of the following elements are used to produce the PQPF? Select True or False for each element.
The WPC produces 6-hour and 24-hour QPFs for days 1 through 3 (72-hour duration). PQPFs are computed based on a combination of WPC QPFs and an ensemble of model forecasts. The ensemble forecasts provide uncertainty information about the QPF, which is used to construct a probability distribution at each grid point. PQPF has been designed to give weight to the manual forecast. The deterministic QPF becomes the mode, or most likely value, of the distribution at each grid point. The rest of the distribution is filled in by the operational NAM, GFS, ECMWF Deterministic, HRR, Canadian Regional model, 12 SREF members, and 10 ECMWF ensemble members and 10 GEFS ensemble members, and the GEFS ensemble mean. Skewness in the PQPF is allowed, and is based on the placement of the WPC forecast within the distribution at a given point. Once the point distributions have been formed, they can then be mapped to the CONUS.
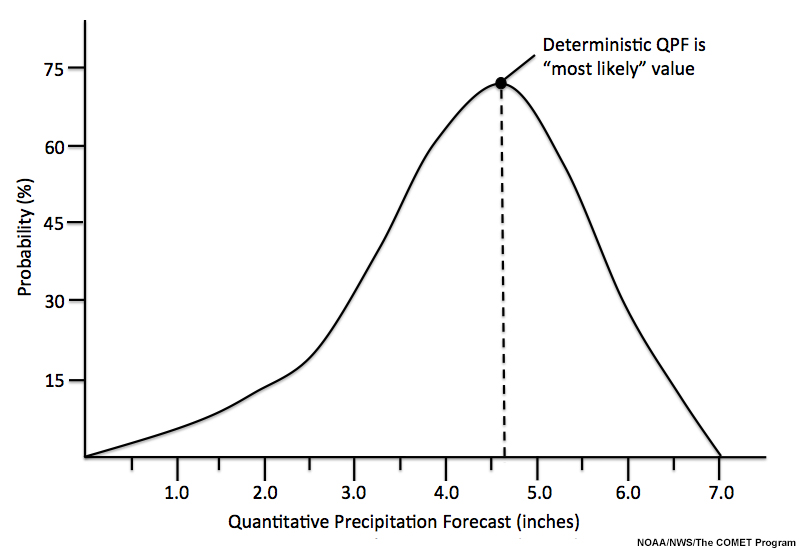
A probability distribution of forecast precipitation values, where the deterministic QPF is the most likely value.
The PQPF guidance is used by forecasters and hydrologists to determine the probability of any rainfall amount at a given location. The PQPF can be used to assist NWS or RFC forecasters in the issuance of flash flood and flood watches. It can also be used at the RFC as input into probabilistic river forecasts.
PQPF output appears in two forms, by percentile and threshold exceedance probabilities.
When viewing the percentile maps, it is important to remember that each grid point has its own probability distribution. It is extremely unlikely that a storm will verify at the same percentile for a given point and all of its neighbors. Thus, it is better to think of these maps as the range of possibilities at a given point. The 10th percentile represents the “expect at least this much” scenario; the 50th percentile is the “most likely” scenario; and the 90th percentile is the “reasonable worst-case” scenario.
Question 1 of 2
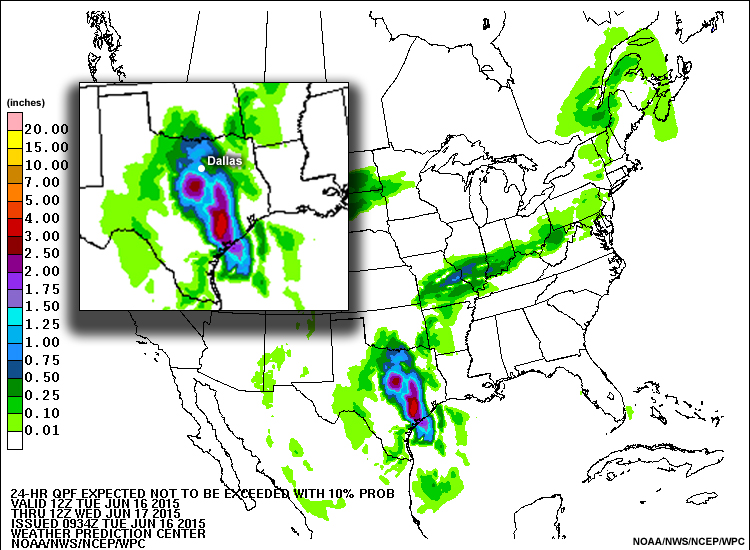
The graphics below show the 24-hour QPF exceedance probabilities at the 10th, 50th and 90th percentile during Tropical Storm Bill (2015). Review the PQPFs and answer the following question.
PQPF 10th Percentile
PQPF 50th Percentile
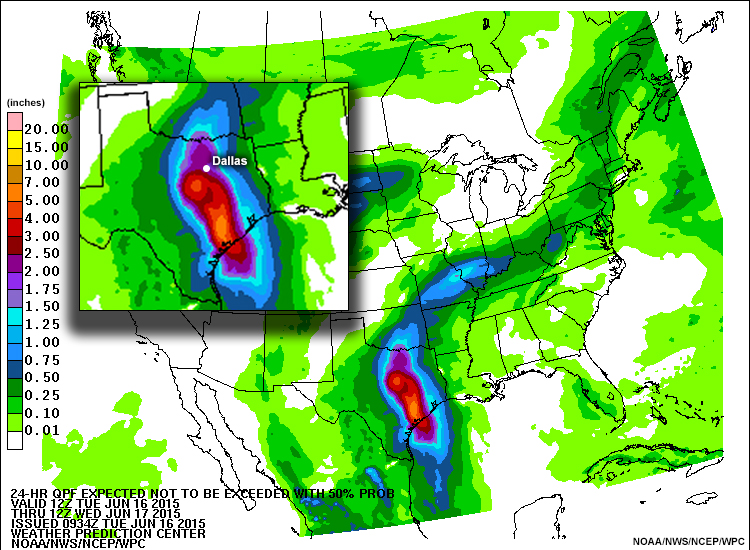
PQPF 90th Percentile
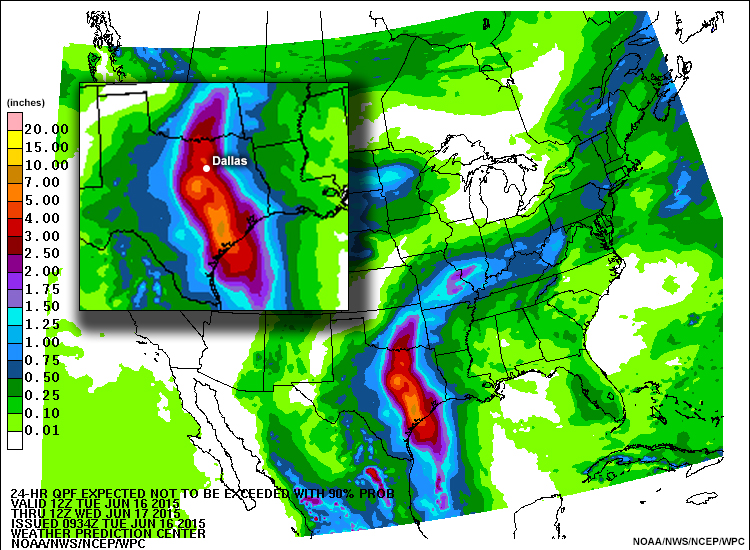
What is the potential precipitation amount and its chance of not being exceeded for Dallas, Texas in each PQPF? Use the pull-down menu to select the best answer.
PQPF 10th Percentile
The correct answers are highlighted above.
Question 2 of 2
How would you describe the potential precipitation for points in and near Dallas, Texas and its probability of occurrence ? Choose the best answer.
The correct answer is a.
There is a 10% chance of not exceeding 1 inch of rain, equaling a 90% chance of exceeding 1 inch at any given point. Also, there is a 90% chance of not exceeding 4 inches, equaling a 10% chance of exceeding 4 inches at any given point.
The best ways to summarize the situation in plain language to users are:
- There is a 90% chance that precipitation at any given point in and near Dallas will exceed 1 inch.
- There is a 10% chance of rainfall exceeding 4 inches at any given point in and near Dallas.
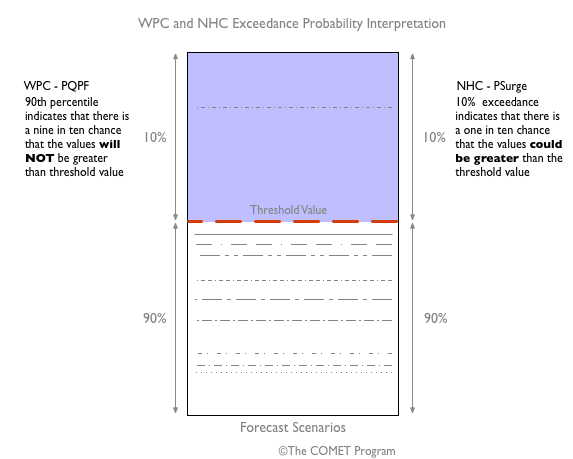
WPC Rainfall Guidance Products » Probabilities Used by WPC and NHC
In the WPC probabilistic QPF, percentiles are interpreted in the sense of a mathematical distribution. For example, the 90th percentile describes the top 10% of a distribution. The 90th percentile suggests that 90% of the distribution lies beneath the selected value, and that there is a 90% chance that the selected value WILL NOT be exceeded.
The way WPC displays probabilistic QPF contrasts with the NHC’s P-Surge 10% exceedance product, which suggests that there is a 10% chance that the forecast value WILL be met or exceeded for any given location (90% of the time values are below it). It is important for users to be aware of the difference in focus by each organization when they interpret probabilistic products. To illustrate this difference, the graphic below shows ten forecast scenarios (indicated by different lines) for a single location. Nine scenarios are below the threshold (red line) and one scenario is above it. WPC communicates the fact that 9 of the 10 scenarios are below the threshold. NHC communicates that only one scenario is above the threshold.
Question
Let’s say you are reviewing NHC’s P-Surge and WPC’s PQPF exceedance products. The 10% exceedance product shows 9-11 ft of surge above ground level for the location. The PQPF 90th percentile product shows 2-3 inches of rainfall for the same location. How will you summarize the guidance in these products? Select all that apply.
The correct answers are a and d.
The NHC product suggests that 10% of the time forecast values are above the one indicated. NHC displays the 10% exceedance to capture a larger range of plausible forecast outcomes to ensure appropriate planning for high-impact events.
The WPC product indicates that there is a 90% chance that the forecast value will NOT be exceeded or a 10% chance that it will be. WPC displays the high percentages to represent the more extreme events (90th percentile - the high end of what is possible).
WPC Rainfall Guidance Products » Excessive Rainfall Outlook
WPC issues Excessive Rainfall Outlooks (ERO) for Days 1, 2, and 3. This is a categorical and probabilistic risk product similar to the Storm Prediction Center (SPC) convective outlooks, but there are some important differences. The WPC ERO represents the probability of rainfall exceeding flash flood guidance (FFG) at a point. These point-based probabilities are on the low side (2-5% - Marginal, 5-10% - Slight, 10-15% - Moderate, >15% - High). The SPC convective outlook probabilities are neighborhood-based, casting a wider net for events around a point which boosts the probabilities. Plans are to convert the WPC ERO to a neighborhood-based approach in the near future.
While WPC QPF should be non-zero where a risk of excessive rainfall is indicated, the ERO goes well beyond consideration of the deterministic QPF. Inputs include the full suite of high-resolution models, including hurricane WRF, probabilities of FFG exceedance derived from the Storm-Scale Ensemble of Opportunity, the Extreme Precipitation Forecast Tool in AWIPS, the National Water Model, and anomaly fields for total precipitable water and moisture transport. Finally, WPC looks to local office expertise for ground observations, and will work to ensure risk coverage is included where Flood and Flash Flood Watches are issued. Local offices should not hesitate to reach out to WPC with pertinent information that may influence the ERO. For more information about EROs, see the WPC’s Product Information webpage.
Question
Decide whether the following statement is True or False.
The probabilities in the ERO are low because they represent rare, high-impact rainfall events relative to a point. This is a factor that decision-makers and the public need to consider seriously.
The correct answer is a.
The probabilities in the ERO are small because relative to a point, they represent rare precipitation events. However, the magnitude of the impacts these events may bring can be very high. This results in a higher risk from rainfall exceeding flash flood guidance than the probability alone would imply. Risk is a combination of “Probability x Consequence = Impact x Vulnerability”.
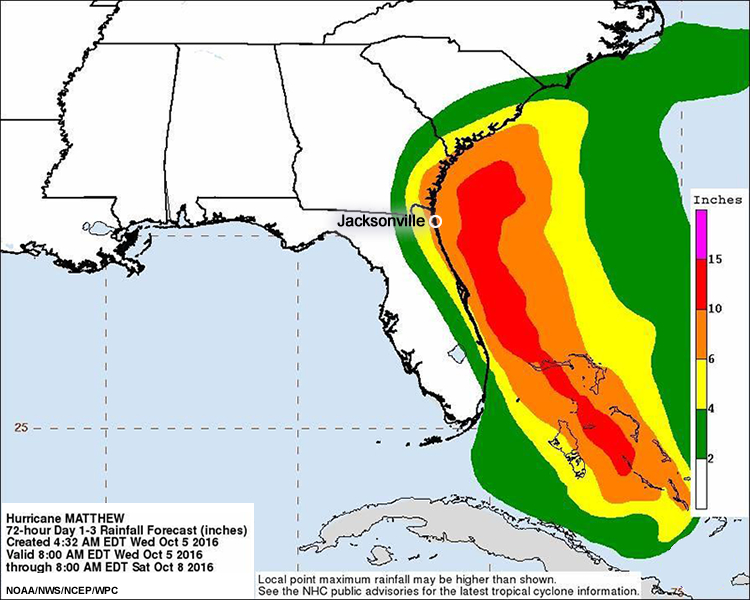
A TC QPF graphic is generated when tropical systems approach the CONUS, and when WPC is including deterministic QPF from the system in its CONUS graphics. The TC QPF graphic draws directly upon the deterministic QPF, but with a zoomed sector view and larger bins in the precipitation scale. The WPC and NHC make every effort to keep the TC QPF graphic consistent with the range of average rainfall communicated in the public advisories. As of 2016, the possible maximum amount of rainfall was not included on the graphic except via a disclaimer.
Question
Based on the TC QPF above, how much precipitation from Hurricane Matthew could fall over Jacksonville, FL? Choose the best answer.
The correct answer is b.
The TC QPF indicates the possibility of 6-10 inches of rain over Jacksonville.
It is challenging to describe the expected rainfall from tropical systems due to their variable storm characteristics (intensity, size, and forward speed). High-resolution models have improved in producing realistic depictions of extreme rainfall events. These detailed, realistic-looking forecasts, however, are sometimes made for a storm that subsequently fails to organize or reach the intensity predicted. As a result, the high-resolution models tend to err toward higher precipitation amounts. Yet, in other cases, the high-resolution models are still incapable of forecasting local extreme maxima on a well-developed TC.
To capture the high-end precipitation amounts of TCs with greater consistency, an analog tool is used to find historic storms that had similar track, forward speed, and size. The analog tool provides a ballpark perspective of reasonable precipitation amounts for a given system as well as the point maximum that was observed with the analog TC. If terrain is a factor in the current event, this will augment local precipitation totals, as this effect is reflected in the analog cases.
Using WPC’s Rainfall Guidance Products
Using WPC’s Rainfall Guidance Products » Hurricane Matthew
In the following pages, you will assume the role of a forecaster supporting emergency management facilities in North and South Carolina with enacting their emergency plan. Hurricane Matthew is approaching the eastern coast of Florida and is bringing an increasing threat for high winds, significant storm surge, and heavy rainfall. A Hurricane Warning is in effect from north of Golden Beach, Florida to Altamaha Sound, Georgia.
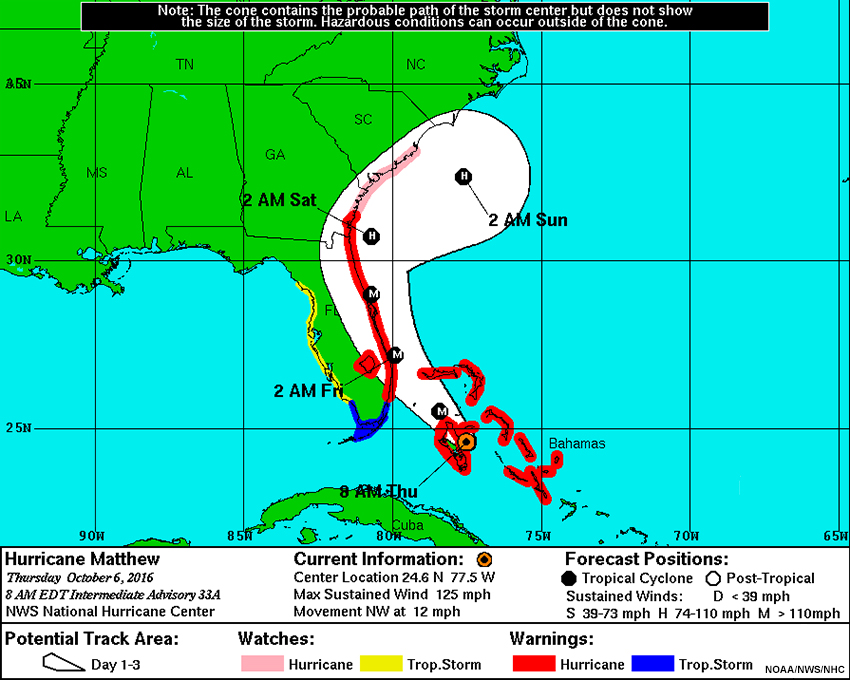
Based on the 8 am EDT advisory (#33a) on Thursday October 6, 2016:
The center of Hurricane Matthew is located about 215 miles (346 km) southeast of West Palm Beach in Florida. It is moving toward the northwest at about 12 mph (19 km/hr), and is expected to continue moving in this general direction. The center of Hurricane Matthew should move very close to the east coast of the Florida peninsula tonight through Friday night.
Hurricane Matthew is a category 3 storm with maximum sustained winds near 125 mph (201 km/h) with higher gusts. With additional strengthening expected today, the storm is forecast to be a category 4 hurricane as it approaches the east coast of Florida.
In addition to wind and storm surge impacts, the emergency managers in the Carolinas need to account for potentially significant flooding impacts in their action plans. They would like to know the potential precipitation totals from the hurricane.
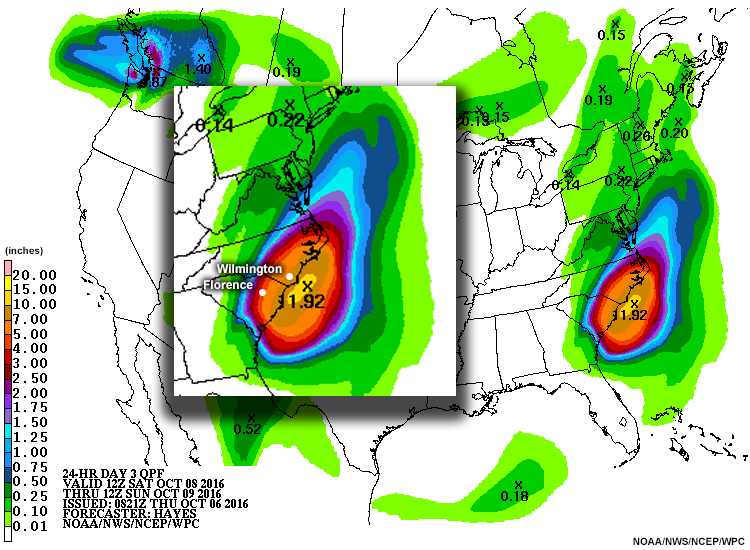
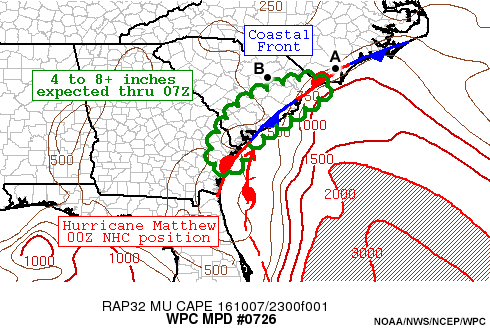
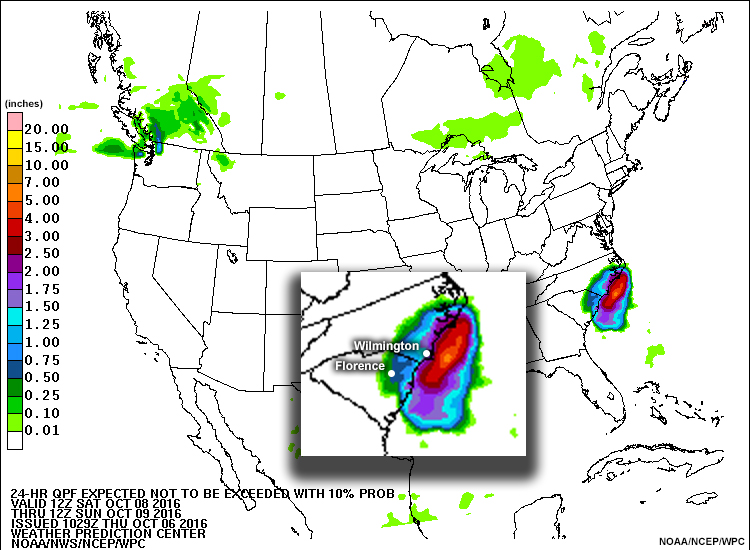
Using WPC’s Rainfall Guidance Products » Hurricane Matthew » Potential Precipitation Amount
Review the WPC products below.
Deterministic QPF
MPD Graphic
PQPF 10th Percentile
PQPF 50th Percentile
PQPF 90th Percentile
ERO
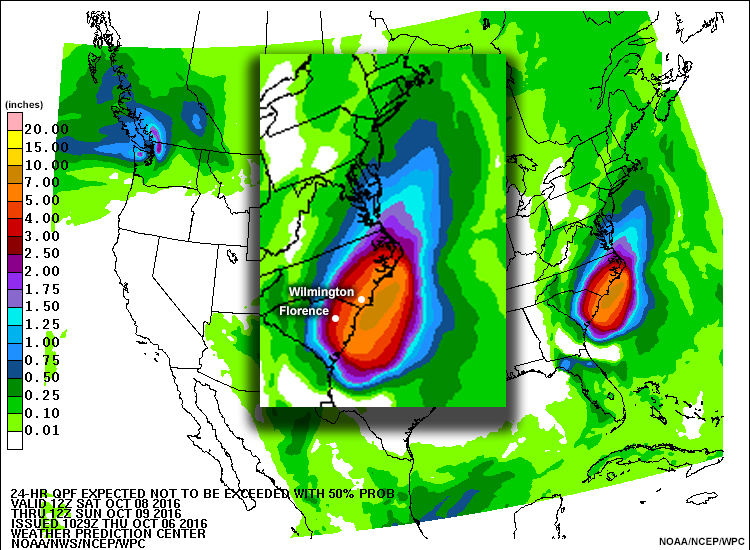
Question
Based on the deterministic QPF, what is the potential precipitation amount for Wilmington, NC and Florence, SC? Use the pull-down menu to choose the best answer.
The correct answers are highlighted above.
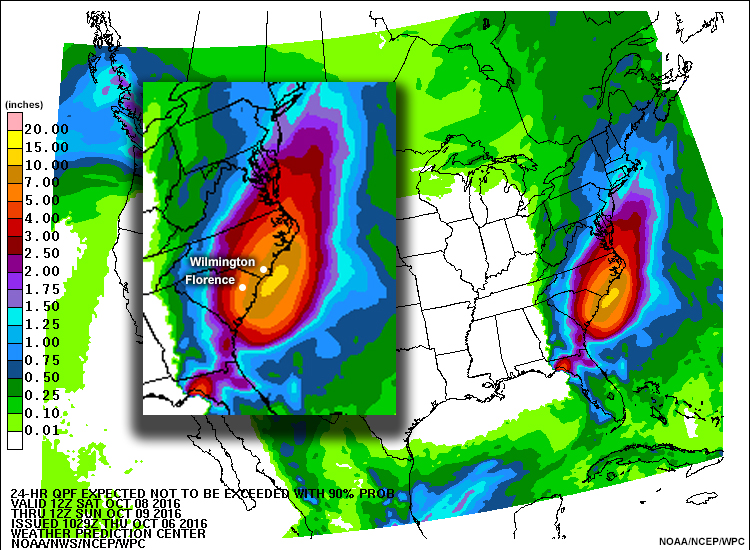
Question
Based on the PQPF’s reasonable worst-case scenario, what is the potential precipitation amount and chance of not being exceeded for Wilmington, NC and Florence, SC? Use the pull-down menu to choose the best answer.
The correct answers are highlighted above.
Using WPC’s Rainfall Guidance Products » Hurricane Matthew » Communicate Precipitation Threat
Deterministic QPF
MPD Graphic
PQPF 10th Percentile
PQPF 50th Percentile
PQPF 90th Percentile
ERO
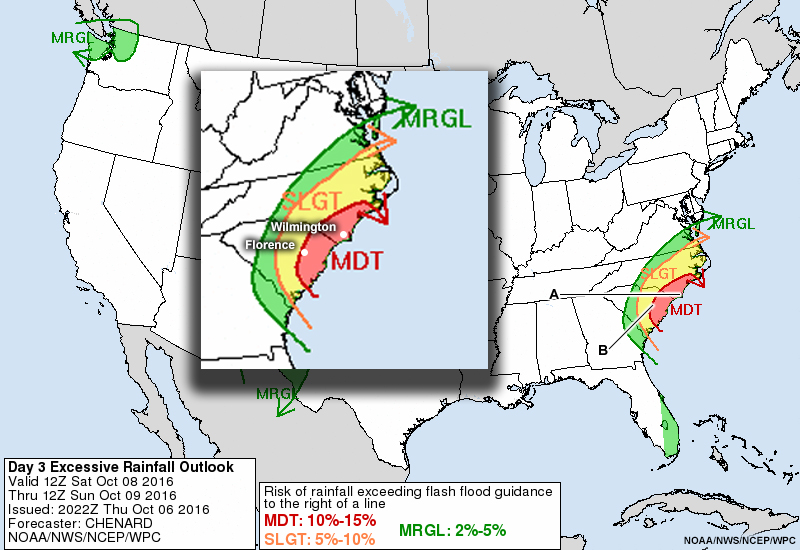
Question
How will you summarize the forecast precipitation amount and its probability of occurrence for points in and near Wilmington, North Carolina? Choose the best answer.
The correct answer is a.
The ERO shows a moderate risk of exceeding flash flood guidance for portions of North Carolina. The PQPF 90th percentile shows a potential rainfall of 7 to 10 inches at any given location, with a 10% chance of those values being exceeded. This represents the reasonable worst-case scenario for Wilmington. Options b, c, and d are incorrect because they wrongly assess the ERO and do not provide a range in potential rainfall for Wilmington.
Collaborate with WPC to Ensure Unified Message
Tropical cyclone incidents quickly escalate from local to state, regional, and national response. Yet, it is important that all weather messages be consistent regardless of level.
Within the NWS, a constant process of coordination and collaboration during a TC is required to accomplish this. Interactions need to happen between you and your neighboring local offices. Collaboration between your office and NOAA national centers, such as the WPC and NHC for rainfall amounts, storm surge, and wind guidance is important to make sure that everyone is communicating a consistent message. It is vital to collaborate with the RFC, especially as the event transitions into a hydrological event.
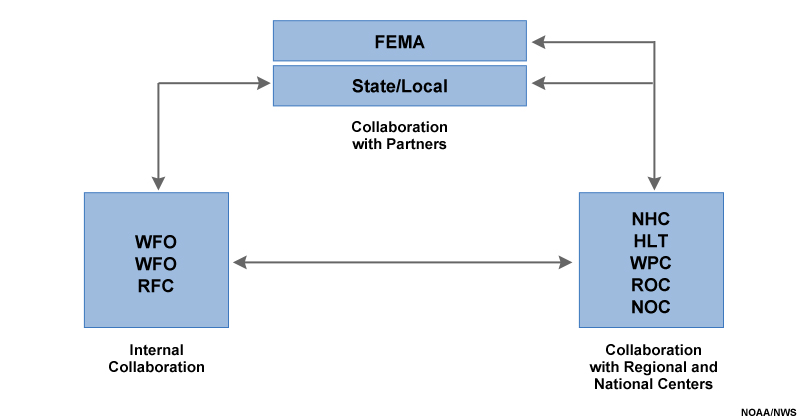
Collaboration and coordination between Weather Forecast Offices (WFO), National and Regional Operation Centers (NOC and ROC), Hurricane Liaison Team (HLT) and Decision-Makers.
Question
After completing your precipitation forecast for an approaching tropical cyclone, you notice that WPC’s forecast differs from yours and the neighboring WFO’s forecast. What will you do? Choose the best answer.
The correct answer is c.
It is important to initiate a call with the WFO and WPC right away. This will ensure that a unified precipitation message will reach local, state, and federal partners. All other options rely on someone else noticing and fixing the issue. In the meantime, clients and partners will wonder which forecast to trust and use in their processes.
Summary
Excessive rainfall from TCs can cause extensive flooding and threaten the lives of people living in the affected area. Correct interpretation of WPC’s TC rainfall products is crucial for the accurate and timely issuance of forecasts.
This lesson introduced WPC rainfall guidance products that can be used to forecast the precipitation threat associated with TCs. Learners interpreted the deterministic QPF graphic and associated discussion, the probabilistic QPF (PQPF), and the Excessive Rainfall Outlook (ERO) in the context of Hurricane Matthew. The lesson also highlighted the different interpretations of probabilistic products from WPC and NHC. It concluded with the importance of collaboration with WPC and other national centers in order to ensure a unified message to NWS partners and the public.
You have reached the end of the lesson. Please complete the quiz and share your feedback with us via the user survey.
Contributors
COMET Sponsors
MetEd and the COMET® Program are a part of the University Corporation for Atmospheric Research's (UCAR's) Community Programs (UCP) and are sponsored by NOAA's National Weather Service (NWS), with additional funding by:
- Bureau of Meteorology of Australia (BoM)
- Bureau of Reclamation, United States Department of the Interior
- European Organisation for the Exploitation of Meteorological Satellites (EUMETSAT)
- Meteorological Service of Canada (MSC)
- NOAA's National Environmental Satellite, Data and Information Service (NESDIS)
- NOAA's National Geodetic Survey (NGS)
- National Science Foundation (NSF)
- Naval Meteorology and Oceanography Command (NMOC)
- U.S. Army Corps of Engineers (USACE)
To learn more about us, please visit the COMET website.
Project Contributors
Program Manager
- Dr. Elizabeth Mulvihill Page — UCAR/COMET
Project Lead
- Tsvetomir Ross-Lazarov — UCAR/COMET
Instructional Design
- Tsvetomir Ross-Lazarov — UCAR/COMET
Principal Science Advisors
- Patrick Burke - Quantitative Precipitation Forecasts Team Leader, Weather Prediction Center
- Daniel Brown, Senior Hurricane Specialist/Warning Coordination Meteorologist, National Weather Service, National Hurricane Center
- David Roth - Meteorologist/Forecaster, Weather Prediction Center
- Vanessa Vincente - Meteorologist, UCAR/COMET
Science Advisors
- Lance Wood - Science and Operations Officer, National Weather Service Houston/Galveston
- Mike Brennan, Hurricane Specialist, National Weather Service, National Hurricane Center
- Dr. Pablo Santos, Meteorologist In Charge, National Weather Service
- Andy Devanas, Science and Operations Officer, National Weather Service
- David Sharp, Science and Operations Officer, National Weather Service
- Shannon White, AWIPS Instructor with the Forecast Decision Training Branch
- Matthew Moreland, Emergency Response Meteorologist, National Weather Service
- John Koch, Deputy Chief, Eastern Region Headquarters, Meteorological Services Division
- Jennifer McNatt, Emergency Response Specialist, Southern Region Headquarters,
National Weather Service
Graphics/Animations
- Steve Deyo — UCAR/COMET
Multimedia Authoring/Interface Design
- Gary Pacheco — UCAR/COMET
Audio/Video Editing/Production
COMET Staff, July 2017
Director's Office
- Dr. Rich Jeffries, Director
- Dr. Greg Byrd, Deputy Director
Business Administration
- Dr. Elizabeth Mulvihill Page, Assistant Director of Operations and Administration
- Lorrie Alberta, Administrator
- Tara Torres, Program Coordinator
IT Services and Production Services
- Tim Alberta, Assistant Director of IT and Production
- Bob Bubon, Systems Administrator
- Steve Deyo, Graphic and 3D Designer
- Dolores Kiessling, Software Engineer
- Gary Pacheco, Web Designer and Developer
- Sylvia Quesada, Production Assistant
- Joey Rener, Software Engineer
- Malte Winkler, Software Engineer
International Program
- Paul Kucera, Project Manager
- Rosario Alfaro Ocampo, Translator/Meteorologist
- Bruce Muller, Project Manager
- David Russi, Spanish Translations
- Martin Steinson, Project Manager
Instructional Services
- Dr. Alan Bol, Scientist/Instructional Designer
- Lon Goldstein, Instructional Designer
- Bryan Guarente, Instructional Designer/Meteorologist
- Tsvetomir Ross-Lazarov, Instructional Designer
- Marianne Weingroff, Instructional Designer
Science Group
- Dr. William Bua, Meteorologist
- Patrick Dills, Meteorologist
- Lindsay Johnson, Student Assistant
- Matthew Kelsch, Hydrometeorologist
- Andrea Smith, Meteorologist
- Amy Stevermer, Meteorologist
- Vanessa Vincente, Meteorologist